
From 2016 to 2017, the U.S. economy improved in several key metrics. The median household income increased by more than $1,500, unemployment dropped from 4.9% to 4.4%, and the poverty rate fell from 14.0% to 13.4%.
While this is good news, the effects weren’t felt equally across all 50 states, and much of the gains in median household income went to households that were already wealthy. Income inequality in the U.S. remains high and incomes vary dramatically at the state level as well. The typical household in the wealthiest state earns over $37,000 more each year than the typical household in the poorest state.
The South holds a higher-than-average concentration of the poorest states in the country. Many of the wealthiest are coastal states in the West, Mid-Atlantic, and Northeast regions. Both states outside of the lower 48 — Alaska and Hawaii — are among the 10 richest states.
24/7 Wall St. ranked all 50 states according to the newly-released median household income figures from the U.S. Census Bureau’s 2017 American Community Survey.
Click here to see America’s Richest and Poorest States.
Click here to see our detailed findings and methodology

50. West Virginia
> Median household income: $43,469
> Population: 1,815,857 (13th lowest)
> 2017 unemployment rate: 5.2% (3rd highest)
> Poverty rate: 19.1% (4th highest)
West Virginia has the lowest median annual household income of any state. An estimated 20.2% of West Virginia adults hold at least a bachelor’s degree — the lowest rate of any state by more than a full percentage point. Nationwide, some 32.0% of adults are college graduates. Those with college degrees are more likely to work in a higher-paying job in a highly specialized career field than those without. West Virginia also ranks among the worst in a number of other key socioeconomic indicators, including unemployment rate, poverty rate, and the percentage of families who earn less than $10,000. The U.S. economy continues to improve, but West Virginia has not benefitted as much as the majority of states from this improvement. It was one of a handful of states in which the median household income did not increase between 2013 and 2017.
[in-text-ad]

49. Mississippi
> Median household income: $43,529
> Population: 2,984,100 (17th lowest)
> 2017 unemployment rate: 5.1% (4th highest)
> Poverty rate: 19.8% (the highest)
Nearly one out of every five people in Mississippi live in poverty. At 19.8%, no other state has a higher poverty rate. Like many of America’s other least wealthy states, Mississippi’s unemployment rate is well above the U.S. unemployment rate. Further, employed state residents are more likely than workers in most other states to be employed in the education or manufacturing industries, which tend to be lower paying. Mississippi workers also are some of the least likely to be employed in the higher paying information and finance sectors. In 2013, Mississippi’s median household income was the lowest in the country, but it rose by more than $3,300 by 2017, putting it ahead of West Virginia’s.

48. Arkansas
> Median household income: $45,869
> Population: 3,004,279 (19th lowest)
> 2017 unemployment rate: 3.7% (18th lowest)
> Poverty rate: 16.4% (7th highest)
Arkansas is the only state with a median household income below $50,000 and a relatively low unemployment rate. Just 3.7% of the state’s labor force is unemployed, compared to the 4.4% national unemployment rate. As the jobless earn no income, high unemployment can significantly drive down median household incomes. Just 23.4% of Arkansas adults have a four-year college degree, one of the lowest shares in the country. Poverty and lower educational attainment are cyclically related. Those living in poverty often cannot afford a higher education. At the same time, lower education levels prevent many from exiting poverty as higher-paying jobs often require a college degree.

47. Louisiana
> Median household income: $46,145
> Population: 4,684,333 (25th highest)
> 2017 unemployment rate: 5.1% (5th highest)
> Poverty rate: 19.7% (2nd highest)
Louisiana is tied with New Mexico for the second highest poverty rate of all states, at 19.7%. The state also has the second highest share of households that live in extreme poverty. Some 10.3% of households earn less than $10,000 annually, as compared to 6.5% of U.S. households. Louisiana has one of the highest state unemployment rates at 5.1%. The national unemployment rate is 4.4%. The state’s relatively high share of workers without an income helps explain why such a high share of residents and households live in poverty and extreme poverty.
[in-text-ad-2]

46. New Mexico
> Median household income: $46,744
> Population: 2,088,070 (15th lowest)
> 2017 unemployment rate: 6.2% (2nd highest)
> Poverty rate: 19.7% (3rd highest)
New Mexico’s median household income of $46,744 a year is fifth lowest of all states. The state’s unemployment rate is one of the highest nationwide. A relatively large share of New Mexico households live on very little income. Some 9.7% of households in the state report annual incomes of less than $10,000 a year. New Mexico is one of just six states that did not experience a significant increase in median household income over the past five years.
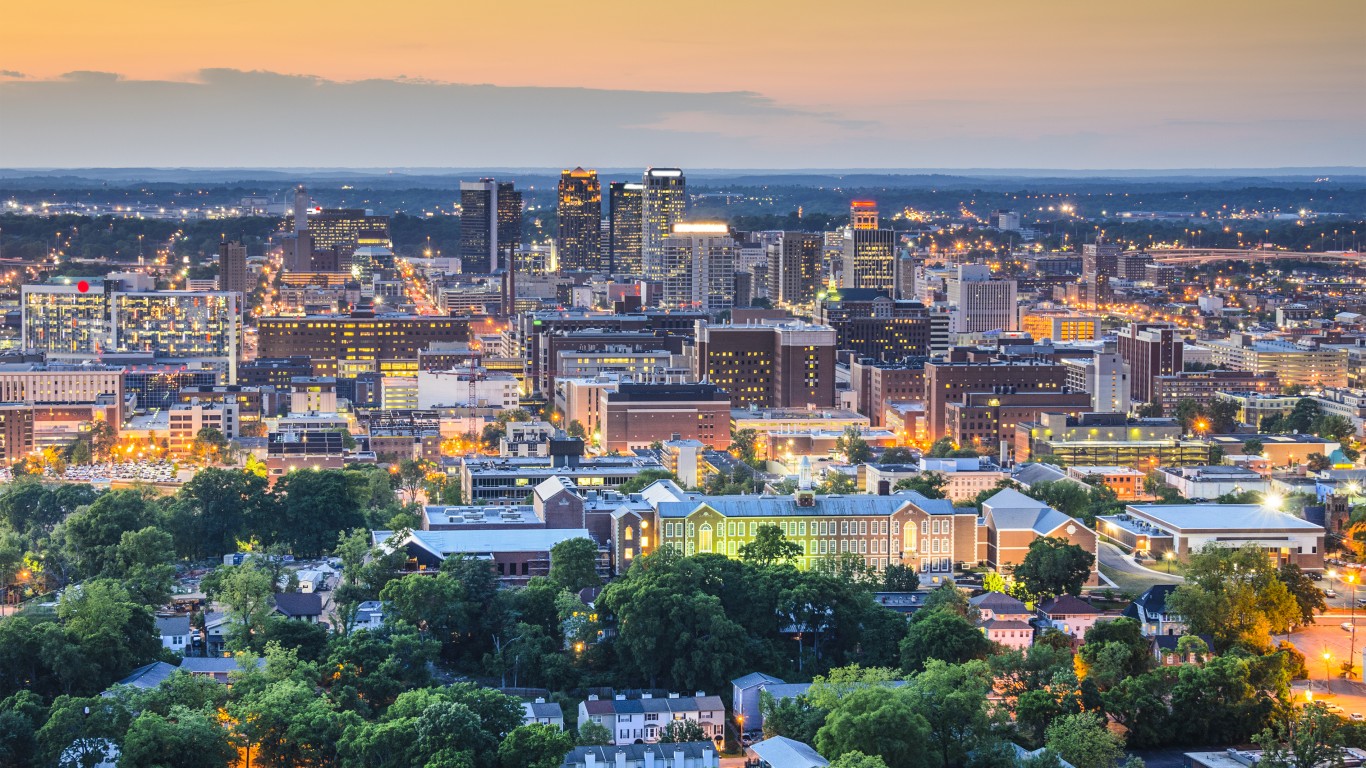
45. Alabama
> Median household income: $48,123
> Population: 4,874,747 (24th highest)
> 2017 unemployment rate: 4.4% (22nd highest)
> Poverty rate: 16.9% (6th highest)
There are signs that finances are improving for Alabama residents. From 2013 to 2017, the state’s median household income increased by more than $3,000. Despite a low level of unemployment, Alabama’s median household income is still one of the lowest in the country. This may be at least partially due to the fact that many workers in the state are employed in low-paying industries. Some 14.3% of Alabama workers work in the manufacturing industry, which typically does not pay well. The state also had one of the lowest shares of workers — 1.4% — employed in the higher-paying information industry.
[in-text-ad]

44. Kentucky
> Median household income: $48,375
> Population: 4,454,189 (25th lowest)
> 2017 unemployment rate: 4.9% (9th highest)
> Poverty rate: 17.2% (5th highest)
Kentucky’s median household income of $48,375 a year, which is seventh lowest among states, is likely hampered by relatively low educational attainment rates in the state. Just 86.3% of Kentucky adults graduated high school, and just 24.0% have at least a bachelor’s degree — both among the lowest rates in the country. Higher levels of education can open the door to better job opportunities.

43. Oklahoma
> Median household income: $50,051
> Population: 3,930,864 (23rd lowest)
> 2017 unemployment rate: 4.3% (23rd highest)
> Poverty rate: 15.8% (8th highest)
Property values in an area can be a good indicator of the strength of a regional economy. Higher home values imply greater demand and show residents are able to afford higher prices. Home prices in Oklahoma are among the lowest of any state. The typical home in the state is valued at just $137,400, more than $80,000 below the U.S. median. Incomes have remained relatively stagnant in Oklahoma over the past year.

42. South Carolina
> Median household income: $50,570
> Population: 5,024,369 (23rd highest)
> 2017 unemployment rate: 4.3% (24th highest)
> Poverty rate: 15.4% (9th highest)
South Carolina’s median household income of $50,570 a year is nearly $10,000 less than the U.S. median. In addition to generally having lower incomes, South Carolina also has a relatively high share of households living in extreme poverty. Among South Carolina households, 8.1% report incomes of less than $10,000, compared to 6.5% of U.S. households.
[in-text-ad-2]

41. Tennessee
> Median household income: $51,340
> Population: 6,715,984 (16th highest)
> 2017 unemployment rate: 3.7% (17th lowest)
> Poverty rate: 15.0% (10th highest)
Tennessee rounds out the 10 states with the lowest median household incomes. Tennessee had the 8th lowest median household income in 2016. But state income increased significantly over the next year, and as a result South Carolina’s ranking improved.
A relatively high share of workers in the state is employed in lower-paying, blue collar industries. The state has among the highest shares of people working in manufacturing, transportation and warehousing, and utilities. This may also explain why Tennessee’s median household income is one of the lowest, despite also having one of the lower unemployment rates. Some 3.7% of the state’s labor force is out of work — a full percentage point improvement from the previous year.
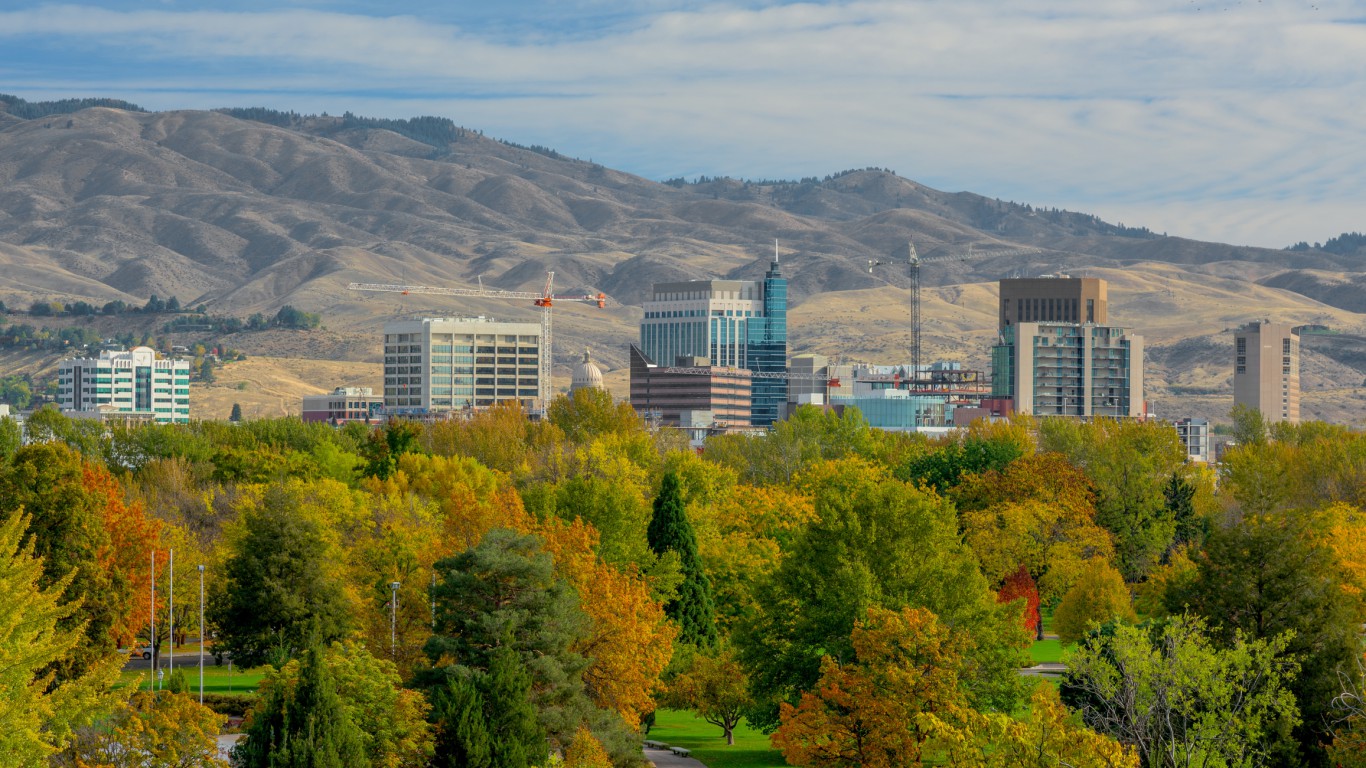
40. Idaho
> Median household income: $52,225
> Population: 1,716,943 (12th lowest)
> 2017 unemployment rate: 3.2% (9th lowest)
> Poverty rate: 12.8% (25th lowest)
Idaho has one of the lowest shares of wealthy households in the country. Just 3.3% of Idaho households earn $200,000 or more — less than half of the national share. There is, of course, more than route to success and wealth, but those who graduate college are more likely to earn high wages than those who do not. Just 26.8% of Idaho adults have earned at least a bachelor’s degree as compared to 32.0% of Americans adults.
[in-text-ad]
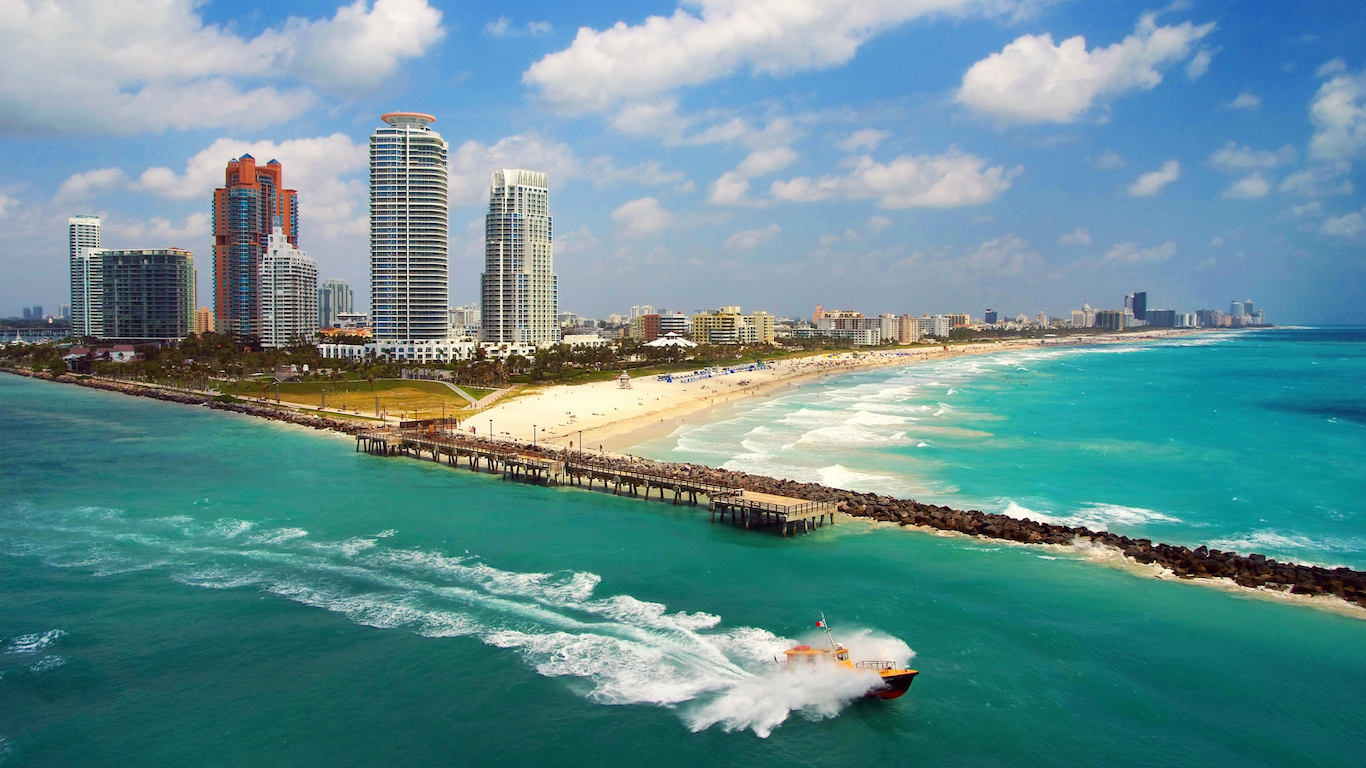
39. Florida
> Median household income: $52,594
> Population: 20,984,400 (3rd highest)
> 2017 unemployment rate: 4.2% (25th lowest)
> Poverty rate: 14.0% (17th highest)
Florida’s median annual household income of $52,594 is one of the lowest in the country and well below the U.S. median of $60,336. With nearly 21 million residents, Florida is one of the most populous states. A high share of Sunshine State households need help buying food. Some 13.6% of households in the state rely on Supplemental Nutrition Assistance Program — or SNAP — benefits, the program known formerly as food stamps — to help buy nutritious food. Some 14.0% of Florida residents live in poverty, and 6.9% of households earn less than $10,000, both among the highest rates of all states.

38. North Carolina
> Median household income: $52,752
> Population: 10,273,419 (9th highest)
> 2017 unemployment rate: 4.6% (17th highest)
> Poverty rate: 14.7% (13th highest)
Some 14.7% of North Carolina residents live below the poverty line, one of the higher poverty rates in the country. A large portion of those residents live on less than $10,000 per year. North Carolina households are more likely to turn to SNAP to help pay for food than those in most other states. North Carolina, like many other southern states, has below-average college and high school educational attainment rates, which may contribute to the state’s relatively low income, as more highly educated workers are more likely to work in high-paying jobs.

37. Montana
> Median household income: $53,386
> Population: 1,050,493 (7th lowest)
> 2017 unemployment rate: 4.0% (21st lowest)
> Poverty rate: 12.5% (23rd lowest)
Nationwide, there is a correlation between high levels of educational attainment and high income, as better-educated residents are more qualified for higher paying jobs that require more specialization. However, that is not the case in Montana. Though Montana adults are slightly more likely to have graduated from college than the average American, and the state’s high school attainment rate of 93.0% is the third highest in the country, the state’s median household income is 14th lowest. Montana adults are among the most likely of workers in all states to work in industries that tend to have blue collar jobs like agriculture, forestry, mining, and construction. These jobs often do not pay as well as white collar professions.
[in-text-ad-2]

36. Missouri
> Median household income: $53,578
> Population: 6,113,532 (18th highest)
> 2017 unemployment rate: 3.8% (20th lowest)
> Poverty rate: 13.4% (21st highest)
Missouri’s median household income increased by nearly $900 from 2016 to 2017 — not as much as the national increase of over $1,500 but enough to keep the Show Me state ranked 36th by median household income as it was the previous year. Missouri has a relatively low unemployment rate at 3.8% and the state’s poverty rate of 13.4% is exactly in line with the U.S. poverty rate.
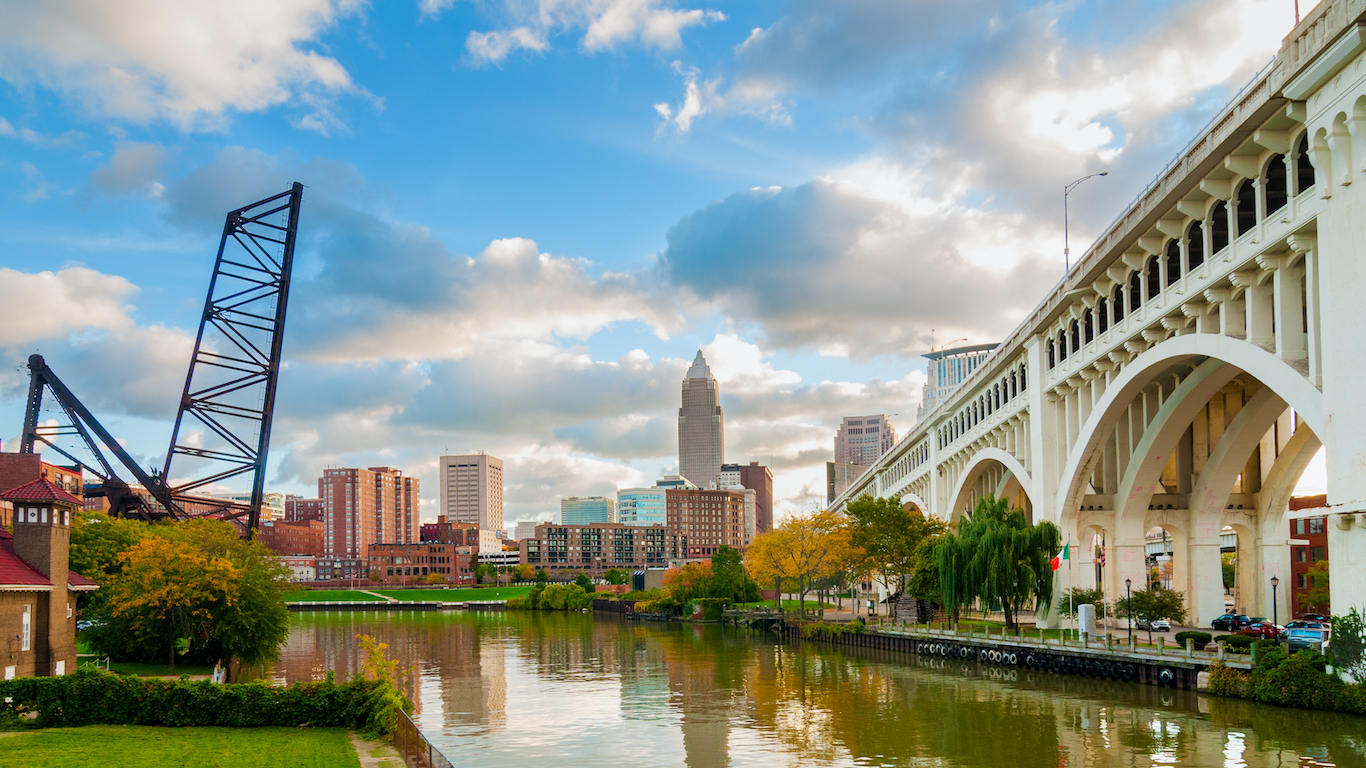
35. Ohio
> Median household income: $54,021
> Population: 11,658,609 (7th highest)
> 2017 unemployment rate: 5.0% (6th highest)
> Poverty rate: 14.0% (18th highest)
Almost every state’s unemployment rate improved in 2017 compared to 2016, but not Ohio’s. The state’s unemployment rate stayed at 5.0%, now the sixth highest unemployment rate of all states. Ohio’s median household income has not increased as quickly as most other states over the past several year either. As a result, the state’s rank by median household income dropped from 32nd in 2013 to 35th in 2017.
[in-text-ad]
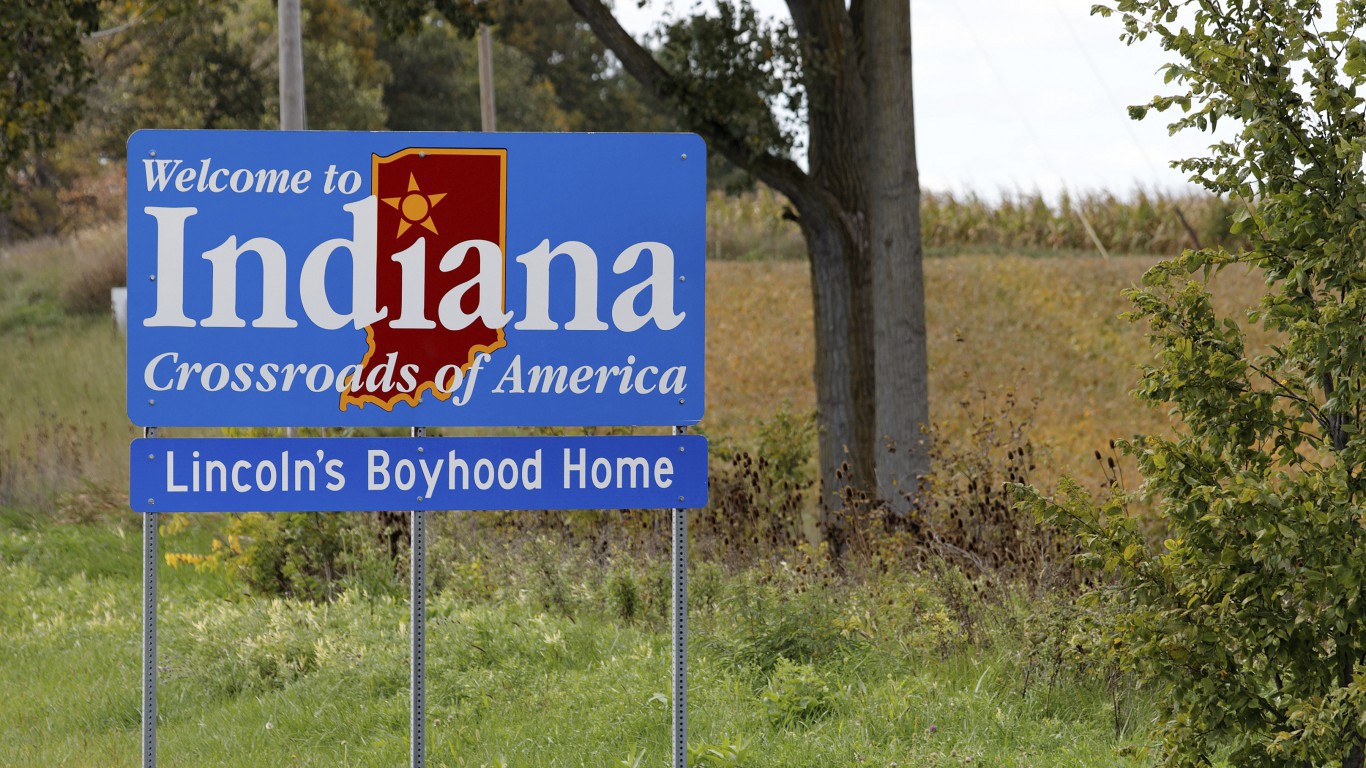
34. Indiana
> Median household income: $54,181
> Population: 6,666,818 (17th highest)
> 2017 unemployment rate: 3.5% (14th lowest)
> Poverty rate: 13.5% (20th highest)
Indiana has one of the lowest college attainment rates in the country. Just 26.8% of adults in the state have at least a bachelor’s degree, as compared to 32.0% of American adults overall. Indiana has one of the lowest median home values in the country at $141,100 — more than $75,000 below the U.S. median. Low home values can often indicate residents are unable to afford large long-term purchases.

33. Michigan
> Median household income: $54,909
> Population: 9,962,311 (10th highest)
> 2017 unemployment rate: 4.6% (18th highest)
> Poverty rate: 14.2% (15th highest)
Michigan has one of the higher high school attainment rates among states at more than 90%. Yet the state also has one of the lower bachelor’s degree attainment rates. Some 29.1% of Michigan adults have a four year college degree, whereas 32.0% of American adults do. Those with college degrees are more likely to be employed in a high-paying job. Many Michigan residents work in manufacturing, which typically does not pay high wages. Some 18.9% of state workers are employed in the manufacturing industry — the highest rate than any other state.

32. Georgia
> Median household income: $56,183
> Population: 10,429,379 (8th highest)
> 2017 unemployment rate: 4.7% (14th highest)
> Poverty rate: 14.9% (11th highest)
Many key indicators point to an improvement in Georgia’s economy. The southern state no longer ranks in the top 10 in terms of poverty rate or the rate of households in extreme poverty as it did five years ago. Also, the state’s median household income rose by $5,757 from 2013 to 2017 — slightly ahead the increase in median income nationwide.
[in-text-ad-2]

31. Maine
> Median household income: $56,277
> Population: 1,335,907 (9th lowest)
> 2017 unemployment rate: 3.3% (10th lowest)
> Poverty rate: 11.1% (16th lowest)
Maine is one of the most highly educated states in the country. Its 92.3% high school attainment rate is among the top 10 in the country and its 32.1% bachelor’s degree attainment rate is slightly above the U.S. rate. Higher levels of education can make a person a more attractive candidate for employers. Though Maine has one of the lowest unemployment rates in the country at 3.3%, incomes may be constrained by the fact that many Maine workers are employed in lower-paying industries. The shares of workers in the state in construction, retail trade, and education — three industries that do not typically pay high salaries — are among the highest of all states.

30. Kansas
> Median household income: $56,422
> Population: 2,913,123 (16th lowest)
> 2017 unemployment rate: 3.6% (15th lowest)
> Poverty rate: 11.9% (21st lowest)
The median household income in Kansas did not significantly increase between 2016 and 2017, as half of states did in that time. The slow income growth dropped Kansas from having the 28th highest median household income to having the 30th highest income. Kansas also has one of the lowest median home values in the country at $150,600. The median home in the United States is worth $217,600.
[in-text-ad]

29. South Dakota
> Median household income: $56,521
> Population: 869,666 (5th lowest)
> 2017 unemployment rate: 3.3% (12th lowest)
> Poverty rate: 13.0% (24th highest)
South Dakota had one of the lower unemployment rates in the country 2017, at 3.3%. In 2016, however, the state’s unemployment rate was even lower, at 3.0%, making the state one of just three where unemployment increased last year. South Dakota’s median household income has been consistent relative to the other 49 states — it ranked 29th in median household income five years ago, just as it does now.

28. Arizona
> Median household income: $56,581
> Population: 7,016,270 (14th highest)
> 2017 unemployment rate: 4.9% (10th highest)
> Poverty rate: 14.9% (12th highest)
Arizona’s 2017 median household income of $56,581 is more than $1,800 higher compared to its income in 2016. The increase is higher than the increase in the U.S. median household income of $1,516. The state’s poverty rate dropped by 1.5 percentage points to 14.9%. While Arizona still has one of the higher poverty rates in the country, the decline was the second steepest decline nationwide after Idaho.

27. Vermont
> Median household income: $57,513
> Population: 623,657 (2nd lowest)
> 2017 unemployment rate: 3.0% (6th lowest)
> Poverty rate: 11.3% (19th lowest)
In 2016, Vermont had the 20th highest median annual household income at $58,775. But the state’s median dropped by more than $1,200 in 2017, knocking Vermont seven spots down the list to 27. States with higher educational attainment rates tend to have higher incomes, but Vermont is a bit of an outlier, as it has the seventh best bachelor’s degree attainment rate at 38.3% yet it does not have one of the higher median household incomes.
[in-text-ad-2]

26. Nevada
> Median household income: $58,003
> Population: 2,998,039 (18th lowest)
> 2017 unemployment rate: 5.0% (7th highest)
> Poverty rate: 13.0% (25th highest)
Nevada has one of the highest unemployment rates in the country, likely hampering the state’s median household income. It also has one of the lowest bachelor’s degree attainment rates, at 24.9%. People with high levels of education are more likely to be able to find a high paying job as they are more qualified for certain positions. Nevada is the home of America’s playground, Las Vegas. As such, it has the highest rate of workers in the relatively low paying arts, entertainment, and recreation, and accommodation and food services industry — nearly a quarter of all Nevada workers.
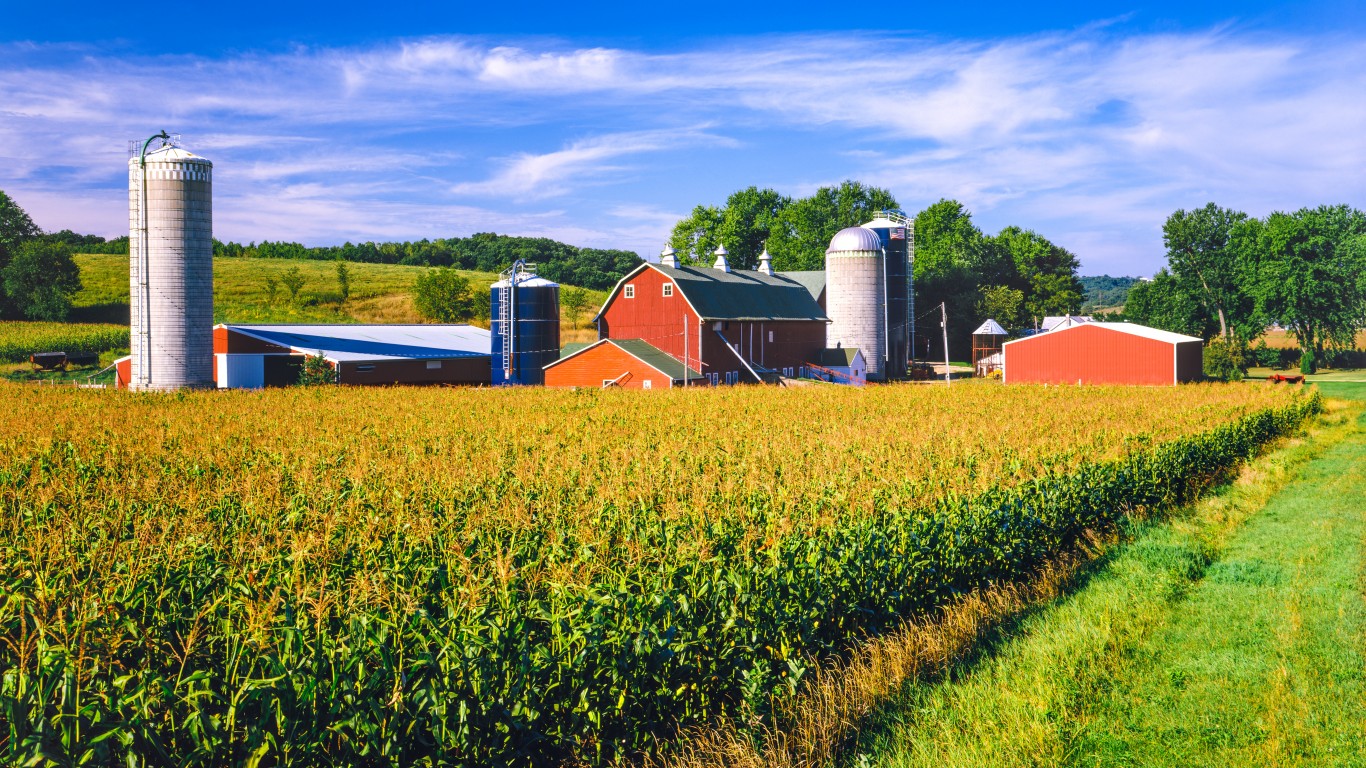
25. Iowa
> Median household income: $58,570
> Population: 3,145,711 (21st lowest)
> 2017 unemployment rate: 3.1% (7th lowest)
> Poverty rate: 10.7% (12th lowest)
Iowa’s median household income of $58,570 ranks roughly in the middle among states, despite having one of the lowest unemployment rates in the country. Just 3.1% of the state’s labor force is not employed. Iowa has among the highest shares of workers in the agriculture, manufacturing, and retail trade industries, which tend to be relatively low-paying for many of the workers in those fields.
[in-text-ad]

24. Pennsylvania
> Median household income: $59,195
> Population: 12,805,537 (5th highest)
> 2017 unemployment rate: 4.9% (11th highest)
> Poverty rate: 12.5% (22nd lowest)
Pennsylvania’s median household income was $1,100 higher in 2017 compared to 2016. This was a smaller increase than the increase in the U.S. median household income, which was $1,516. The state also continues to have one of the higher unemployment rates in the country, at 4.9%. As the labor force has a more difficult time finding work than in most other states, some households are unable to earn wages, depressing the state’s median household income.

23. Texas
> Median household income: $59,206
> Population: 28,304,596 (2nd highest)
> 2017 unemployment rate: 4.3% (25th highest)
> Poverty rate: 14.7% (14th highest)
The Texas median annual household income of $59,206 is higher than most states, but still not quite as high as the U.S. median of $60,336. Many Texans may not qualify for higher skilled jobs, as the state has the second lowest high school attainment rate in the country at 83.6%. Texas workers are among the most likely to work in jobs that do not require high levels of education, such as construction.

22. Wisconsin
> Median household income: $59,305
> Population: 5,795,483 (20th highest)
> 2017 unemployment rate: 3.3% (11th lowest)
> Poverty rate: 11.3% (18th lowest)
Wisconsin continues to have one of the highest high school attainment rates in the country, improving from 90.9% of residents 25 or older in 2013 to 92.4% of adults in 2017 — the seventh highest in the country. In comparison, 88.0% of American adults have a high school diploma. This relatively high education rate means that a higher share of Wisconsin’s labor force is likely to obtain higher paying jobs. Wisconsin’s 11.3% poverty rate is more than 2 percentage points below the U.S. rate.
[in-text-ad-2]

21. Nebraska
> Median household income: $59,970
> Population: 1,920,076 (14th lowest)
> 2017 unemployment rate: 2.9% (5th lowest)
> Poverty rate: 10.8% (13th lowest)
A small percentage of Nebraska’s labor force, 2.9%, is looking for work, one of the smallest unemployment rates in the country. Such low unemployment is a sign of a healthy state economy, as is the state’s improving incomes. Nebraska’s median household income increased $1,961 from 2016 to 2017, a larger increase than all but a handful of states.

20. Oregon
> Median household income: $60,212
> Population: 4,142,776 (24th lowest)
> 2017 unemployment rate: 4.1% (23rd lowest)
> Poverty rate: 13.2% (23rd highest)
Oregon has one of the highest median home values in the country at $319,200 — more than $100,000 above the U.S. median home value. Higher home values can often be a sign that people are confident in their financial future, as they are willing to take on costly long-term purchases, such as buying a house. Oregon adults tend to be better educated than those in most other states, with a 33.7% bachelor’s degree attainment rate. This high level of education makes many state residents more likely to earn higher wages.
[in-text-ad]

19. Wyoming
> Median household income: $60,434
> Population: 579,315 (the lowest)
> 2017 unemployment rate: 4.2% (24th lowest)
> Poverty rate: 11.3% (17th lowest)
Wyoming is one of 19 states with a median household income higher than that of the U.S., which is $60,336. The state’s median household income remained virtually unchanged from 2016 to 2017. During that same time, there was a notable uptick in the percentage of Wyoming households living in extreme poverty. In 2016, just 5.1% of Wyoming households lived on less than $10,000 per year, but that figure increased to 6.2% in 2017. For context, the percentage of U.S. households in extreme poverty dropped from 6.6% to 6.5% in that same timespan.

18. North Dakota
> Median household income: $61,843
> Population: 755,393 (4th lowest)
> 2017 unemployment rate: 2.6% (2nd lowest)
> Poverty rate: 10.3% (9th lowest)
North Dakota has one of the best high school attainment rates in the country at 92.9%. A high school diploma can make a person eligible for a number of jobs that they would not otherwise be a good candidate for. Higher high school attainment rates can also be correlated with low unemployment rates. North Dakota has the second lowest unemployment rate in the country at 2.6%. Only Hawaii has a lower share of its labor force out of work.

17. Delaware
> Median household income: $62,852
> Population: 961,939 (6th lowest)
> 2017 unemployment rate: 4.6% (19th highest)
> Poverty rate: 13.6% (19th highest)
Unlike almost all other states, the unemployment rate in Delaware did not decrease from 2016 to 2017, when the U.S. unemployment rate as a whole dropped 0.5%. During that same time period, Delaware’s median household income did not grow significantly, as opposed to many other higher income states. As a result, Delaware fell two spots on this list from 15th to 17th.
[in-text-ad-2]

16. Illinois
> Median household income: $62,992
> Population: 12,802,023 (6th highest)
> 2017 unemployment rate: 5.0% (8th highest)
> Poverty rate: 12.6% (24th lowest)
Despite having a high median household income compared to other states, Illinois also has one of the highest unemployment rates in the country. Some 5.0% of the state’s labor force is out of work, driving down the state’s median household income, as an above average number of people in the labor force are unable to find jobs. Chicago is Illinois’ largest city and one of the country’s major hubs for business. This may be a reason why an outsized share of Illinois households — 7.5% — earn more than $200,000.

15. Rhode Island
> Median household income: $63,870
> Population: 1,059,639 (8th lowest)
> 2017 unemployment rate: 4.5% (21st highest)
> Poverty rate: 11.6% (20th lowest)
Rhode Island’s economy is performing well by a number of key financial indicators. The state’s median household income increased more than $2,400 over the past year — a greater increase than all but a handful of other states. Rhode Island also had a 1.2 percentage point decline in its poverty rate over the same time, while the U.S. poverty rate dropped 0.6 percentage points.
[in-text-ad]

14. New York
> Median household income: $64,894
> Population: 19,849,399 (4th highest)
> 2017 unemployment rate: 4.7% (15th highest)
> Poverty rate: 14.1% (16th highest)
New York has one of the higher median household incomes in the country at $64,894. But it does not seem that the relatively high median income translates to high wages for all workers. Some 14.1% of people are in poverty, above the U.S. rate. And while New York has the seventh highest share of households earning $200,000 or more at 9.8%, it also has one of the higher shares of households living on less than $10,000. Some 7.4% of households live in extreme poverty, above the 6.5% national rate.

13. Utah
> Median household income: $68,358
> Population: 3,101,833 (20th lowest)
> 2017 unemployment rate: 3.2% (8th lowest)
> Poverty rate: 9.7% (6th lowest)
Residents of Utah are among the least likely to live in poverty or extreme poverty, as compared to those in the other 49 states. The 9.7% poverty rate is lower than that of all but a handful of other states and the share of households in Utah that live on less than $10,000 — 4.2% — is the second lowest in the country. Utah residents can generally provide for their families as a very small share of them are unemployed. The state’s unemployment rate is 3.2%, slightly lower than it was the year before.
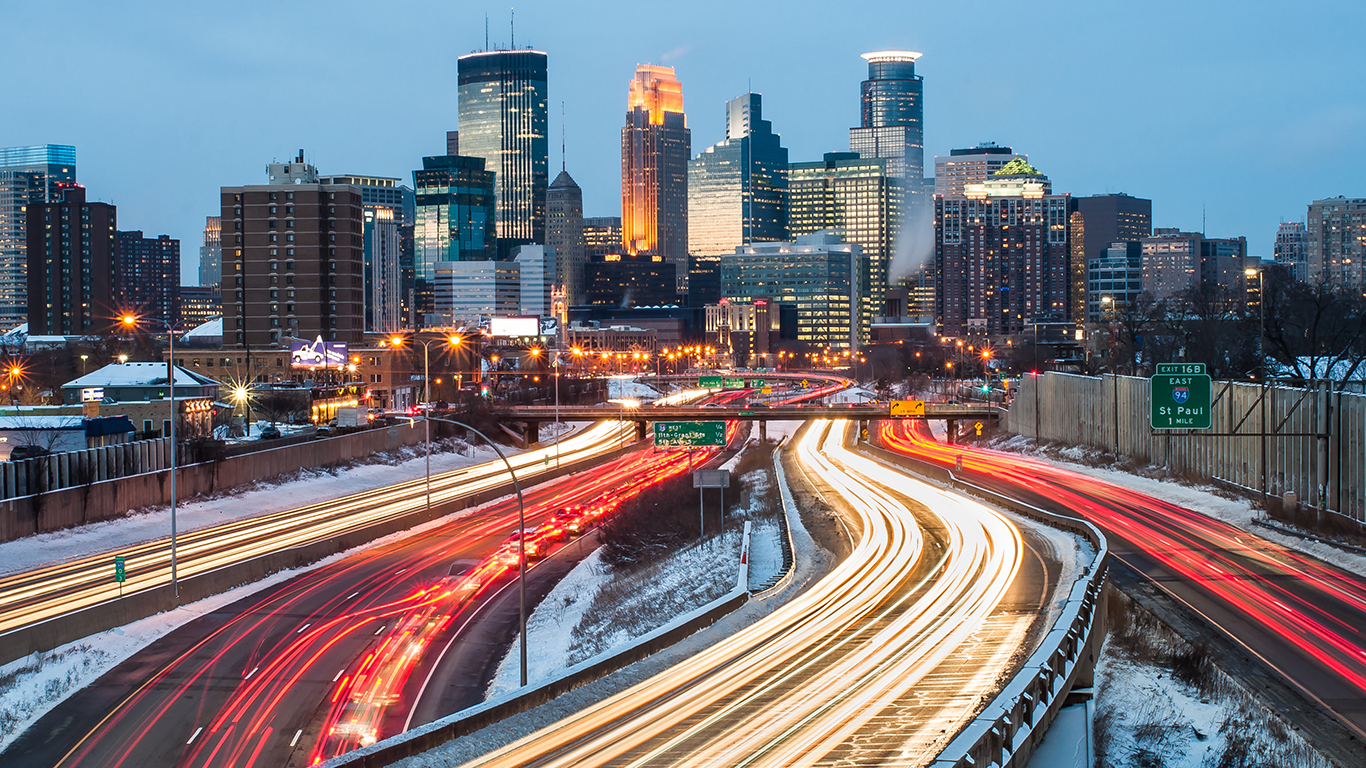
12. Minnesota
> Median household income: $68,388
> Population: 5,576,606 (22nd highest)
> 2017 unemployment rate: 3.5% (13th lowest)
> Poverty rate: 9.5% (4th lowest)
Minnesota is tied with New Hampshire for the highest high school attainment rate in the U.S. High school graduates are more likely to be qualified for more jobs and earn high wages than those who did not finish high school. In Minnesota, just 4.5% of households live on less than $10,000 per year, as compared to 6.5% of American households overall, one of the lowest such figures in the country.
[in-text-ad-2]

11. Colorado
> Median household income: $69,117
> Population: 5,607,154 (21st highest)
> 2017 unemployment rate: 2.8% (4th lowest)
> Poverty rate: 10.3% (8th lowest)
Colorado adults are among the best educated in the country. Some 41.2% of adults in the state have at least a bachelor’s degree, higher than all states except Massachusetts. This high degree of educational attainment ensures that a relatively large share of Colorado adults are good candidates for a wide array of jobs. Just 2.8% of Colorado’s labor force is unemployed, one of the lowest rates in the country. Colorado residents are also among the least likely to be impoverished.

10. Washington
> Median household income: $70,979
> Population: 7,405,743 (13th highest)
> 2017 unemployment rate: 4.8% (13th highest)
> Poverty rate: 11.0% (14th lowest)
Home values can often reveal how much of a financial commitment people in an area are able and willing to make. Washington’s median home value of $339,000 is the fifth highest in the country and more than $120,000 above the U.S. median. Having a lower unemployment rate is often a sign of a strong economy, as a greater share of the labor force is earning money and better able to support themselves and their families. Yet despite its high median income and low poverty rate, Washington has one of the higher unemployment rates in the country at 4.8%. The U.S. unemployment rate is 4.4%.
[in-text-ad]
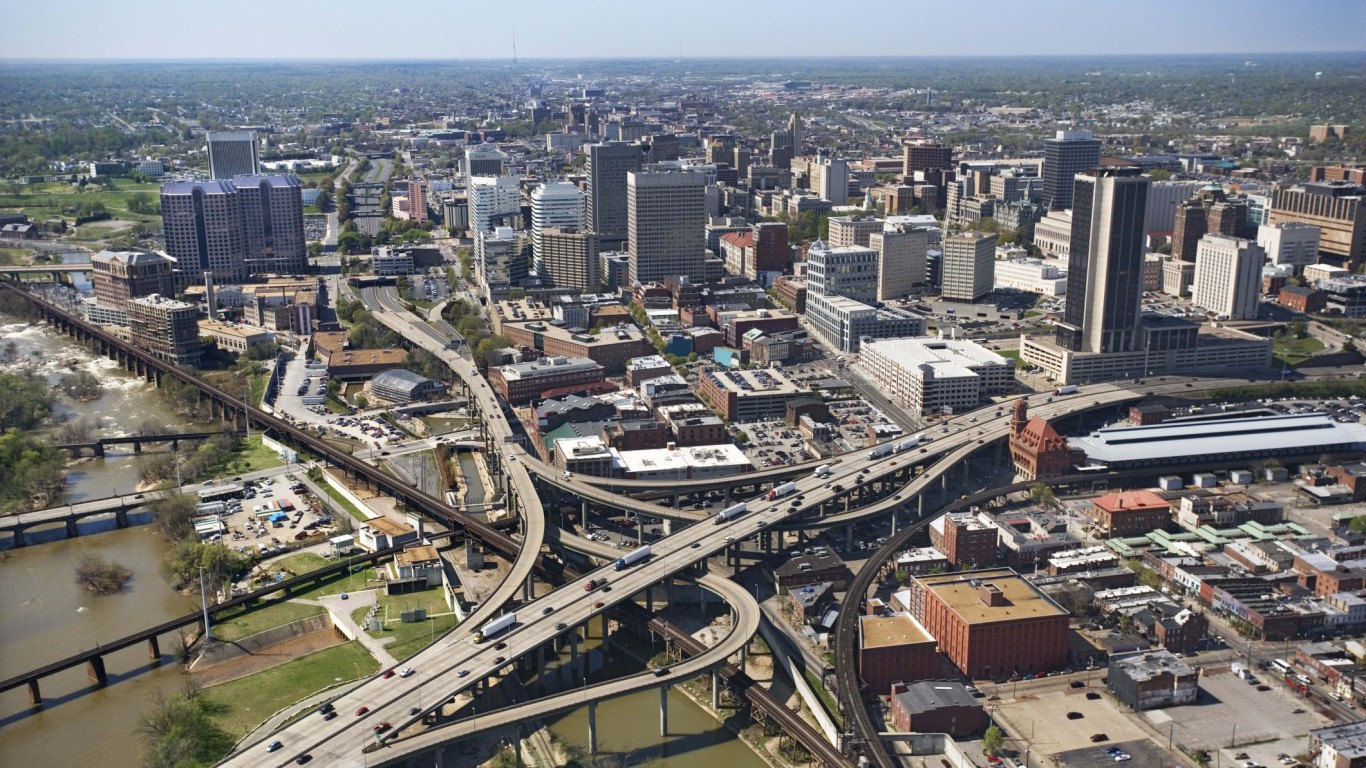
9. Virginia
> Median household income: $71,535
> Population: 8,470,020 (12th highest)
> 2017 unemployment rate: 3.8% (19th lowest)
> Poverty rate: 10.6% (11th lowest)
Virginia’s median household income increased nearly $2,000 to $71,535 over the past year, outpacing the growth of the U.S. median, which was just over $1,500. Virginia adults are among the most likely in the country to hold at least a bachelor’s degree, making them more qualified for high paying jobs and increasing their odds of making it into a lucrative industry. Some 38.7% of Virginia adults have a four-year college degree.

8. California
> Median household income: $71,805
> Population: 39,536,653 (the highest)
> 2017 unemployment rate: 4.8% (12th highest)
> Poverty rate: 13.3% (22nd highest)
Much of California’s reputation is built on two extremely lucrative industries: entertainment, which is centered around Los Angeles, and technology, with many companies located in and around Silicon Valley. The abundance of high paying jobs likely drives up the median household income in the Golden State. But this wealth does not extend to all Californians. The state’s unemployment and poverty rates are higher than most.

7. Alaska
> Median household income: $73,181
> Population: 739,795 (3rd lowest)
> 2017 unemployment rate: 7.2% (the highest)
> Poverty rate: 11.1% (15th lowest)
Though Alaska still has one of the highest median household incomes, several key economic indicators paint a dire picture of the state’s economy. The state is tied with South Dakota for the largest increase in unemployment rate at 0.3%. Alaska now has a 7.2% unemployment rate — the highest of any state. Alaska’s median household income dropped more than any other state from 2016 to 2017, and by a significant margin. The state’s $73,181 median is $4,722 less than it was the previous year. No other state experienced a drop above $1,300. In 2016, Alaska’s $77,903 median income was good for second among all states.
[in-text-ad-2]

6. New Hampshire
> Median household income: $73,381
> Population: 1,342,795 (10th lowest)
> 2017 unemployment rate: 2.7% (3rd lowest)
> Poverty rate: 7.7% (the lowest)
New Hampshire residents are among the most economically secure of any state. Just 7.7% of households in the state live in poverty, the lowest of all states. New Hampshire also has one of the lowest unemployment rates, meaning that almost all residents who look for work are able to find it and provide for their families. Adults with high school diplomas tend to be more attractive candidates for work than those without. New Hampshire is tied with Minnesota for the highest high school attainment rate in the U.S.

5. Connecticut
> Median household income: $74,168
> Population: 3,588,184 (22nd lowest)
> 2017 unemployment rate: 4.7% (16th highest)
> Poverty rate: 9.6% (5th lowest)
Connecticut is one of just a handful of states with a poverty rate under 10%, at 9.6%. Connecticut workers are more likely than those in almost all other states to work in high paying fields like information and finance. They are also much less likely to work in lower paying fields such as agriculture and transportation. Unlike many other very affluent states, the median household income in Connecticut did not increase significantly from 2016 to 2017.
[in-text-ad]

4. Massachusetts
> Median household income: $77,385
> Population: 6,859,819 (15th highest)
> 2017 unemployment rate: 3.7% (16th lowest)
> Poverty rate: 10.5% (10th lowest)
The home of Harvard, Massachusetts is the best educated state by a significant margin. Some 43.4% of adults in the state have at least a bachelor’s degree. Adults with at least a bachelor’s degree tend to be qualified for a wider range of careers — many of which pay higher salaries. Those with higher incomes and more disposable income can afford to plan for the future and provide a safety net like health insurance. Massachusetts has the lowest uninsured rate, 2.8%, of any state by a full percentage point.

3. Hawaii
> Median household income: $77,765
> Population: 1,427,538 (11th lowest)
> 2017 unemployment rate: 2.4% (the lowest)
> Poverty rate: 9.5% (3rd lowest)
Hawaii households are among the least likely to live in poverty and those in the state’s labor force are the least likely to be unemployed in the country. Some 17.3% of workers in the state are involved in the arts, entertainment, recreation, accommodation, and food service industries, as Hawaii is a popular vacation spot. The string of islands in the Pacific Ocean obviously have an economy that functions much differently than the other 49 states. Shipping goods to Hawaii can be expensive, so many items cost much more than in other states. Hawaii’s median home value is by far the highest in the country at $617,4000, more than $100,000 higher than the next highest state.
2. New Jersey
> Median household income: $80,088
> Population: 9,005,644 (11th highest)
> 2017 unemployment rate: 4.6% (20th highest)
> Poverty rate: 10.0% (7th lowest)
New Jersey households are more likely to be extremely wealthy than those in any other state. Some 13.0% of New Jersey households earn $200,000 or more, while just 1 in 10 people in the state live below the poverty line. Nearly 40% of New Jersey adults hold at least a bachelor’s degree, making them qualified to work in high paying, specialized industries. New Jersey workers are among the most likely to be employed in lucrative fields such as information, management, and finance.
[in-text-ad-2]

1. Maryland
> Median household income: $80,776
> Population: 6,052,177 (19th highest)
> 2017 unemployment rate: 4.1% (22nd lowest)
> Poverty rate: 9.3% (2nd lowest)
Though it did not have a significant increase in its median household income from 2016 to 2017, Maryland is still America’s richest state. No state has a higher median household income than Maryland’s $80,776. Maryland borders Washington D.C. on three sides, so it should come as no surprise that a disproportionate share of the state’s residents work in public administration. More than 1 in 10 Maryland workers are in the public administration sector, which includes many lucrative federal government jobs. Many Maryland adults are qualified for highly specialized, high paying jobs, as 39.7% of adults in the state hold at least a bachelor’s degree — the third highest rate among states.
Detailed findings & methodology:
U.S. economic indicators and the labor market continued to improve in 2017. The U.S. unemployment rate dropped to 4.4% in 2017 from 4.9% the year before. Over the same period, the median household income in the U.S. climbed from $58,820 to $60,336. Half of the 50 states reported a statistically meaningful improvement in median household income in 2017, while median income in the remaining states remained effectively unchanged, or even dropped.
One of the best indicators of whether or not a state is wealthy is education. Nine of the 10 wealthiest states have a larger share of adults with at least a bachelor’s degree than the 32.0% national share. Alaska is the only state with a high median household income and low educational attainment rate. Each of the 10 poorest states in the country is home to a smaller than typical share of adults with at least a bachelor’s degree.
To identify the richest and poorest states with the highest and lowest median household income, 24/7 Wall St. reviewed state data on income from the U.S. Census Bureau’s 2017 American Community Survey (ACS). Median household income for all years is adjusted for inflation. Data on health insurance coverage, employment by industry, and poverty also came from the 2017 ACS. We also reviewed annual average unemployment data from the Bureau of Labor Statistics (BLS) for 2016 and 2017.
Thank you for reading! Have some feedback for us?
Contact the 24/7 Wall St. editorial team.
 24/7 Wall St.
 24/7 Wall St.
 24/7 Wall St.
 24/7 Wall St.


