
According to the U.S. Census Bureau, 32% of American adults have a bachelor’s degree, the largest percentage on record. Currently, more than 19 million Americans are enrolled in an undergraduate college program — and next year, millions more will join the ranks.
There are thousands of four-year institutions across the country, and attracting prospective students can be a challenge. Sill, some schools have managed to distinguish themselves and are becoming increasingly popular among the college-bound.
How people choose which colleges and universities to apply to varies. For many, attending the most prestigious and academically rigorous school is the most important — if not the only — consideration. For others, the decision hinges on the cost of tuition and the value of financial aid packages and scholarships. Distance from home and campus amenities are yet more variables that can make a difference.
Keeping these factors in mind, experts recommend that prospective college students apply to four to eight different schools. These should be a mix of reach schools, where, based on academic credentials, admission would be a long shot; target schools, where admission is more likely; and safety schools, where admission is all but guaranteed.
While colleges and universities all have a certain enrollment capacity threshold, there is no limit to the number of applications they can consider. 24/7 Wall St. reviewed five-year changes in the number of applications submitted to nearly 600 four-year post-secondary institutions to identify the 100 colleges where applications climbed the most.
This list includes schools from all over the country; both public and private, large and small, urban and rural, non-profit and for profit, highly selective and less so. Spikes in the total number of applicants range from 46.7% to 377.8%.
Click here to see the colleges where applications are on the rise.
Click here to see our detailed findings and methodology.
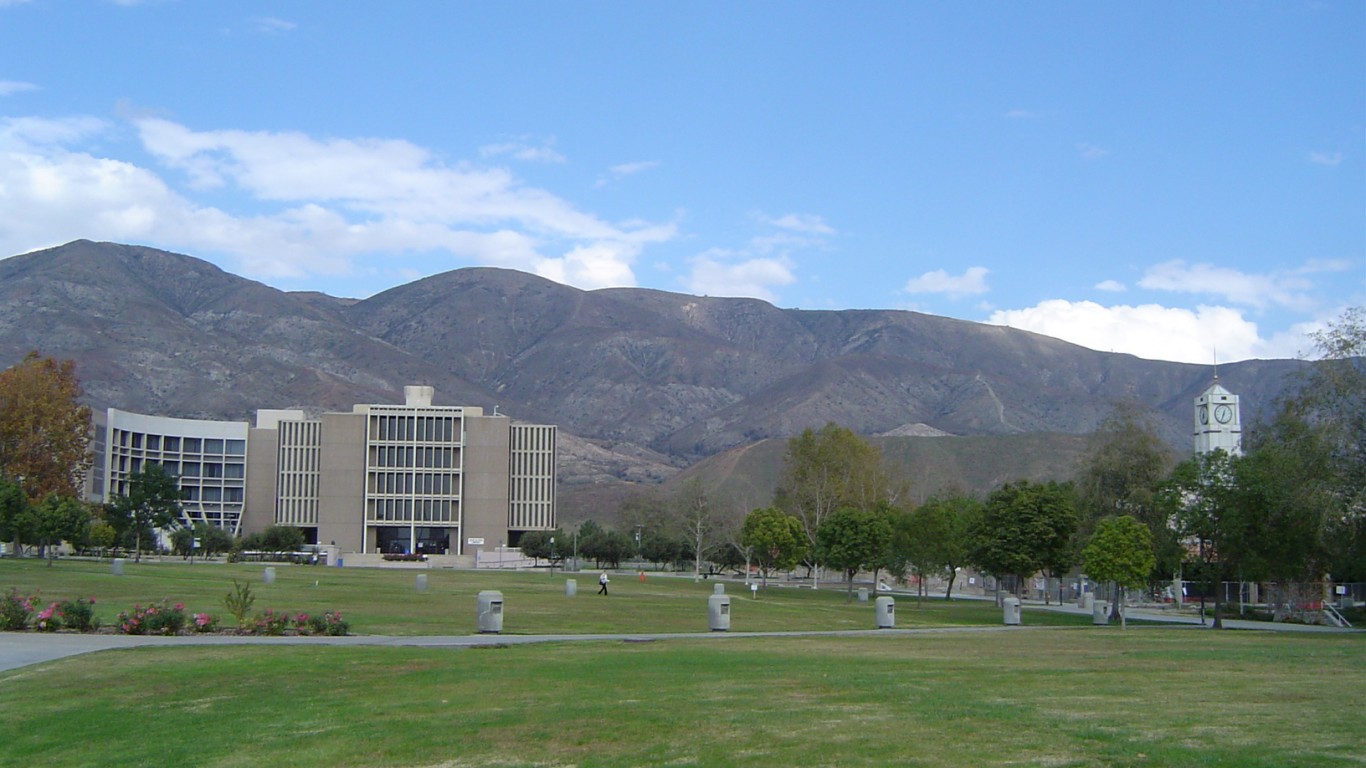
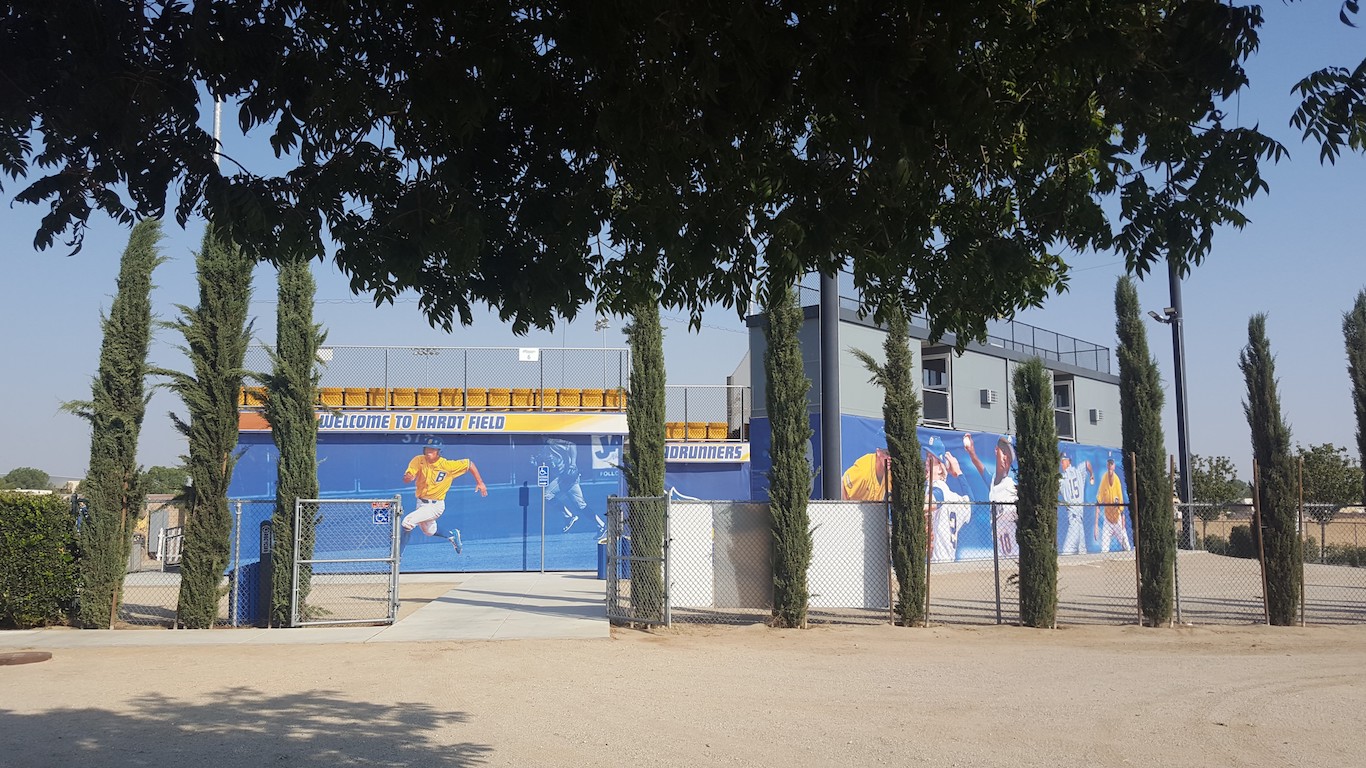
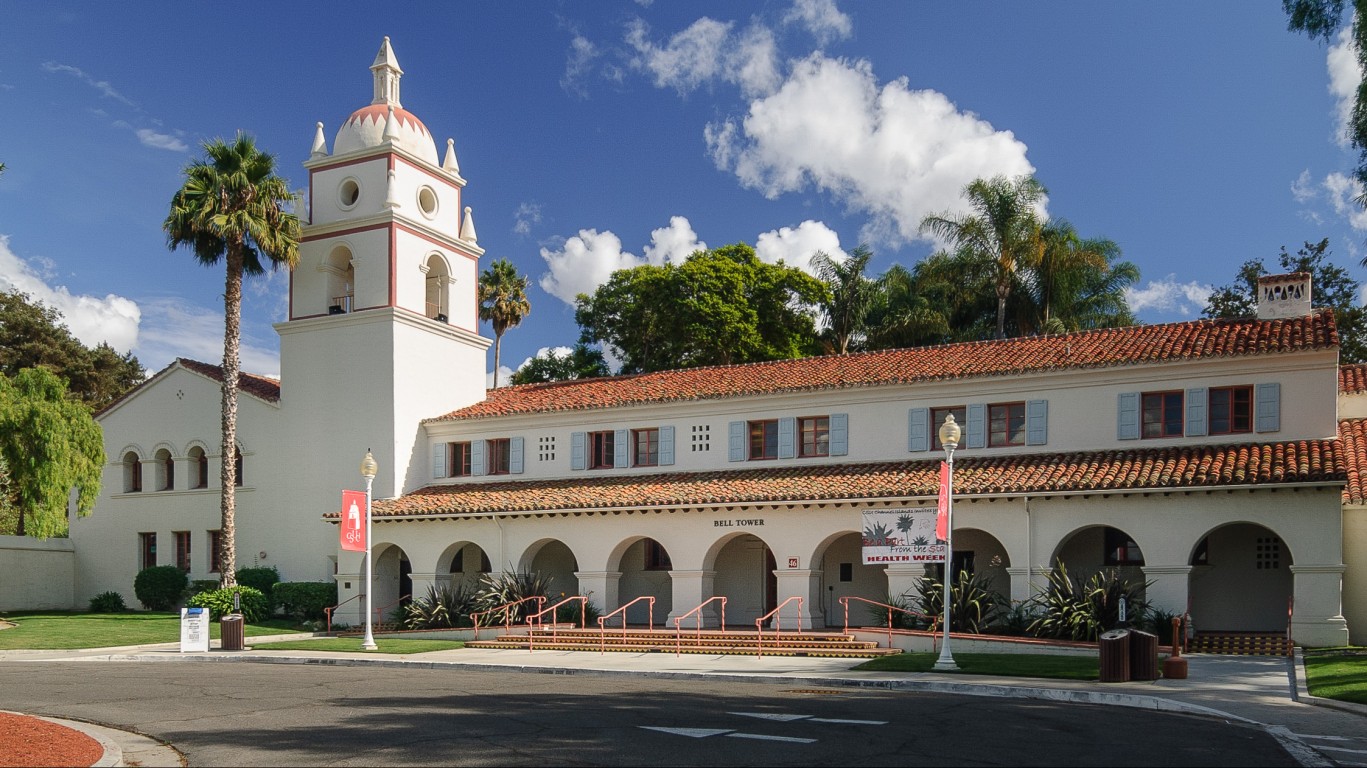
100. California State University-San Bernardino, California
> 5 yr. increase in applications: 46.7%
> 2016-2017 applications: 15,740
> Total undergraduate enrollment: 18,327
> Acceptance rate: 58.1%
> Avg. annual cost: $8,704
[in-text-ad]
99. University of Nevada-Las Vegas, Nevada
> 5 yr. increase in applications: 47.1%
> 2016-2017 applications: 8,533
> Total undergraduate enrollment: 25,279
> Acceptance rate: 82.8%
> Avg. annual cost: $11,582
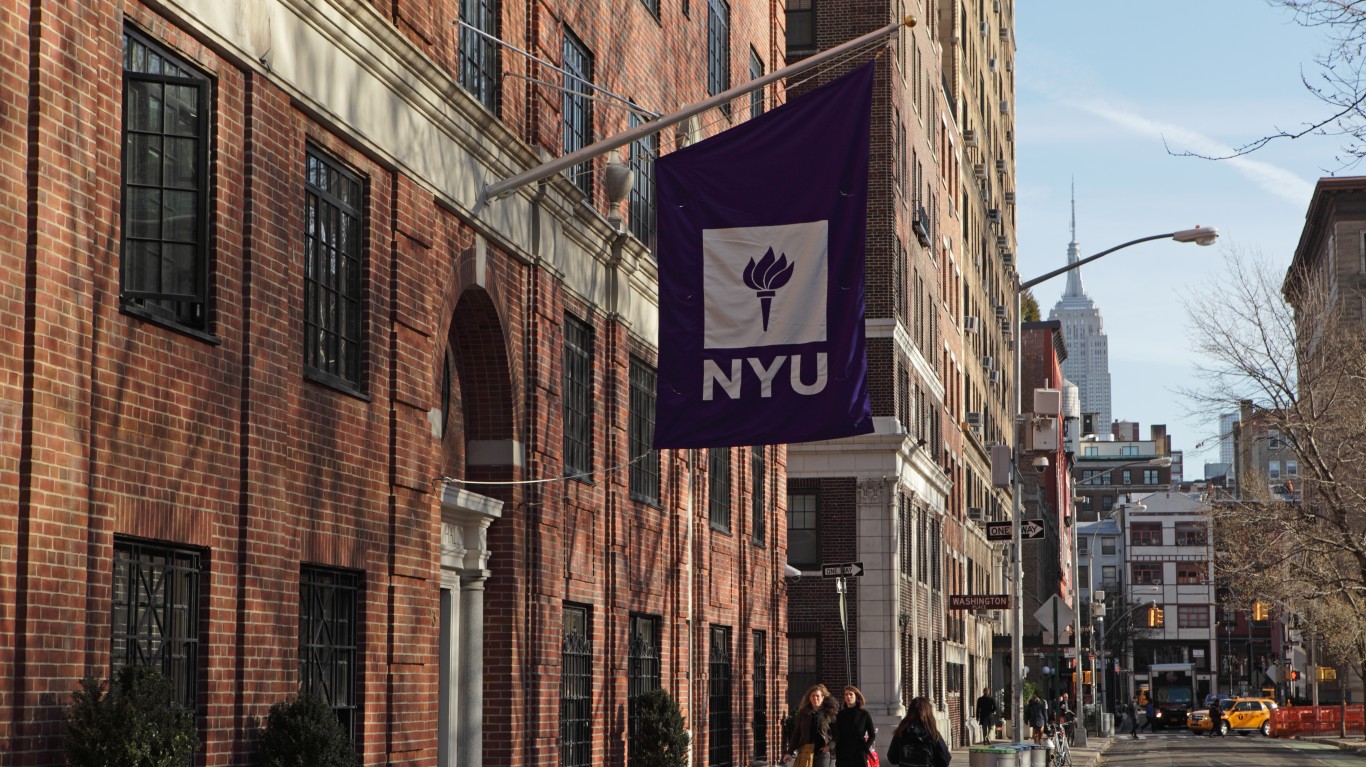
98. New York University, New York
> 5 yr. increase in applications: 47.2%
> 2016-2017 applications: 60,724
> Total undergraduate enrollment: 26,417
> Acceptance rate: 31.9%
> Avg. annual cost: $36,256
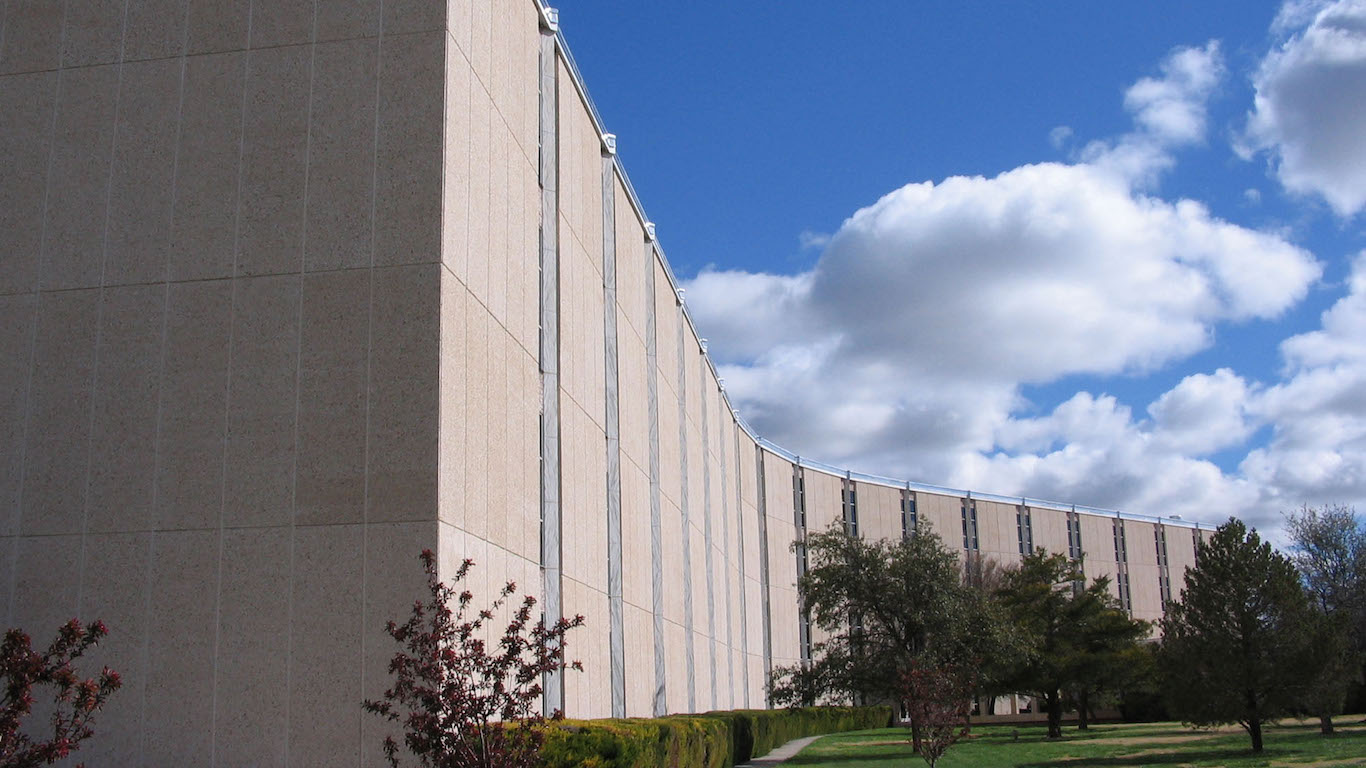
97. University of Kansas, Kansas
> 5 yr. increase in applications: 47.8%
> 2016-2017 applications: 15,015
> Total undergraduate enrollment: 19,338
> Acceptance rate: 93.0%
> Avg. annual cost: $18,365
 24/7 Wall St.
96. Xavier University of Louisiana, Louisiana
> 5 yr. increase in applications: 48.1%
> 2016-2017 applications: 6,609
> Total undergraduate enrollment: 2,293
> Acceptance rate: 61.9%
> Avg. annual cost: $17,034
95. Worcester Polytechnic Institute, Massachusetts
> 5 yr. increase in applications: 48.5%
> 2016-2017 applications: 10,468
> Total undergraduate enrollment: 4,435
> Acceptance rate: 48.4%
> Avg. annual cost: $43,027
94. University of Massachusetts-Lowell, Massachusetts
> 5 yr. increase in applications: 49.6%
> 2016-2017 applications: 11,321
> Total undergraduate enrollment: 14,012
> Acceptance rate: 60.6%
> Avg. annual cost: $18,375
[in-text-ad-2]
93. Kenyon College, Ohio
> 5 yr. increase in applications: 49.9%
> 2016-2017 applications: 6,403
> Total undergraduate enrollment: 1,677
> Acceptance rate: 26.6%
> Avg. annual cost: $31,704
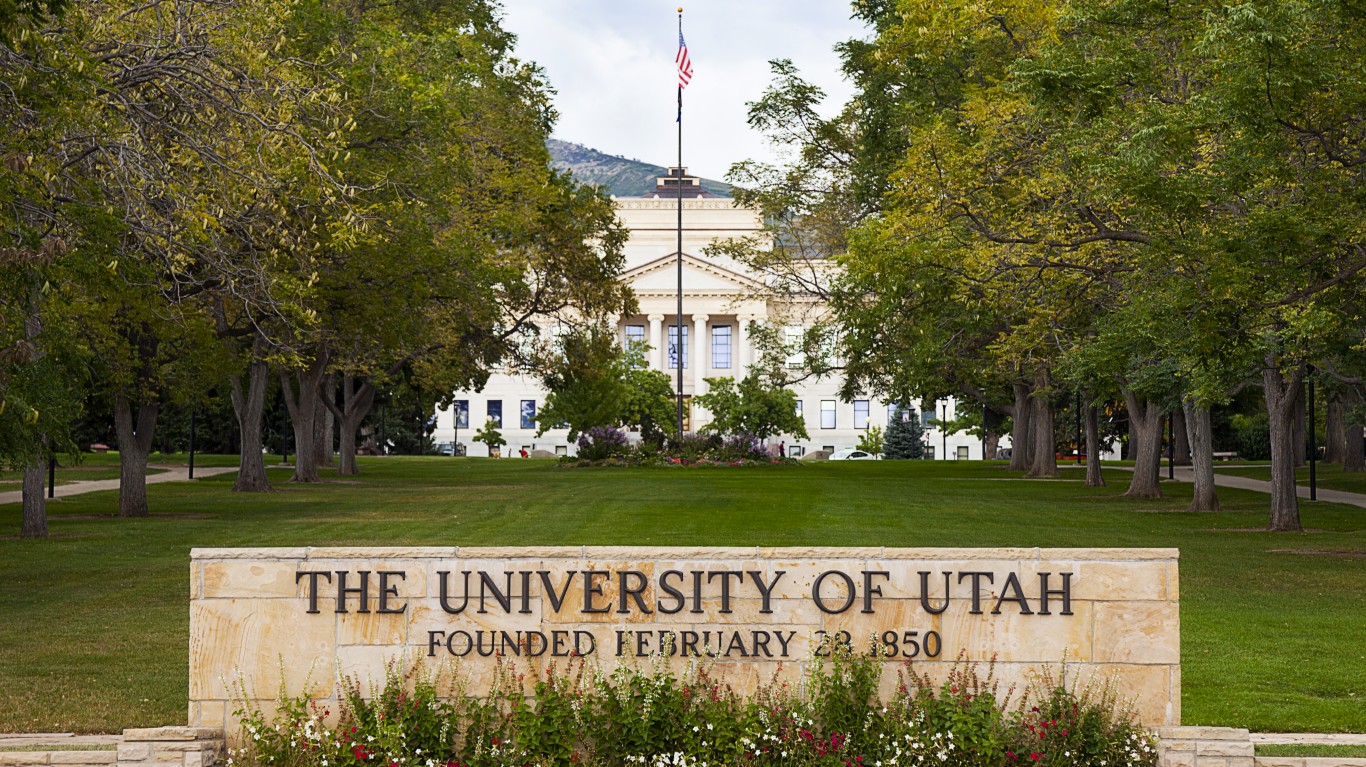
92. University of Utah, Utah
> 5 yr. increase in applications: 49.9%
> 2016-2017 applications: 14,308
> Total undergraduate enrollment: 24,635
> Acceptance rate: 76.4%
> Avg. annual cost: $12,363
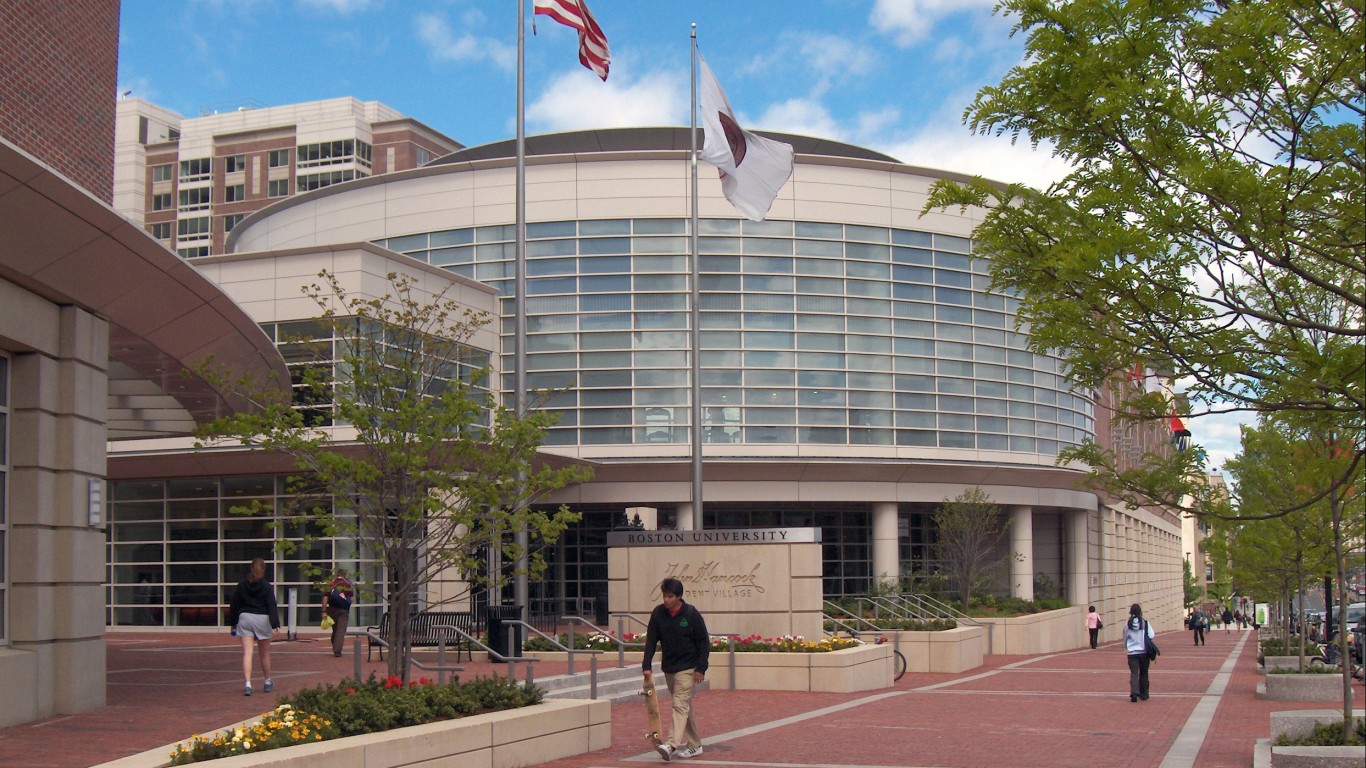
91. Boston University, Massachusetts
> 5 yr. increase in applications: 50.1%
> 2016-2017 applications: 57,441
> Total undergraduate enrollment: 18,080
> Acceptance rate: 29.4%
> Avg. annual cost: $33,728
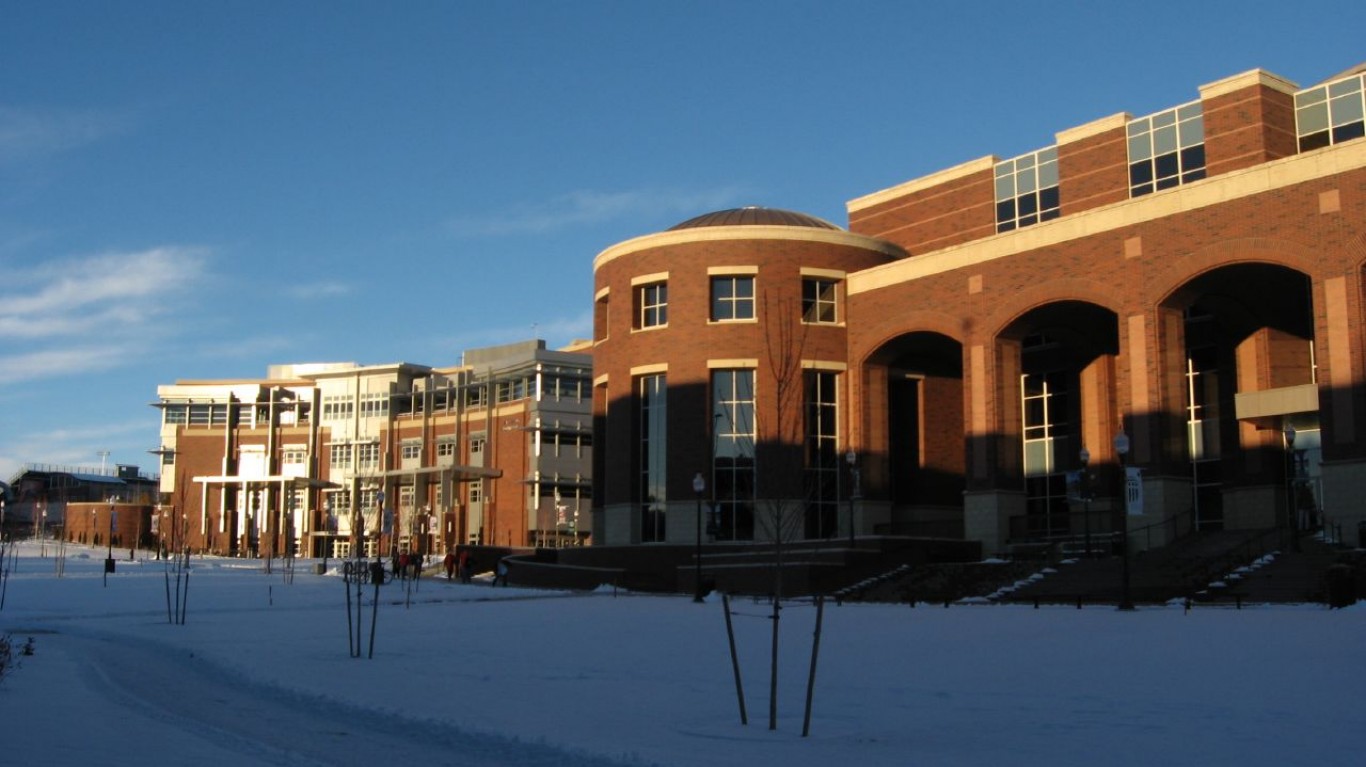
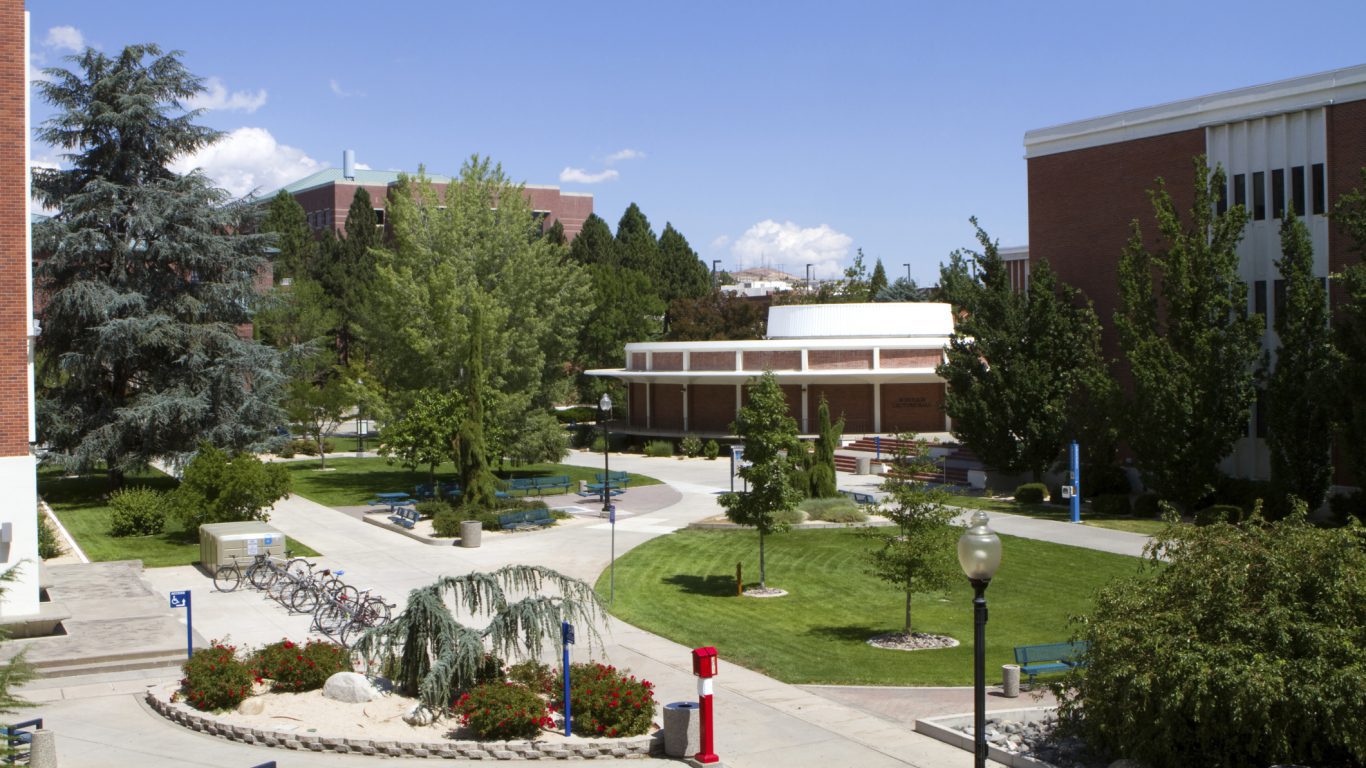
90. University of Nevada-Reno, Nevada
> 5 yr. increase in applications: 50.2%
> 2016-2017 applications: 9,644
> Total undergraduate enrollment: 18,348
> Acceptance rate: 82.8%
> Avg. annual cost: $16,230
[in-text-ad]
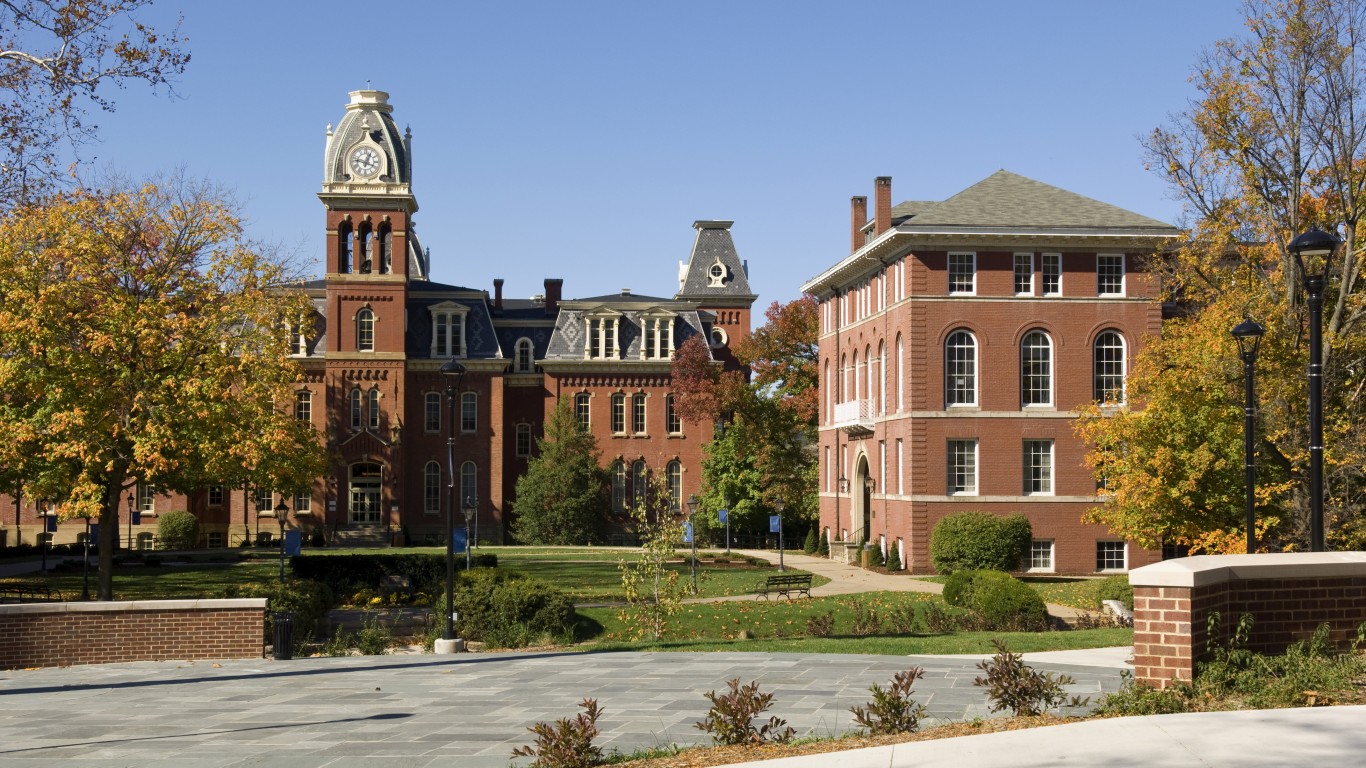
89. West Virginia University, West Virginia
> 5 yr. increase in applications: 50.4%
> 2016-2017 applications: 21,558
> Total undergraduate enrollment: 22,501
> Acceptance rate: 76.1%
> Avg. annual cost: $11,486
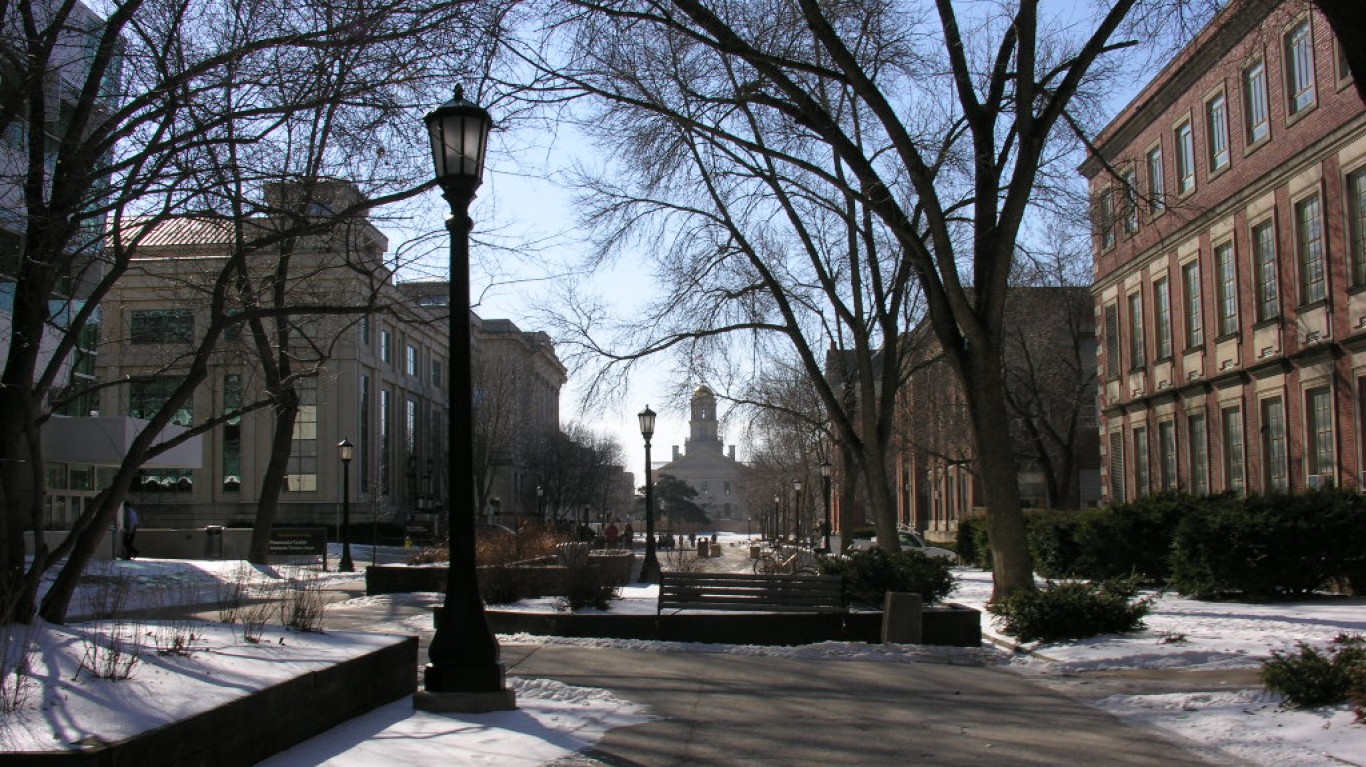
88. University of Iowa, Iowa
> 5 yr. increase in applications: 50.5%
> 2016-2017 applications: 28,494
> Total undergraduate enrollment: 24,503
> Acceptance rate: 84.1%
> Avg. annual cost: $14,845
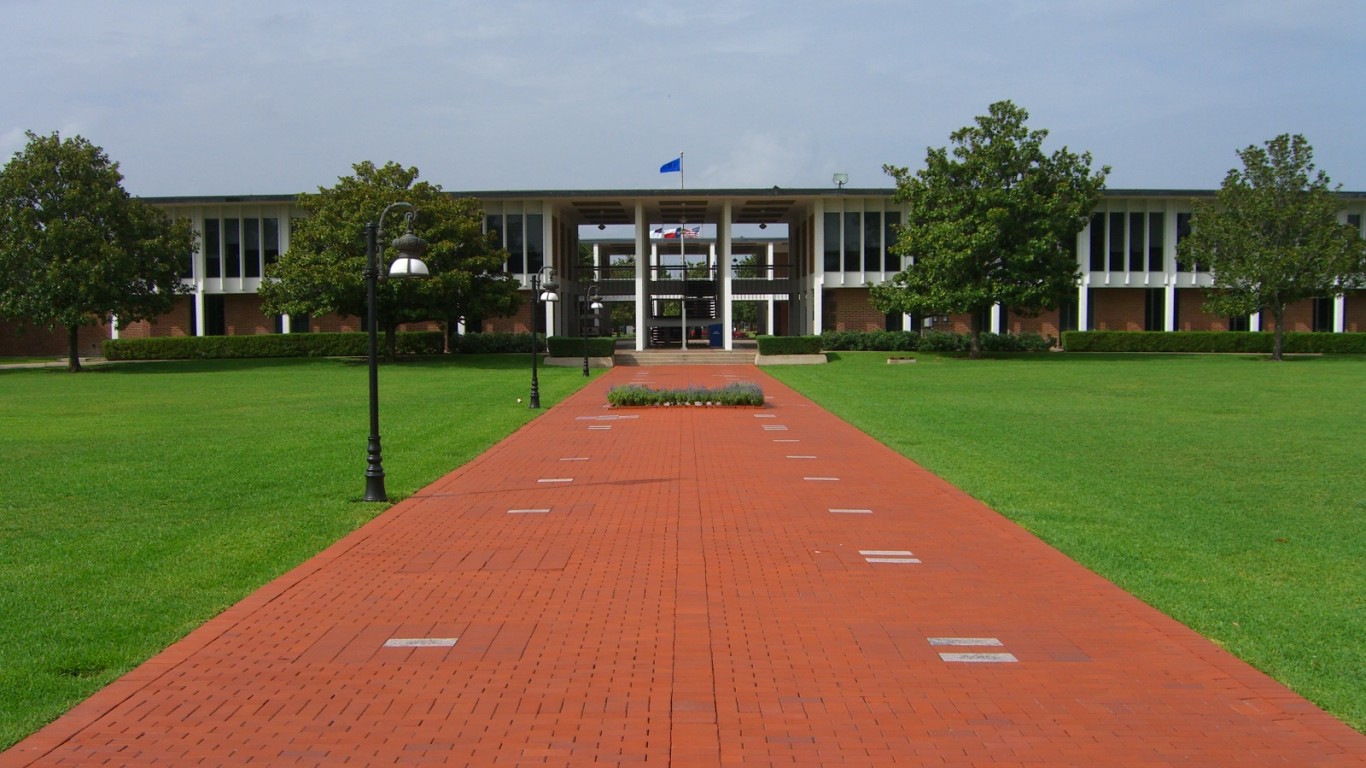
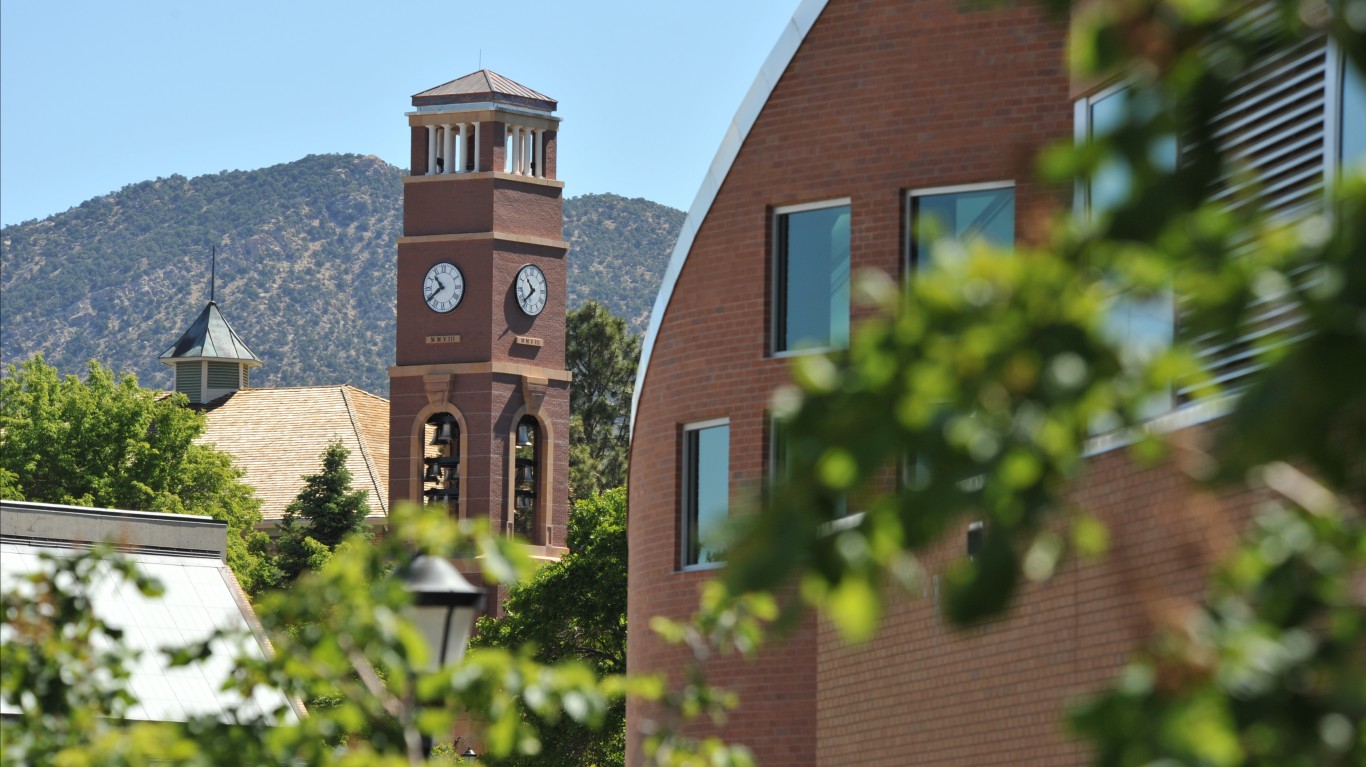
87. West Texas A & M University, Texas
> 5 yr. increase in applications: 50.5%
> 2016-2017 applications: 6,163
> Total undergraduate enrollment: 7,394
> Acceptance rate: 60.0%
> Avg. annual cost: $13,806
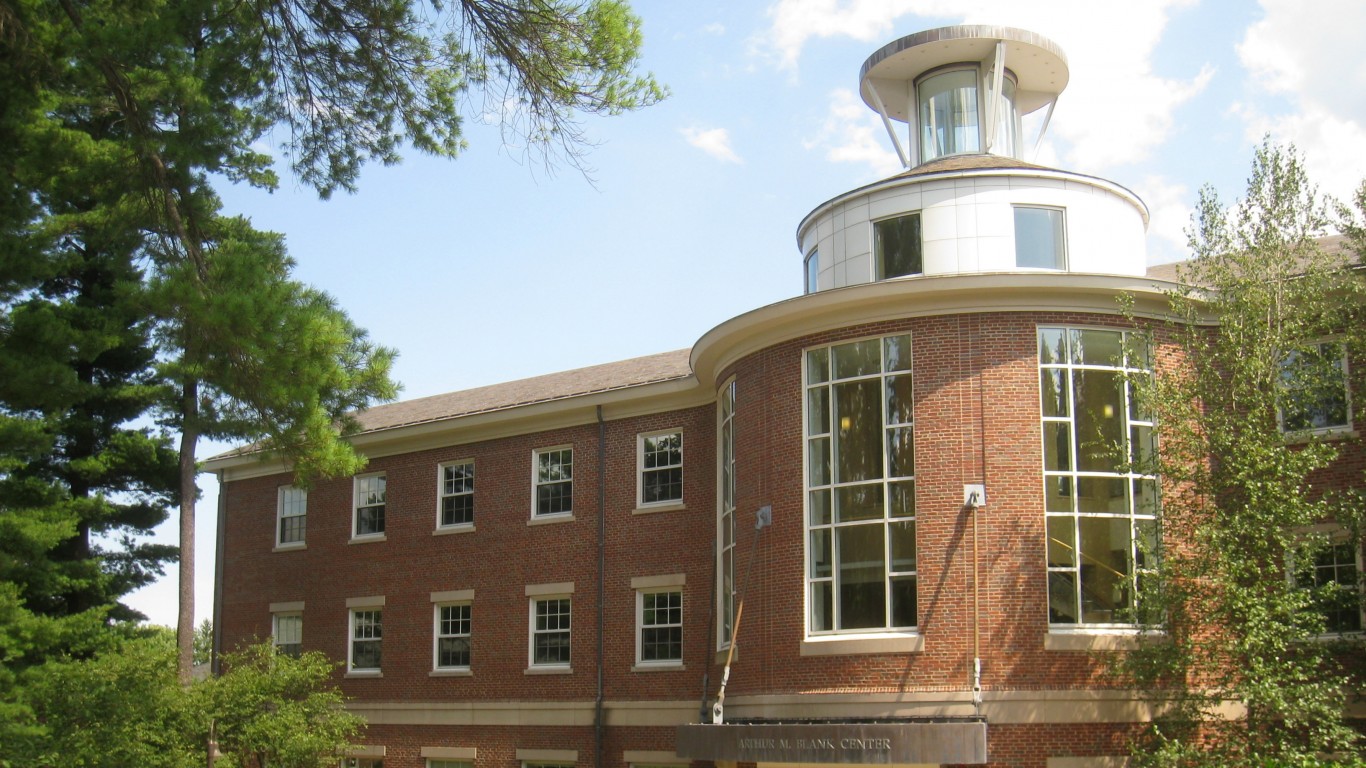
86. Babson College, Massachusetts
> 5 yr. increase in applications: 50.6%
> 2016-2017 applications: 7,648
> Total undergraduate enrollment: 2,342
> Acceptance rate: 24.6%
> Avg. annual cost: $29,847
85. Saint Xavier University, Illinois
> 5 yr. increase in applications: 50.6%
> 2016-2017 applications: 8,315
> Total undergraduate enrollment: 2,942
> Acceptance rate: 75.2%
> Avg. annual cost: $14,911
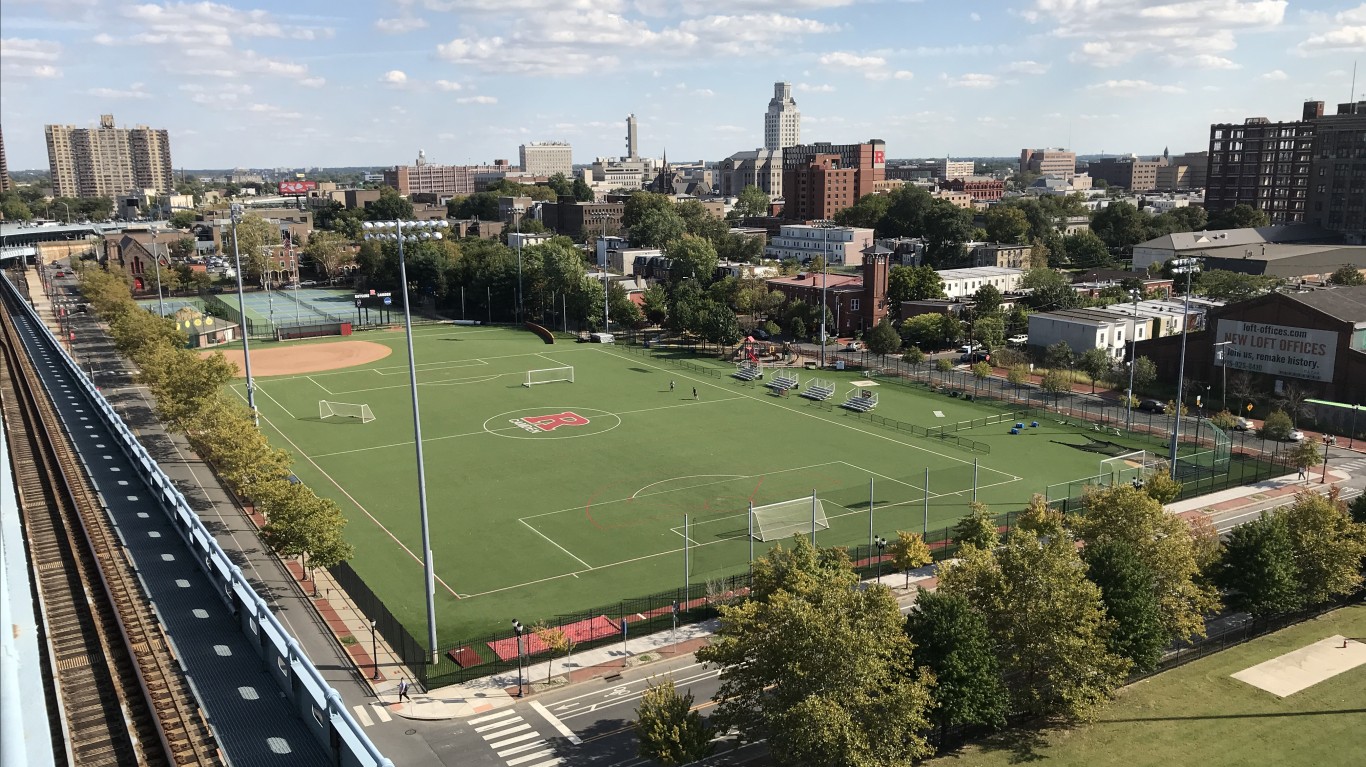
84. Rutgers University-Camden, New Jersey
> 5 yr. increase in applications: 50.7%
> 2016-2017 applications: 8,725
> Total undergraduate enrollment: 5,489
> Acceptance rate: 57.5%
> Avg. annual cost: $12,399
[in-text-ad-2]
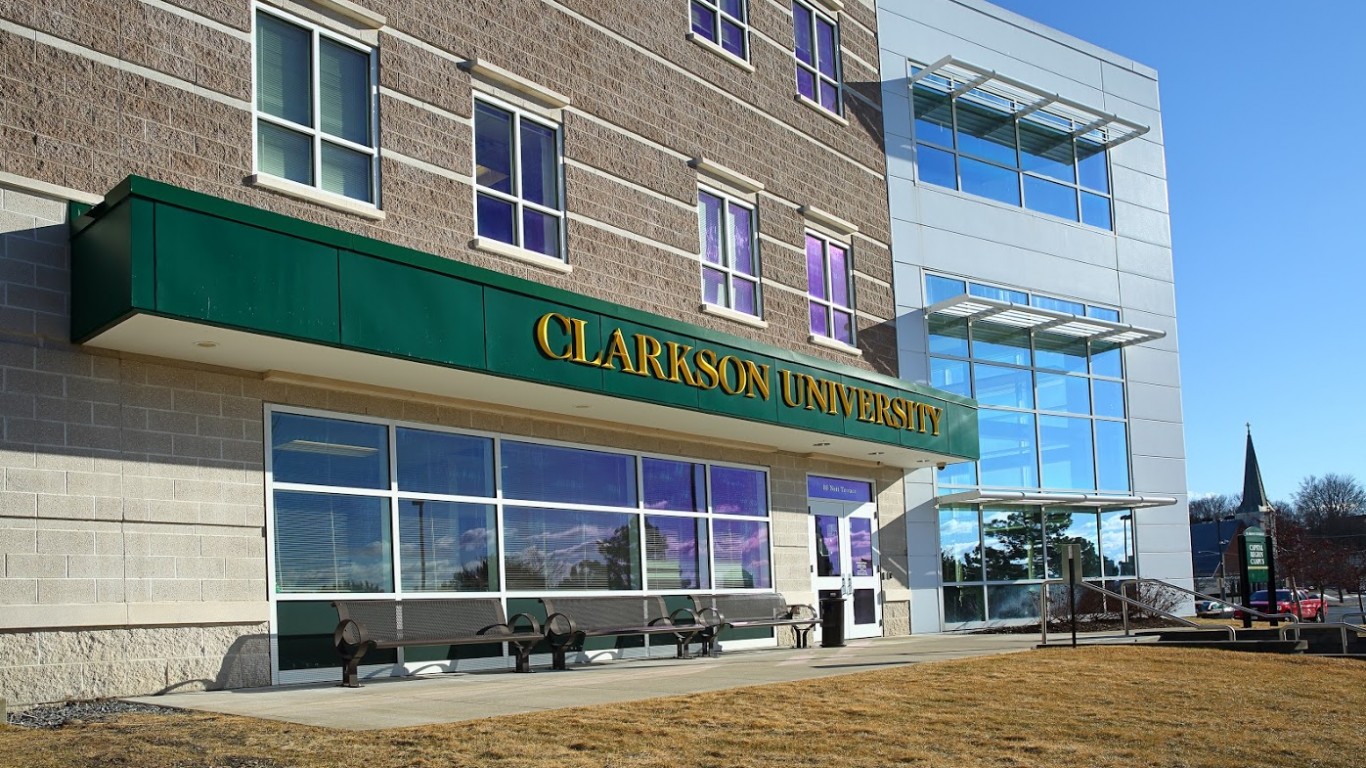
83. Clarkson University, New York
> 5 yr. increase in applications: 50.8%
> 2016-2017 applications: 7,066
> Total undergraduate enrollment: 3,090
> Acceptance rate: 68.2%
> Avg. annual cost: $31,050
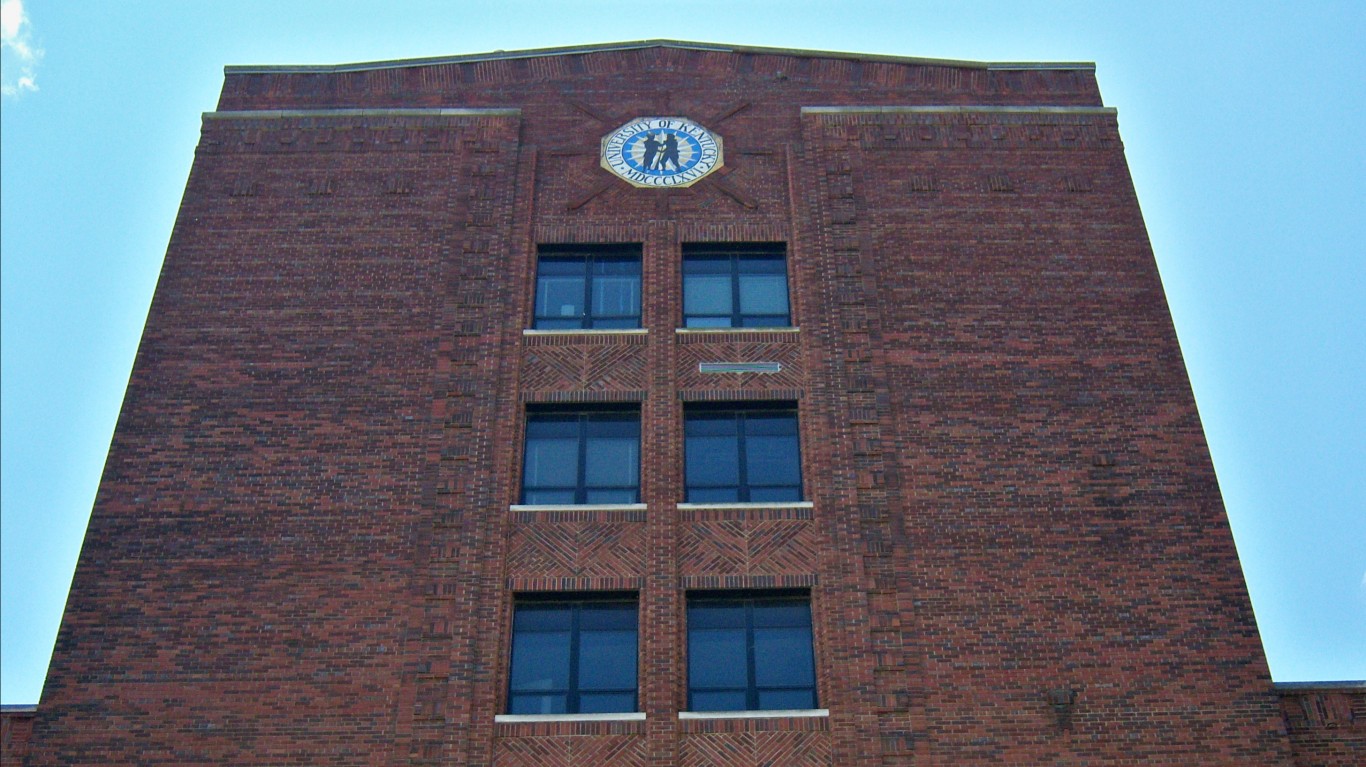
82. University of Kentucky, Kentucky
> 5 yr. increase in applications: 51.3%
> 2016-2017 applications: 20,480
> Total undergraduate enrollment: 22,425
> Acceptance rate: 90.8%
> Avg. annual cost: $19,361
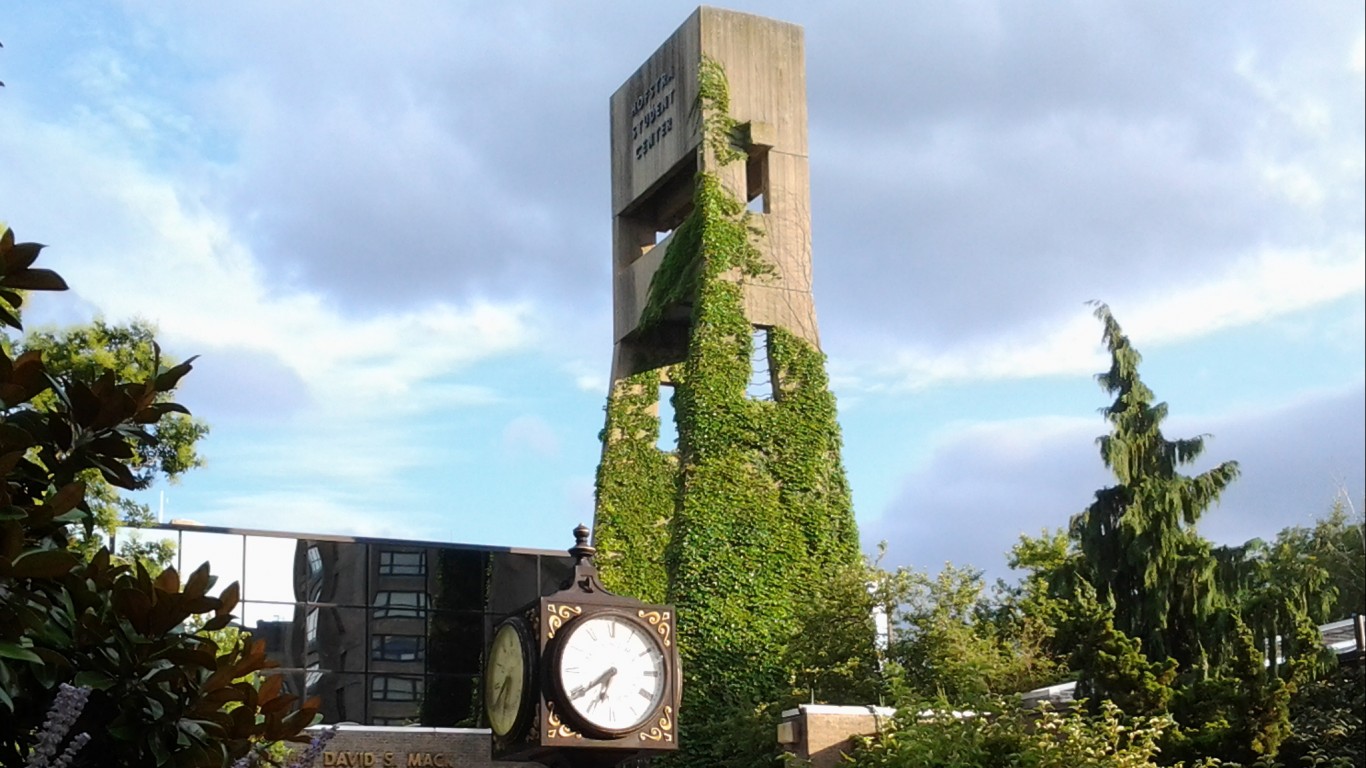
81. Hofstra University, New York
> 5 yr. increase in applications: 51.3%
> 2016-2017 applications: 28,617
> Total undergraduate enrollment: 6,861
> Acceptance rate: 62.2%
> Avg. annual cost: $32,566
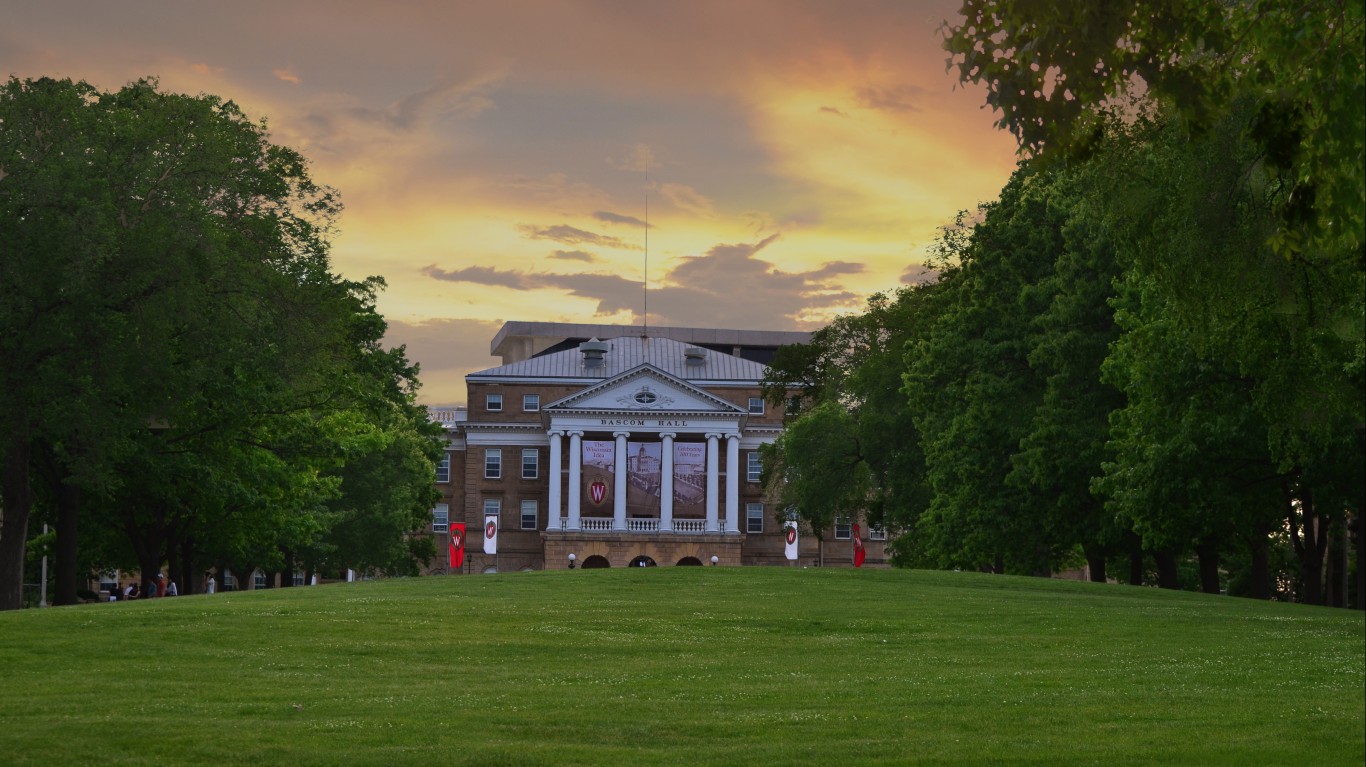
80. University of Wisconsin-Madison, Wisconsin
> 5 yr. increase in applications: 51.4%
> 2016-2017 applications: 32,839
> Total undergraduate enrollment: 31,358
> Acceptance rate: 52.6%
> Avg. annual cost: $15,910
[in-text-ad]
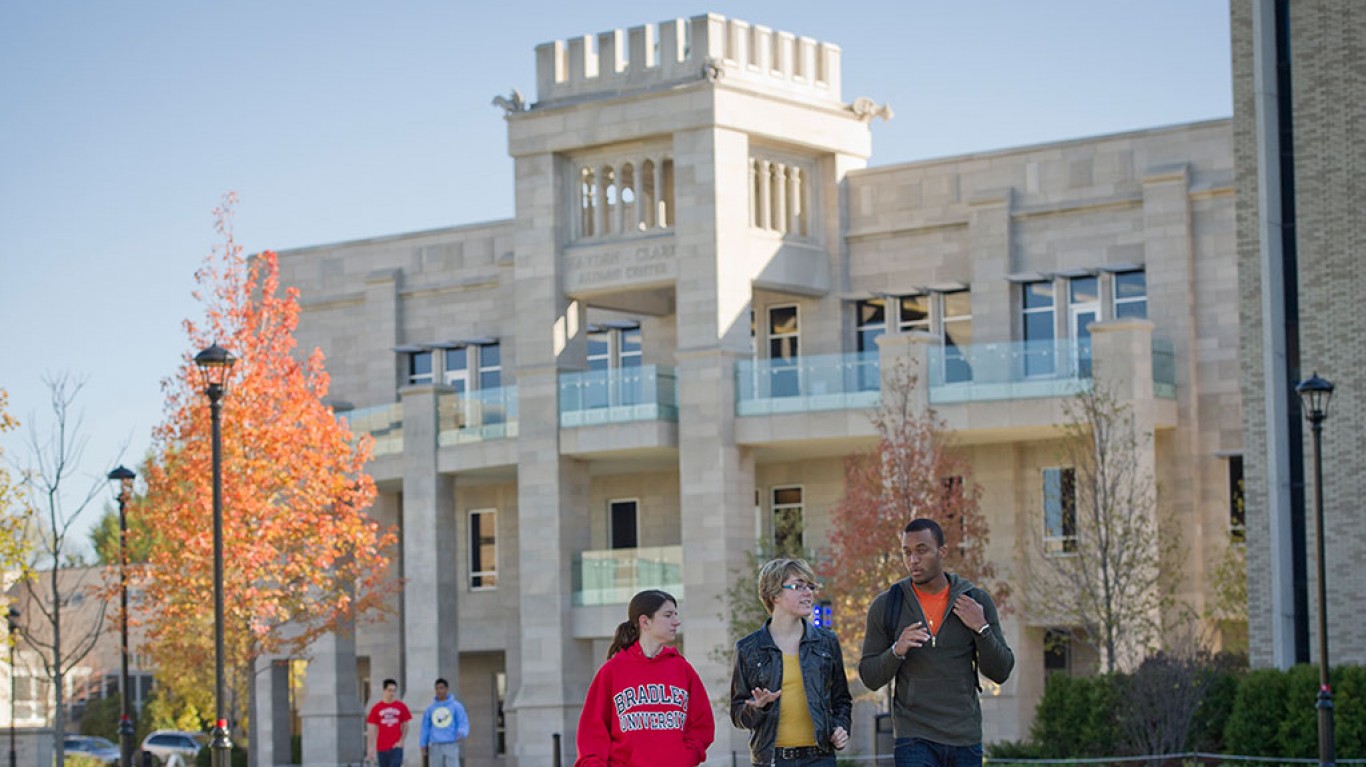
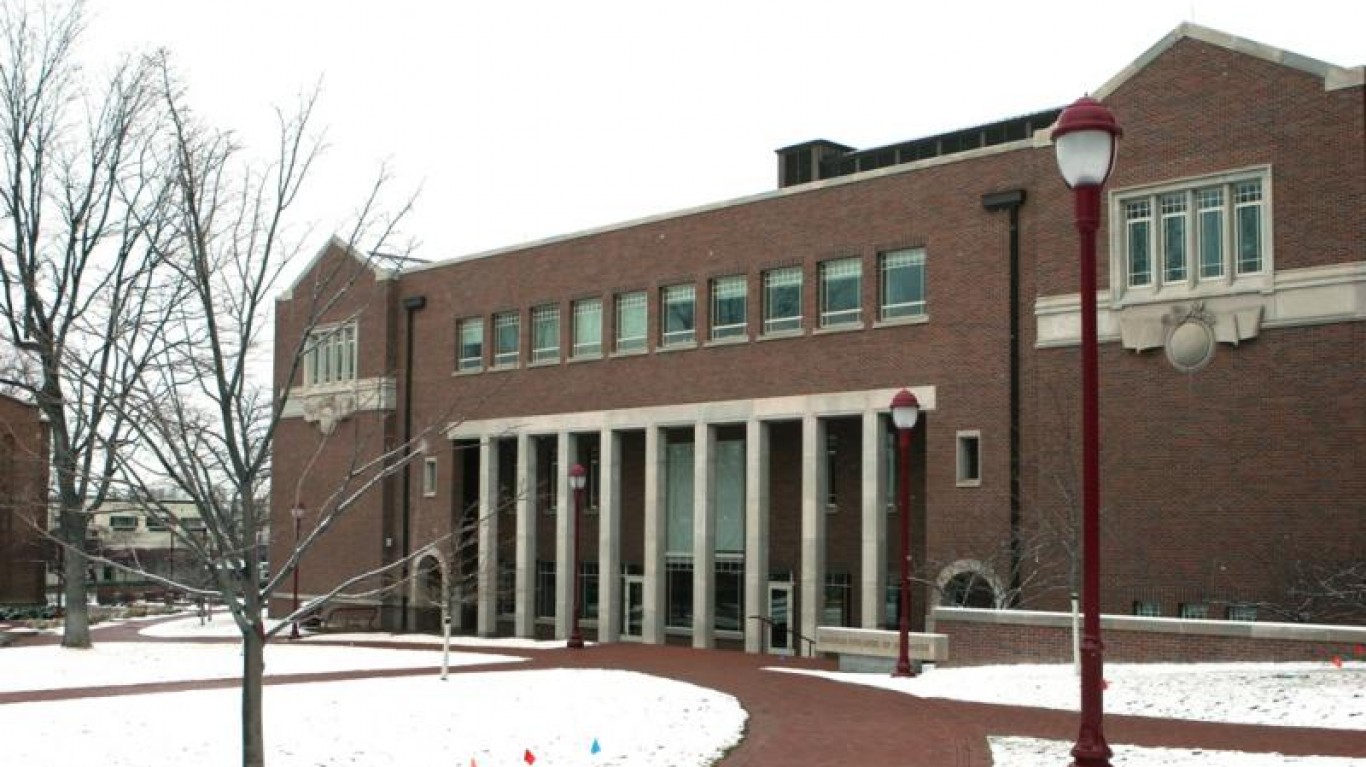
79. Bradley University, Illinois
> 5 yr. increase in applications: 51.6%
> 2016-2017 applications: 9,786
> Total undergraduate enrollment: 4,649
> Acceptance rate: 69.8%
> Avg. annual cost: $25,857
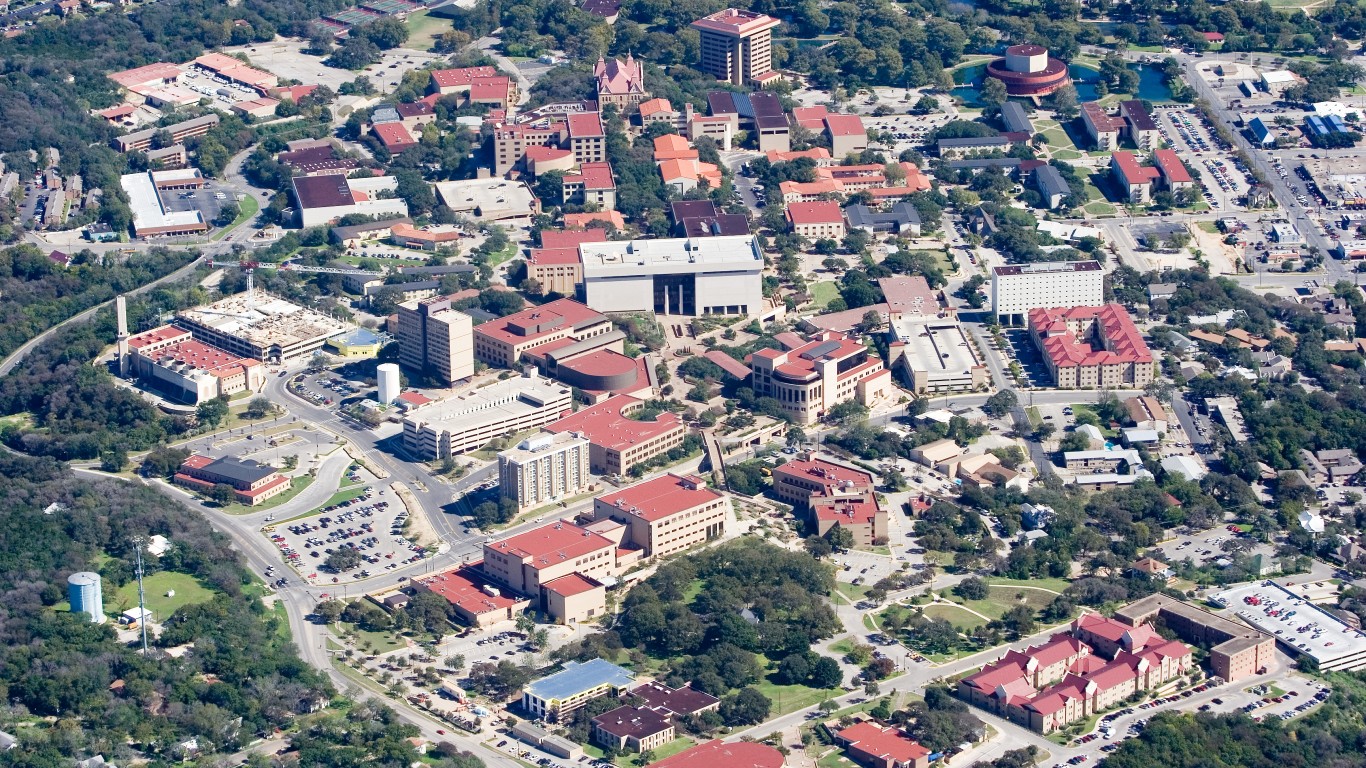
78. Texas State University, Texas
> 5 yr. increase in applications: 52.6%
> 2016-2017 applications: 22,701
> Total undergraduate enrollment: 34,180
> Acceptance rate: 71.1%
> Avg. annual cost: $13,579
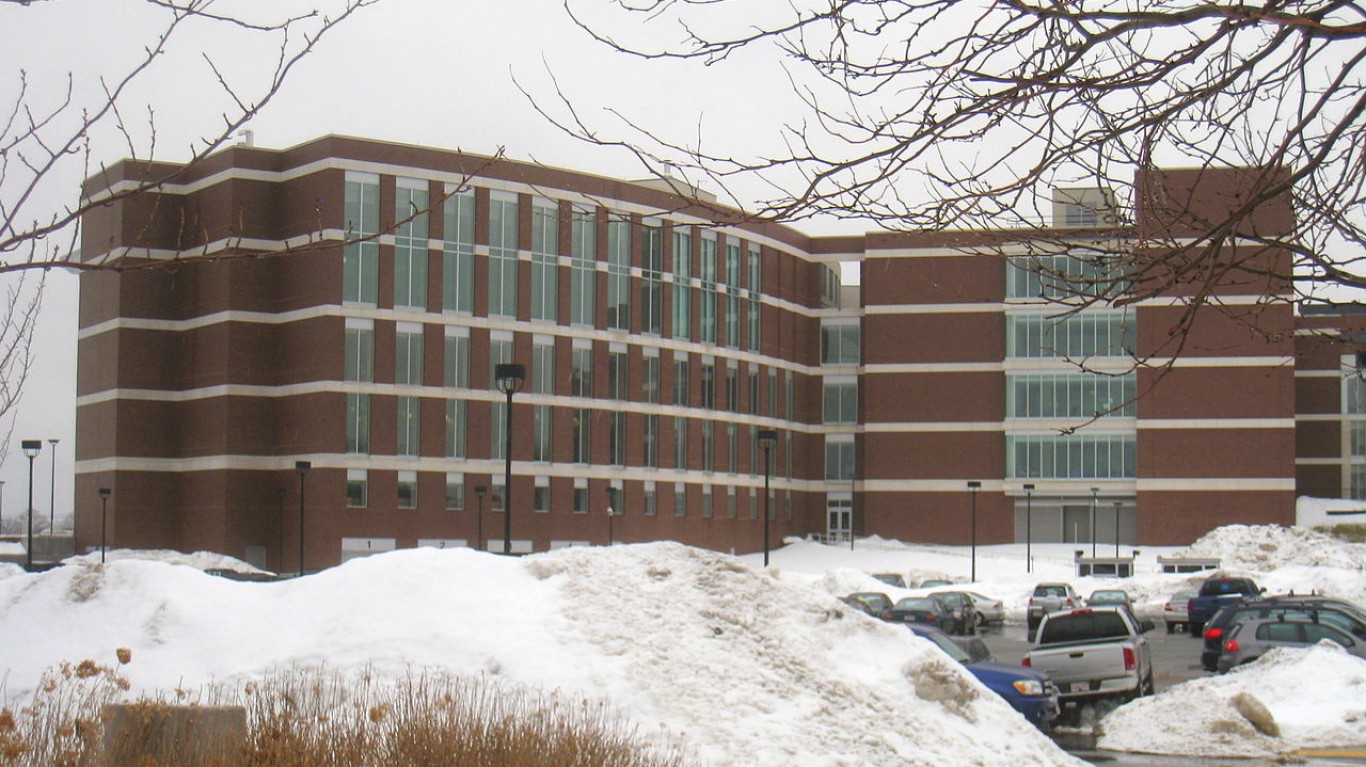
77. University of Massachusetts-Boston, Massachusetts
> 5 yr. increase in applications: 53.2%
> 2016-2017 applications: 9,886
> Total undergraduate enrollment: 12,660
> Acceptance rate: 68.5%
> Avg. annual cost: $10,991

76. Spelman College, Georgia
> 5 yr. increase in applications: 53.4%
> 2016-2017 applications: 7,864
> Total undergraduate enrollment: 2,137
> Acceptance rate: 35.7%
> Avg. annual cost: $36,190
75. Houston Baptist University, Texas
> 5 yr. increase in applications: 54.6%
> 2016-2017 applications: 15,256
> Total undergraduate enrollment: 2,316
> Acceptance rate: 34.6%
> Avg. annual cost: $21,084
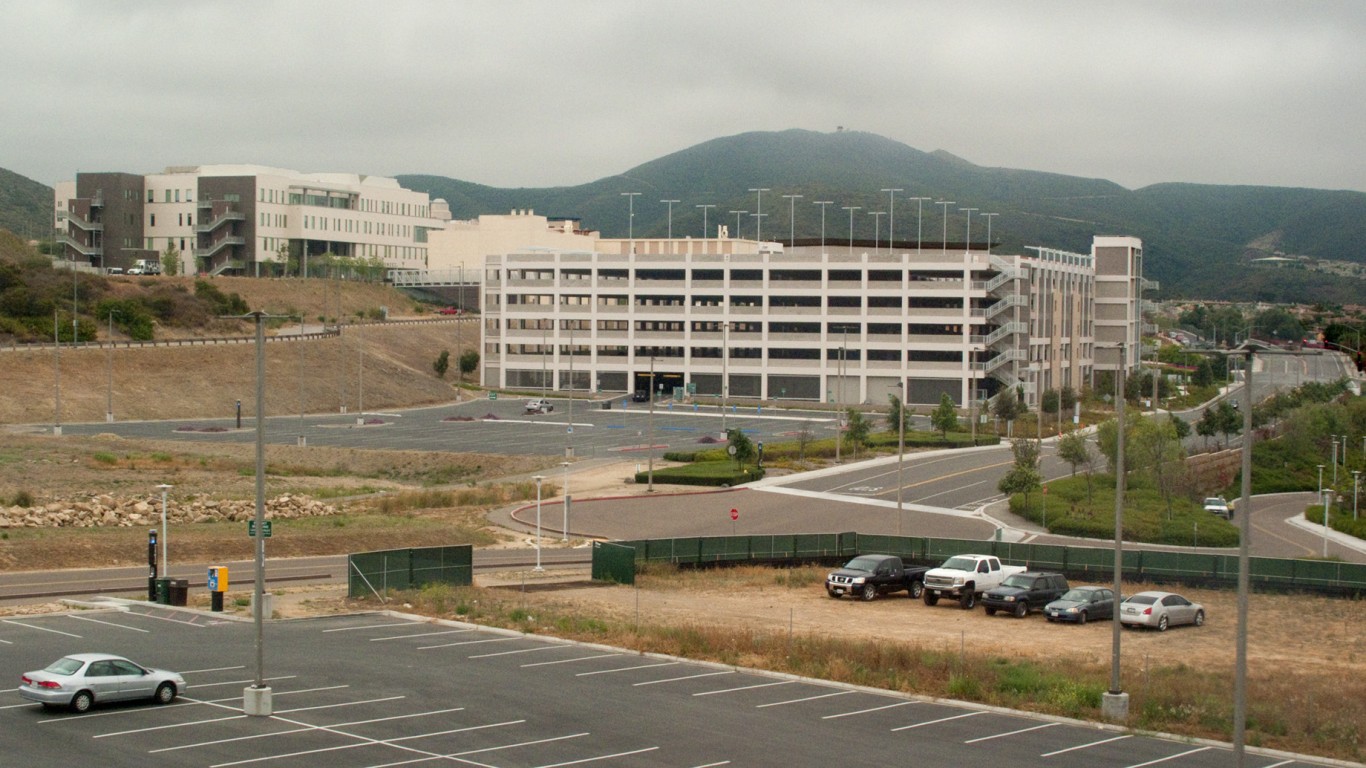
74. California State University-San Marcos, California
> 5 yr. increase in applications: 54.6%
> 2016-2017 applications: 15,366
> Total undergraduate enrollment: 14,615
> Acceptance rate: 51.8%
> Avg. annual cost: $10,454
[in-text-ad-2]
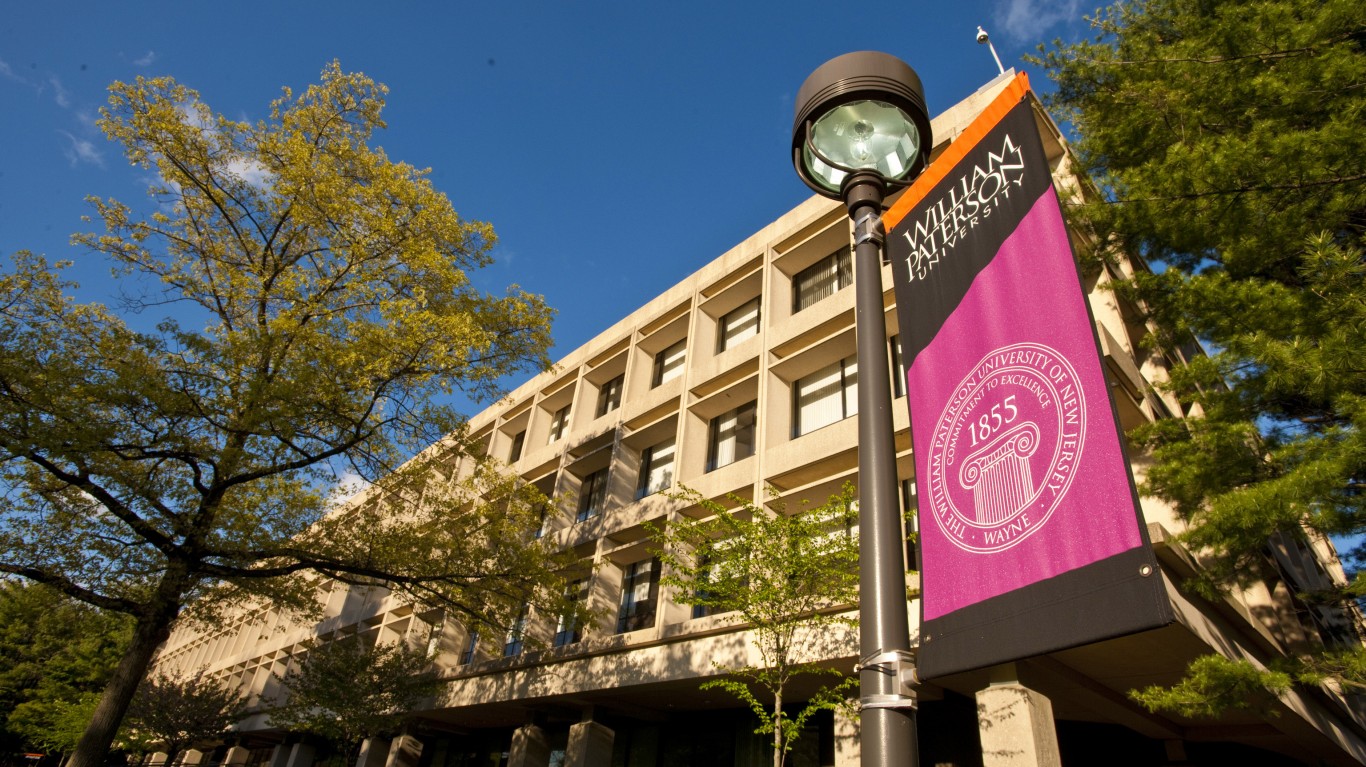
73. William Paterson University of New Jersey, New Jersey
> 5 yr. increase in applications: 55.2%
> 2016-2017 applications: 10,791
> Total undergraduate enrollment: 8,838
> Acceptance rate: 75.6%
> Avg. annual cost: $14,779
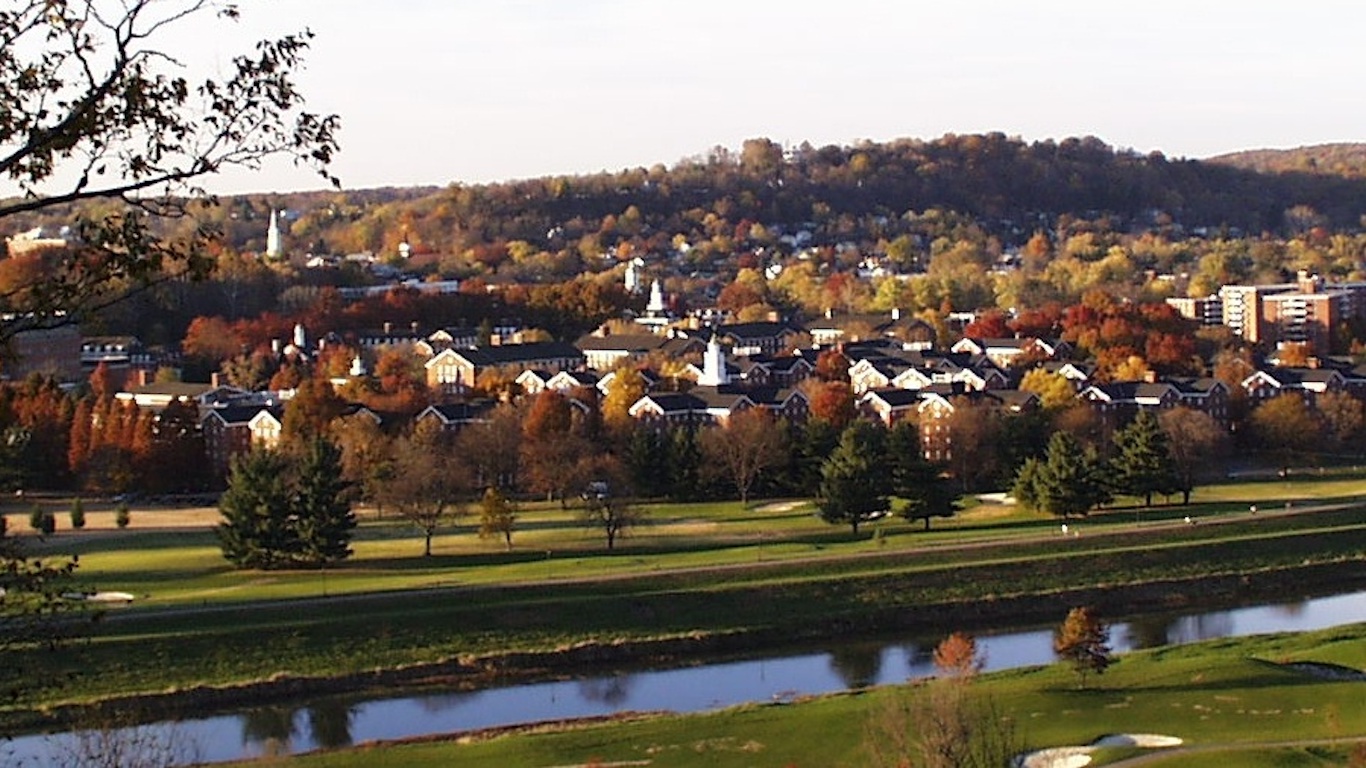
72. Ohio University-Main Campus, Ohio
> 5 yr. increase in applications: 55.4%
> 2016-2017 applications: 20,623
> Total undergraduate enrollment: 23,167
> Acceptance rate: 74.9%
> Avg. annual cost: $21,607
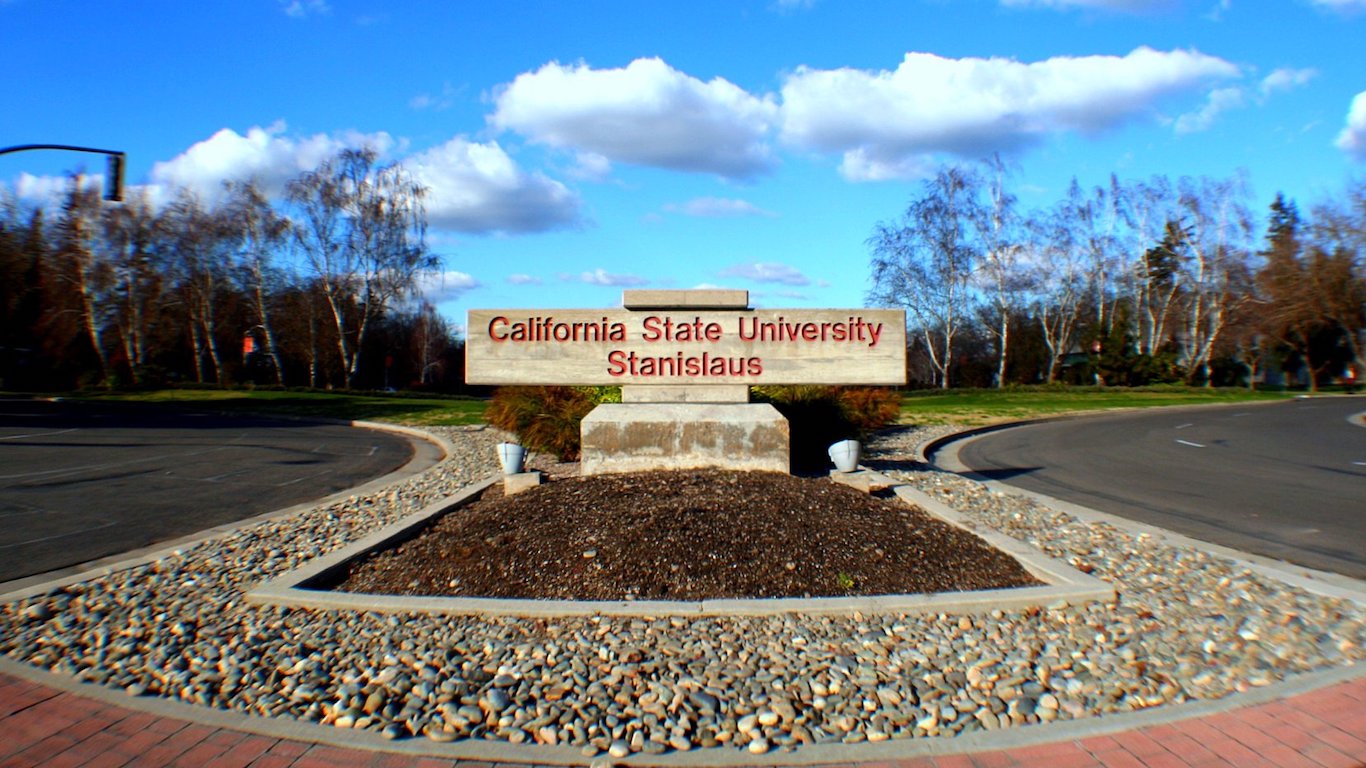
71. California State University-Stanislaus, California
> 5 yr. increase in applications: 55.6%
> 2016-2017 applications: 7,618
> Total undergraduate enrollment: 9,057
> Acceptance rate: 74.3%
> Avg. annual cost: $6,768
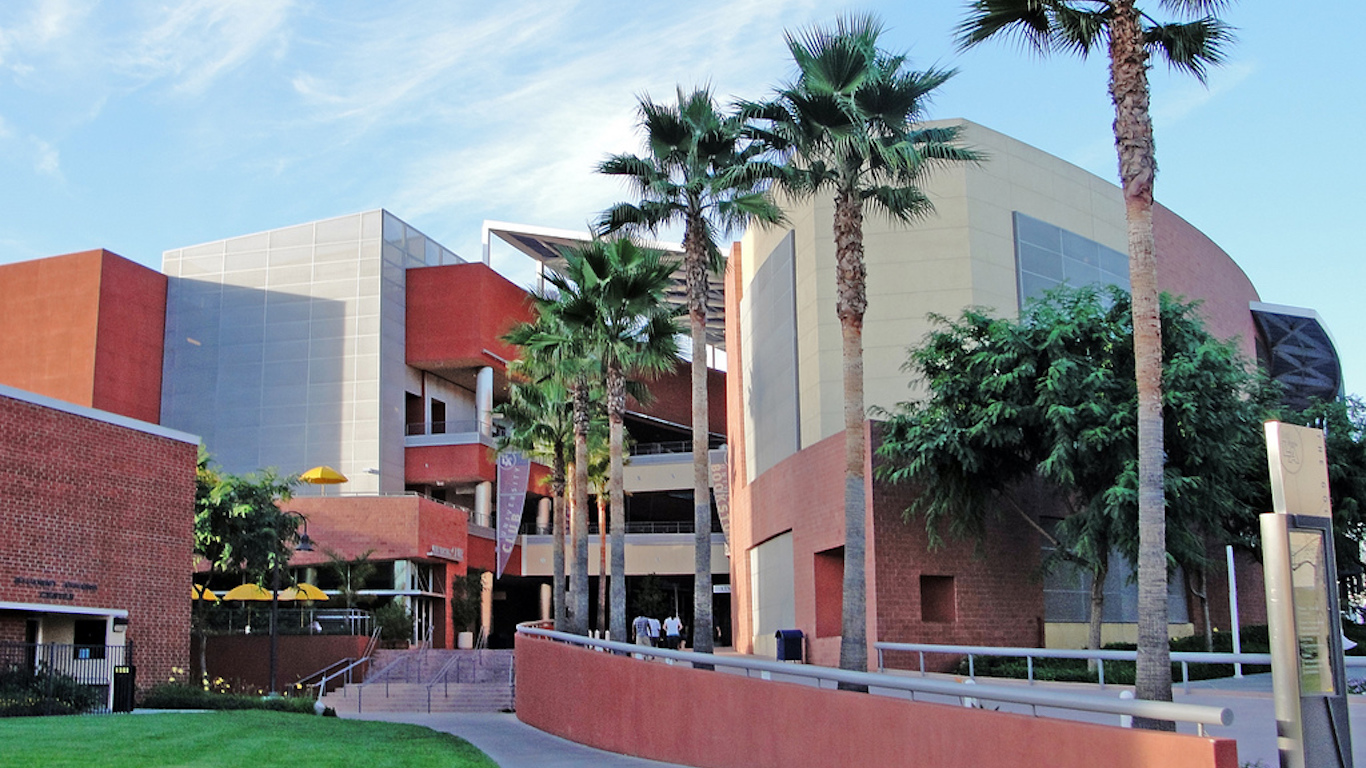
70. California State University-Los Angeles, California
> 5 yr. increase in applications: 55.9%
> 2016-2017 applications: 35,429
> Total undergraduate enrollment: 24,818
> Acceptance rate: 63.7%
> Avg. annual cost: $3,907
[in-text-ad]
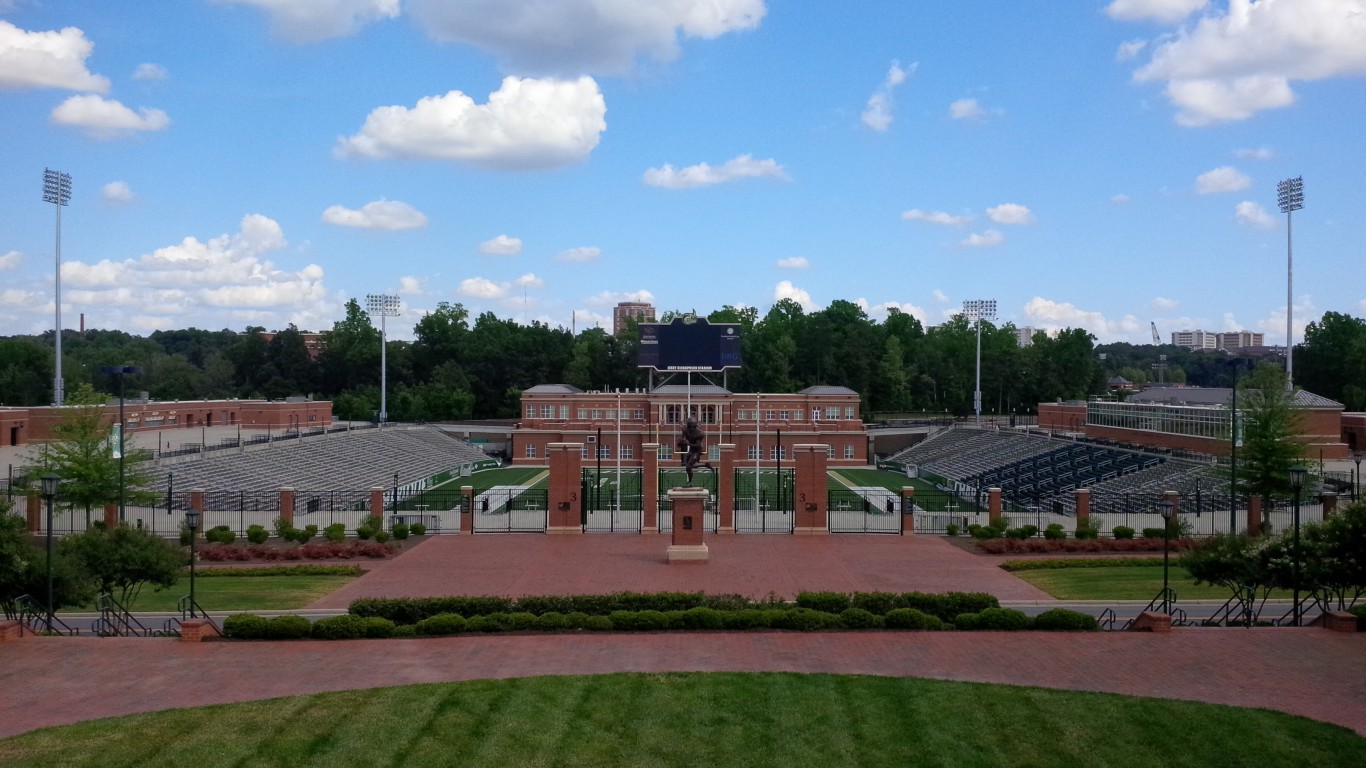
69. University of North Carolina at Charlotte, North Carolina
> 5 yr. increase in applications: 55.9%
> 2016-2017 applications: 17,518
> Total undergraduate enrollment: 23,914
> Acceptance rate: 62.0%
> Avg. annual cost: $14,811
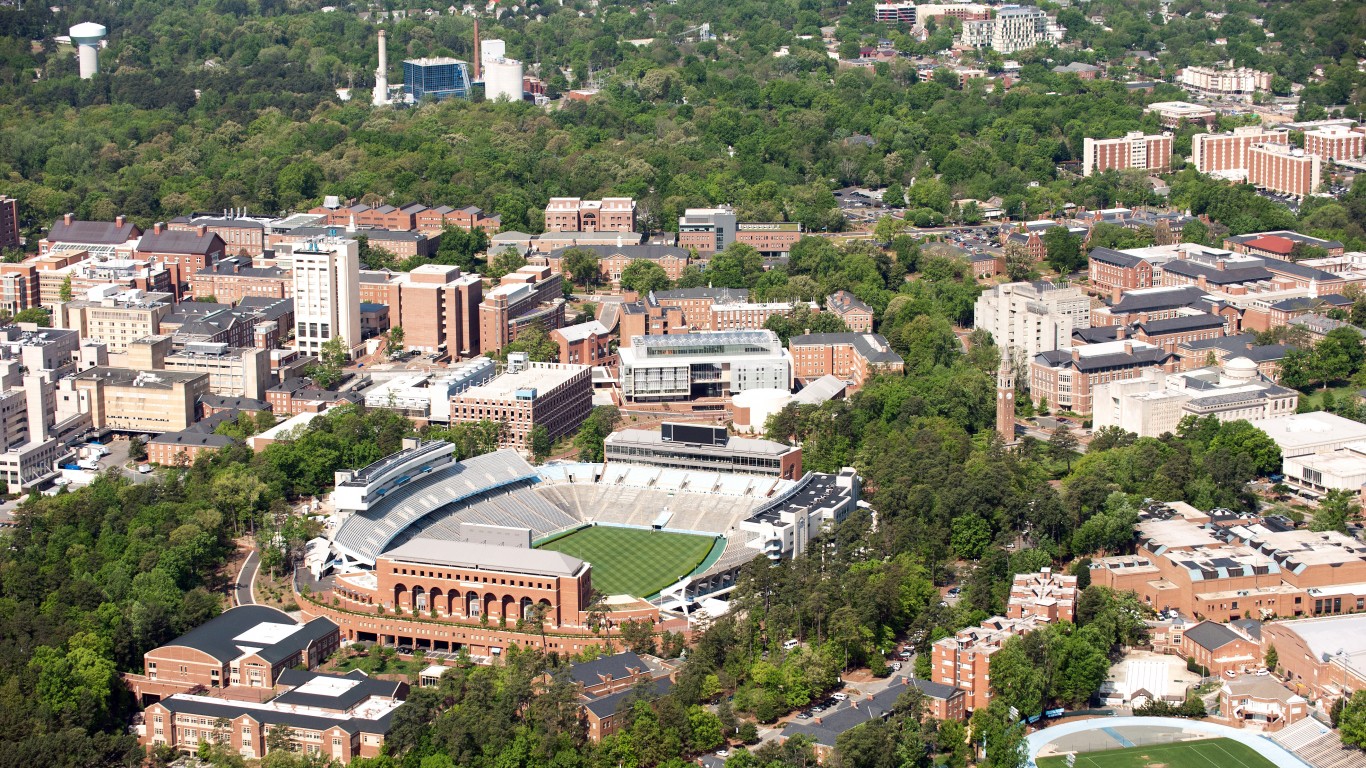
68. University of North Carolina at Chapel Hill, North Carolina
> 5 yr. increase in applications: 56.5%
> 2016-2017 applications: 34,889
> Total undergraduate enrollment: 18,862
> Acceptance rate: 26.9%
> Avg. annual cost: $11,100
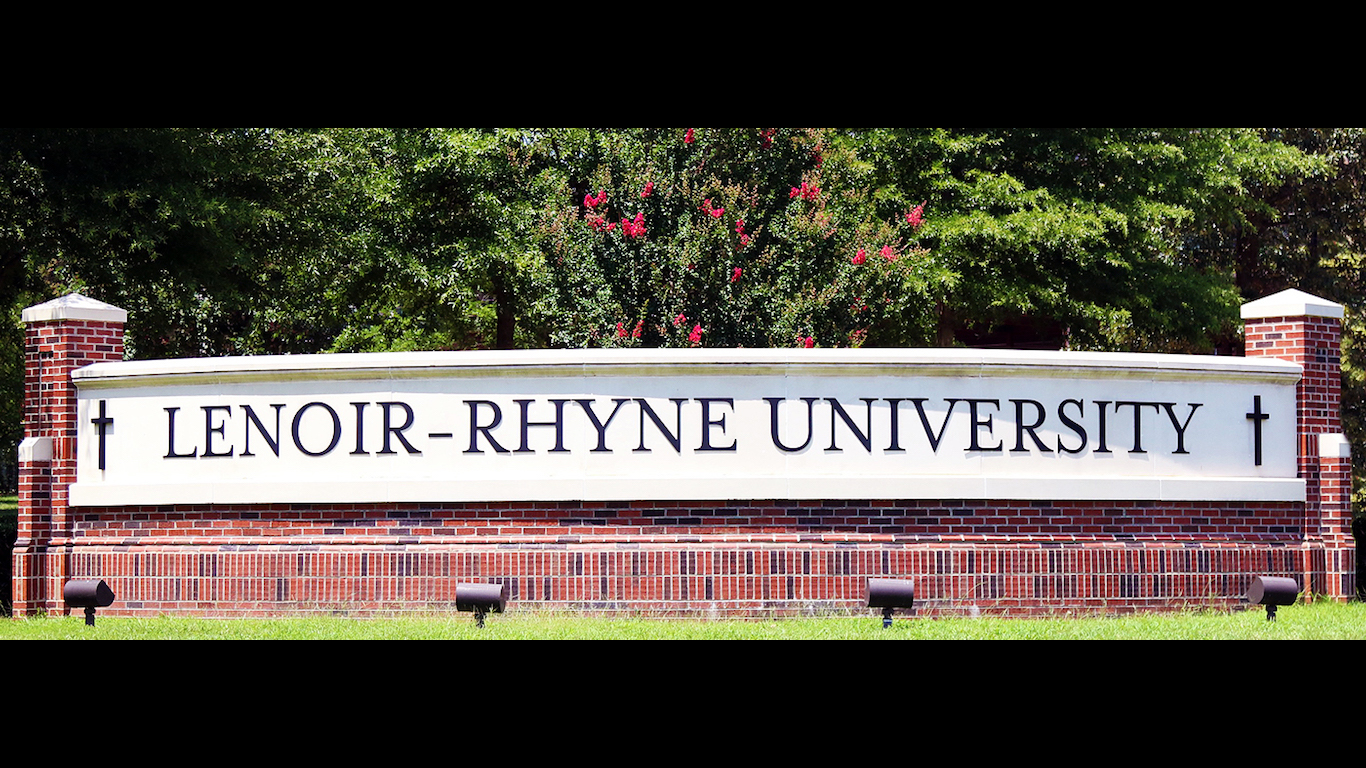
67. Lenoir-Rhyne University, North Carolina
> 5 yr. increase in applications: 56.6%
> 2016-2017 applications: 6,300
> Total undergraduate enrollment: 1,699
> Acceptance rate: 70.1%
> Avg. annual cost: $19,380
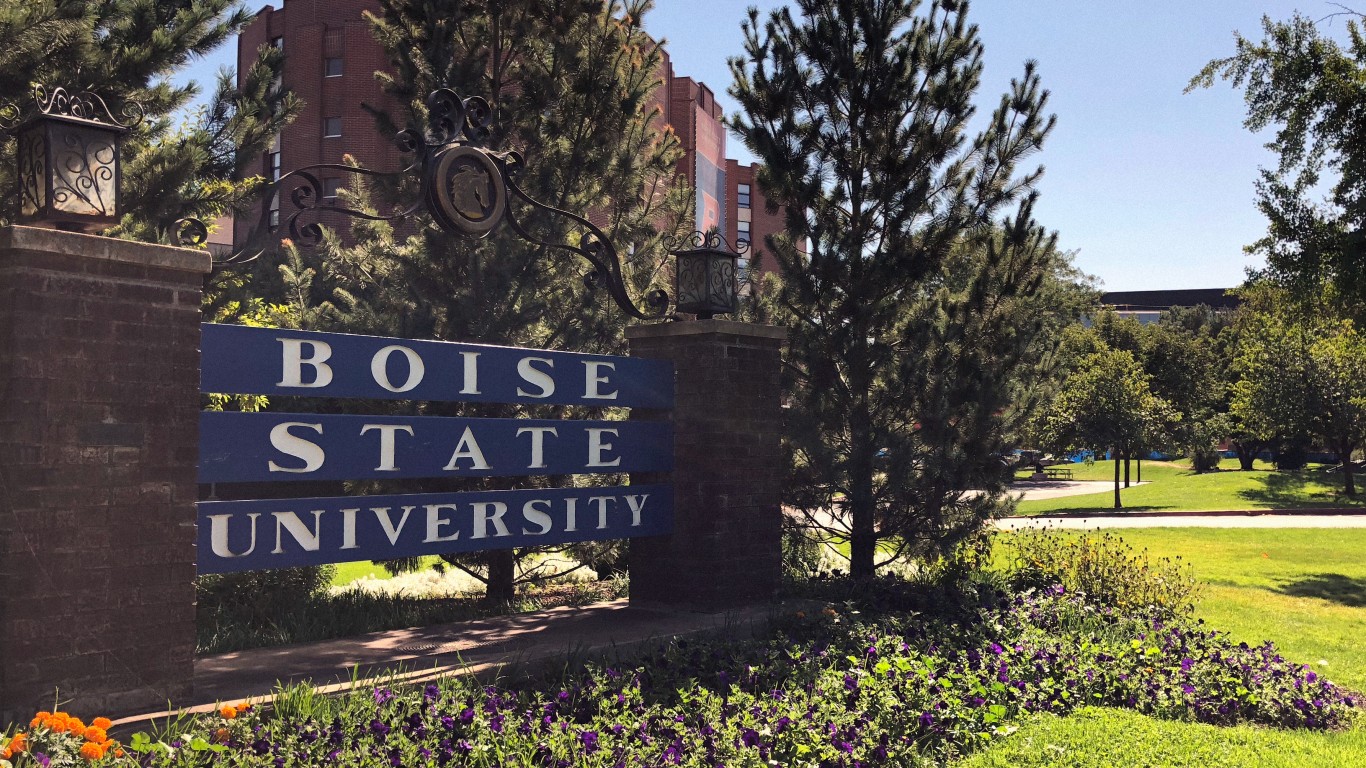
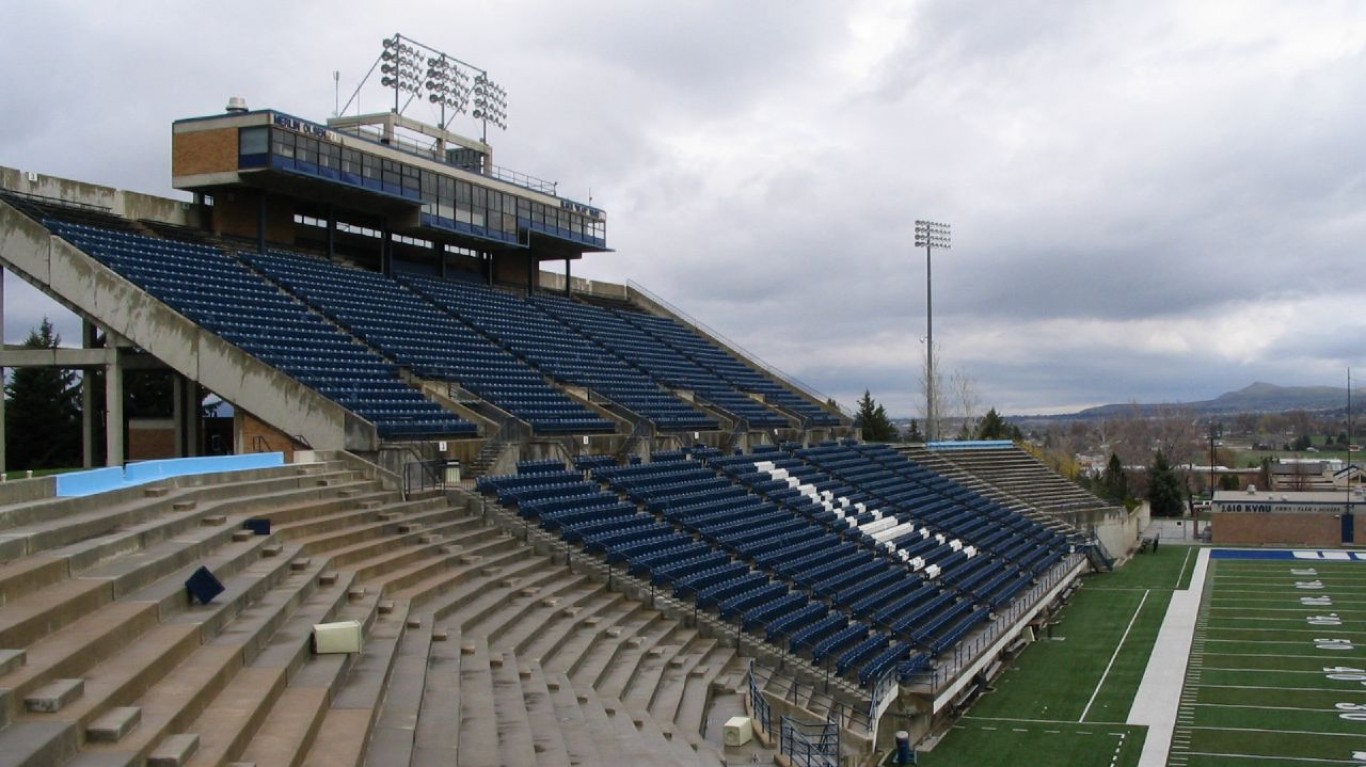
66. Boise State University, Idaho
> 5 yr. increase in applications: 56.9%
> 2016-2017 applications: 8,330
> Total undergraduate enrollment: 20,744
> Acceptance rate: 81.7%
> Avg. annual cost: $13,363
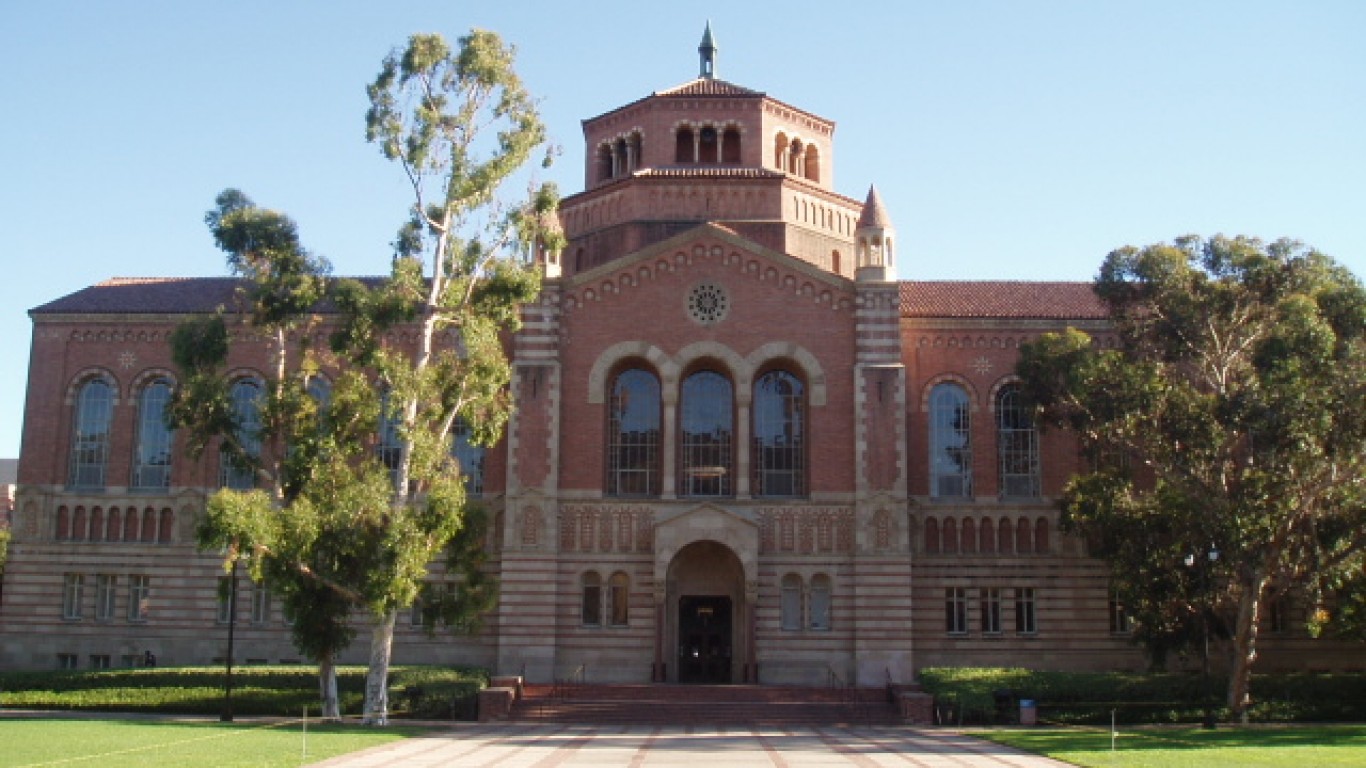
65. University of California-Los Angeles, California
> 5 yr. increase in applications: 57.8%
> 2016-2017 applications: 97,112
> Total undergraduate enrollment: 31,002
> Acceptance rate: 18.0%
> Avg. annual cost: $14,760
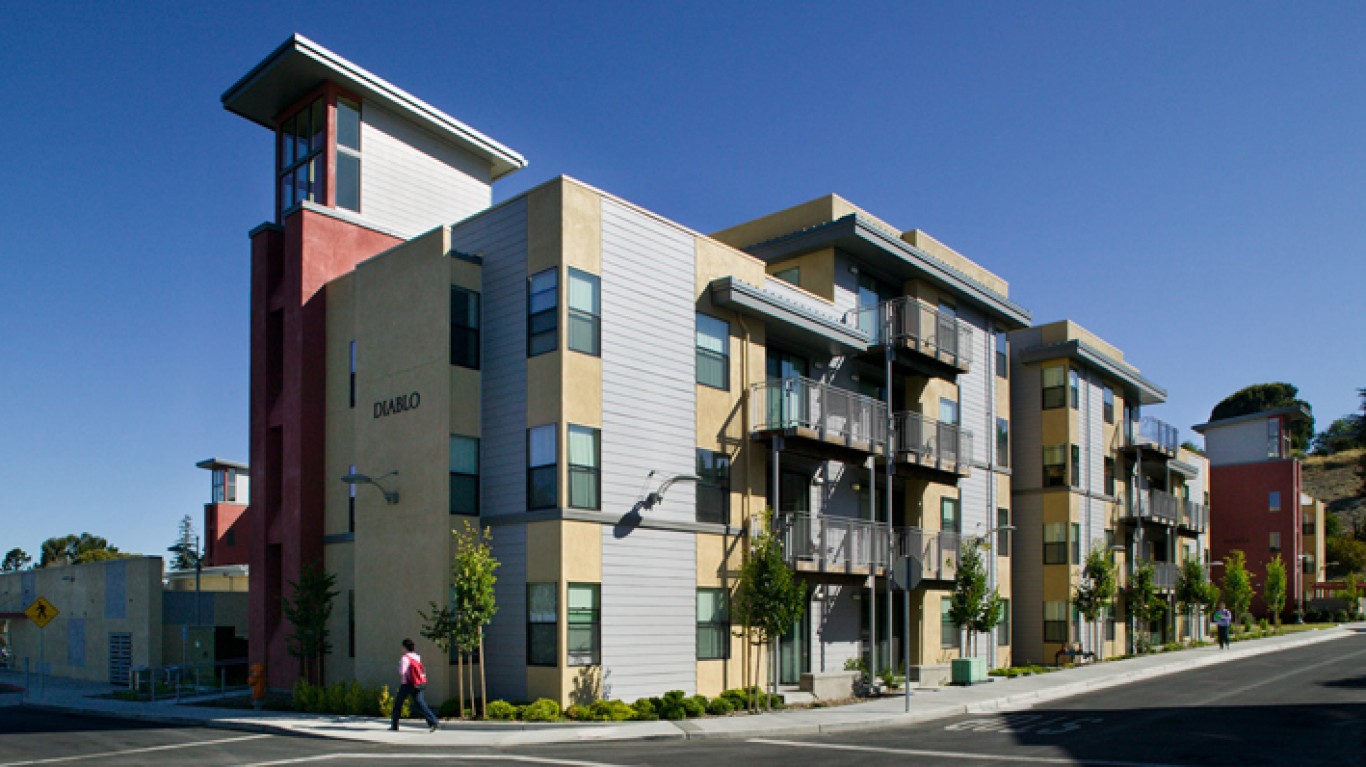
64. California State University-East Bay, California
> 5 yr. increase in applications: 57.9%
> 2016-2017 applications: 15,670
> Total undergraduate enrollment: 13,474
> Acceptance rate: 69.8%
> Avg. annual cost: $11,425
[in-text-ad-2]
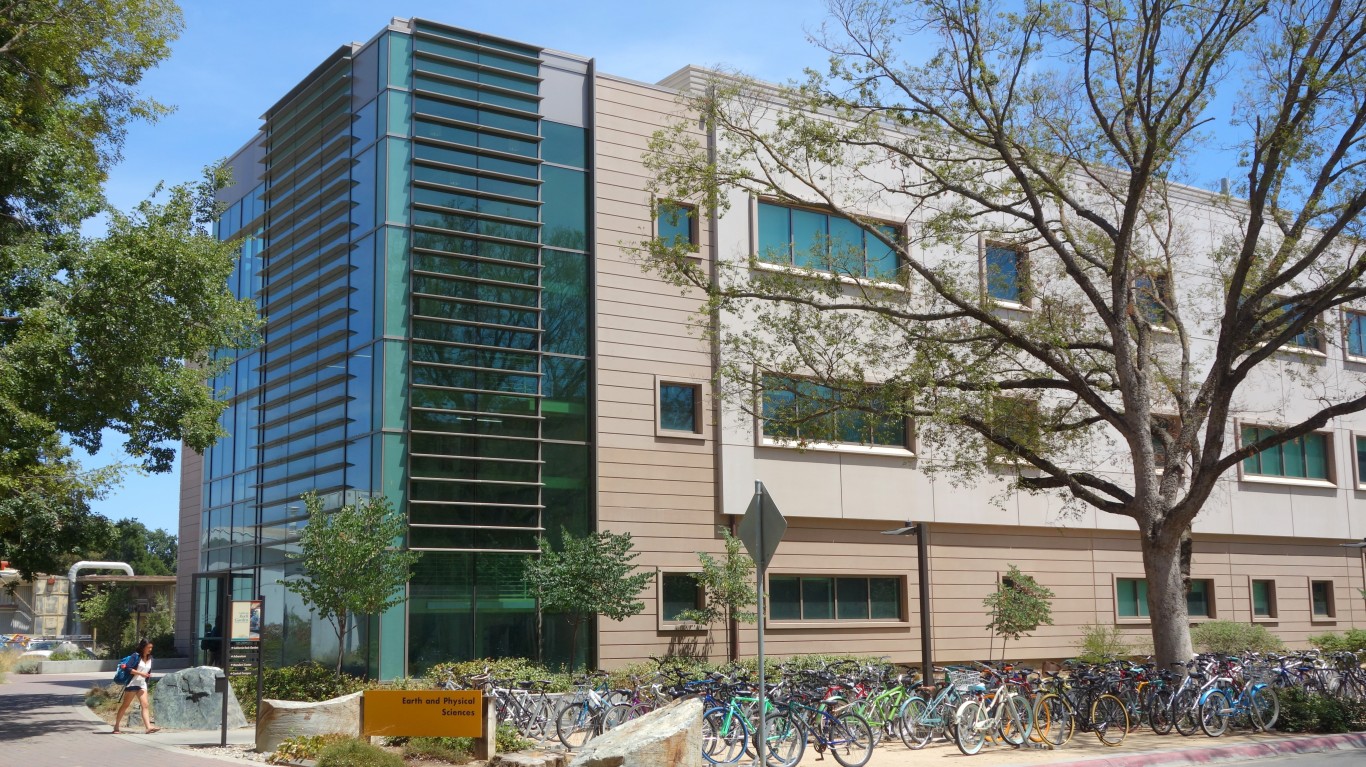
63. University of California-Davis, California
> 5 yr. increase in applications: 58.3%
> 2016-2017 applications: 68,553
> Total undergraduate enrollment: 30,066
> Acceptance rate: 42.3%
> Avg. annual cost: $16,446
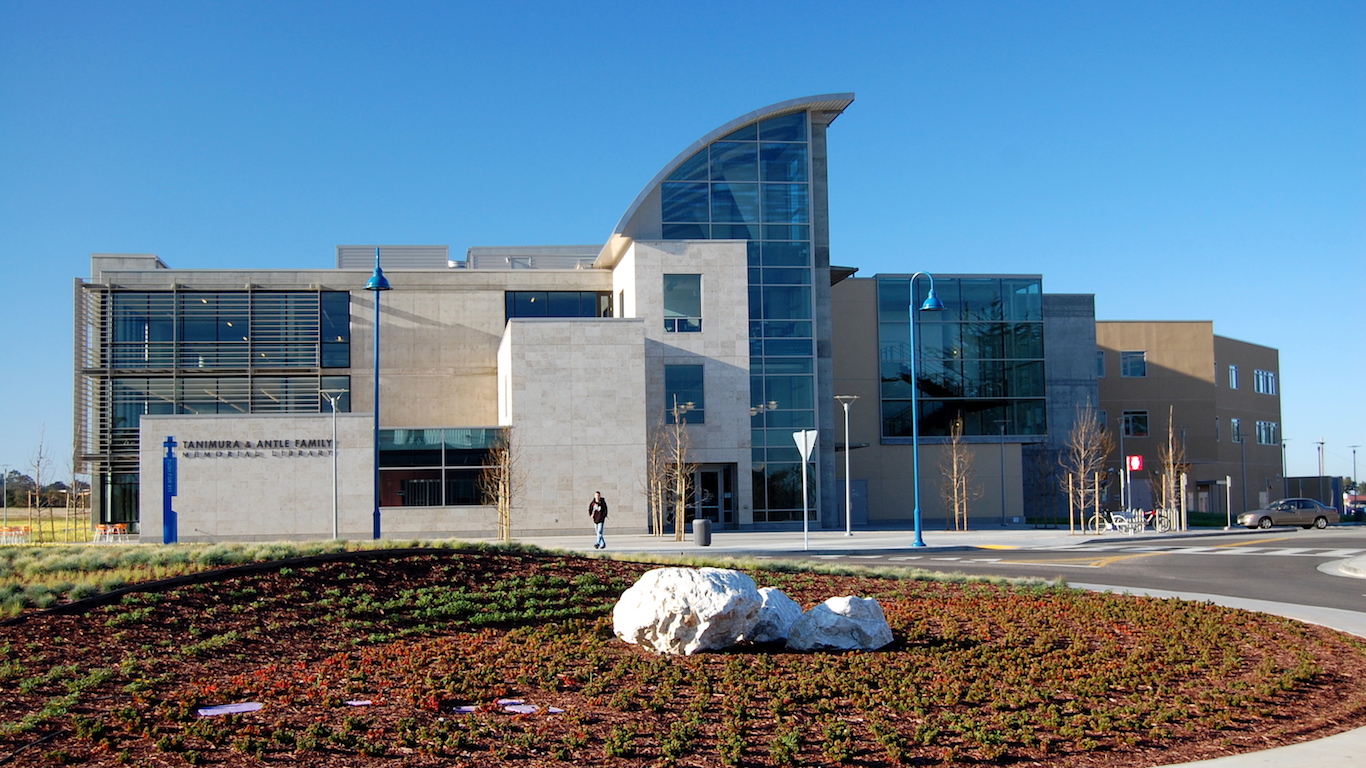
62. California State University-Monterey Bay, California
> 5 yr. increase in applications: 58.4%
> 2016-2017 applications: 16,258
> Total undergraduate enrollment: 6,764
> Acceptance rate: 35.2%
> Avg. annual cost: $11,233
61. Skidmore College, New York
> 5 yr. increase in applications: 58.8%
> 2016-2017 applications: 9,181
> Total undergraduate enrollment: 2,680
> Acceptance rate: 29.1%
> Avg. annual cost: $25,254
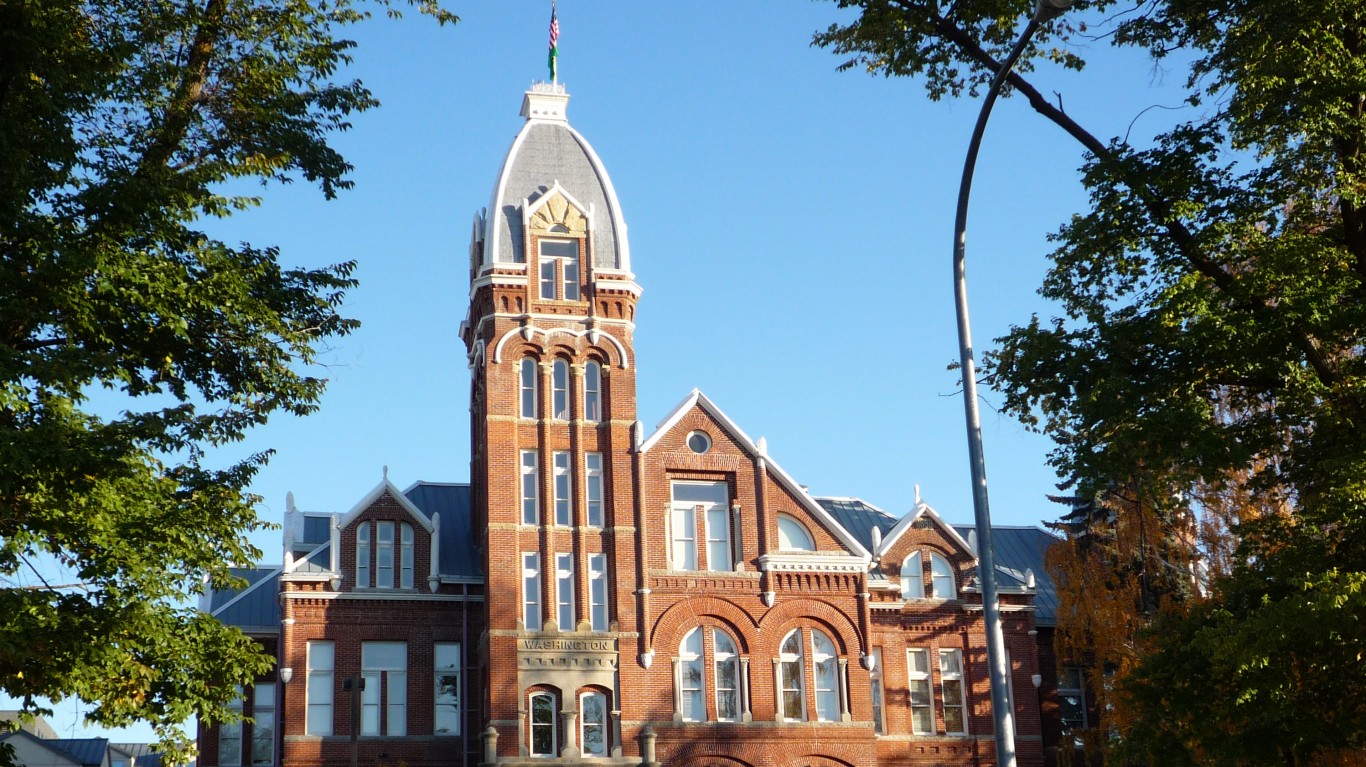
60. Central Washington University, Washington
> 5 yr. increase in applications: 59.2%
> 2016-2017 applications: 7,255
> Total undergraduate enrollment: 12,080
> Acceptance rate: 79.7%
> Avg. annual cost: $14,124
[in-text-ad]
59. Murray State University, Kentucky
> 5 yr. increase in applications: 59.7%
> 2016-2017 applications: 6,479
> Total undergraduate enrollment: 8,559
> Acceptance rate: 85.4%
> Avg. annual cost: $11,562
58. California State University-Bakersfield, California
> 5 yr. increase in applications: 60.1%
> 2016-2017 applications: 8,487
> Total undergraduate enrollment: 8,814
> Acceptance rate: 67.8%
> Avg. annual cost: $6,794
57. Colorado College, Colorado
> 5 yr. increase in applications: 60.5%
> 2016-2017 applications: 7,894
> Total undergraduate enrollment: 2,107
> Acceptance rate: 16.0%
> Avg. annual cost: $29,528
 24/7 Wall St.
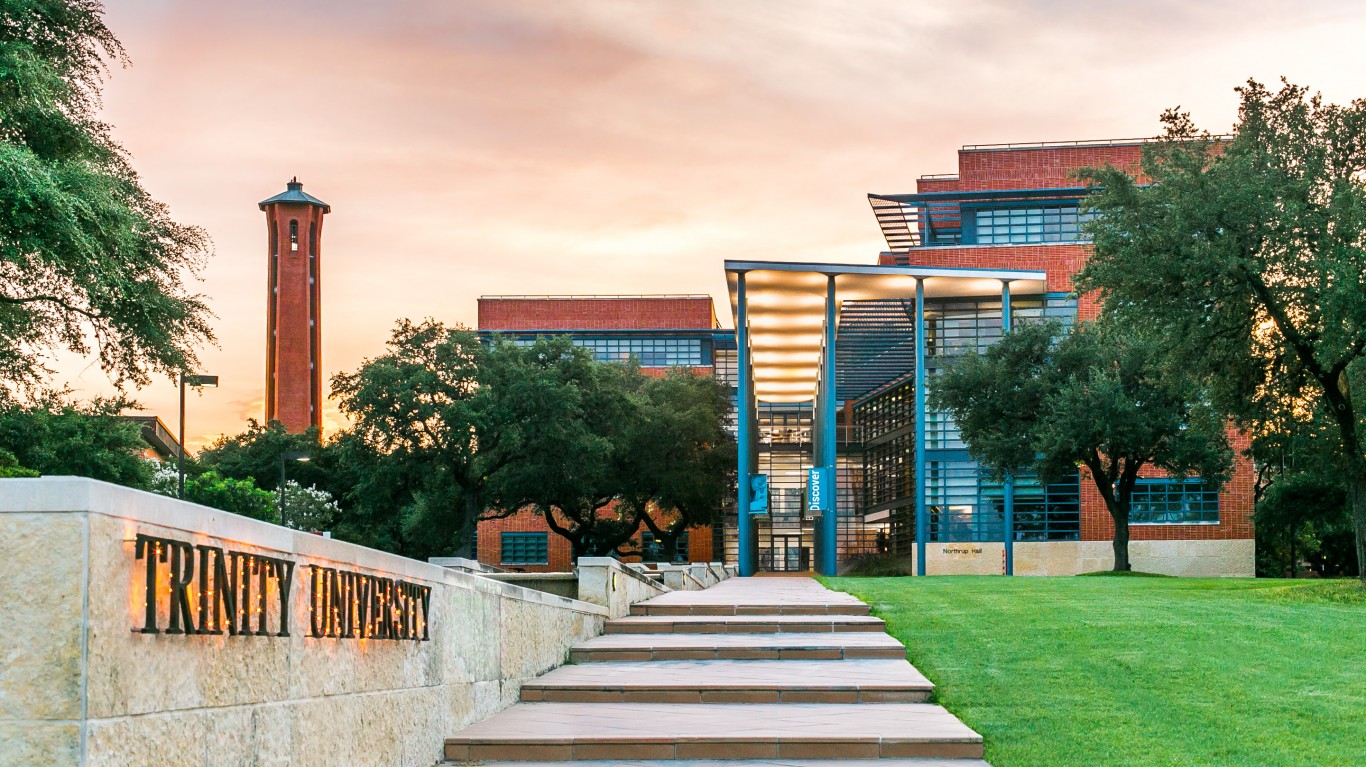
56. Trinity University, Texas
> 5 yr. increase in applications: 61.0%
> 2016-2017 applications: 7,255
> Total undergraduate enrollment: 2,395
> Acceptance rate: 40.7%
> Avg. annual cost: $28,540
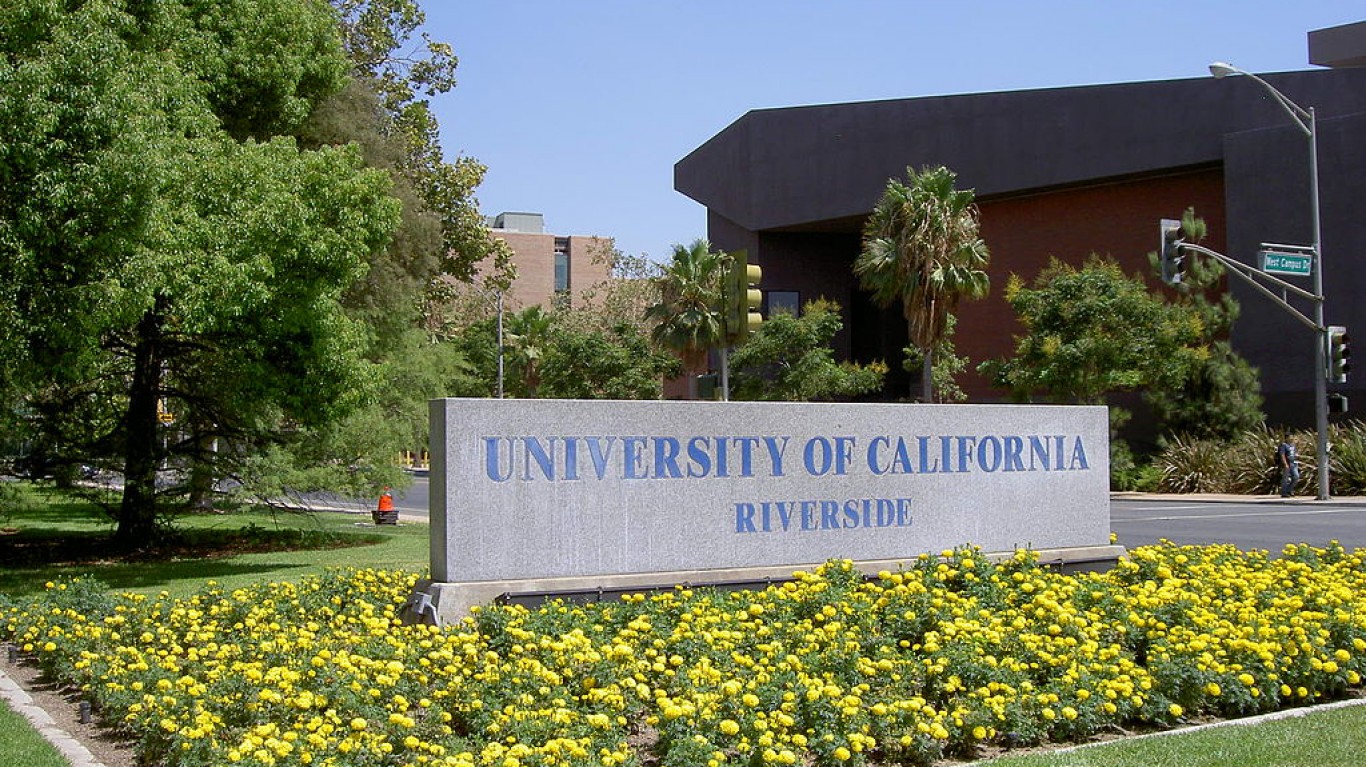
55. University of California-Riverside, California
> 5 yr. increase in applications: 61.0%
> 2016-2017 applications: 42,629
> Total undergraduate enrollment: 20,073
> Acceptance rate: 66.3%
> Avg. annual cost: $12,404
54. Miami University-Oxford, Ohio
> 5 yr. increase in applications: 61.1%
> 2016-2017 applications: 29,771
> Total undergraduate enrollment: 17,147
> Acceptance rate: 65.4%
> Avg. annual cost: $20,316
[in-text-ad-2]
53. Southern Connecticut State University, Connecticut
> 5 yr. increase in applications: 61.8%
> 2016-2017 applications: 8,625
> Total undergraduate enrollment: 7,947
> Acceptance rate: 63.5%
> Avg. annual cost: $15,234
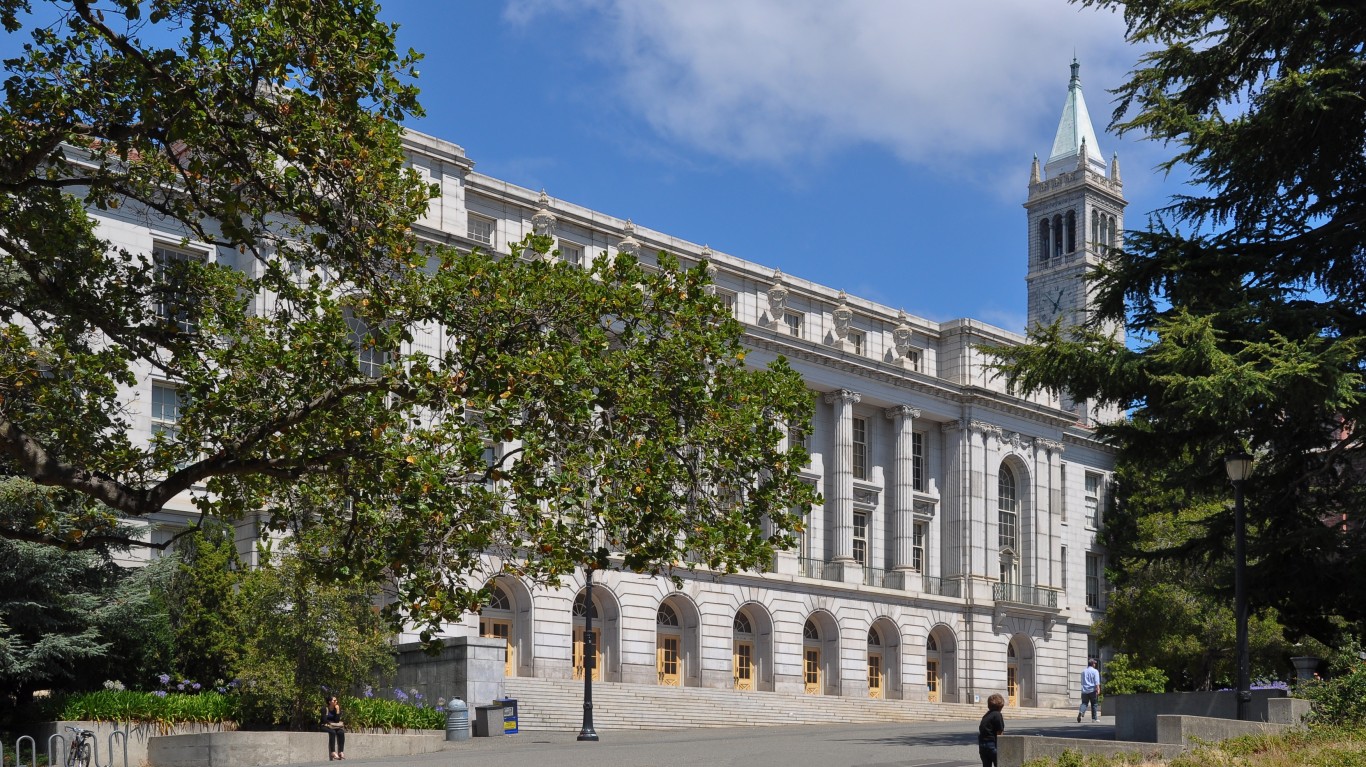
52. University of California-Berkeley, California
> 5 yr. increase in applications: 63.9%
> 2016-2017 applications: 82,561
> Total undergraduate enrollment: 30,574
> Acceptance rate: 16.9%
> Avg. annual cost: $18,178
51. Rowan University, New Jersey
> 5 yr. increase in applications: 64.2%
> 2016-2017 applications: 13,520
> Total undergraduate enrollment: 15,401
> Acceptance rate: 71.0%
> Avg. annual cost: $19,246
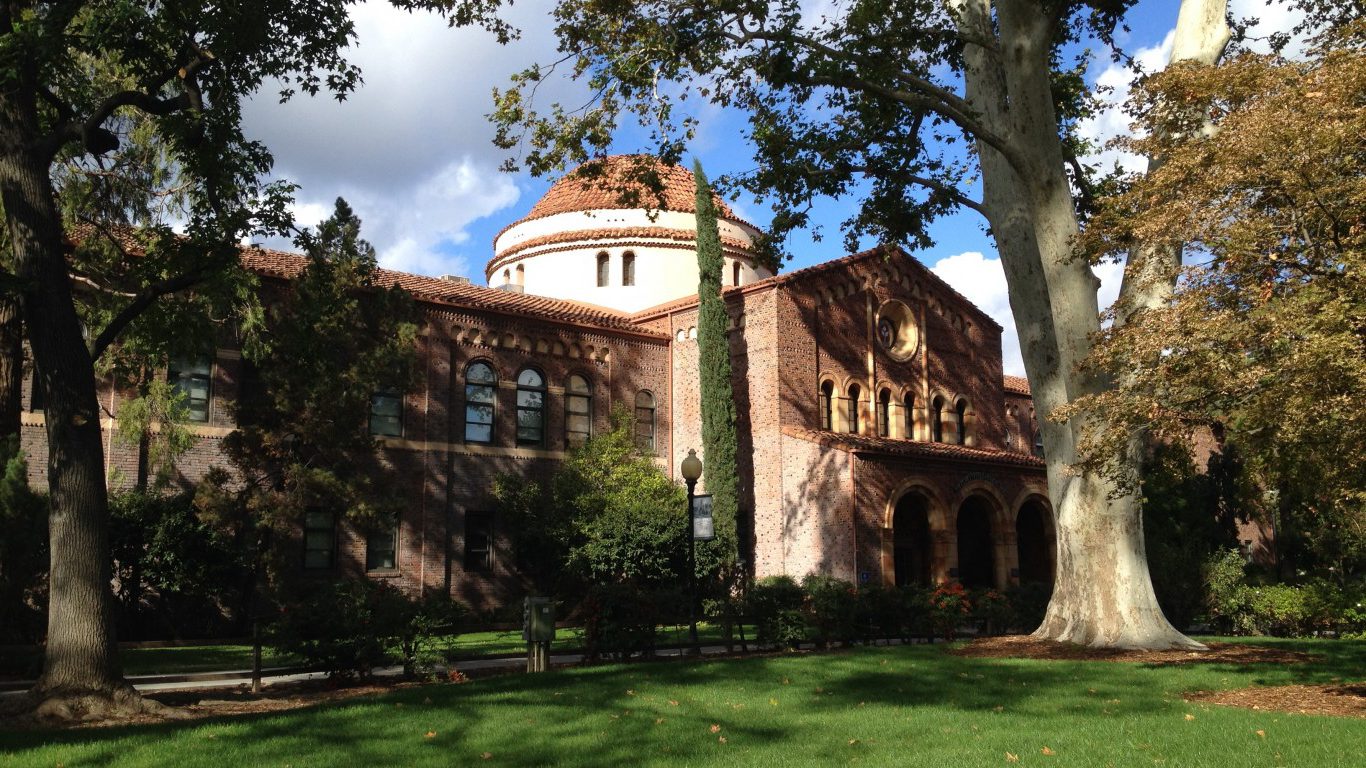
50. California State University-Chico, California
> 5 yr. increase in applications: 64.3%
> 2016-2017 applications: 23,591
> Total undergraduate enrollment: 16,710
> Acceptance rate: 65.2%
> Avg. annual cost: $14,185
[in-text-ad]
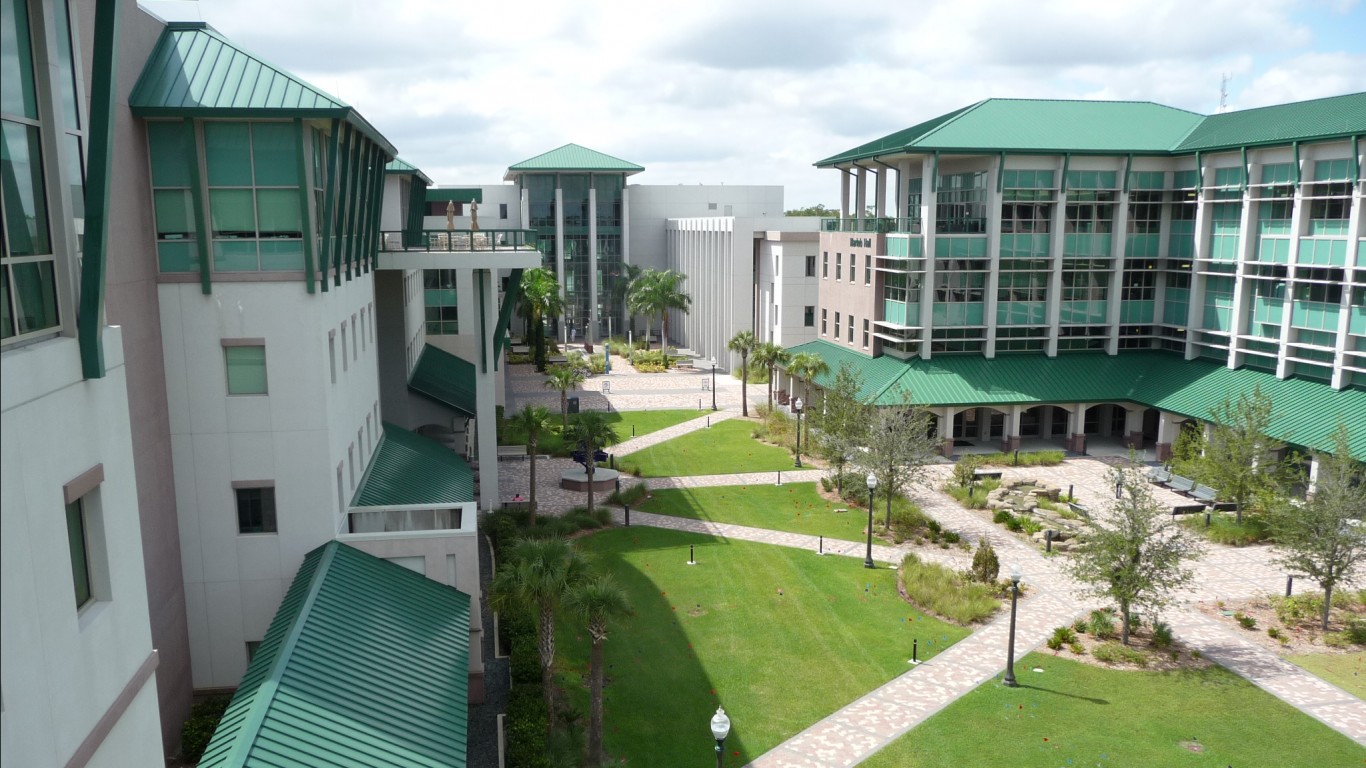
49. Florida Gulf Coast University, Florida
> 5 yr. increase in applications: 64.7%
> 2016-2017 applications: 15,153
> Total undergraduate enrollment: 13,854
> Acceptance rate: 56.1%
> Avg. annual cost: $13,456
48. Purdue University-Main Campus, Indiana
> 5 yr. increase in applications: 64.9%
> 2016-2017 applications: 49,007
> Total undergraduate enrollment: 32,132
> Acceptance rate: 56.0%
> Avg. annual cost: $12,117
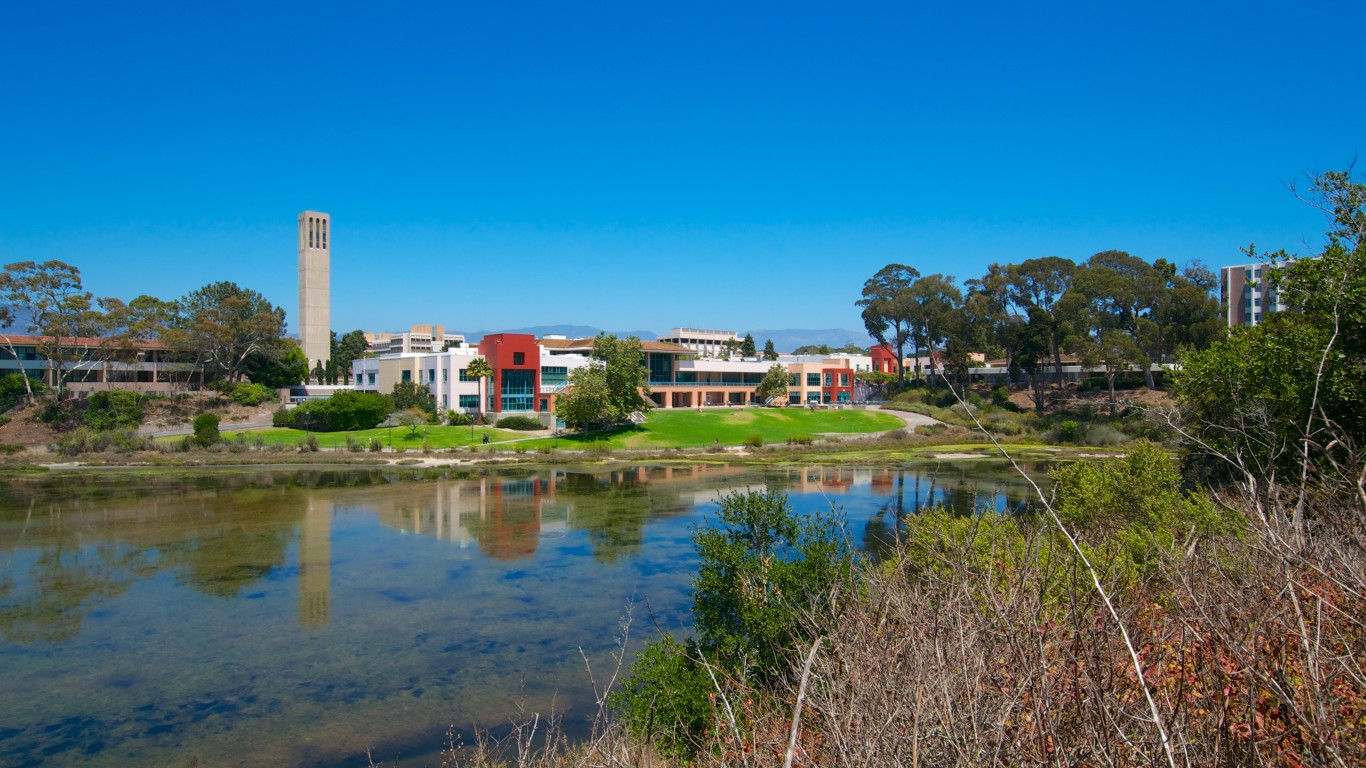
47. University of California-Santa Barbara, California
> 5 yr. increase in applications: 65.0%
> 2016-2017 applications: 77,112
> Total undergraduate enrollment: 22,186
> Acceptance rate: 35.8%
> Avg. annual cost: $16,154
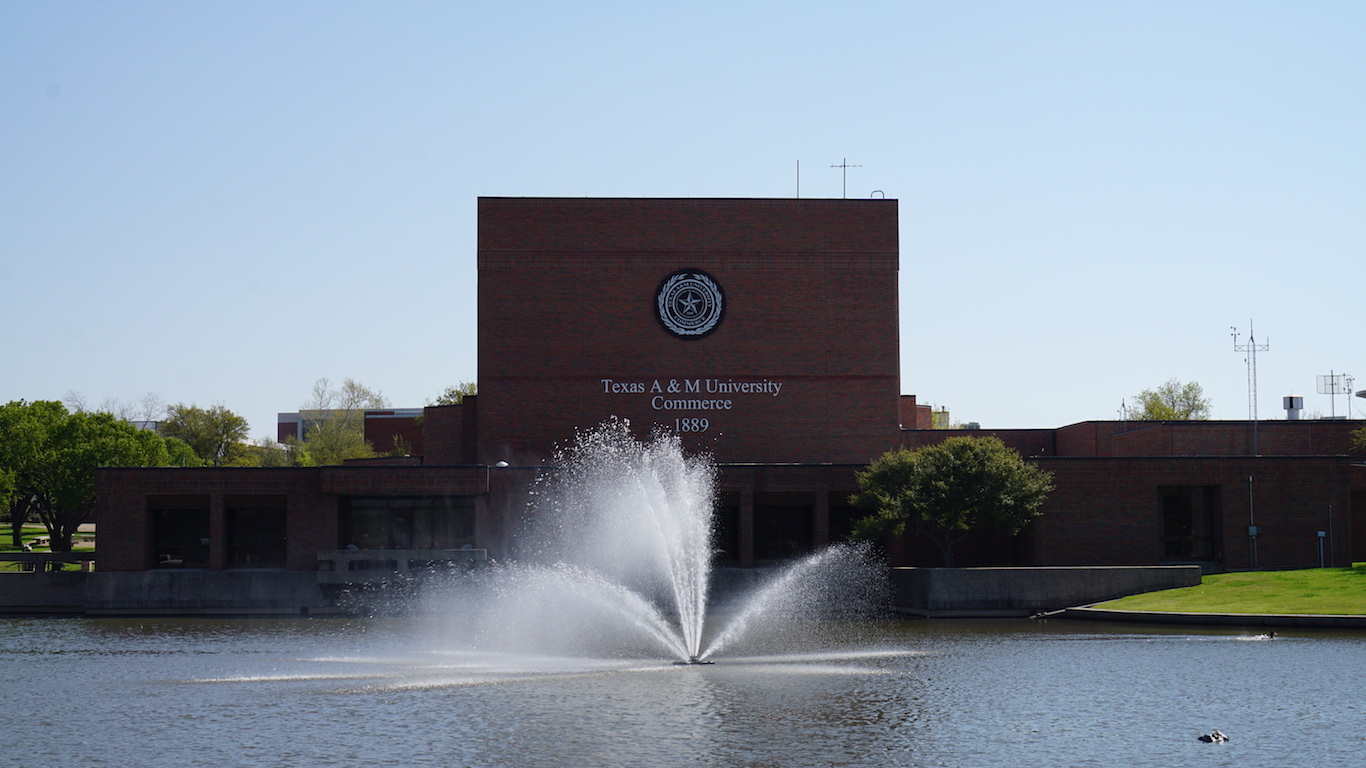
46. Texas A & M University-Commerce, Texas
> 5 yr. increase in applications: 65.6%
> 2016-2017 applications: 7,805
> Total undergraduate enrollment: 8,494
> Acceptance rate: 46.1%
> Avg. annual cost: $11,396
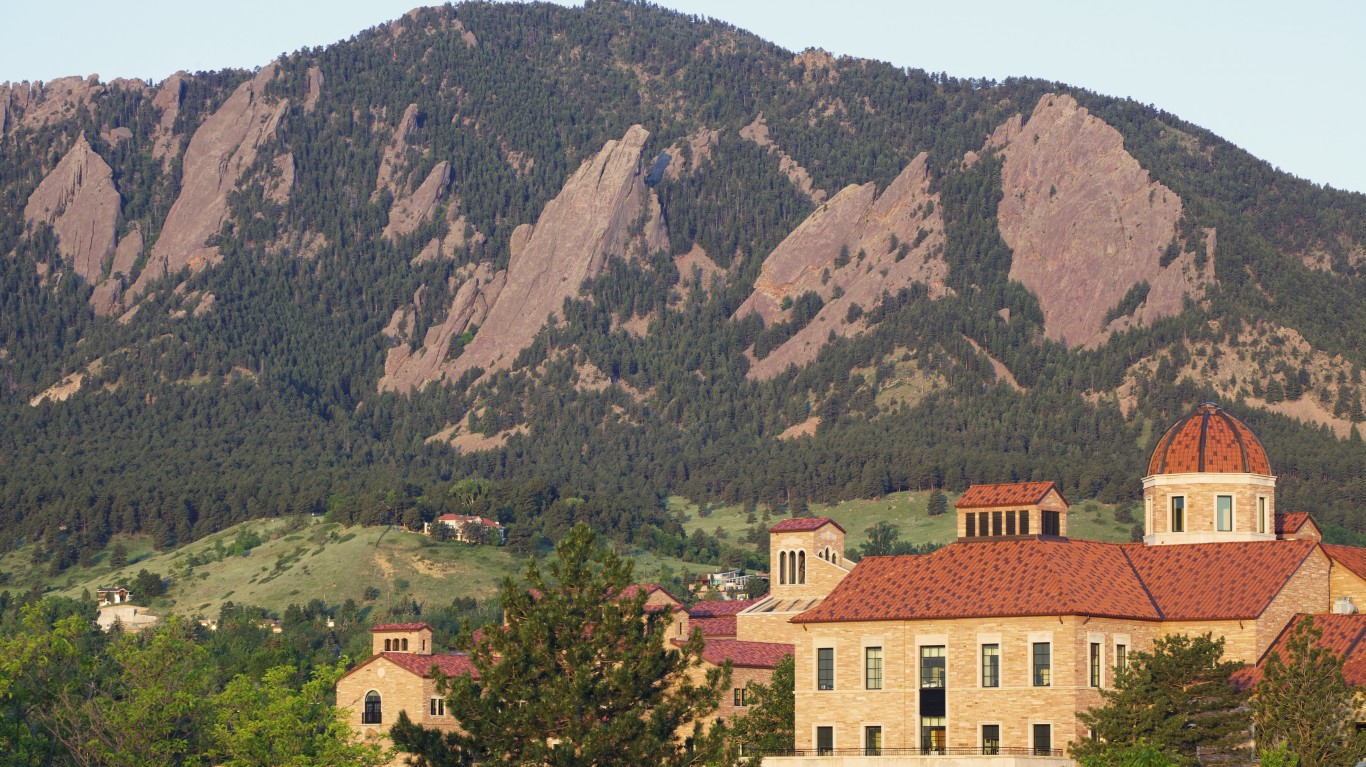
45. University of Colorado Boulder, Colorado
> 5 yr. increase in applications: 66.0%
> 2016-2017 applications: 34,047
> Total undergraduate enrollment: 29,056
> Acceptance rate: 76.6%
> Avg. annual cost: $20,323
44. North Carolina A & T State University, North Carolina
> 5 yr. increase in applications: 66.8%
> 2016-2017 applications: 10,367
> Total undergraduate enrollment: 10,341
> Acceptance rate: 53.6%
> Avg. annual cost: $11,049
[in-text-ad-2]
43. Cleveland State University, Ohio
> 5 yr. increase in applications: 66.8%
> 2016-2017 applications: 8,528
> Total undergraduate enrollment: 12,078
> Acceptance rate: 87.5%
> Avg. annual cost: $15,320
42. Iona College, New York
> 5 yr. increase in applications: 67.1%
> 2016-2017 applications: 10,896
> Total undergraduate enrollment: 3,178
> Acceptance rate: 91.5%
> Avg. annual cost: $27,000
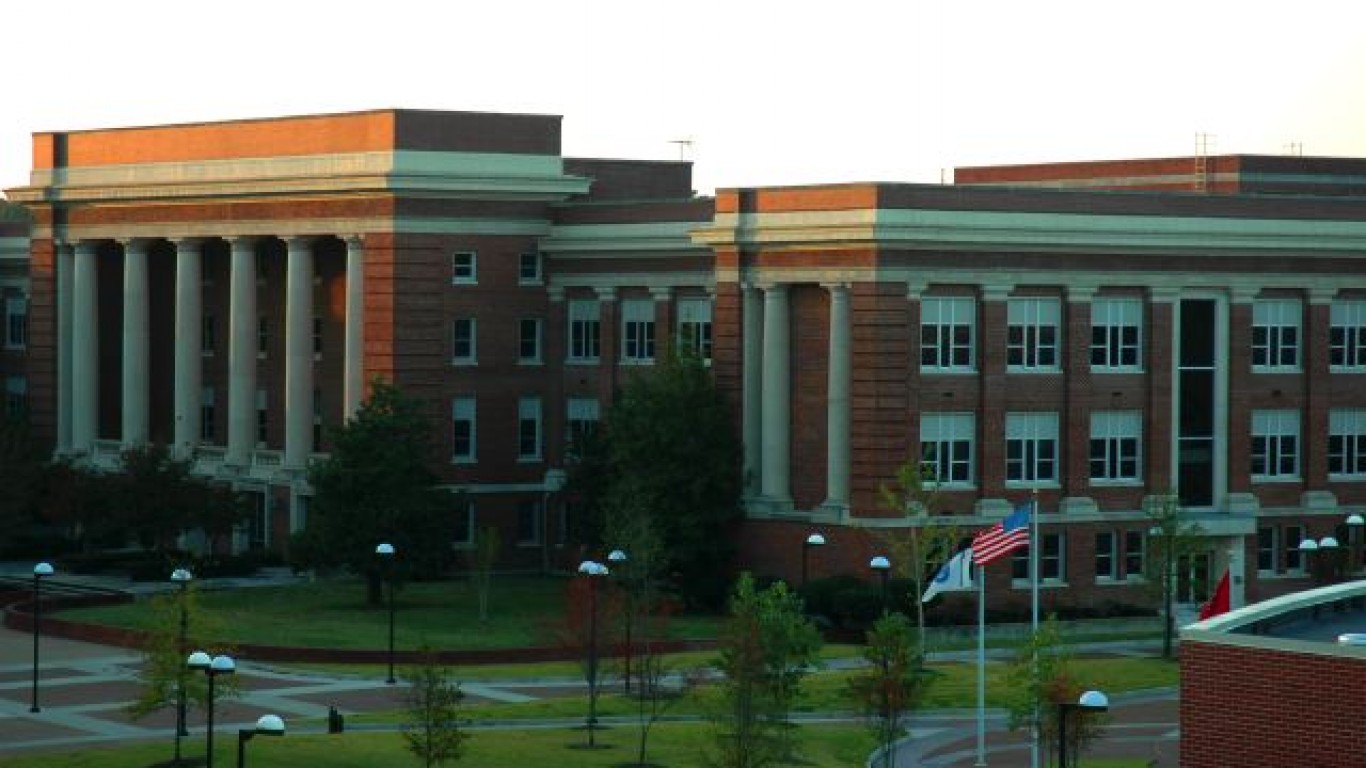
41. University of Alabama at Birmingham, Alabama
> 5 yr. increase in applications: 69.7%
> 2016-2017 applications: 9,459
> Total undergraduate enrollment: 13,134
> Acceptance rate: 58.1%
> Avg. annual cost: $17,016
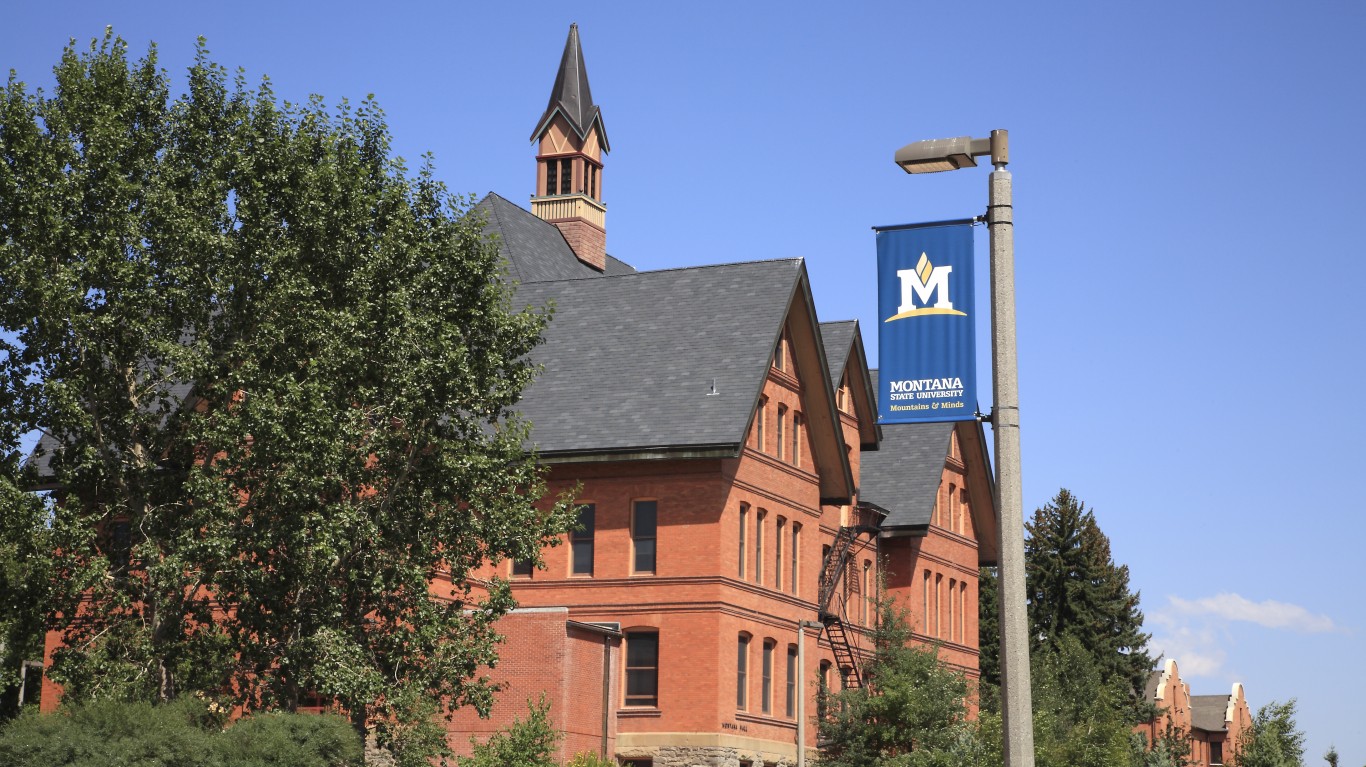
40. Montana State University, Montana
> 5 yr. increase in applications: 69.9%
> 2016-2017 applications: 15,996
> Total undergraduate enrollment: 14,652
> Acceptance rate: 82.9%
> Avg. annual cost: $15,411
[in-text-ad]
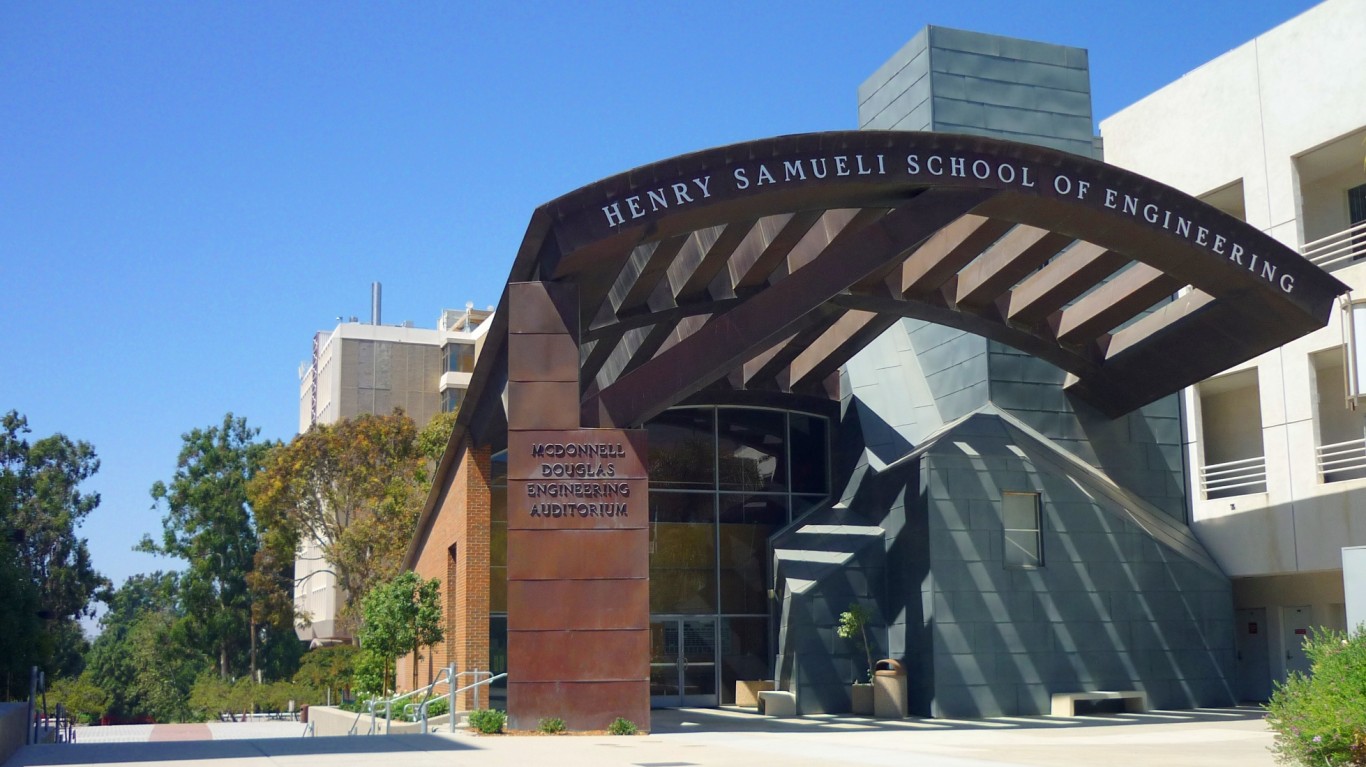
39. University of California-Irvine, California
> 5 yr. increase in applications: 70.1%
> 2016-2017 applications: 77,816
> Total undergraduate enrollment: 29,307
> Acceptance rate: 40.6%
> Avg. annual cost: $13,944
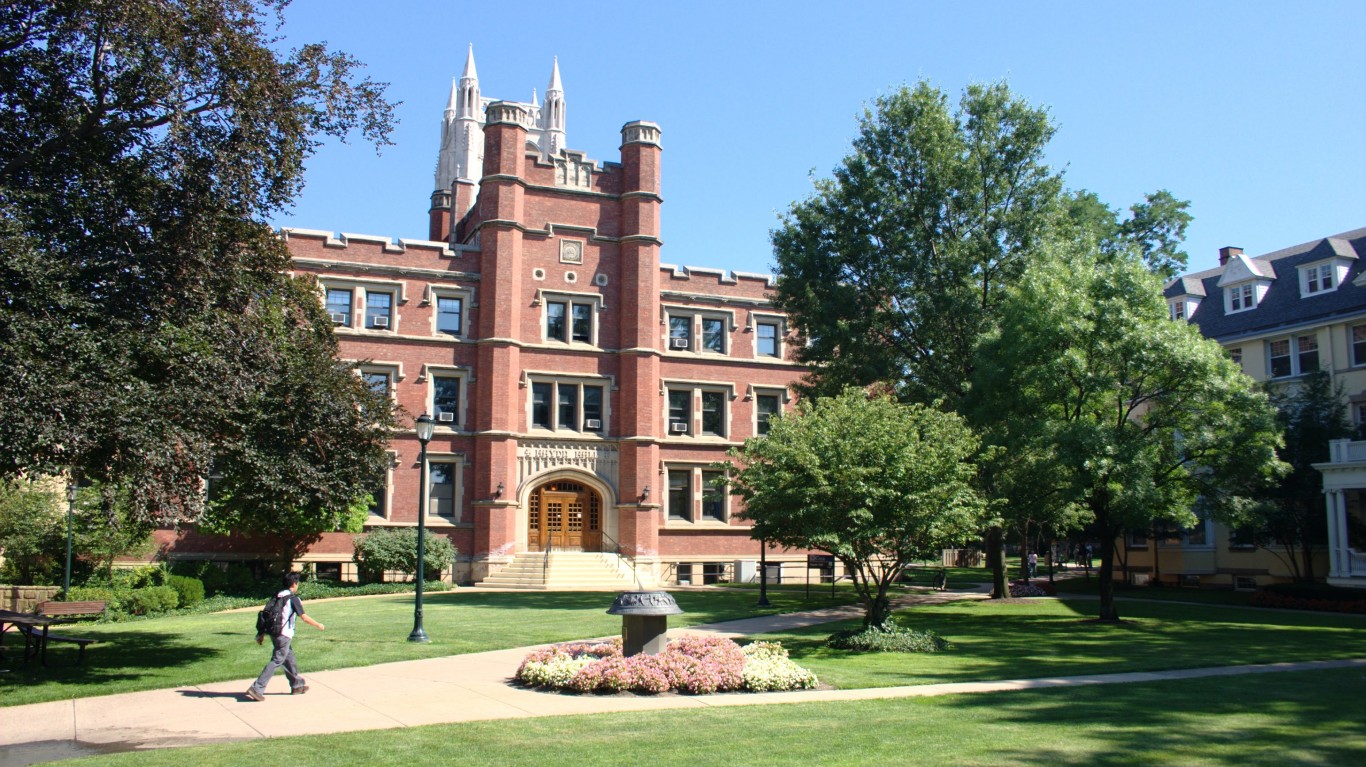
38. Case Western Reserve University, Ohio
> 5 yr. increase in applications: 70.6%
> 2016-2017 applications: 23,115
> Total undergraduate enrollment: 5,150
> Acceptance rate: 35.4%
> Avg. annual cost: $34,973
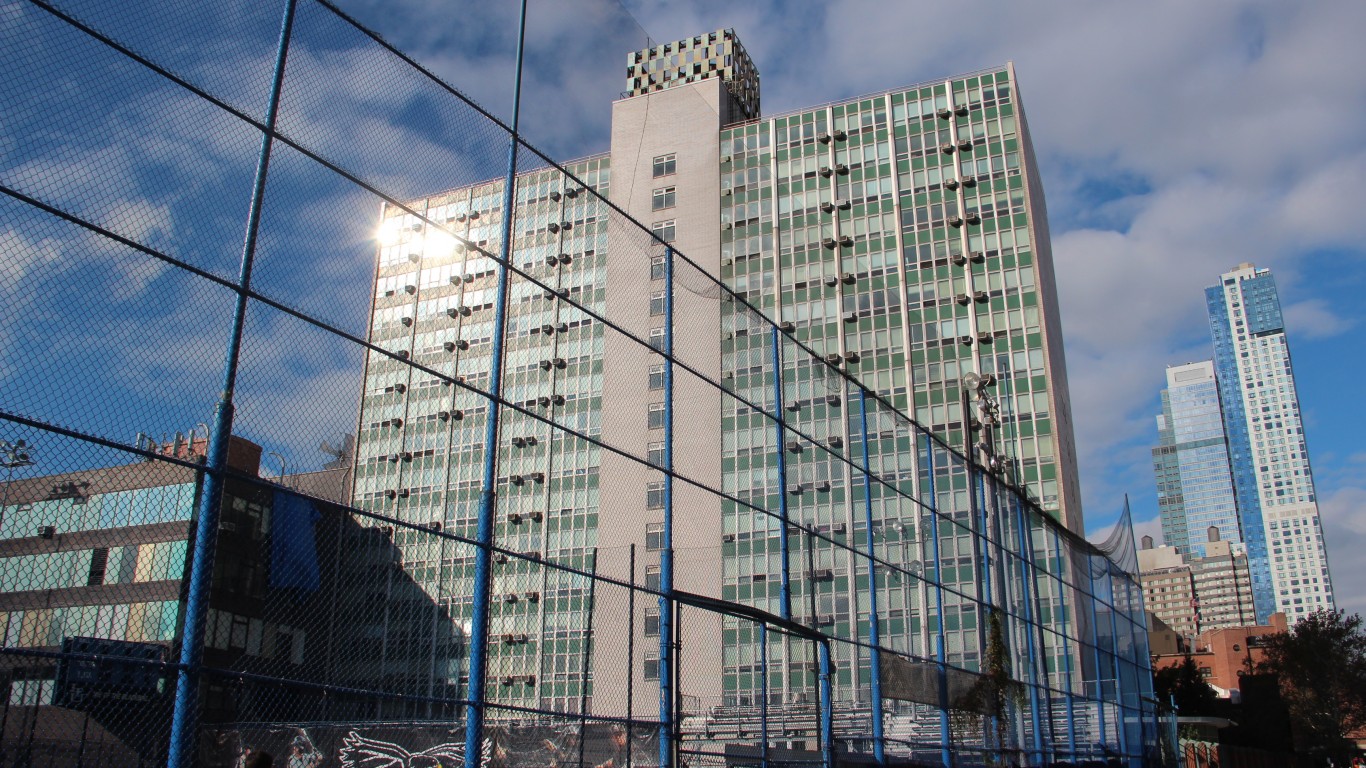
37. LIU Brooklyn, New York
> 5 yr. increase in applications: 70.6%
> 2016-2017 applications: 7,273
> Total undergraduate enrollment: 3,945
> Acceptance rate: 87.5%
> Avg. annual cost: $26,771
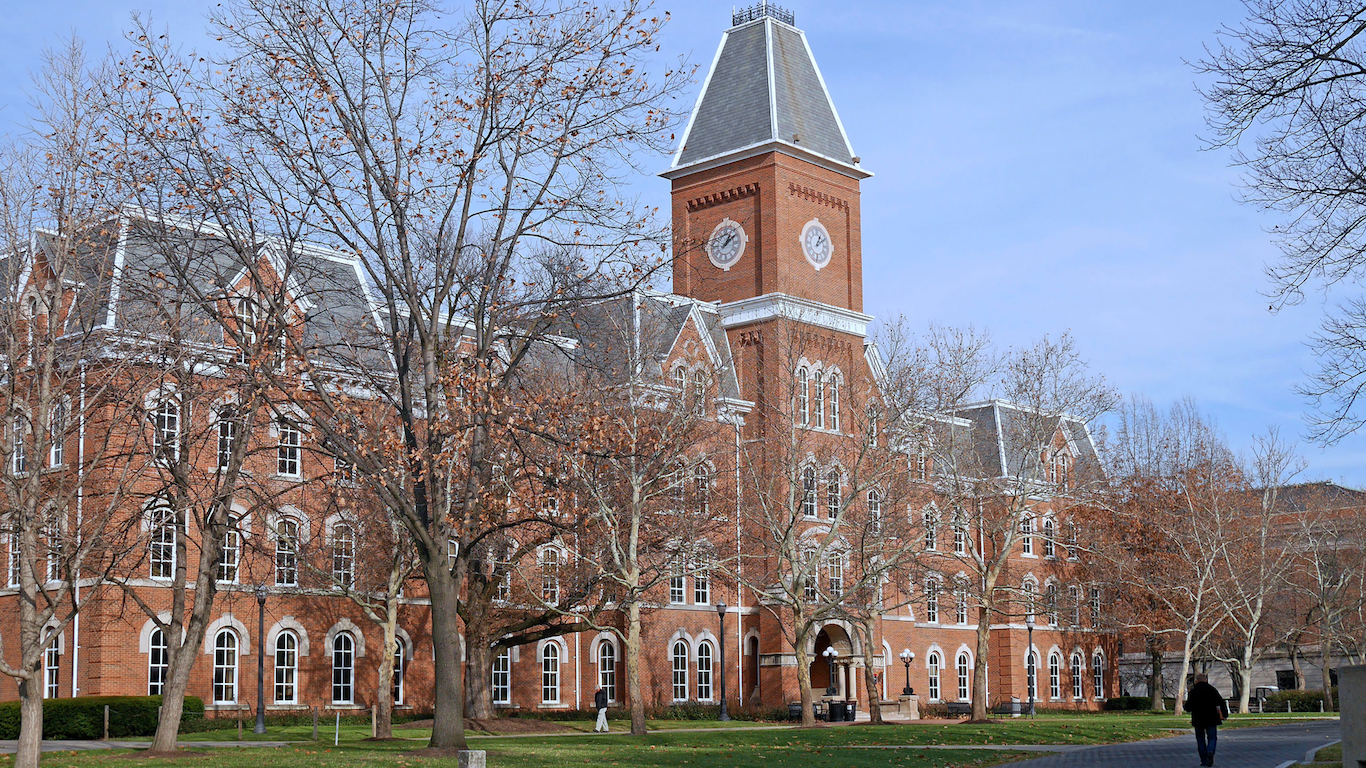
36. Ohio State University-Main Campus, Ohio
> 5 yr. increase in applications: 71.8%
> 2016-2017 applications: 44,845
> Total undergraduate enrollment: 45,946
> Acceptance rate: 54.1%
> Avg. annual cost: $18,042
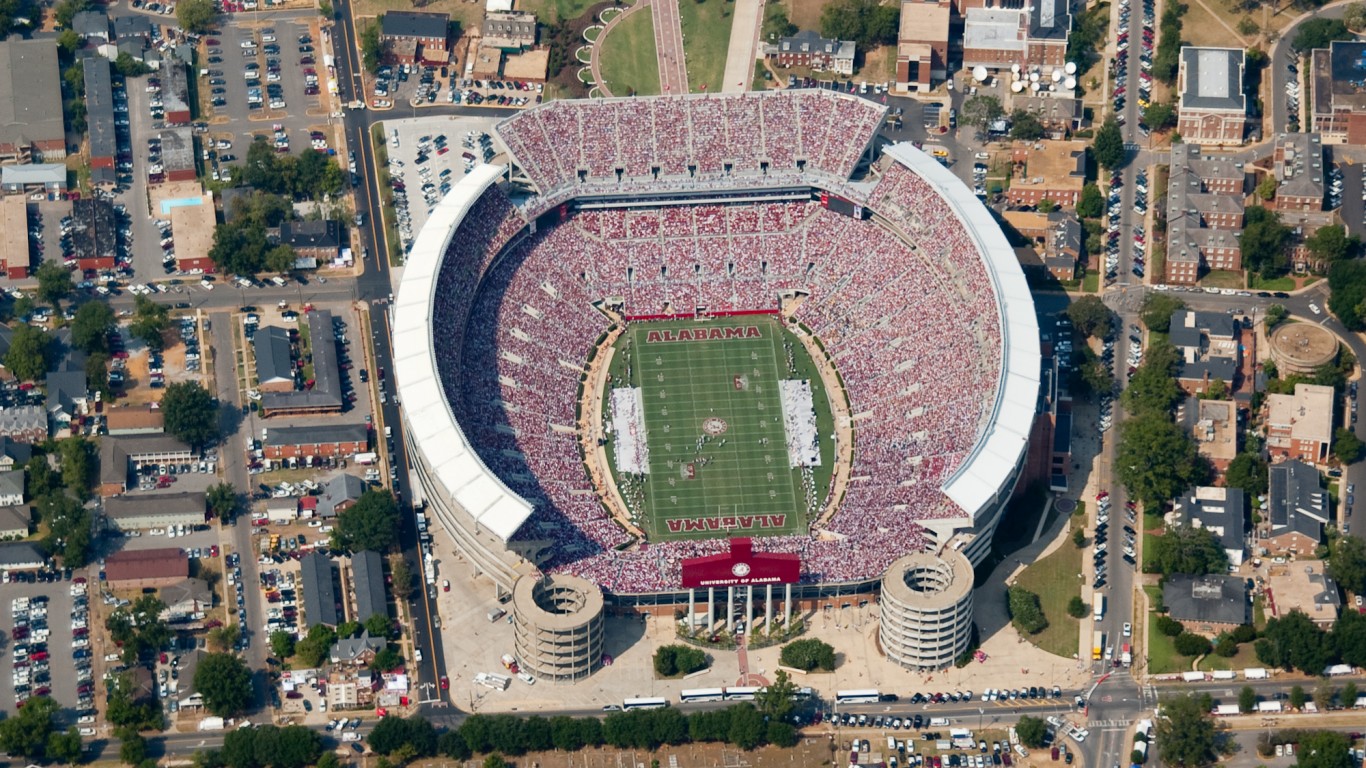
35. The University of Alabama, Alabama
> 5 yr. increase in applications: 72.7%
> 2016-2017 applications: 38,237
> Total undergraduate enrollment: 33,305
> Acceptance rate: 52.6%
> Avg. annual cost: $19,993
34. Ball State University, Indiana
> 5 yr. increase in applications: 72.9%
> 2016-2017 applications: 24,735
> Total undergraduate enrollment: 17,004
> Acceptance rate: 62.3%
> Avg. annual cost: $13,535
[in-text-ad-2]
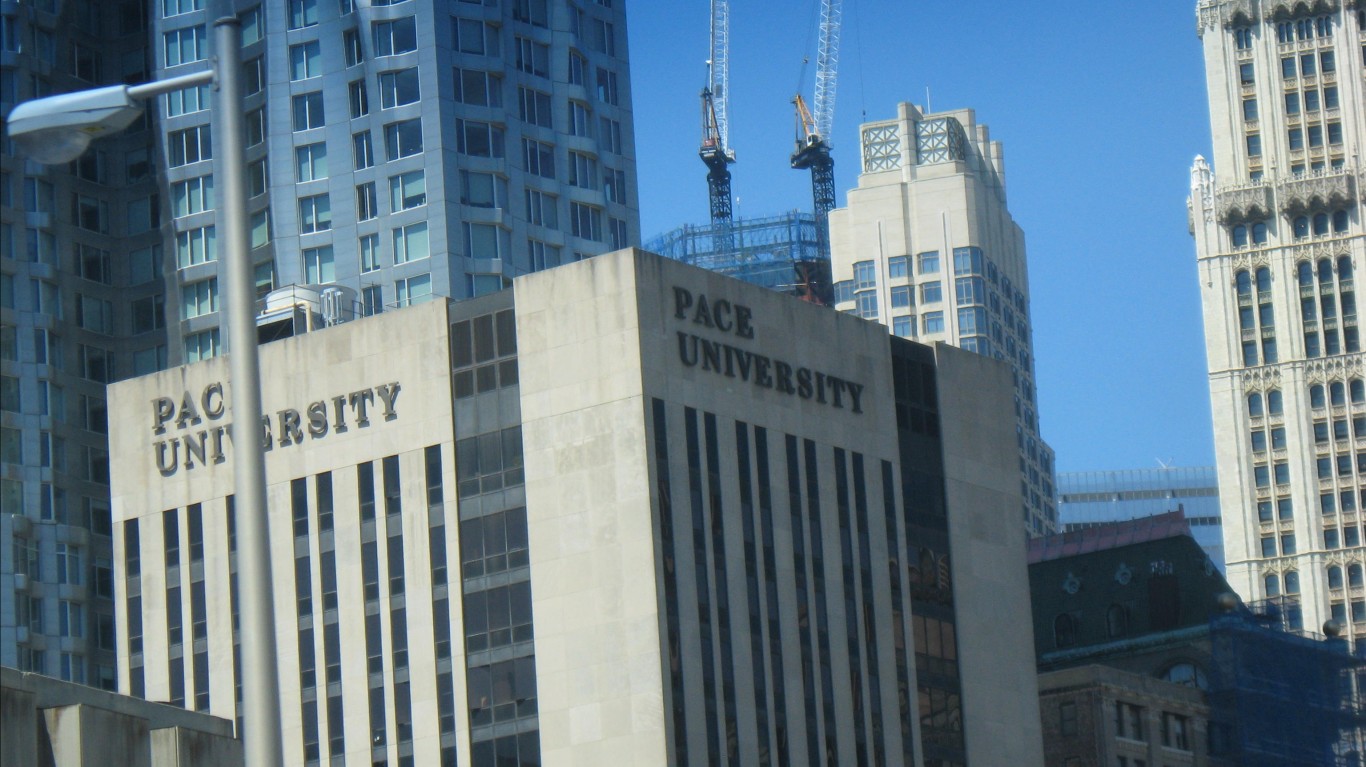
33. Pace University-New York, New York
> 5 yr. increase in applications: 73.9%
> 2016-2017 applications: 18,470
> Total undergraduate enrollment: 8,674
> Acceptance rate: 83.7%
> Avg. annual cost: $31,734
32. Temple University, Pennsylvania
> 5 yr. increase in applications: 74.6%
> 2016-2017 applications: 33,139
> Total undergraduate enrollment: 29,580
> Acceptance rate: 52.2%
> Avg. annual cost: $22,940
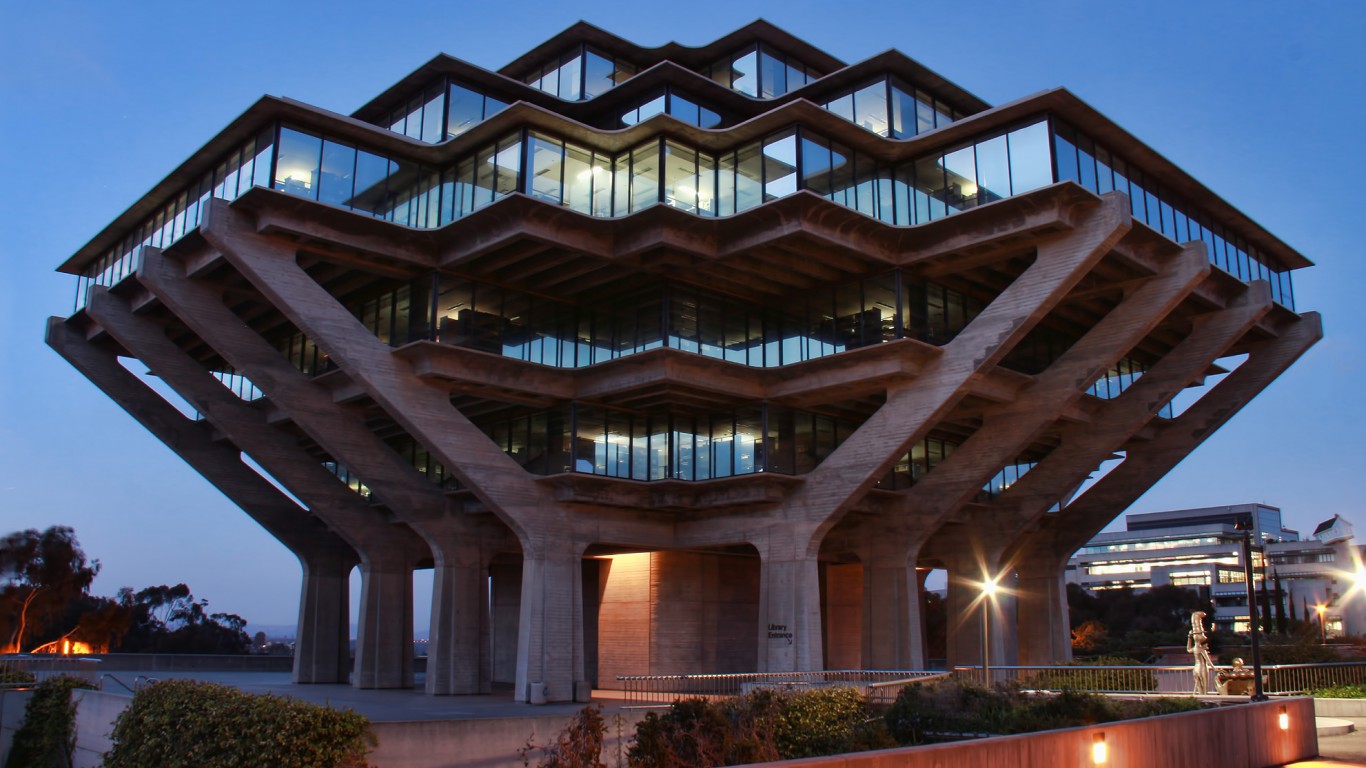
31. University of California-San Diego, California
> 5 yr. increase in applications: 75.1%
> 2016-2017 applications: 84,208
> Total undergraduate enrollment: 28,587
> Acceptance rate: 35.7%
> Avg. annual cost: $14,616
30. University of Washington-Seattle Campus, Washington
> 5 yr. increase in applications: 77.4%
> 2016-2017 applications: 43,517
> Total undergraduate enrollment: 31,331
> Acceptance rate: 45.3%
> Avg. annual cost: $9,443
[in-text-ad]
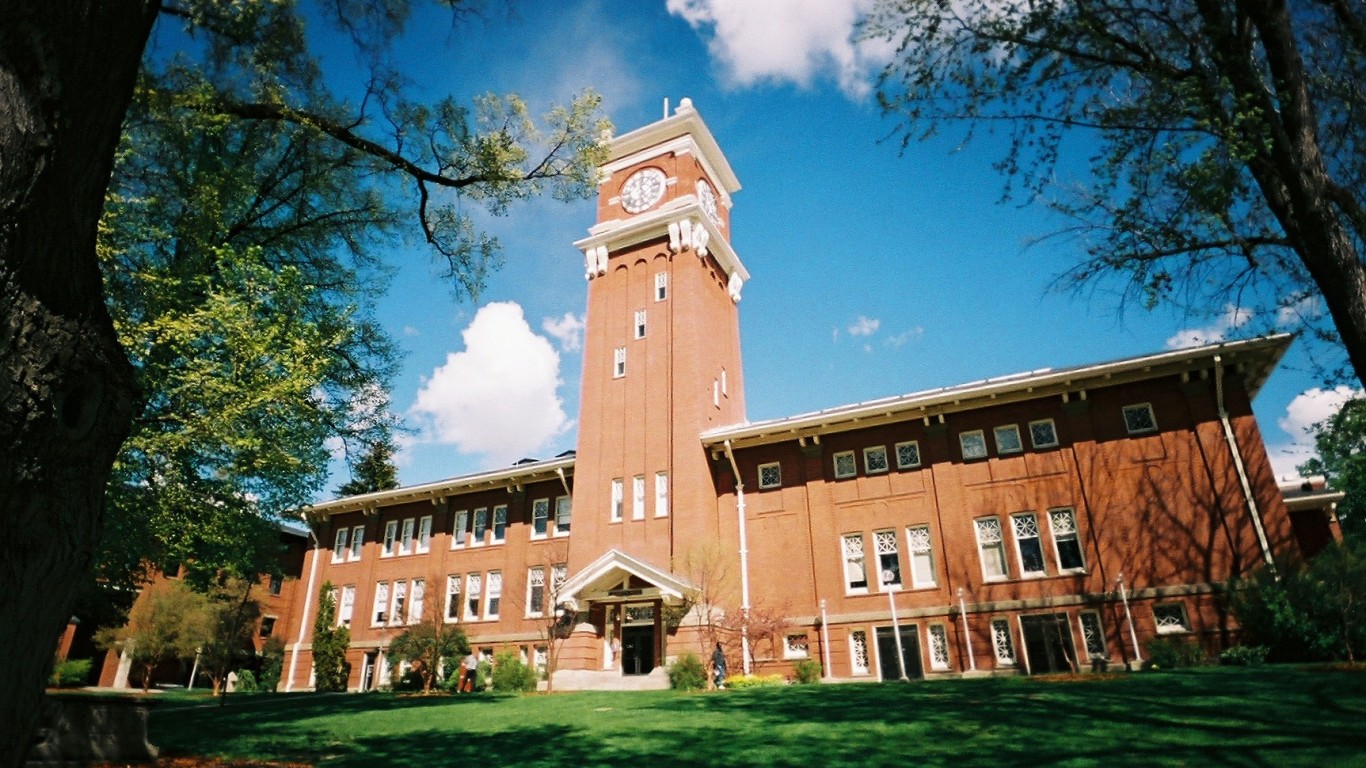
29. Washington State University, Washington
> 5 yr. increase in applications: 77.4%
> 2016-2017 applications: 23,223
> Total undergraduate enrollment: 25,277
> Acceptance rate: 72.0%
> Avg. annual cost: $17,885
28. New Jersey Institute of Technology, New Jersey
> 5 yr. increase in applications: 77.5%
> 2016-2017 applications: 7,222
> Total undergraduate enrollment: 8,483
> Acceptance rate: 59.3%
> Avg. annual cost: $17,972
27. University of California-Santa Cruz, California
> 5 yr. increase in applications: 77.9%
> 2016-2017 applications: 49,181
> Total undergraduate enrollment: 17,577
> Acceptance rate: 57.9%
> Avg. annual cost: $16,792
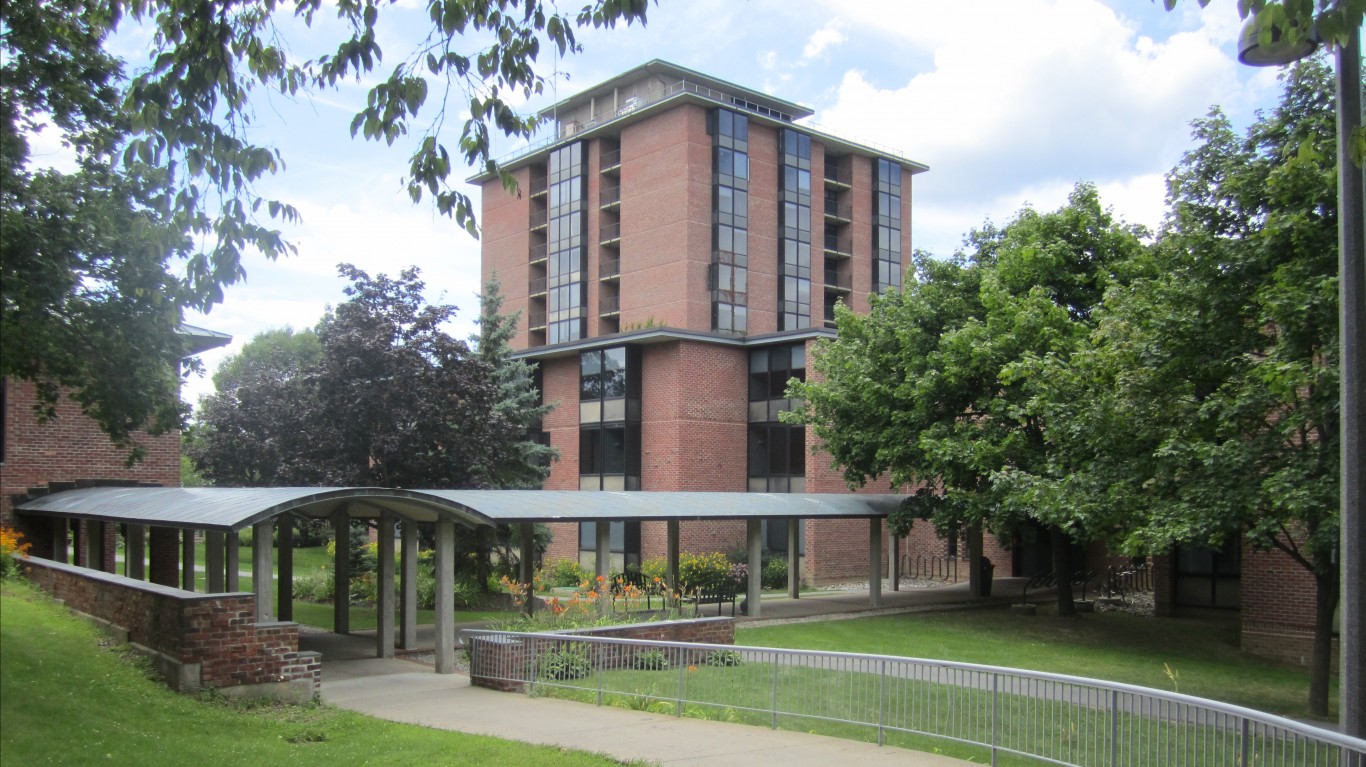
26. Minnesota State University-Mankato, Minnesota
> 5 yr. increase in applications: 78.3%
> 2016-2017 applications: 11,428
> Total undergraduate enrollment: 12,782
> Acceptance rate: 62.5%
> Avg. annual cost: $13,704
25. University of Maine, Maine
> 5 yr. increase in applications: 78.7%
> 2016-2017 applications: 12,952
> Total undergraduate enrollment: 9,279
> Acceptance rate: 89.8%
> Avg. annual cost: $17,564
24. California State University-Channel Islands, California
> 5 yr. increase in applications: 79.5%
> 2016-2017 applications: 10,310
> Total undergraduate enrollment: 7,054
> Acceptance rate: 73.8%
> Avg. annual cost: $14,834
[in-text-ad-2]
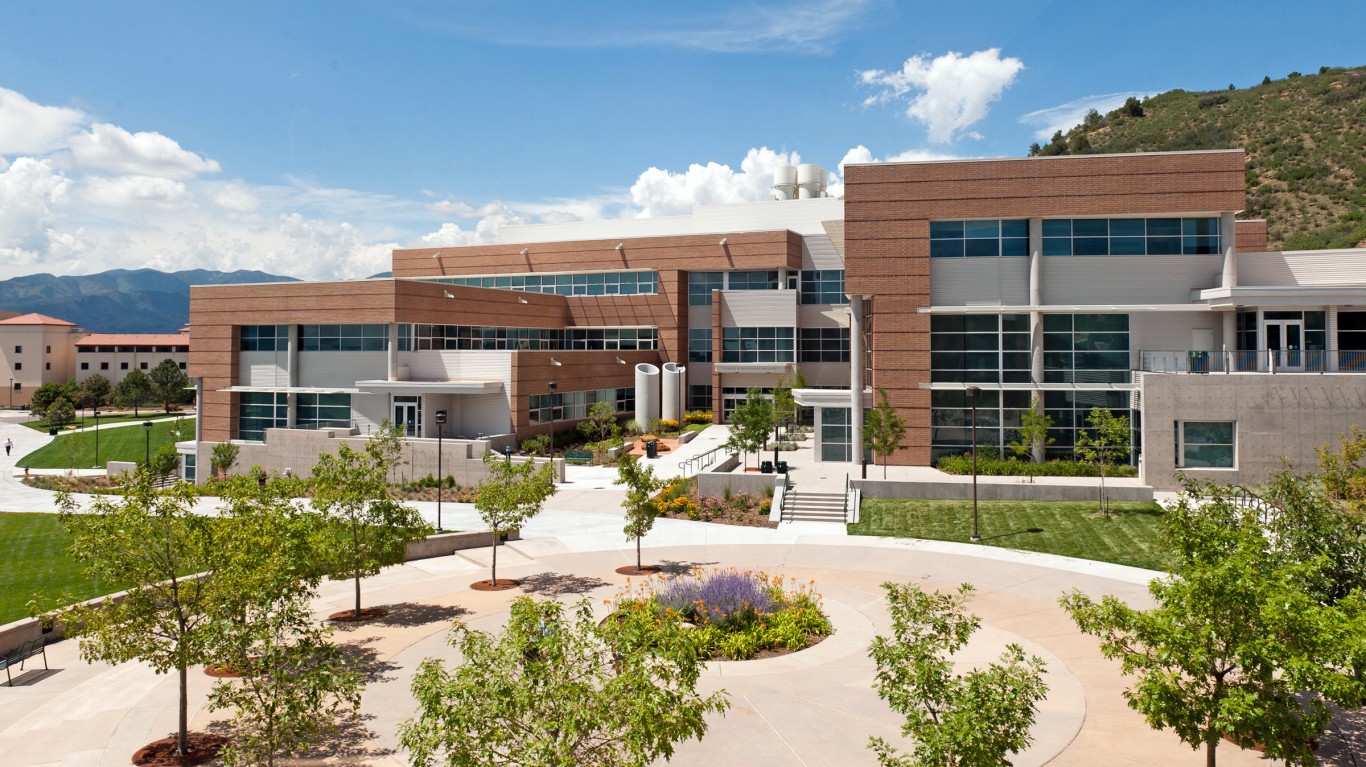
23. University of Colorado Colorado Springs, Colorado
> 5 yr. increase in applications: 79.8%
> 2016-2017 applications: 9,695
> Total undergraduate enrollment: 10,808
> Acceptance rate: 92.9%
> Avg. annual cost: $15,427
22. New York Institute of Technology, New York
> 5 yr. increase in applications: 82.4%
> 2016-2017 applications: 10,084
> Total undergraduate enrollment: 3,664
> Acceptance rate: 72.6%
> Avg. annual cost: $23,300
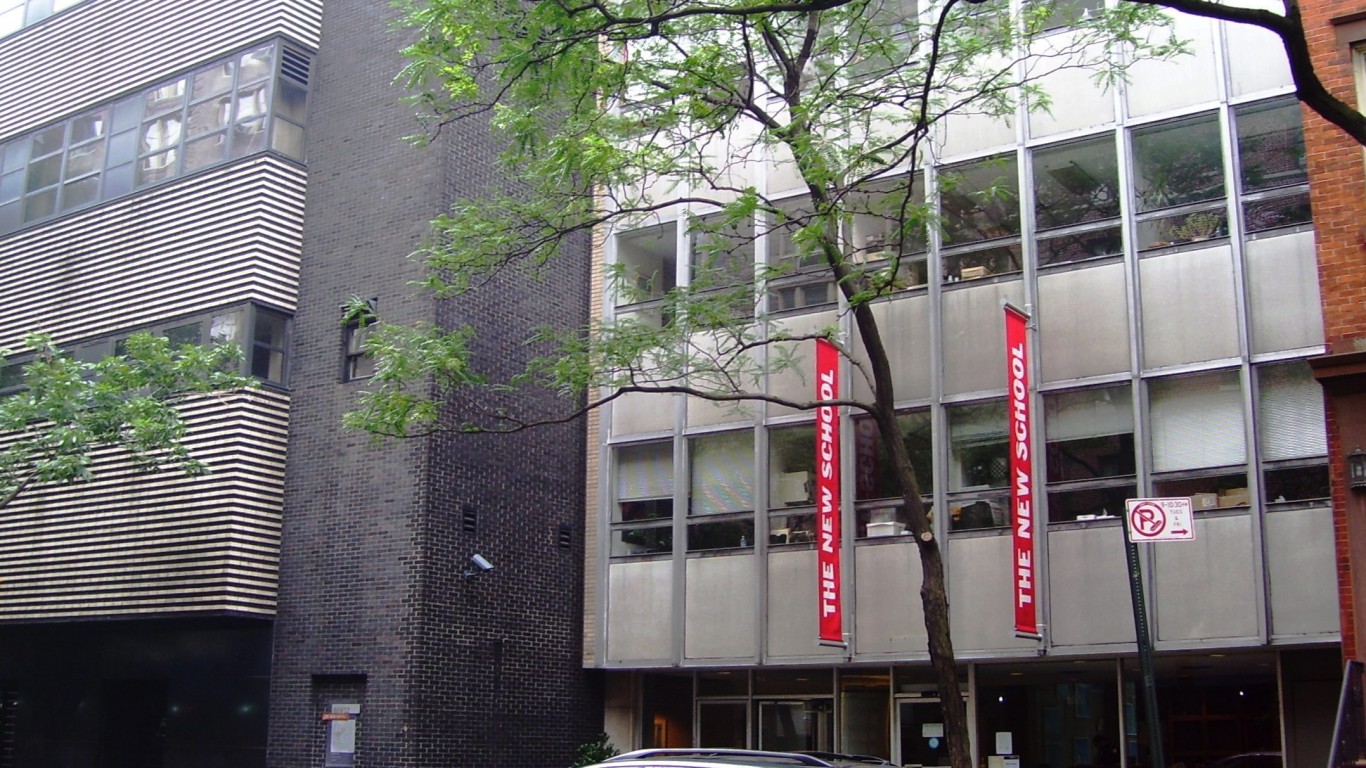
21. The New School, New York
> 5 yr. increase in applications: 84.3%
> 2016-2017 applications: 8,997
> Total undergraduate enrollment: 7,125
> Acceptance rate: 60.1%
> Avg. annual cost: $45,601
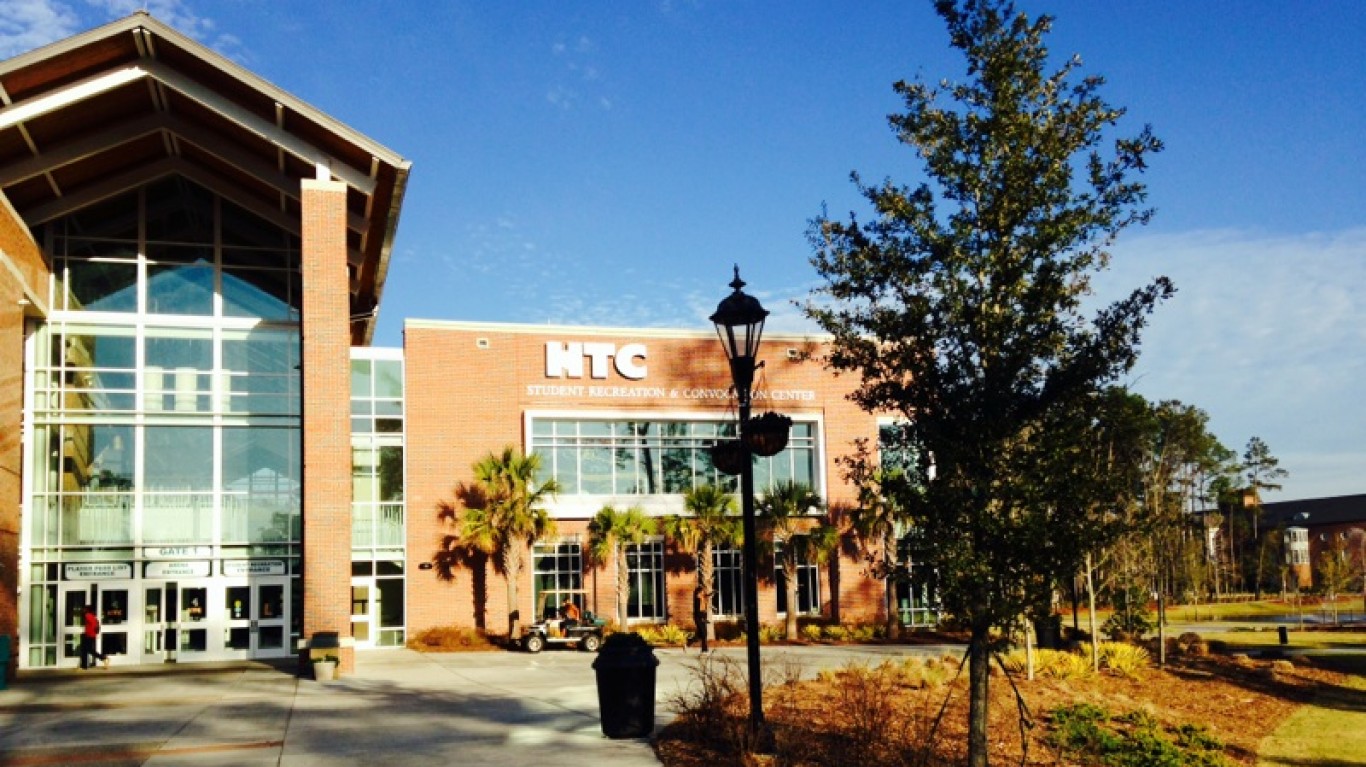
20. Coastal Carolina University, South Carolina
> 5 yr. increase in applications: 84.3%
> 2016-2017 applications: 17,768
> Total undergraduate enrollment: 9,898
> Acceptance rate: 61.2%
> Avg. annual cost: $16,224
[in-text-ad]
19. The University of Texas at Dallas, Texas
> 5 yr. increase in applications: 84.4%
> 2016-2017 applications: 12,686
> Total undergraduate enrollment: 18,470
> Acceptance rate: 68.0%
> Avg. annual cost: $10,036
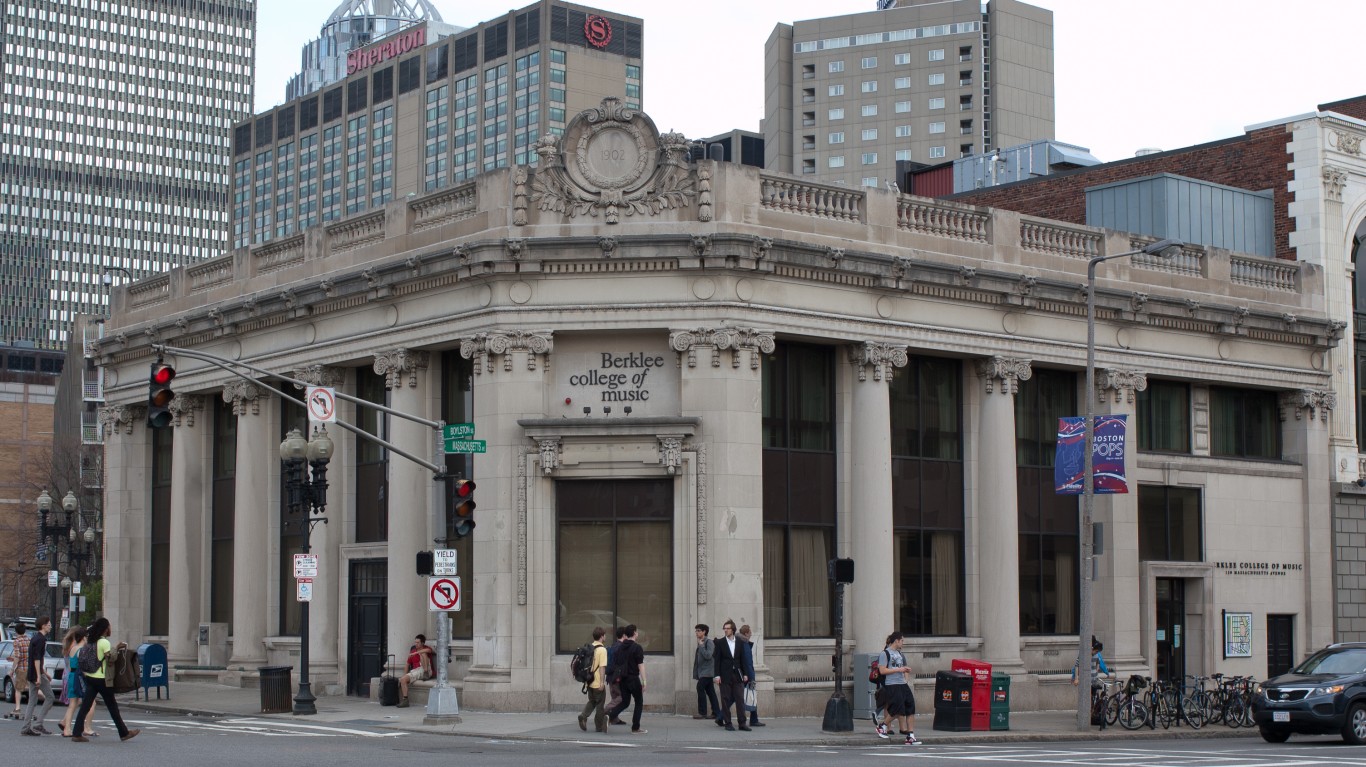
18. Berklee College of Music, Massachusetts
> 5 yr. increase in applications: 86.1%
> 2016-2017 applications: 9,224
> Total undergraduate enrollment: 6,282
> Acceptance rate: 33.8%
> Avg. annual cost: $41,382
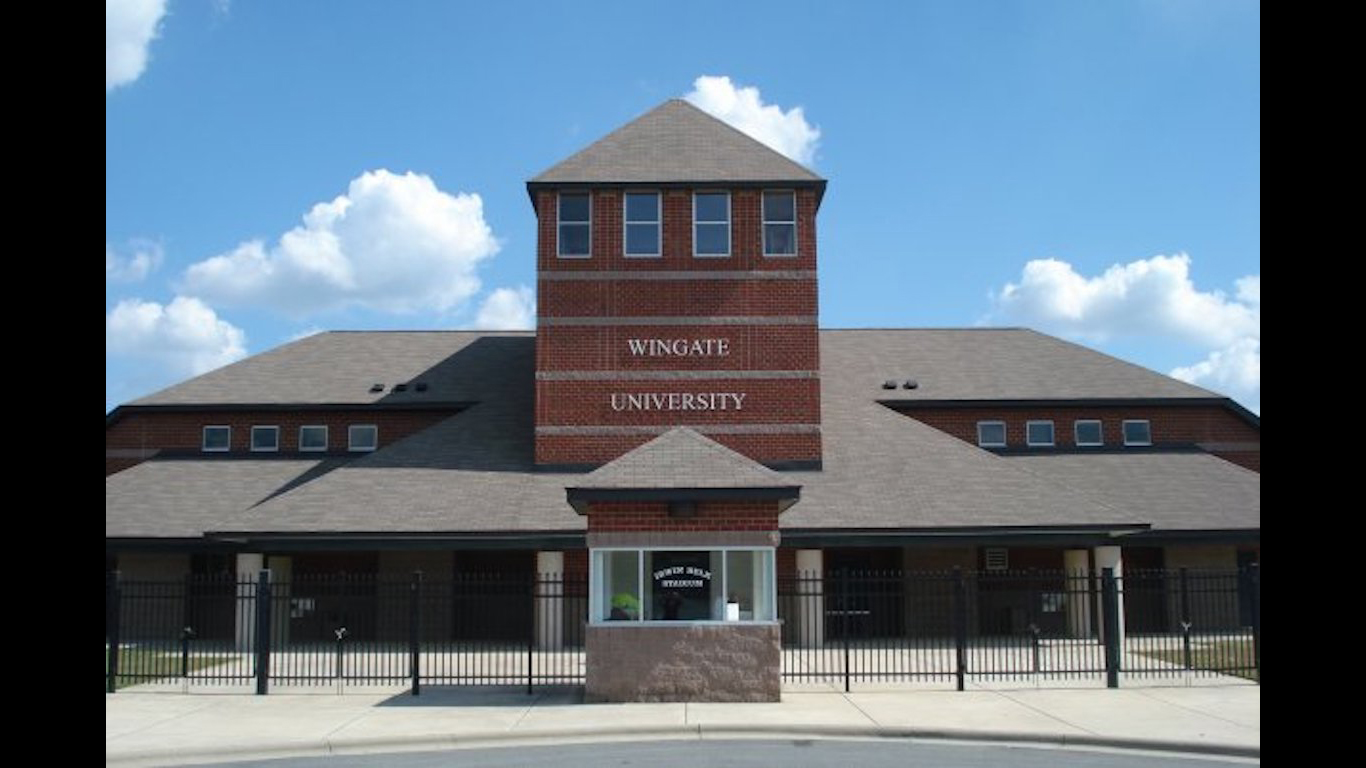
17. Wingate University, North Carolina
> 5 yr. increase in applications: 87.2%
> 2016-2017 applications: 7,581
> Total undergraduate enrollment: 2,592
> Acceptance rate: 69.6%
> Avg. annual cost: $18,094
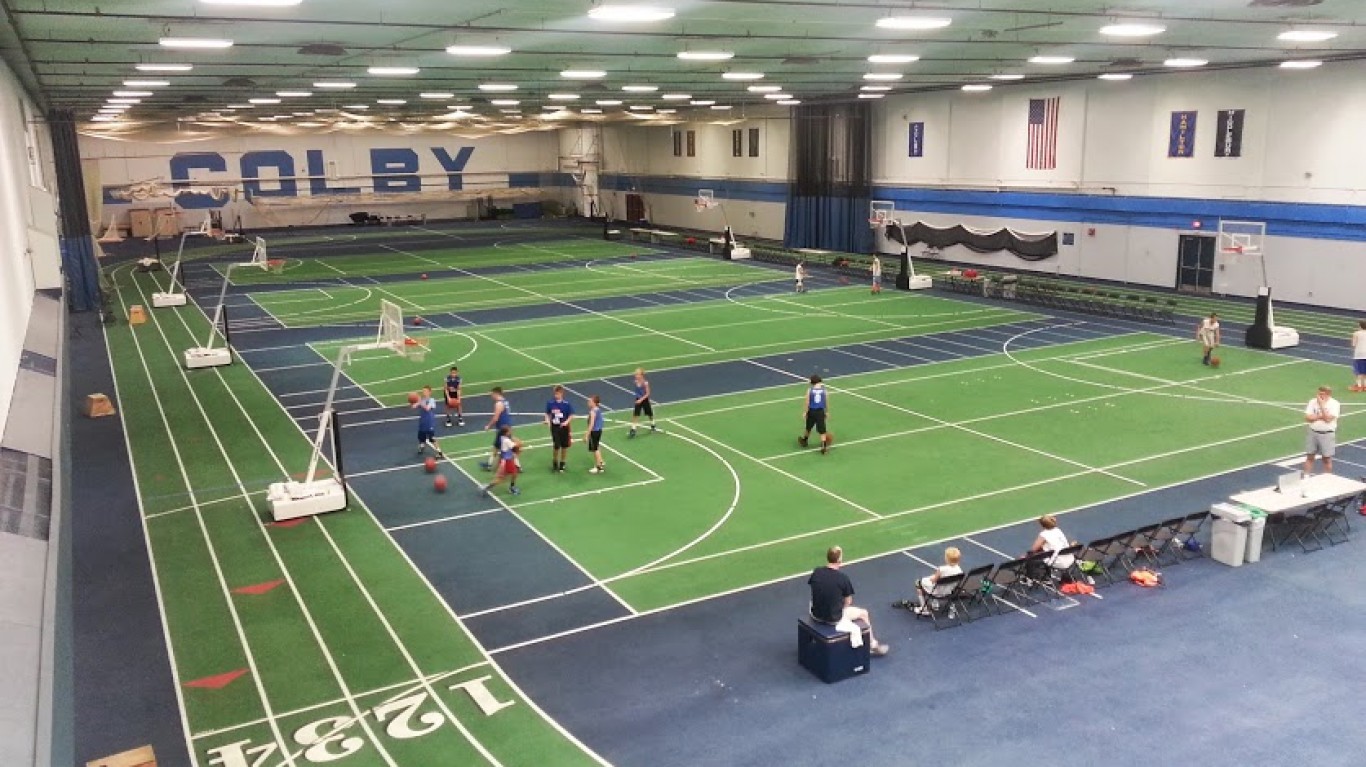
16. Colby College, Maine
> 5 yr. increase in applications: 89.6%
> 2016-2017 applications: 9,833
> Total undergraduate enrollment: 1,917
> Acceptance rate: 18.7%
> Avg. annual cost: $20,361
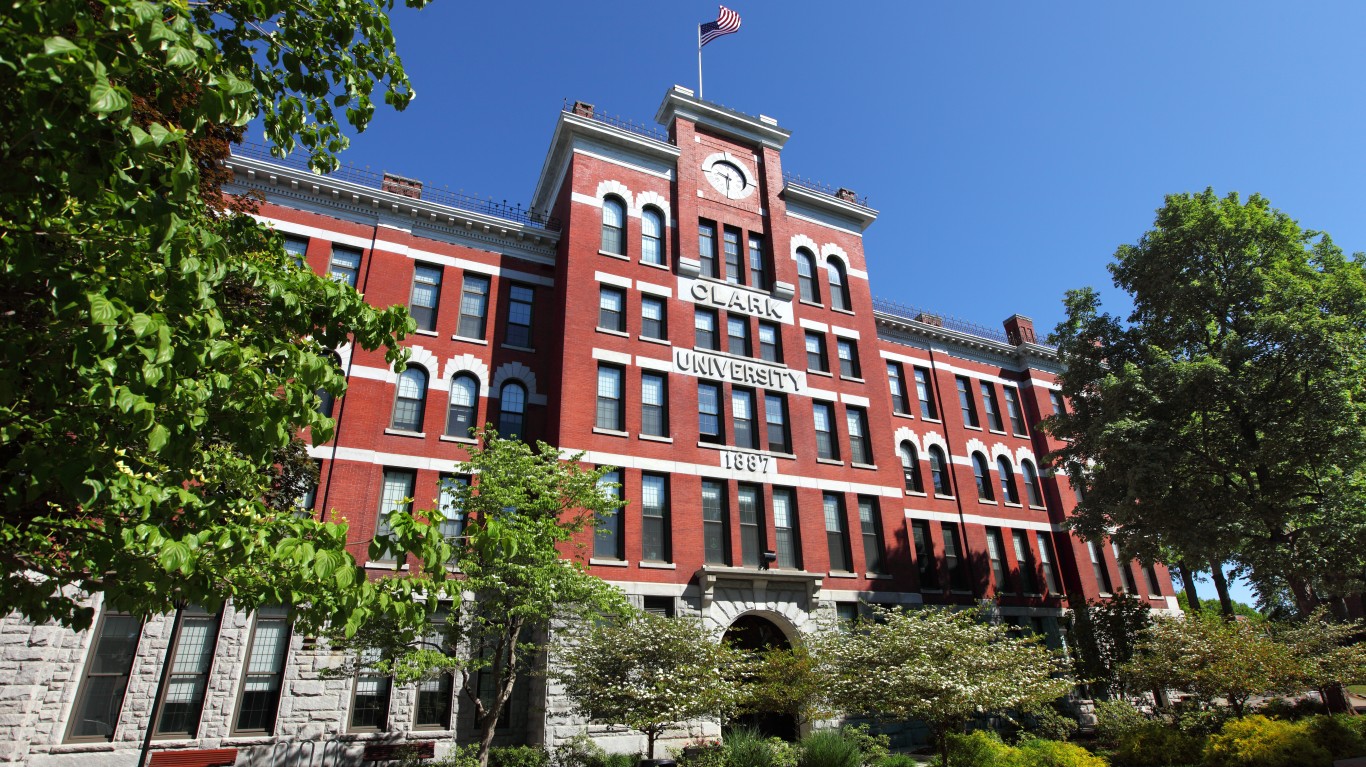
15. Clark University, Massachusetts
> 5 yr. increase in applications: 91.8%
> 2016-2017 applications: 7,914
> Total undergraduate enrollment: 2,240
> Acceptance rate: 54.7%
> Avg. annual cost: $28,810
14. University of Denver, Colorado
> 5 yr. increase in applications: 93.5%
> 2016-2017 applications: 20,322
> Total undergraduate enrollment: 5,765
> Acceptance rate: 53.5%
> Avg. annual cost: $35,163
[in-text-ad-2]
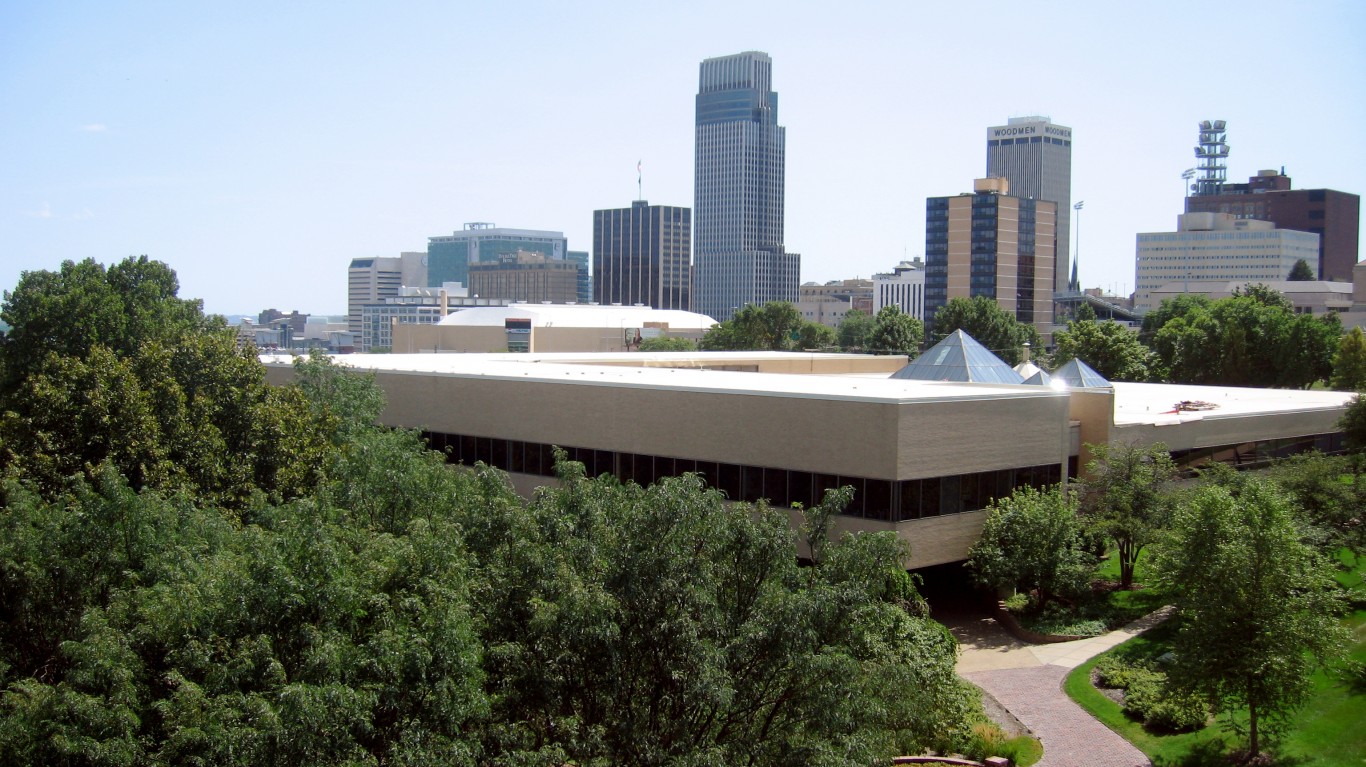
13. Creighton University, Nebraska
> 5 yr. increase in applications: 102.7%
> 2016-2017 applications: 10,352
> Total undergraduate enrollment: 4,255
> Acceptance rate: 70.7%
> Avg. annual cost: $31,481
12. Utah State University, Utah
> 5 yr. increase in applications: 103.7%
> 2016-2017 applications: 15,401
> Total undergraduate enrollment: 24,618
> Acceptance rate: 90.2%
> Avg. annual cost: $12,338
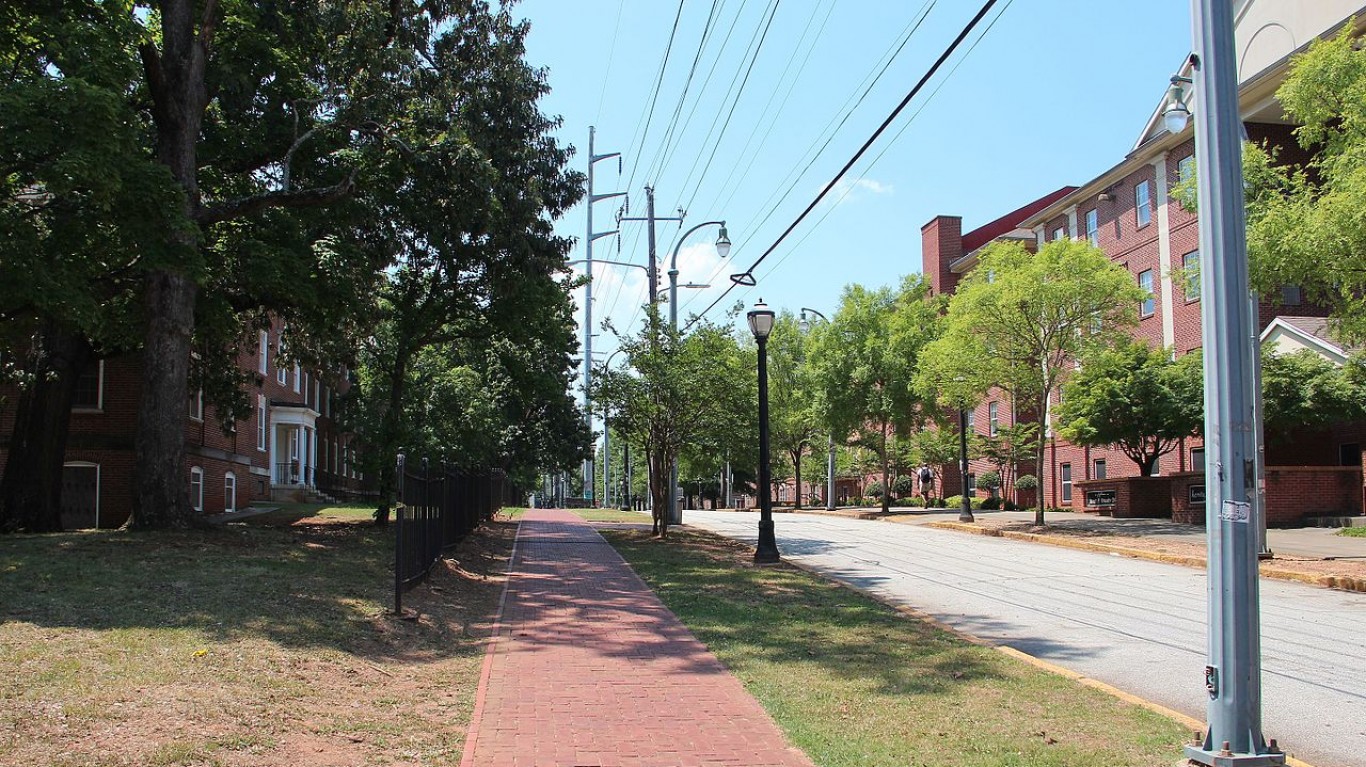
11. Clark Atlanta University, Georgia
> 5 yr. increase in applications: 104.0%
> 2016-2017 applications: 10,733
> Total undergraduate enrollment: 3,302
> Acceptance rate: 71.8%
> Avg. annual cost: $26,809
10. Claflin University, South Carolina
> 5 yr. increase in applications: 123.3%
> 2016-2017 applications: 9,387
> Total undergraduate enrollment: 2,038
> Acceptance rate: 41.8%
> Avg. annual cost: $18,089
[in-text-ad]
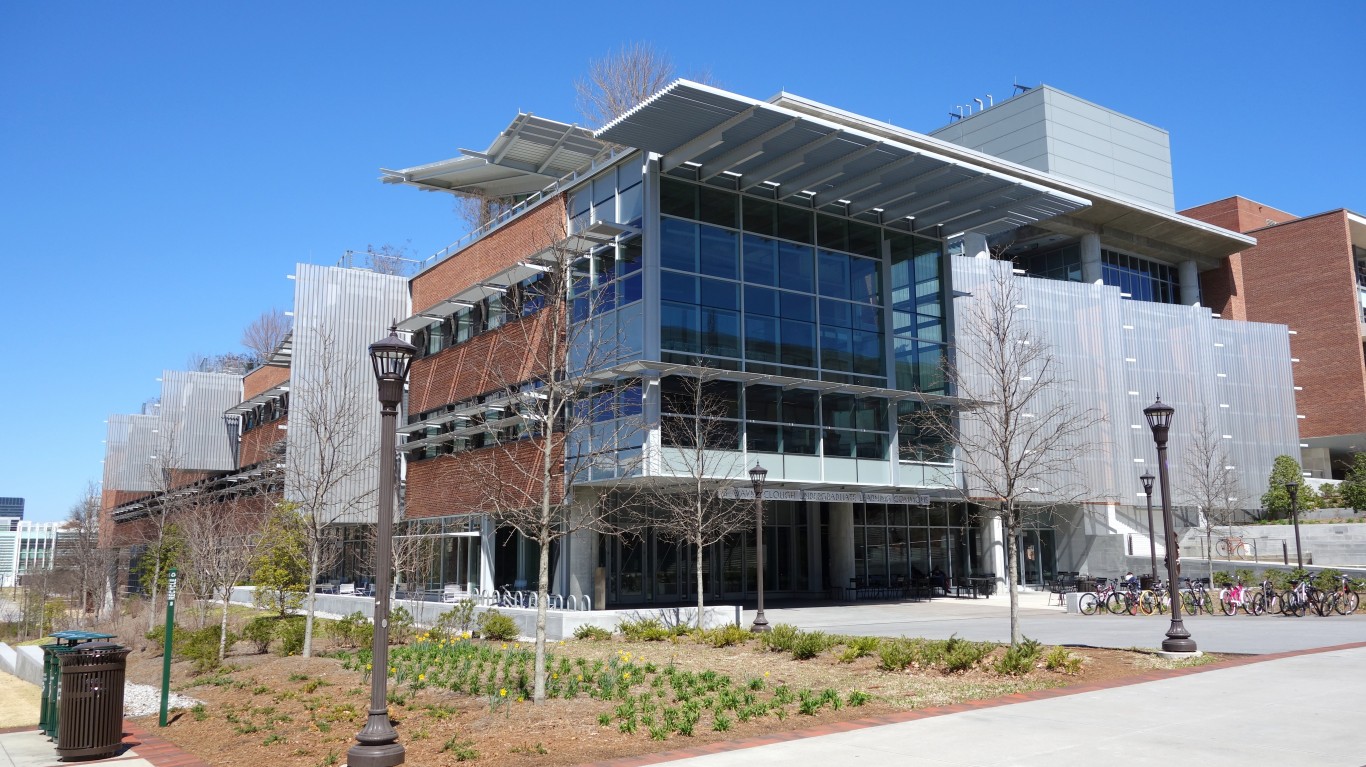
9. Georgia Institute of Technology-Main Campus, Georgia
> 5 yr. increase in applications: 126.2%
> 2016-2017 applications: 30,528
> Total undergraduate enrollment: 15,573
> Acceptance rate: 25.8%
> Avg. annual cost: $15,873
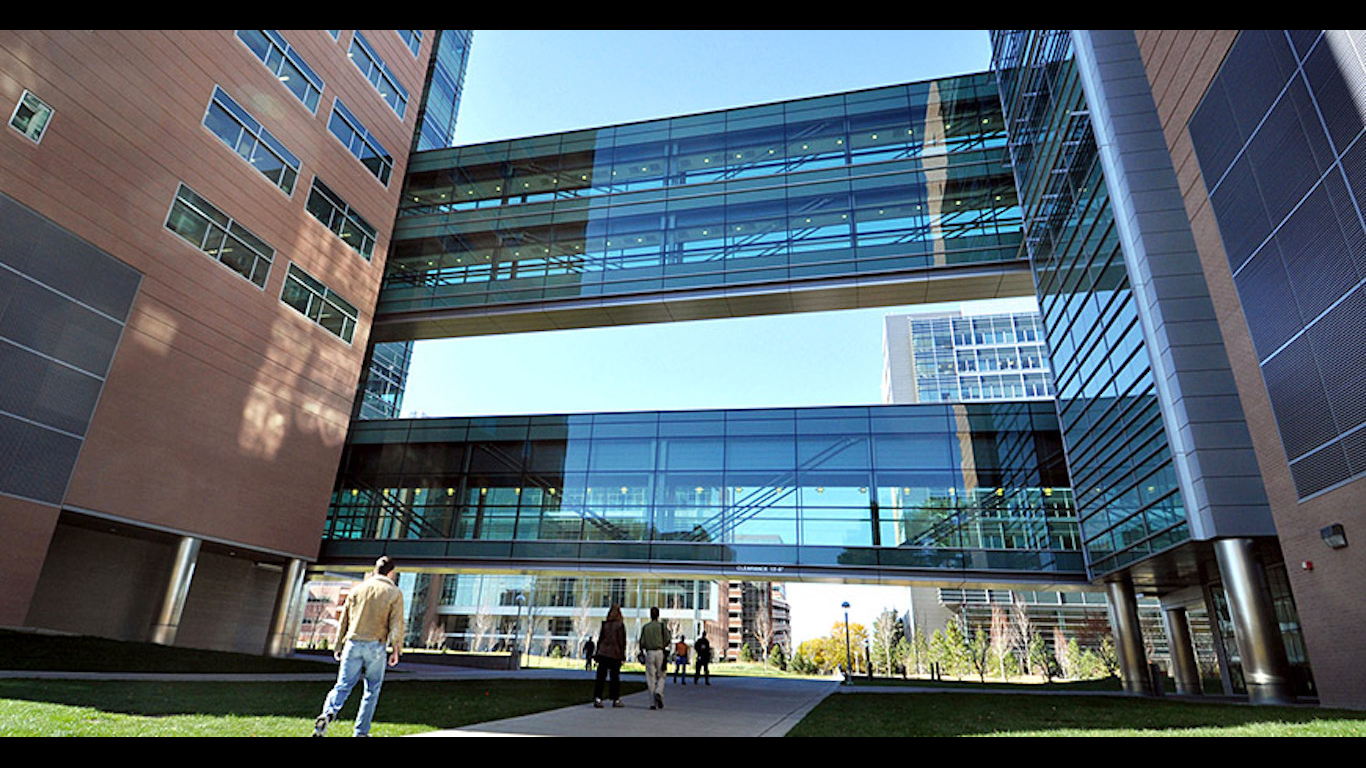
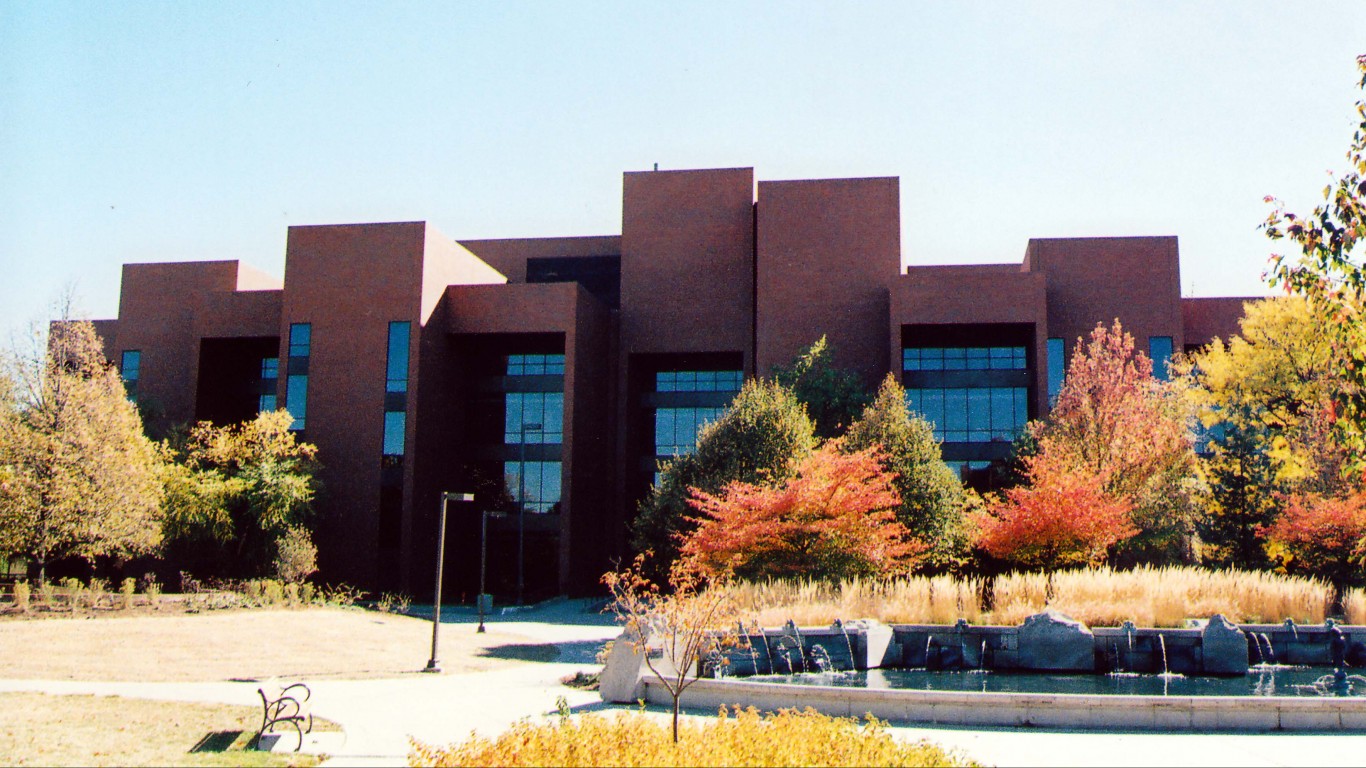
8. University of Colorado Denver/Anschutz Medical Campus, Colorado
> 5 yr. increase in applications: 126.3%
> 2016-2017 applications: 12,252
> Total undergraduate enrollment: 15,586
> Acceptance rate: 60.5%
> Avg. annual cost: $14,586
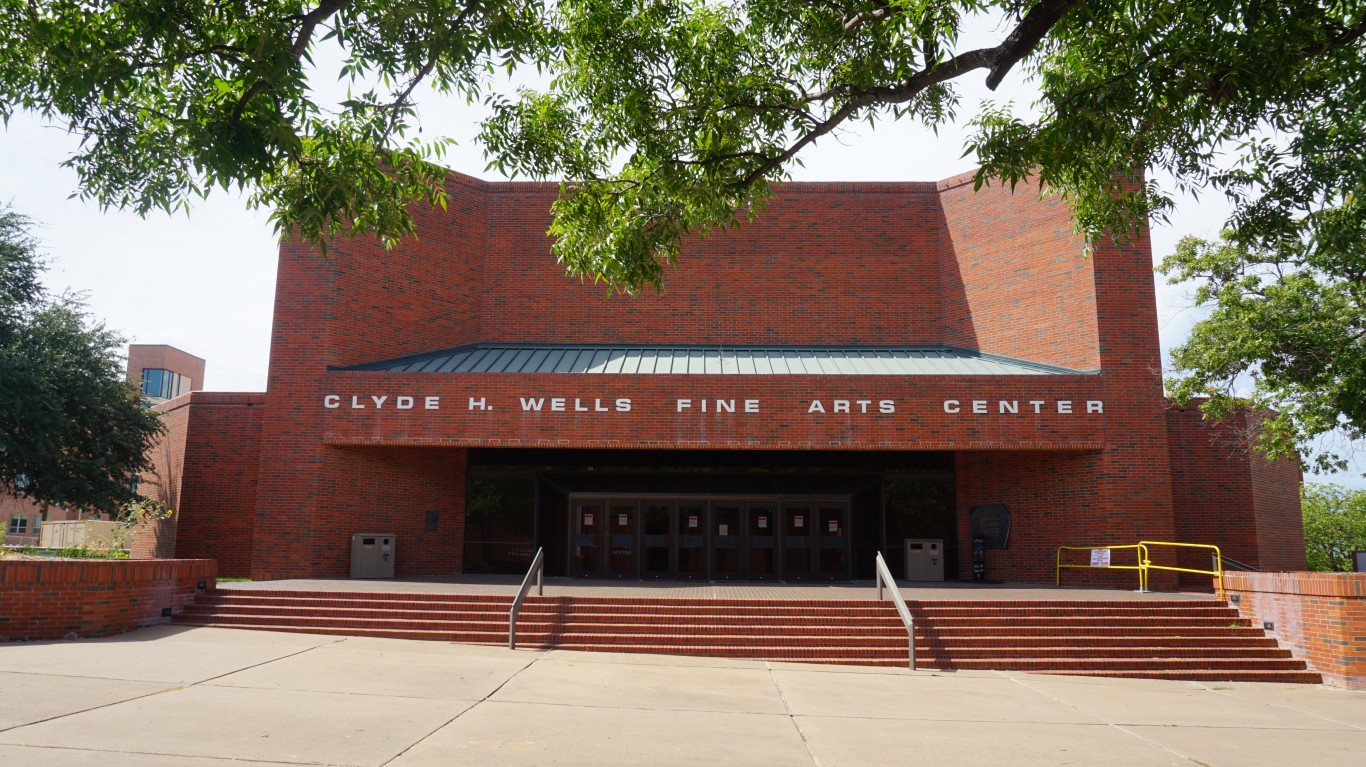
7. Tarleton State University, Texas
> 5 yr. increase in applications: 131.4%
> 2016-2017 applications: 9,583
> Total undergraduate enrollment: 11,288
> Acceptance rate: 50.4%
> Avg. annual cost: $12,831
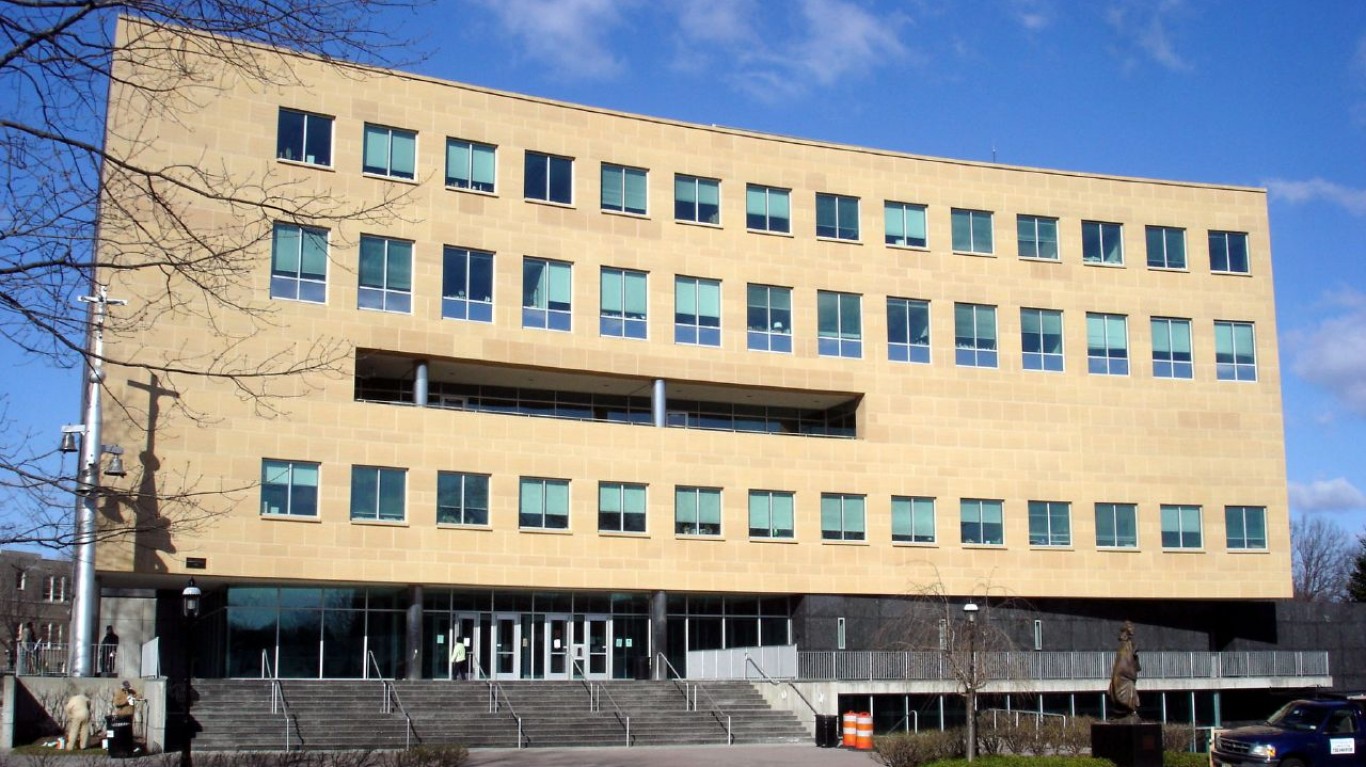
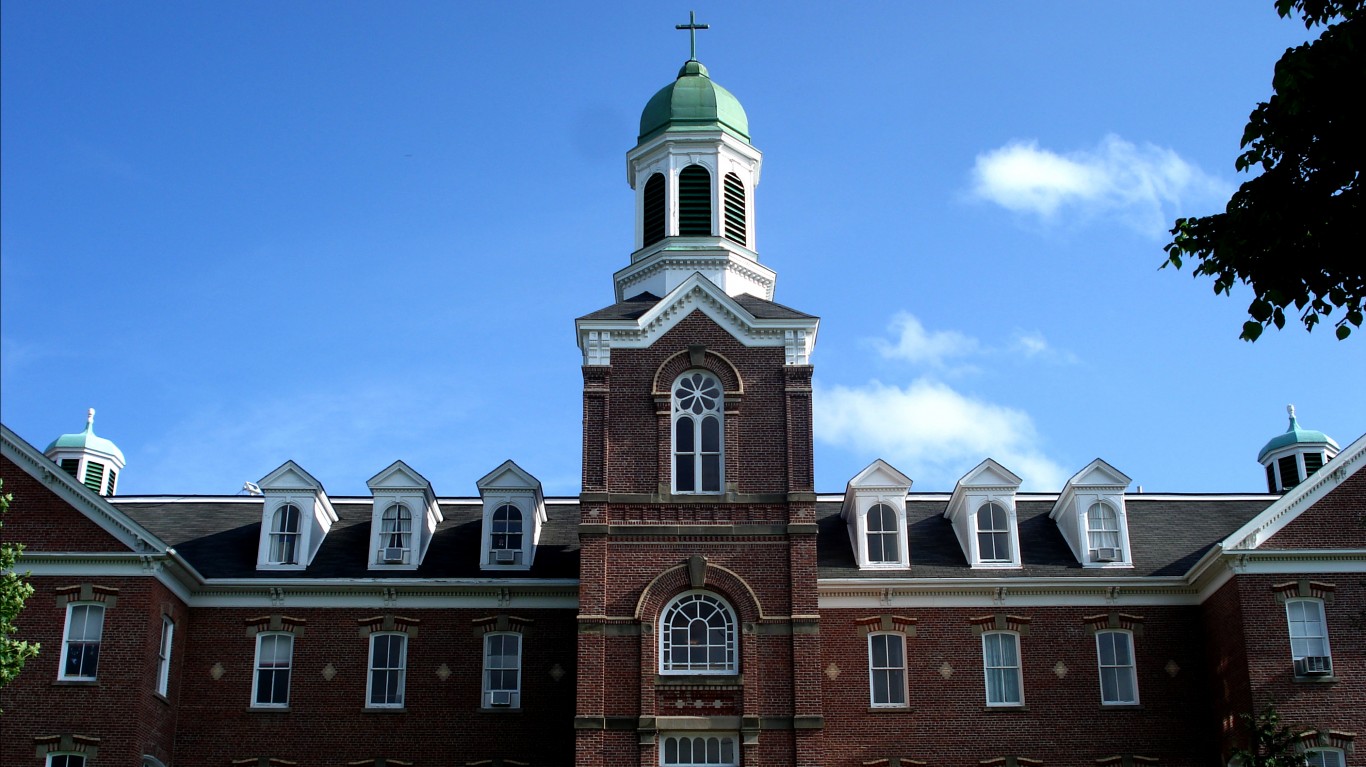
6. Seton Hall University, New Jersey
> 5 yr. increase in applications: 139.7%
> 2016-2017 applications: 15,427
> Total undergraduate enrollment: 5,969
> Acceptance rate: 66.9%
> Avg. annual cost: $28,700
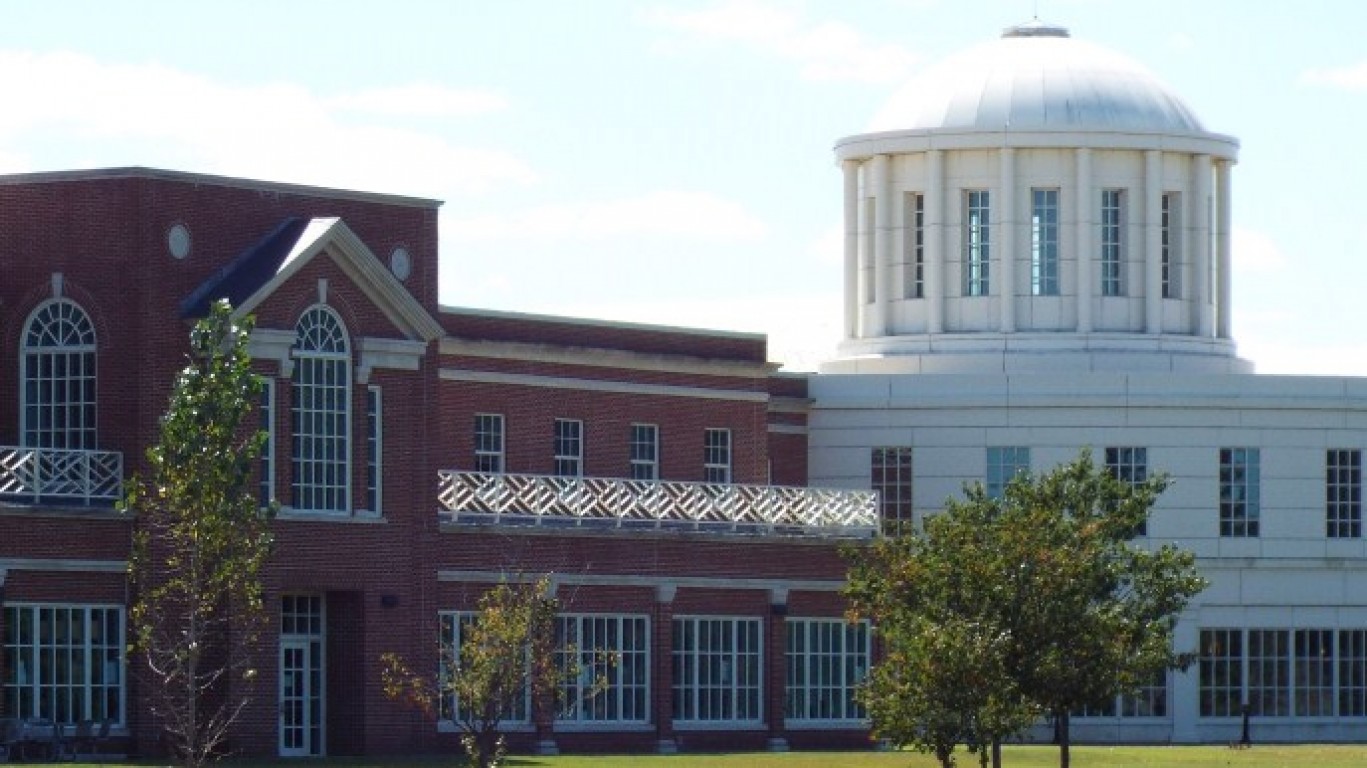
5. University of Maryland Eastern Shore, Maryland
> 5 yr. increase in applications: 143.5%
> 2016-2017 applications: 10,231
> Total undergraduate enrollment: 2,861
> Acceptance rate: 38.4%
> Avg. annual cost: $15,732
4. Southern Utah University, Utah
> 5 yr. increase in applications: 150.7%
> 2016-2017 applications: 10,573
> Total undergraduate enrollment: 8,550
> Acceptance rate: 72.3%
> Avg. annual cost: $14,451
[in-text-ad-2]
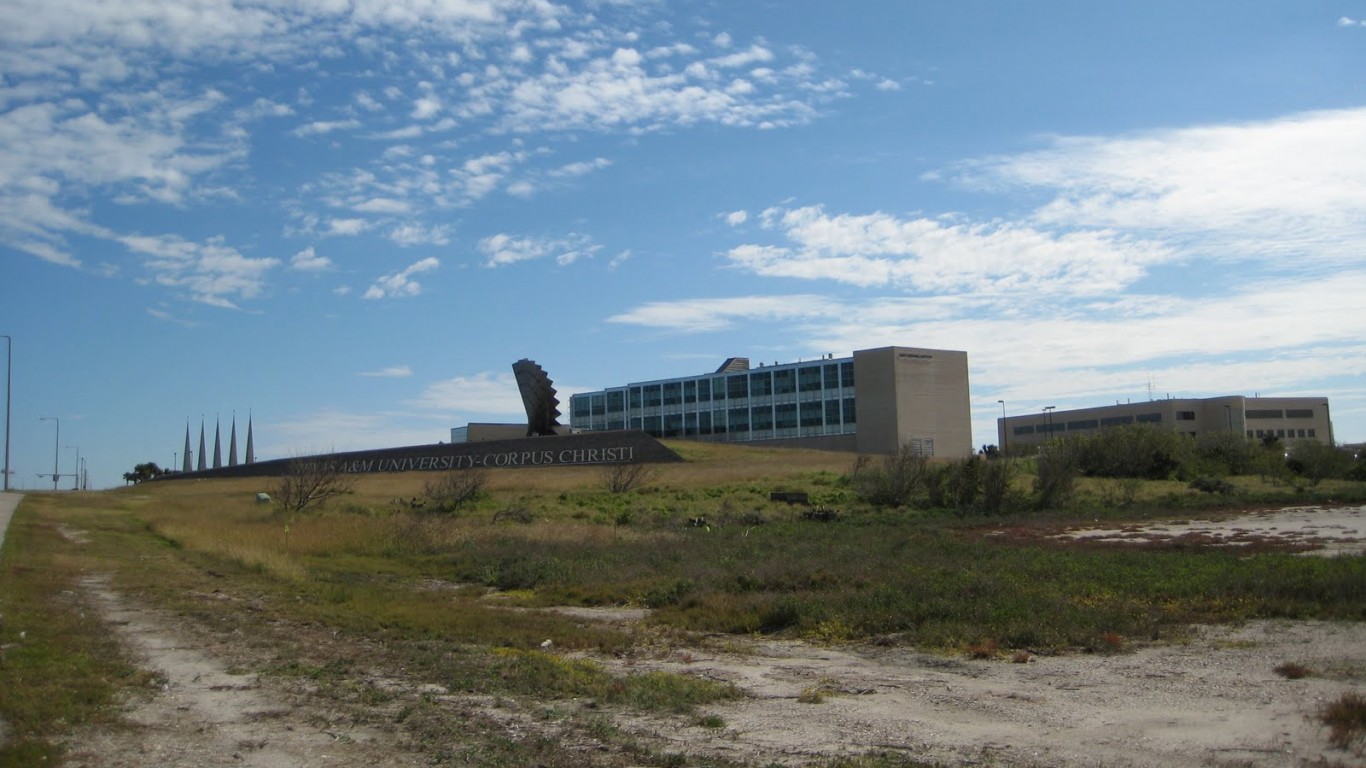
3. Texas A & M University-Corpus Christi, Texas
> 5 yr. increase in applications: 153.4%
> 2016-2017 applications: 12,909
> Total undergraduate enrollment: 10,170
> Acceptance rate: 64.7%
> Avg. annual cost: $12,948
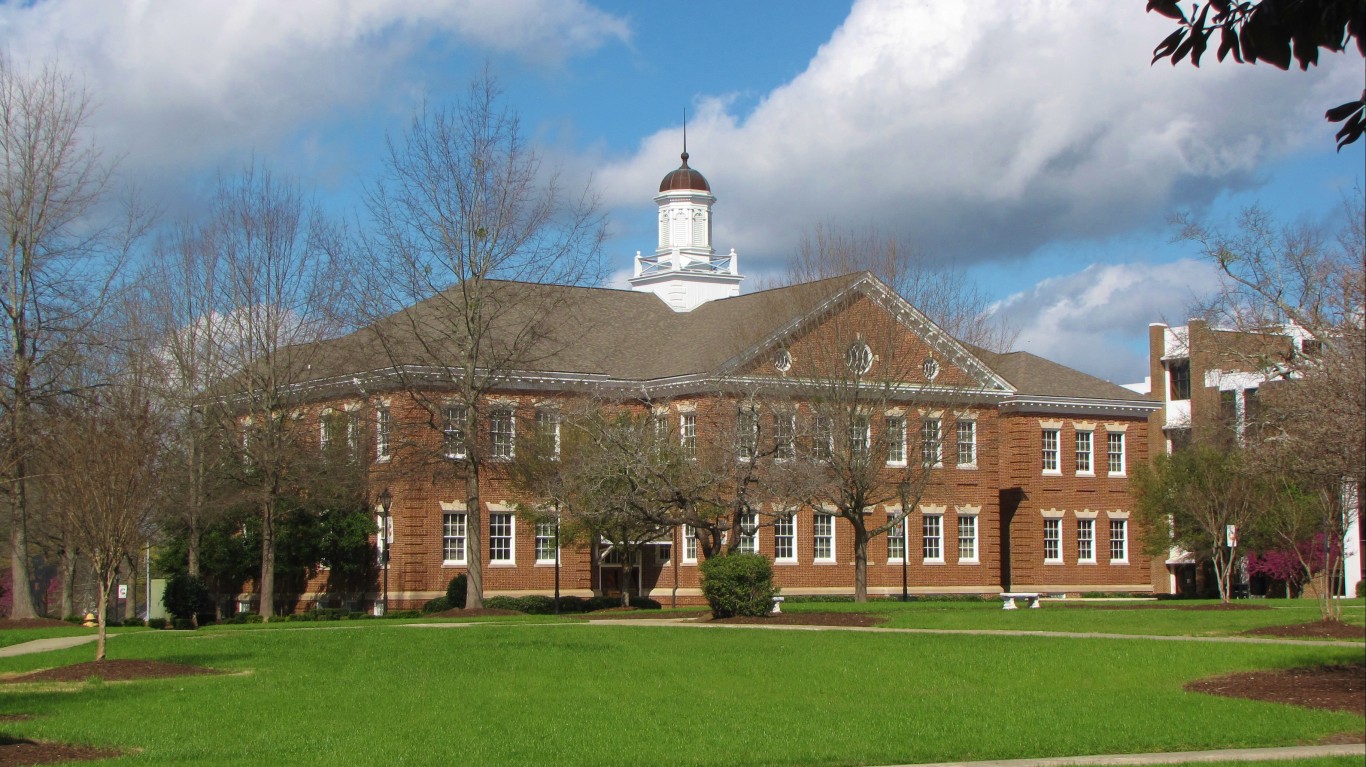
2. University of Memphis, Tennessee
> 5 yr. increase in applications: 218.7%
> 2016-2017 applications: 21,392
> Total undergraduate enrollment: 17,396
> Acceptance rate: 56.7%
> Avg. annual cost: $13,663

1. Grand Canyon University, Arizona
> 5 yr. increase in applications: 377.8%
> 2016-2017 applications: 34,096
> Total undergraduate enrollment: 49,556
> Acceptance rate: 56.9%
> Avg. annual cost: $20,912
Detailed Findings
While there are several dozen private institutions on this list, the majority of schools reporting the largest increases in applications are public. This pattern fits the overall distribution of college matriculation. Nationwide, three quarters of Americans enrolled in college or graduate school attend a public institution. This is partially because public schools typically offer steep reductions in tuition for in-state students.
Indeed, among the public schools on this list, average annual costs range from about $4,000 at California State University-Los Angeles, to $23,000 at Temple University in Pennsylvania. Among private institutions, costs are generally far higher, ranging from $15,000 at Saint Xavier University in Illinois, to $45,600 at The New School in New York.
While applying to a college is by no means the same as enrolling there, many of the schools on this list have also grown considerably in the last five years. Of the 100 schools with the largest increases, 75 have a larger student body today than they did five years ago. In 17 schools, overall enrollment has grown by more than 20% since the 2011-2012 school year.
In other cases, a growing pile of applications has allowed schools to become more selective in the admissions process. In 65 of the 100 schools on this list, acceptance rates are lower now than they were five years ago.
Methodology
Using data from the National Center for Education Statistics, 24/7 Wall St. identified the 100 colleges and universities with the largest five-year percentage increase in applicants from the 2011-2012 school year to the 2016-2017 year. Only schools with at least 4,000 applicants in 2011 were considered. Average annual costs also came from NCES and factor in financial aid recipients. Acceptance rates were calculated using NCES data. Five year changes in student body size were calculated using the 12-month unduplicated headcount from NCES. Total undergraduate enrollment came from College Navigator, an NCES program and is for the most recent available year.
It’s Your Money, Your Future—Own It (sponsor)
Retirement can be daunting, but it doesn’t need to be.
Imagine having an expert in your corner to help you with your financial goals. Someone to help you determine if you’re ahead, behind, or right on track. With SmartAsset, that’s not just a dream—it’s reality. This free tool connects you with pre-screened financial advisors who work in your best interests. It’s quick, it’s easy, so take the leap today and start planning smarter!
Don’t waste another minute; get started right here and help your retirement dreams become a retirement reality.
Thank you for reading! Have some feedback for us?
Contact the 24/7 Wall St. editorial team.
Latest from 24/7


Our expert who first called NVIDIA in 2009 is predicting 2025 will see a historic AI breakthrough.
You can follow him investing $500,000 of his own money on our top AI stocks for free.