Special Report
25 Most Dangerous Cities in America

Published:
Last Updated:

Following a nearly two-decade decline in violence in the United States, crime levels rose in 2016 for the second consecutive year, leading some to speculate a new wave of violence in America was emerging. The FBI’s 2017 crime statistics tell a less gripping but more encouraging story: crime is down slightly and is relatively stable over the long-term.
In an interview with 24/7 Wall St., John Roman, a senior fellow with the non-partisan research organization NORC at the University of Chicago, said, “I don’t see anything on the horizon that’s likely to really change this picture.” No large policy change has been proposed by decision makers on either side of the political spectrum, he explained.
There were 1.25 million violent crimes reported across the United States in 2017, down slightly from 2016.
Some cities, such as New York and Washington D.C., have made remarkable progress since the 1990s. New York, which was one of the most dangerous cities in the 1980’s and 1990’s today is the safest major city in the nation. Other cities, such as Chicago, Baltimore, and St. Louis, continue to top dangerous city lists.
24/7 Wall St. reviewed violent crime rates in major U.S. cities from the FBI’s 2017 Uniform Crime Report. Violent crime includes all offenses involving force or threat of force and is broken into four categories: murder and nonnegligent manslaughter, rape, robbery, and aggravated assault. For every 100,000 U.S. residents, 383 violent crimes were reported in 2017.
Click here to see the 25 most dangerous cities in America.
Click here to read our detailed findings and methodology.

25. Beaumont, Texas
> 2017 Violent crime rate: 1,063 per 100,000
> 2017 Homicides: 16
> Poverty rate: 20.8%
> Unemployment rate: 6.4%
Beaumont has the second highest violent crime rate in Texas among major cities, narrowly trailing Houston, located 80 miles to the west. Violent crimes, which include homicide, rape, and aggravated assault, totaled 1,259 in 2017, or just over 1,000 for every 100,000 people in Beaumont.
Places with high violent crime often also have high rates of nonviolent offenses. The city’s nonviolent crime rate, which includes crimes like burglary, larceny, and motor vehicle theft, is also high.
[in-text-ad]

24. Chattanooga, Tennessee
> 2017 Violent crime rate: 1,066 per 100,000
> 2017 Homicides: 31
> Poverty rate: 21.1%
> Unemployment rate: 3.9%
The southeastern Tennessee city of Chattanooga reported a near-record high 31 homicides in 2017. According to local police, fewer of these murders were the result of gang violence compared to the year before, when a bloody gang war contributed to the city’s 132 shooting incidents for the year.
However, while gang-related violence has declined, the city’s murder rate, and overall violent crime rate, are up. Between 2016 and 2017, Chattanooga’s violent crime rate rose from 1,023 incidents per 100,000 to 1066 incidents per 100,000.
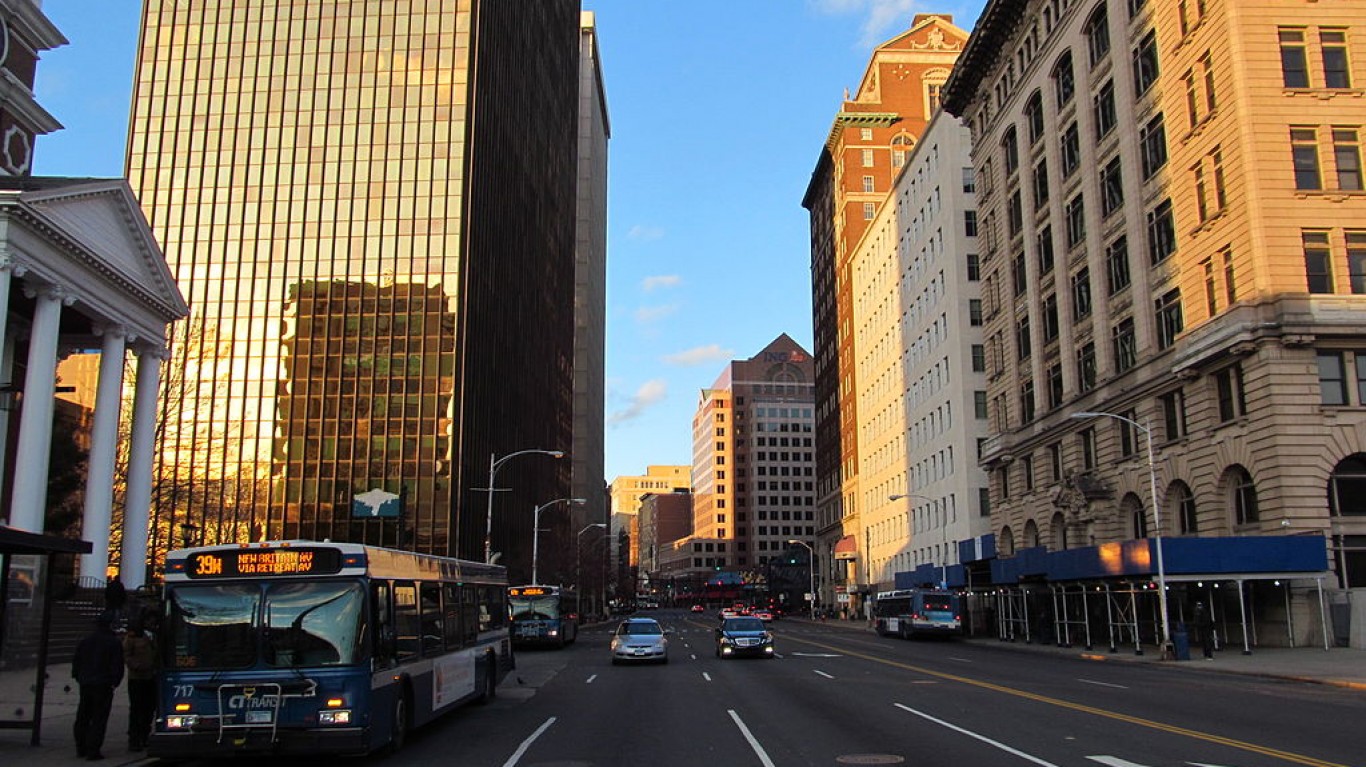
23. Hartford, Connecticut
> 2017 Violent crime rate: 1,093 per 100,000
> 2017 Homicides: 29
> Poverty rate: 31.9%
> Unemployment rate: 8.1%
The number of homicides in Hartford fose from 14 in 2016 to 29 in 2017. The city’s homicide rate of 23.6 per 100,000 residents is the 15th highest among cities with data in 2017. This is up from a rate of 11.3 per 100,000 in 2016, which was 61st highest among cities.

22. Houston, Texas
> 2017 Violent crime rate: 1,095 per 100,000
> 2017 Homicides: 269
> Poverty rate: 21.9%
> Unemployment rate: 4.8%
The number of murders in Houston, Texas’ most populous city, was down from 301 in 2016 to 269 in 2017. However, while homicide is down in Houston, the number of violent crimes rose in Houston by about 1,600 to 25,609 reported incidents. One of the components of violent crime — robbery — was particularly common in Houston. The city’s 2017 robbery rate of 418 cases per 100,000 people in 2017 is over four times the national rate of 98.05 robberies per 100,000 people, and the 10th highest rate among major U.S. cities.
[in-text-ad-2]

21. Chicago, Illinois
> 2017 Violent crime rate: 1,099 per 100,000
> 2017 Homicides: 653
> Poverty rate: 21.7%
> Unemployment rate: 5.5%
Chicago has gained attention in recent years for its alarmingly high murder rates, but homicide in the metro area is actually down in the city since it made headlines for its deadliest year in decades in 2016. The city reported a 16% decline in homicides, to 650 in 2017 from 771 in 2017. The city looks to continue its progress. Chicago Police Superintendent Eddie Johnson said, “In 2018, we are going to work to build on the progress we made last year,” he said in a prepared statement in January.

20. Minneapolis, Minnesota
> 2017 Violent crime rate: 1,101 per 100,000
> 2017 Homicides: 42
> Poverty rate: 21.3%
> Unemployment rate: 3.1%
Minneapolis, a city with a reputation as an art-friendly city filled with lakes and parks, also has one of the most severe violent crime problems in the country. In 2017, its violent crime rate of 1,101 per 100,000 was the highest in the state, according to FBI data. The city’s total violent crime rate fell in 2017, but components of the overall violent crime rate, including rape and homicide, were up.
[in-text-ad]

19. New Orleans, Louisiana
> 2017 Violent crime rate: 1,121 per 100,000
> 2017 Homicides: 157
> Poverty rate: 26.2%
> Unemployment rate: 5.1%
New Orleans has one of the higher violent crime rates in the country, and one of the very highest murder rates. In 2017, there were 40 homicides per 100,000 city residents, the fourth highest rate in the country. To combat deadly violence in the Big Easy, current mayor LaToya Cantrell, who took office in May, has a new program called Cure Violence, which aims to use both private and public funds to help lessen the bloodshed.
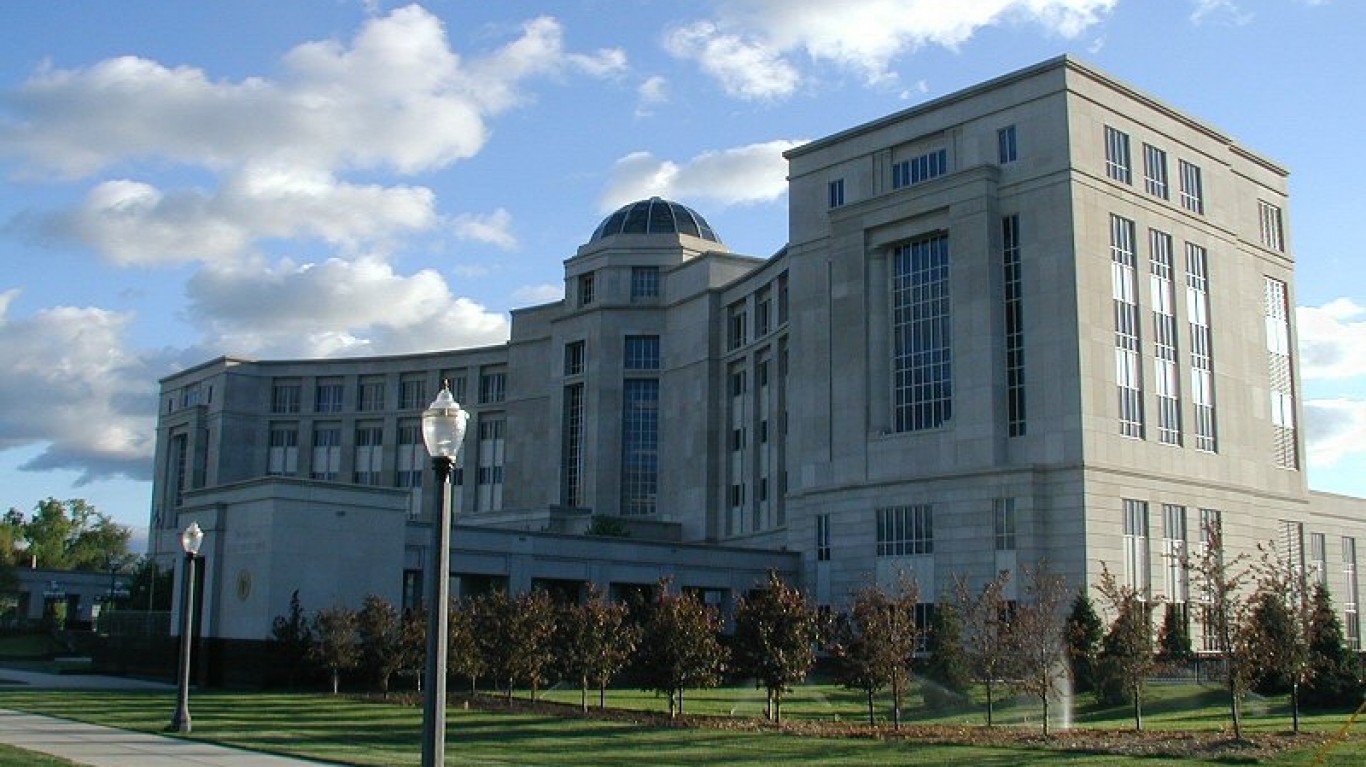
18. Lansing, Michigan
> 2017 Violent crime rate: 1,136 per 100,000
> 2017 Homicides: 14
> Poverty rate: 29.5%
> Unemployment rate: 6.3%
The capital of Michigan, Lansing, had 14 reported homicides in 2017, the most in five years.
The city of 100,000 plus has averaged 10 homicides annually in the last 17 years. According to the Lansing State Journal, Police Chief Mike Yankowski blamed domestic violence and mental illness as major reasons for the crimes in recent years, including in 2017.

17. Nashville Metropolitan Area, Tennessee
> 2017 Violent crime rate: 1,138 per 100,000
> 2017 Homicides: 110
> Poverty rate: 18.0%
> Unemployment rate: N/A
Last year, 110 people were murdered in the Tennessee capital metropolitan area. Homicide is viewed as an epidemic in Music City by the staff at the Oasis Center of Nashville, which aims to help at-risk youth. Most of the city homicides involved people who knew each other and were engaged in “risky behavior,” Metro Police spokeswoman Kristin Mumford told Nashville’s News4.
[in-text-ad-2]

16. Anchorage, Alaska
> 2017 Violent crime rate: 1,203 per 100,000
> 2017 Homicides: 27
> Poverty rate: 8.1%
> Unemployment rate: 6.0%
The violent crime rate in Anchorage, Alaska’s most populous city, rose in 2017, as did the state rate as a whole. Experts have pinned the state’s uptick on the opioid epidemic and drug and gang violence, according to the Anchorage Daily News. As a possible remedy to rising crime rates, the state is increasing access to drug addiction and mental health treatment.

15. San Bernardino, California
> 2017 Violent crime rate: 1,291 per 100,000
> 2017 Homicides: 34
> Poverty rate: 32.3%
> Unemployment rate: 6.3%
San Bernardino has had a number of police force cutbacks in recent years, related to the city’s ongoing financial troubles. These might help explain the city’s ongoing struggles with rampant violent crime. There were 1,291 reported murders, rapes, robberies and aggravated assaults in the California city in 2017 per 100,000 residents, 15th highest among major U.S. cities.
[in-text-ad]

14. Oakland, California
> 2017 Violent crime rate: 1,299 per 100,000
> 2017 Homicides: 69
> Poverty rate: 20.0%
> Unemployment rate: 4.2%
Violent crime has plummeted in the last five years in the San Francisco Bay city of Oakland, and that’s very good news for a place that has experienced many homicides, rapes, and aggravated assaults. The crime rate skyrocketed around the recession, then fell, only to go up again in 2012, according to the SFGate. But it has been declining since then. Last year, there were just under 1,300 violent crimes reported per 100,000 residents.
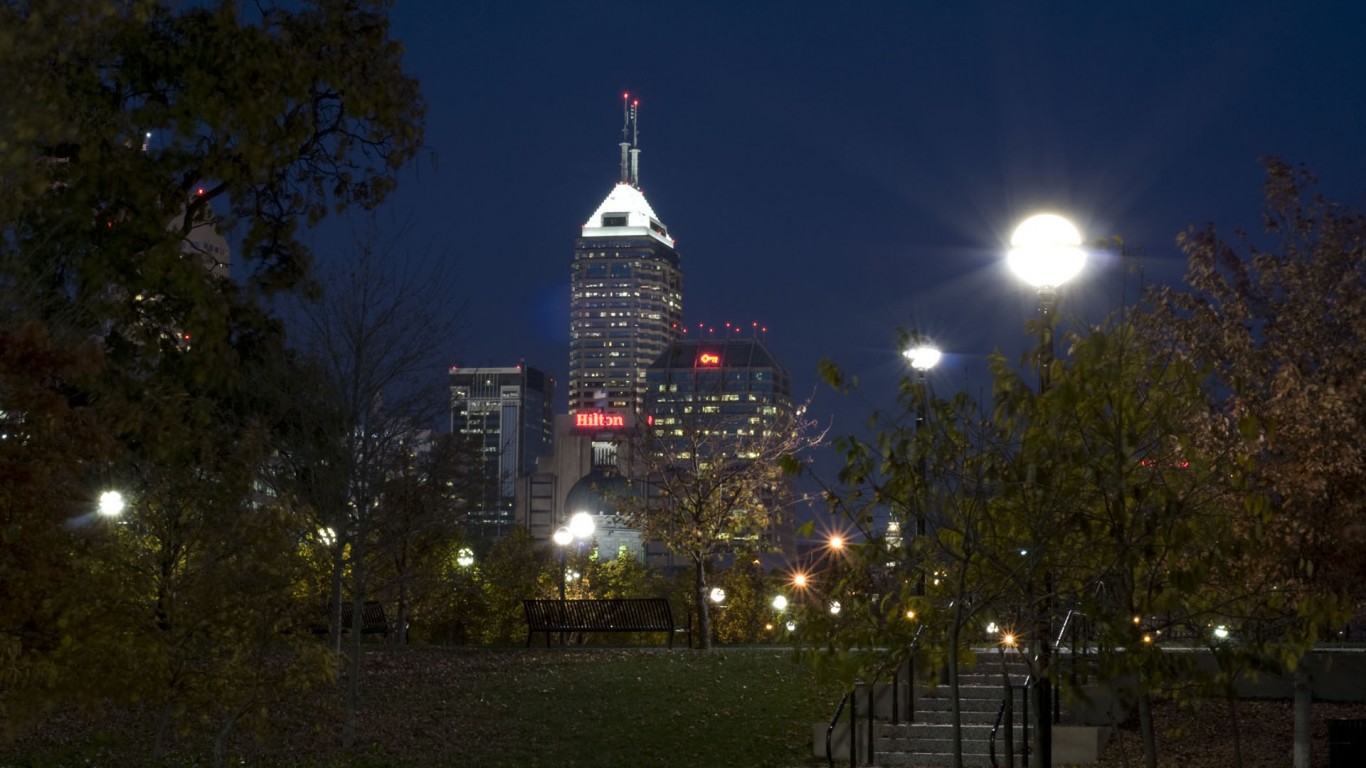
13. Indianapolis, Indiana
> 2017 Violent crime rate: 1,334 per 100,000
> 2017 Homicides: 156
> Poverty rate: 20.9%
> Unemployment rate: 3.6%
Indianapolis’ residents lived through their deadliest year in 2017, according to Fox 59. The station reported that as of Dec. 28, 2017, 156 homicides were reported in Indiana’s capital city. The city’s violent crime rate in 2017 is 1,334 crimes per 100,000 people, according to the FBI.

12. Springfield, Missouri
> 2017 Violent crime rate: 1,339 per 100,000
> 2017 Homicides: 14
> Poverty rate: 25.9%
> Unemployment rate: 3.2%
The homicide rate in Springfield, Missouri, nearly doubled from 2016 to 2017, jumping from 4.8 per 100,000 residents to 8.3 per 100,000. Murder and nonnegligent manslaughter represent a relatively small share of overall violent crime, and Springfield’s violent crime rate remained effectively unchanged between 2016 and 2017. However, Springfield’s violent crime rate of 1,339 incidents per 100,000 people is still one of the worst rates among U.S. cities. Springfield also has the unfortunate distinction of having the highest rate of reported incidents of rape in the country, at 209 per 100,000 people compared to a national rate of 42 per 100,000.
[in-text-ad-2]

11. Albuquerque, New Mexico
> 2017 Violent crime rate: 1,369 per 100,000
> 2017 Homicides: 70
> Poverty rate: 18.9%
> Unemployment rate: 5.5%
As of 2016, Albuquerque, the largest in New Mexico, already had one of the worst violent crime rates in the country, at 1,112 incidents of homicide, rape, assault, and robbery per 100,000 residents. However, in 2017, that rate rose by an alarming 23% to 1,369 violent crimes per 100,000 people in 2017s. At the center of the city’s increase in robberies is the number of robberies, which rose from under 2,000 in 2016 to 2,930 incidents in 2017. According to the Albuquerque Journal, Albuquerque Mayor Tim Keller the uptick “unacceptably high.”

10. Stockton, California
> 2017 Violent crime rate: 1,415 per 100,000
> 2017 Homicides: 55
> Poverty rate: 23.7%
> Unemployment rate: 8.0%
In California’s Central Valley, Stockton gained notoriety in 2012 when it declared bankruptcy, becoming the most populous city in the country at the time to have done so. Along with those troubles have come a high violent crime rate — 1,415 crimes per 100,000 people. Stockton’s financial troubles may help explain the city’s high crime rates, as weak budgets may be limiting the city’s abilities to enforce crimes. Stockton’s extremely high unemployment rate, at 8.0%, is one of the highest in the country, and may also be contributing to the city’s high crime rate.
[in-text-ad]

9. Cleveland, Ohio
> 2017 Violent crime rate: 1,557 per 100,000
> 2017 Homicides: 107
> Poverty rate: 36.0%
> Unemployment rate: 7.4%
Ohio’s second-largest city, Cleveland, has had a rocky time of late. In 2017 more than a third of the population was impoverished and the unemployment rate was over 7%, each among the 10 highest rates in among U.S. cities. High poverty and high unemployment have been been shown to relate to higher violent crime rates. In 2017, there were 5,999 violent crimes reported in Cleveland, for a rate of per 1,557 per 100,000 people.

8. Rockford, Illinois
> 2017 Violent crime rate: 1,588 per 100,000
> 2017 Homicides: 18
> Poverty rate: 22.7%
> Unemployment rate: 7.5%
Compared to most of the cities with the highest violent crime rates in the country, Rockford, Illinois has relatively few murders — just 18 in total in 2017. Even adjusting for population, the city ranks outside of the top 50 for its murder rate. However, murder and nonnegligent manslaughter only represent a small part of a city’s overall violent crime rate. Rockford, for example, had 1,773 reported aggravated assault cases reported in 2017, far more than most other cities of its size. In Naperville, Illinois, a city with a slightly larger population than Rockford, there were just 80 reported cases of aggravated assault last year.
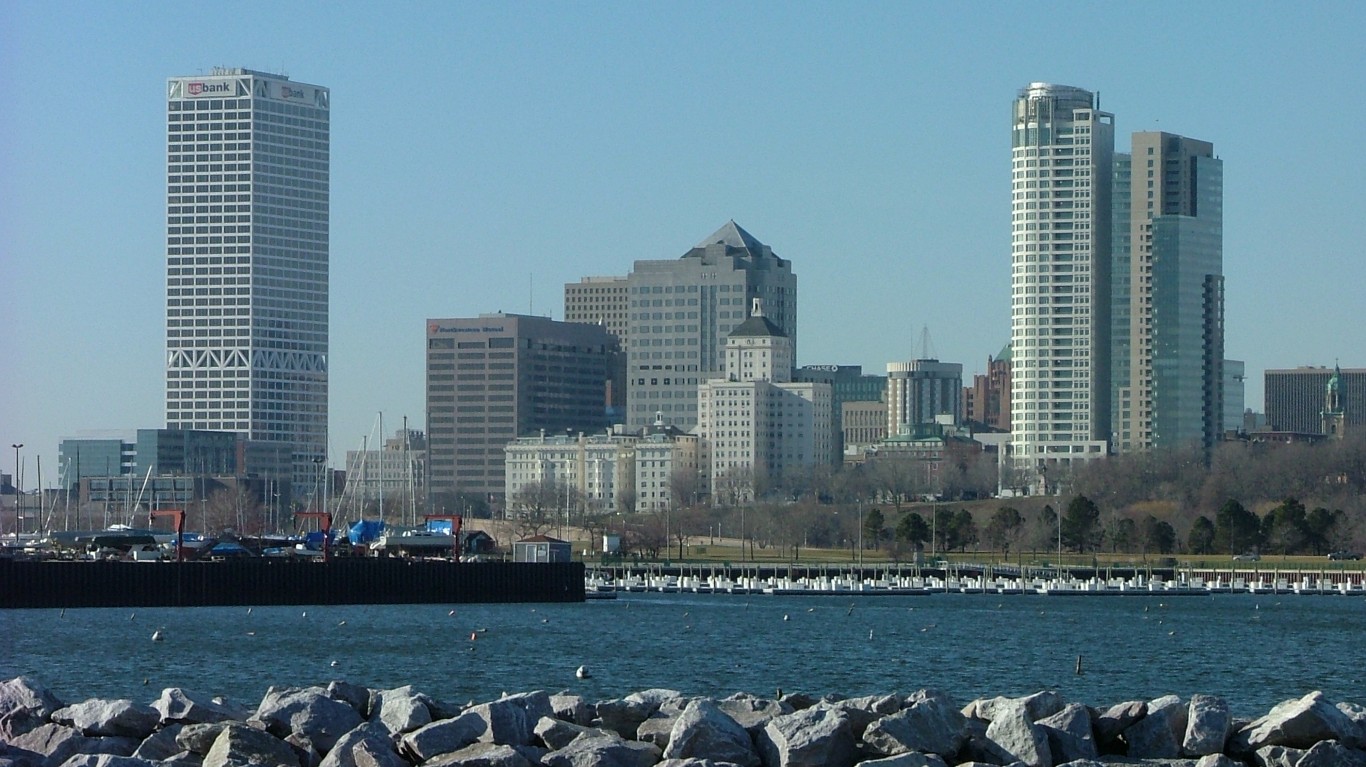
7. Milwaukee, Wisconsin
> 2017 Violent crime rate: 1,597 per 100,000
> 2017 Homicides: 118
> Poverty rate: 28.4%
> Unemployment rate: 4.6%
Milwaukee, Wisconsin’s largest city, has a lot going for it: a stunning shoreline on the banks of Lake Michigan, as well as several universities and Fortune 500 companies. Yet, last year it recorded a violent crime rate of 1,597 per 100,000, seventh highest among U.S. cities. Homicides declined from 141 in 2016 to 118 in 2017. last year from The Milwaukee Police Department noted they are focusing on a two-mile section, where most of Milwaukee’s violent crimes occur, to bring down the numbers.
[in-text-ad-2]

6. Little Rock, Arkansas
> 2017 Violent crime rate: 1,634 per 100,000
> 2017 Homicides: 55
> Poverty rate: 18.5%
> Unemployment rate: 3.3%
In Little Rock, Arkansas’s capital and largest city, 1,634 crimes per 100,000 people and 55 murders were reported in 2017. Arkansas.com reported that criminal offenses rose 1.1% between 2016 and 2017, which the police linked in part to rival gang activity. In addition to having one of the highest violent crime rates, Little Rock’s property crimes are also a serious issue. The city had 6,932 property crimes in 2017, almost three times the U.S. property crime rate and the fifth highest rate among major U.S. cities.
5. Kansas City, Missouri
> 2017 Violent crime rate: 1,724 per 100,000
> 2017 Homicides: 150
> Poverty rate: 18.3%
> Unemployment rate: 4.3%
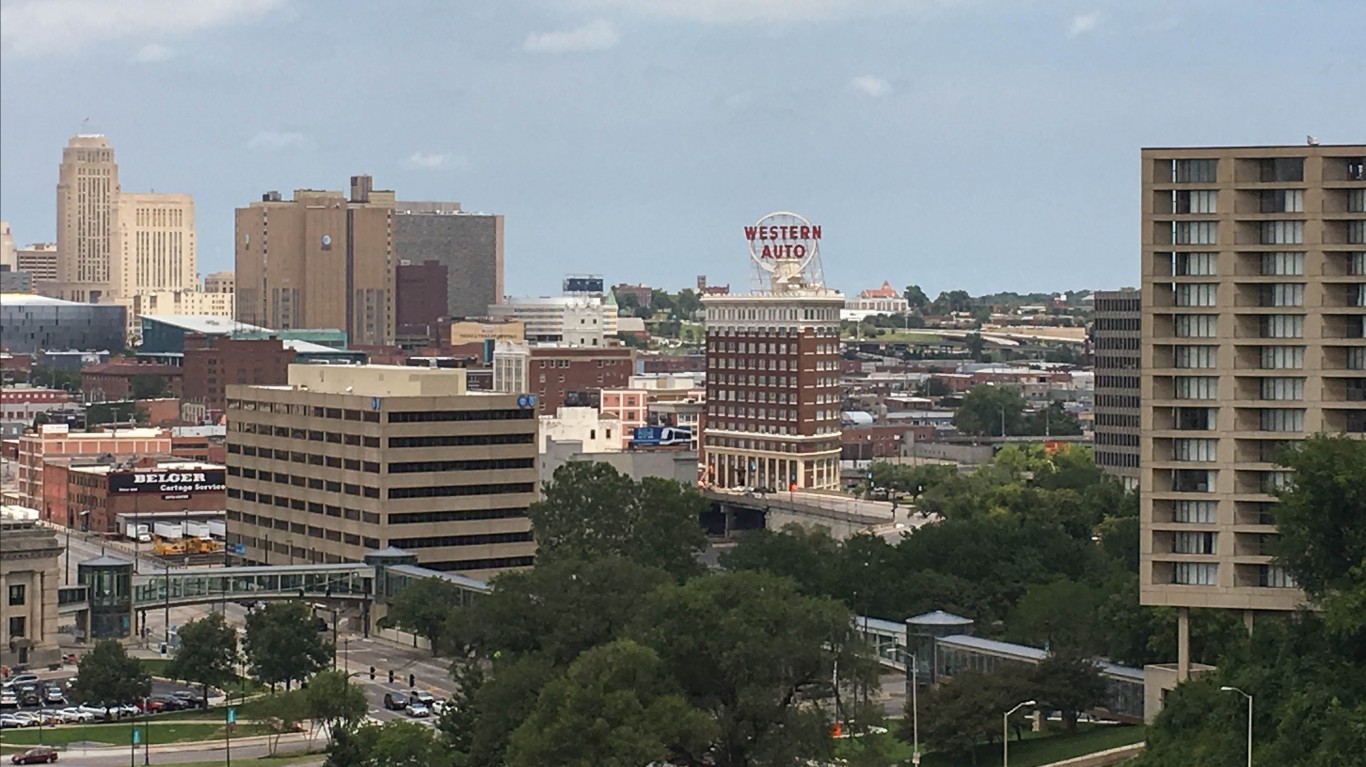
Just four years ago, Kansas City, Missouri, was heralded for bringing down its homicide count to just 82. However, murders are on the rise once again in the city. The city had 129 cases of murder and nonnegligent manslaughter reported in 2016 and 150 in 2017. Overall, the city’s violent crime rate is up compared to 2016 as well, rising 5.6% to of 1,724 incidents per 100,000 people.
[in-text-ad]
4. Memphis, Tennessee
> 2017 Violent crime rate: 2,003 per 100,000
> 2017 Homicides: 181
> Poverty rate: 27.6%
> Unemployment rate: 4.8%
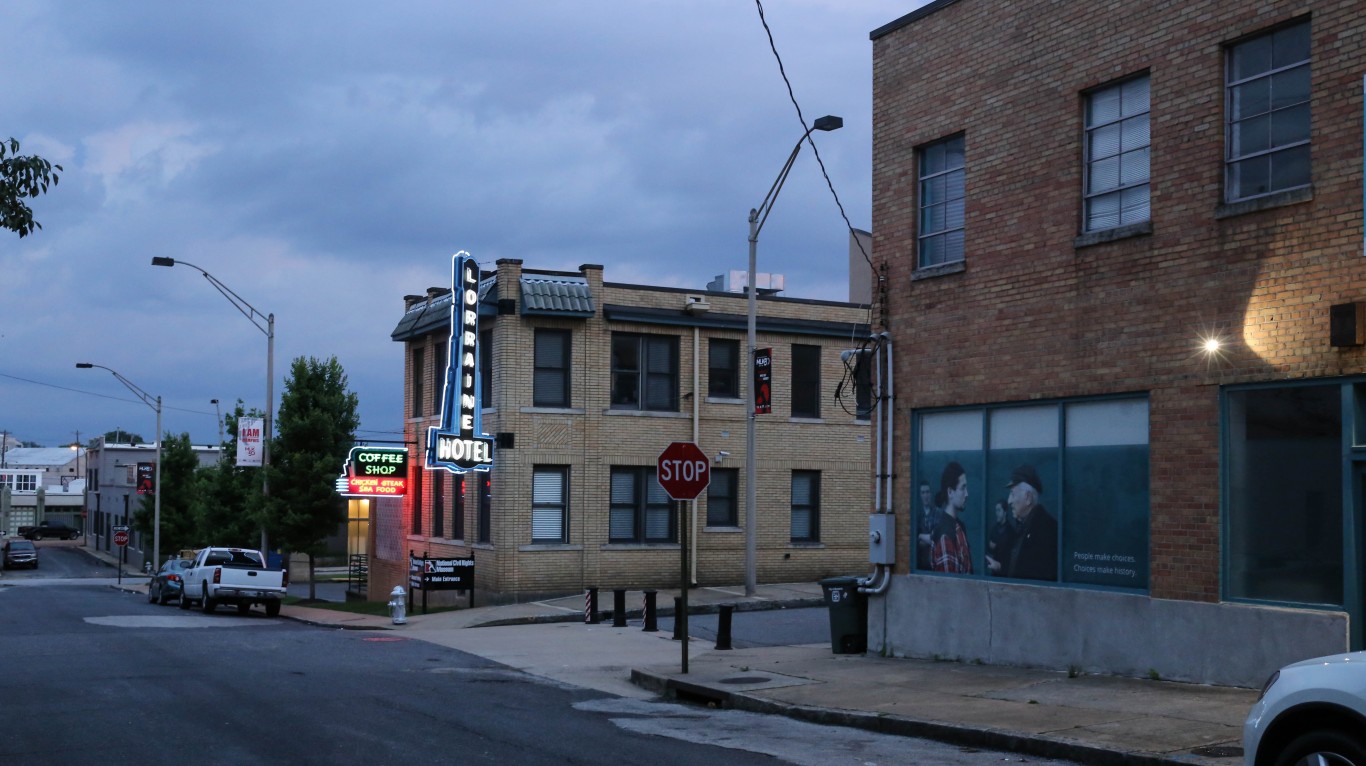
Memphis is known for the blues of Beale Street; Graceland, home of Elvis; and perhaps less so for another trait, being one of the most violent cities in the country. In this Mississippi River city, there were 653,000 violent crimes committed in 2017, equal to one for every roughly 50 residents. High poverty rates have been shown to sometimes lead to higher incidence of crime, and Memphis has a poverty rate of 27.6%, well above the national rate of 15.1%.

3. Baltimore, Maryland
> 2017 Violent crime rate: 2,027 per 100,000
> 2017 Homicides: 342
> Poverty rate: 23.1%
> Unemployment rate: 6.1%
Popular HBO series “The Wire” exposed many Americans to a fictionalized version of the real crime issues the city of Baltimore faces. And indeed, more than a decade and a half after the show originally aired, Baltimore continues to have serious problems with violent and non-violent crime. There were, for example, 8,879 robberies reported in the city last year, resulting in a robbery rate of 959 incidents per 100,000 people. This rate is close to 10 times the national robbery rate and was the highest of any major U.S. city.

2. Detroit, Michigan
> 2017 Violent crime rate: 2,057 per 100,000
> 2017 Homicides: 267
> Poverty rate: 39.4%
> Unemployment rate: 9.3%
There were 2,057 violent crimes per 100,000 people in Detroit in 2017, including 267 murders, respectively the second- and third-highest figures in the country. Detroit faces many of the serious underlying problems associated with high-crime cities. Nearly 40% of the population lives in poverty, and 9.3% of the labor force is unemployed, each the worst rates of any city with a population of at least 100,000.
[in-text-ad-2]

1. St. Louis, Missouri
> 2017 Violent crime rate: 2,082 per 100,000
> 2017 Homicides: 205
> Poverty rate: 26.7%
> Unemployment rate: 4.4%
There were 205 reported homicides in St. Louis in 2017. This is not the highest total for a single city that year, but adjusted for population, it is the highest murder rate in the country, at 67 per 100,000 people, compared to a national murder rate of 5 per 100,000. St. Louis’ 2017 murder count, in addition to its rapes, robberies, and aggravated assaults, combined for 6,461 incidents in 2017, or 2,082 per 100,000 residents — the highest violent crime rate of any major U.S. city.
Detailed Findings
Certain economic conditions are common in cities with the highest violent crime rates. Poverty rates in all of the 25 cities on this list except for Anchorage, Alaska, exceed the national rate of 15.1%; median annual household incomes in all but two of the cities are lower than the national median of $55,322; and unemployment rates in only seven of the 25 most dangerous cities do not exceed the national jobless rate of 4.4% in 2017.
While these foundational issues certainly help explain high crime levels in U.S. cities, Roman said, “what really leads to the violence is that poverty is really concentrated.” Many of the most dangerous cities are socially, racially, and economically segregated cities, he observed.
In other words, the concentration of crime in an area is largely tied to the concentration of affluence, job opportunities, and community resources. “Places that have been historically very dangerous become much much safer as economic development spreads.” Roman added.
To reverse crime spikes and support safe communities, resources are needed to support modern policing methods. Child and family welfare, mental health considerations, substance abuse, education, employment, housing, and more affect the problems that lead to violence in a community. “If you don’t have the resources to coordinate all of [these issues],” Roman explained, “all you’re left with is the cop on the beat.”
And while officers on patrol are often very effective at enforcing law and order, modern policing requires different approaches to different problems. Today’s police departments must address crime at the grassroots level, building relationships with the local community and supporting educational and extracurricular organizations. Many of the cities with high and rising violent crime levels were hit by the recession and have struggled to find the resources necessary to provide this service.
To identify the 25 most dangerous U.S. cities, 24/7 Wall St. reviewed violent crime rates in cities with at least 100,000 people from the FBI’s 2017 Uniform Crime Report released September 25, 2017. The total number and the rates of murder, non-negligent manslaughter, rape, robbery, and aggravated assault, which are included in the violent crime rate, as well as burglaries, larceny, and motor vehicle theft, which are classified as property crime, also came from the FBI’s report.
We considered these data for each year from 2012 through 2016. Population, and the number of police officers in each city in 2016, 2015, and in 2008 came from the FBI.
Annual unemployment rates for 2016 came from the Bureau of Labor Statistics (BLS). Median household income, poverty rates, and the percentage of households earning less than $10,000 a year came from the U.S. Census Bureau’s American Community Survey (ACS) and are five-year averages for the period 2011 to 2015.
Choosing the right (or wrong) time to claim Social Security can dramatically change your retirement. So, before making one of the biggest decisions of your financial life, it’s a smart idea to get an extra set of eyes on your complete financial situation.
A financial advisor can help you decide the right Social Security option for you and your family. Finding a qualified financial advisor doesn’t have to be hard. SmartAsset’s free tool matches you with up to three financial advisors who serve your area, and you can interview your advisor matches at no cost to decide which one is right for you.
Click here to match with up to 3 financial pros who would be excited to help you optimize your Social Security outcomes.
Have questions about retirement or personal finance? Email us at [email protected]!
By emailing your questions to 24/7 Wall St., you agree to have them published anonymously on a673b.bigscoots-temp.com.
By submitting your story, you understand and agree that we may use your story, or versions of it, in all media and platforms, including via third parties.
Thank you for reading! Have some feedback for us?
Contact the 24/7 Wall St. editorial team.