Special Report
America's Best States to Live In

Published:
Last Updated:

Each U.S. state has its advantages and shortcomings. Often, Americans live in the state they grew up in because it is familiar and feels like home. Other personal factors are often behind why people live in a certain state. However, there are several more objective factors that drive people to — or away from — a certain state, and can be used to help assess just how livable a state is.
These factors include an area’s economy, job market, crime rate, health care, and more. Sometimes the best way of measuring these factors is to look at an outcome that best reflects the combined effects of living in a state.
For example, differences in life expectancy between states can be caused by everything from differences in the regional quality of health care to the differences in state education systems and economies, which also can make a difference in health outcomes.
To identify America’s best states to live in, 24/7 Wall St. ranked states based on an index of three factors — life expectancy at birth, the bachelor’s attainment rate among adults, and the poverty rate. While there are many different measures we could have reviewed, these three collectively have been identified as an effective way to sum up quality of life in a state in terms of health and prosperity.
These are America’s best states to live in.
Click here to see the best states to live in.
Click here to see our detailed findings and methodology.
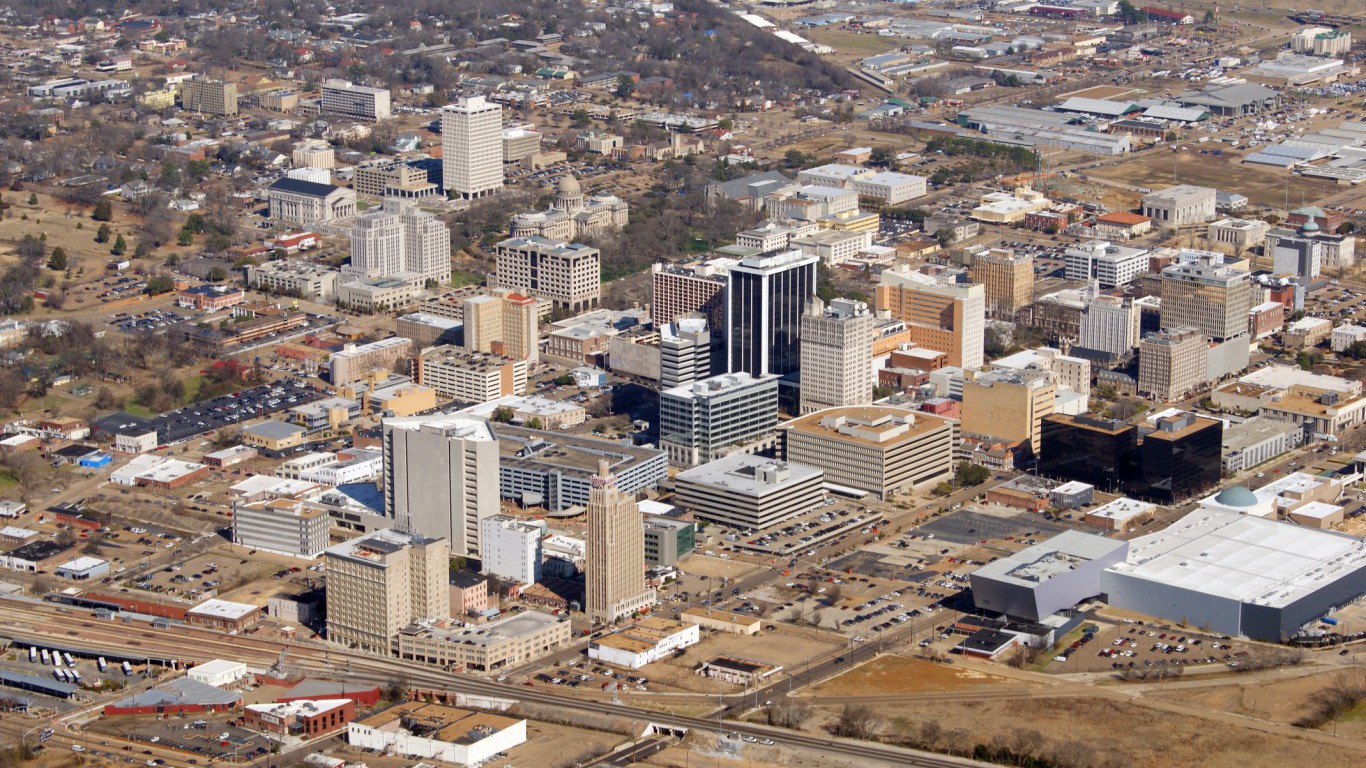
50. Mississippi
> 10-yr. population change: +2.2% (7th smallest increase)
> Annual unemployment: 5.1% (4th highest)
> Poverty rate: 19.8% (the highest)
> Life expectancy at birth: 74.9 years (the shortest)
Mississippi is the worst state to live in because it ranks last in a number of important measures that determine overall quality of life in a state. The state’s life expectancy of 74.9 years is the lowest of all states and more than 4 years below the U.S. life expectancy. The state’s poor life expectancy likely is in part due to suboptimal access to and quality of healthcare. The state also has the fewest primary care physicians per capita. It also has the third highest rate of preventable hospitalizations.
Poor health outcomes are far more likely to occur in low-income areas, and no state has a higher share of residents living in poverty than Mississippi. Some 19.8% of state residents live below the poverty line, compared to the 13.4% national poverty rate.
[in-text-ad]

49. West Virginia
> 10-yr. population change: +0.2% (2nd smallest increase)
> Annual unemployment: 5.2% (3rd highest)
> Poverty rate: 19.1% (4th highest)
> Life expectancy at birth: 76.0 years (4th shortest)
In West Virginia, only one in five adults have a bachelor’s degree, the smallest share of any state. Higher educational attainment can improve a person’s likelihood of attaining a higher-paying job and financial security. Studies have shown that college-educated people are more likely to live healthier lives. In West Virginia, 35.5% of adults are obese, a far greater obesity rate than the national rate of 28.0% and the highest of any state. Nearly one-quarter of state adults smoke, also the highest state rate.
Financial hardship is also very prevalent in West Virginia. About 19.1% of the state population lives in poverty — the fourth highest poverty rate of all states. The state’s annual median household income of $43,469 also is well below the national figure of $60,336 and is the lowest nationwide. Lower incomes in West Virginia are due partially to the state’s weak job market. In 2017, 5.2% of West Virginia’s labor force was out of a job, the third highest annual unemployment rate of all states.

48. Louisiana
> 10-yr. population change: +9.1% (20th largest increase)
> Annual unemployment: 5.1% (4th highest)
> Poverty rate: 19.7% (2nd highest)
> Life expectancy at birth: 75.8 years (3rd shortest)
Louisiana ranks as the third worst state to live in largely due to the state’s poor economic conditions, as evidenced by its high poverty rate. With a poverty rate of 19.7%, the state’s rate is tied with New Mexico’s for second highest in the country. Louisiana residents are also more likely to live in extreme poverty than those in any other state. Some 6.6% of families in the state earn less than $10,000 a year.
While the relationship between income and crime is complicated, areas with higher poverty rates tend to also have higher levels of violent crime. There is a strong correlation between poverty and crime, and Louisiana is one of the most dangerous states. It has one of the highest annual violent crime rates at 557 reported incidents per 100,000 citizens each year. Comparatively, the U.S. violent crime rate is 383 reported incidents per 100,000 people. Violent crime has been shown to affect not just the direct victims, but the community at large, causing stress and making neighborhoods less desirable for businesses.

47. Alabama
> 10-yr. population change: +5.3% (18th smallest increase)
> Annual unemployment: 4.4% (22nd highest)
> Poverty rate: 16.9% (6th highest)
> Life expectancy at birth: 75.7 years (2nd shortest)
Compared with residents in other states, Alabama’s population is much more likely to struggle financially. The median household income in Alabama of $48,123 a year is one of lowest in the nation. For perspective, the national median household income is $60,336. Also, nearly 17% of Alabama’s population lives in poverty, the sixth highest poverty rate among all states.
Income is closely tied with health outcomes. In part due to the state’s high poverty rate, Alabama’s population is one of the least healthy in the nation, contributing to its rank as fourth worst state to live. An average Alabama resident born today is projected to just barely live over 75 years, the second shortest life expectancy in the nation.
[in-text-ad-2]

46. Kentucky
> 10-yr. population change: +5.0% (15th smallest increase)
> Annual unemployment: 4.9% (9th highest)
> Poverty rate: 17.2% (5th highest)
> Life expectancy at birth: 76.3 years (7th shortest)
One of the reasons Kentucky ranks as the fifth worst state to live in is its high poverty rate. The state’s median household income of $48,375 a year is nearly $12,000 lower than the U.S. median. Of the state’s 4.5 million residents, 17.2% live in poverty, the fifth highest poverty rate of all states. Kentucky also has the fifth highest extreme poverty rate, as 5.6% of Kentucky families earn less than $10,000.
Another factor pushing Kentucky toward the bottom of the rankings is life expectancy. A person born in Kentucky today can be expected to live an average of 76.3 years, nearly three years shorter than the average American.

45. Arkansas
> 10-yr. population change: +6.0% (19th smallest increase)
> Annual unemployment: 3.7% (18th lowest)
> Poverty rate: 16.4% (7th highest)
> Life expectancy at birth: 76.2 years (6th shortest)
The median household income in Arkansas of $45,869 per year is well below the national figure of $60,336 per year and is the third lowest of all states. The cost of living is lower in Arkansas, with goods and services costing 13.1% less than they do on average nationwide. However, this is often not enough to offset the state’s low incomes as 16.4% of the population lives in poverty, more than the national rate of 13.4%.
Those who earn low incomes are less likely to be able to afford medical care. In Arkansas, 24.5% of adults report they are in poor health, the highest share in the nation. In addition, adults in Arkansas report a relatively high number of physically and mentally unhealthy days per month of about five for each — both the second most days of all states.
[in-text-ad]

44. Oklahoma
> 10-yr. population change: +8.7% (22nd largest increase)
> Annual unemployment: 4.3% (23rd highest)
> Poverty rate: 15.8% (8th highest)
> Life expectancy at birth: 76.1 years (5th shortest)
Oklahoma has one of the lower statewide life expectancies at 76.1 years, which contributes to its ranking as the seventh worst state in which to live. In recent years, no state’s life expectancy has grown at a slower pace. From 1980 to 2014, Oklahoma’s life expectancy increased just 3.4%, a full percentage point behind the next lowest increase, which was in Arkansas.
Oklahoma households tend to have significantly lower incomes than the typical American household. The state’s median household income of $50,051 a year is more than $10,000 below the U.S. median household income. Better-educated workers are more likely to earn high salaries, but Oklahoma’s bachelor’s degree attainment rate of 25.5% is one of the lowest nationwide.

43. New Mexico
> 10-yr. population change: +6.0% (20th smallest increase)
> Annual unemployment: 6.2% (2nd highest)
> Poverty rate: 19.7% (2nd highest)
> Life expectancy at birth: 78.4 years (17th shortest)
New Mexico has the second highest violent crime rate among states, as well as the highest property crime rate. The state’s high crime levels may be inhibiting economic development and could be a contributing factor in the state’s high unemployment rate. As of 2017, 6.2% of the workforce in New Mexico was unemployed, the second highest annual unemployment rate in the nation. New Mexico also has the highest share of families making less than $10,000 a year, at 6.6%, roughly double the national share of 3.8%. The poverty rate in the state of 19.7% also exceeds the national rate of 13.4%. It is the second highest poverty rate of all states.

42. Tennessee
> 10-yr. population change: +9.1% (21st largest increase)
> Annual unemployment: 3.7% (18th lowest)
> Poverty rate: 15.0% (10th highest)
> Life expectancy at birth: 76.3 years (8th shortest)
Adults in Tennessee are among the least active in the United States. Some 30.1% of adults say they do not exercise in their leisure time, the third highest rate among states and well above the U.S. rate of 23.0%. Adults who do not exercise are much more likely to be obese, and Tennessee also has one of the nation’s higher obesity rates, at 32.4%. Obese people are at higher risk of life-threatening conditions like heart disease and stroke. These health factors help explain Tennessee’s low life expectancy of 76.3 years, the eighth-shortest among states.
While crime is not part of the index, Tennessee’s high violent crime rate also affects quality of life in the state. There are 651.5 violent crimes per 100,000 state residents annually, much higher than the U.S. violent crime rate of 382.9 per 100,000.
[in-text-ad-2]

41. South Carolina
> 10-yr. population change: +14.0% (9th largest increase)
> Annual unemployment: 4.3% (23rd highest)
> Poverty rate: 15.4% (9th highest)
> Life expectancy at birth: 76.9 years (9th shortest)
Property crime is a serious issue in South Carolina. There were 3,195 property crimes for every 100,000 state residents in 2017, the fourth highest property crime rate of any state. The median household income is also relatively low in South Carolina, at $50,570 per year, the ninth lowest income among states and well below the national figure of $60,336.
Additionally, the state’s poverty rate of 15.4% is above the national poverty rate of 13.4% and is the ninth highest rate among all states. However, these socioeconomic drawbacks do not appear to be deterring newcomers to the state. In the past 10 years, the population grew by 14.0%, a much faster population growth rate than the U.S. population growth rate of 8.0%.

40. Indiana
> 10-yr. population change: +5.1% (16th smallest increase)
> Annual unemployment: 3.5% (14th lowest)
> Poverty rate: 13.5% (20th highest)
> Life expectancy at birth: 77.7 years (11th shortest)
In Indiana, the share of adults who have at least a bachelor’s degree is relatively low. Only 26.8% have a four-year college degree or higher, the 10th lowest share nationwide and below the comparable national share of 32.0%. Higher educational attainment often leads to higher-paying jobs. It is not surprising that in Indiana — where the educational attainment rate is below average — the annual median household income of $54,181 falls well below the national figure of $60,336.
Indiana adults also have generally poor health outcomes. About 32.0% of adults are obese, the 10th highest share among all states and well above the national obesity rate of 28.0%. Poor health behaviors and outcomes likely contribute to Indiana’s low life expectancy. An individual born today in Indiana is projected to live to about 77 years — the 11th shortest life expectancy among all states.
[in-text-ad]

39. Georgia
> 10-yr. population change: +9.3% (18th largest increase)
> Annual unemployment: 4.7% (14th highest)
> Poverty rate: 14.9% (11th highest)
> Life expectancy at birth: 77.4 years (10th shortest)
Georgia residents are more likely than the typical American to live in poverty. The state’s poverty rate of 14.9% exceeds the country’s 13.4% rate. Georgia also has a relatively high share of families living in extreme poverty, at 4.4%.
The average life expectancy in Georgia is shorter than the U.S. average by more than a full year. The state’s life expectancy is just 77.4 years, as compared to the national life expectancy of 79.1 years. The state’s low life expectancy may be in part the result of residents not receiving care when they need it, either because they cannot afford it, or because they lack health coverage. State residents may have a harder time affording medical treatment, as 13.4% do not have health insurance — the fourth highest rate among states.

38. Nevada
> 10-yr. population change: +16.9% (4th largest increase)
> Annual unemployment: 5.0% (6th highest)
> Poverty rate: 13.0% (24th highest)
> Life expectancy at birth: 78.1 years (15th shortest)
As of 2017, 5.0% of Nevada’s labor force was out of a job, the sixth highest unemployment rate of all states. Acquiring higher educational can improve the likelihood of securing a steady job that pays well. However, only about one in four Nevada adults have a bachelor’s degree, the sixth lowest share among states. The majority of Americans with health insurance are covered through their employer. In Nevada, 11.2% of residents do not have health insurance coverage, the eighth highest share among all states and well above the comparable U.S. share of 8.7%.
About 21.3% of Nevada households also have at least one of four problems related to housing: overcrowding, high housing costs, lack of kitchen, or lack of plumbing facilities. Despite all of these issues, Nevada is attracting new residents at a fast pace. The state’s population grew by nearly 17.0% in the past decade, the fourth largest population growth rate of all states.

37. Ohio
> 10-yr. population change: +1.7% (5th smallest increase)
> Annual unemployment: 5.0% (6th highest)
> Poverty rate: 14.0% (17th highest)
> Life expectancy at birth: 77.9 years (14th shortest)
Ohio has the seventh largest population of all states, with roughly 11.7 million people. The median annual household income of $54,021 is below the national figure of $60,336. However, the cost of living in Ohio may offset the below average incomes. Goods and services in the state cost 10.7% less than they do on average nationwide.
Ohio’s unemployment has not improved in 2017, a year when nationwide unemployment declined. The state’s 2017 unemployment rate of 2017 remained at 5%, the same as in 2016, and remained above the national jobless rate of 4.4%. The stagnant labor force has likely not attracted newcomers.The state’s population growth rate of only 1.7% in the past decade was seventh slowest of any state.
[in-text-ad-2]

36. Missouri
> 10-yr. population change: +4.0% (13th smallest increase)
> Annual unemployment: 3.8% (20th lowest)
> Poverty rate: 13.4% (21st highest)
> Life expectancy at birth: 77.7 years (12th shortest)
Missouri has one of the shorter state life expectancies. An average Missourian born today can expect to live 77.7 years, more than a full year less than the U.S. life expectancy. The state ranks as one of the worst in a number of health factors, including preventable hospitalization, a measure which is often used as a proxy for the quality of medical care in an area.
Missouri ranks as the 15th worst state in which to live, but in one of the three measures used in the index, the Show Me State actually compares favorably to other states that rank as among the worst places to live. The state’s 13.4% poverty rate is in line with the national rate. Missouri’s population grew 4% between 2007 and 2017, half the national growth rate. Slow population growth can signify that a state is a less desirable place to live than other states.

35. North Carolina
> 10-yr. population change: +13.4% (10th largest increase)
> Annual unemployment: 4.6% (17th highest)
> Poverty rate: 14.7% (13th highest)
> Life expectancy at birth: 77.9 years (13th shortest)
North Carolina’s population has grown significantly in the past decade. The Tar Heel State has witnessed a 13.4% population increase over the last 10 years, a faster growth rate than the national population growth rate of just 8.0%. However, North Carolina falls behind in a few socioeconomic indicators — in comparison with nationwide measures and some other states. For example, the state’s median annual household income of $52,752 is lower than the national figure of $60,336 a year, and 14.7% of the population lives in poverty, which surpasses the national poverty rate of 13.4%.
Life expectancy also falls short in North Carolina. If born today, an individual in the state is projected to live to nearly 78 years, one of the shorter life expectancies nationwide. The Chlamydia rate is also abnormally high in the state, at roughly 647 cases per every 100,000 people, the third highest rate among all states. Burglary is also an issue, with about 630 home break ins per 100,000 residents, the eighth highest burglary rate in the country.
[in-text-ad]
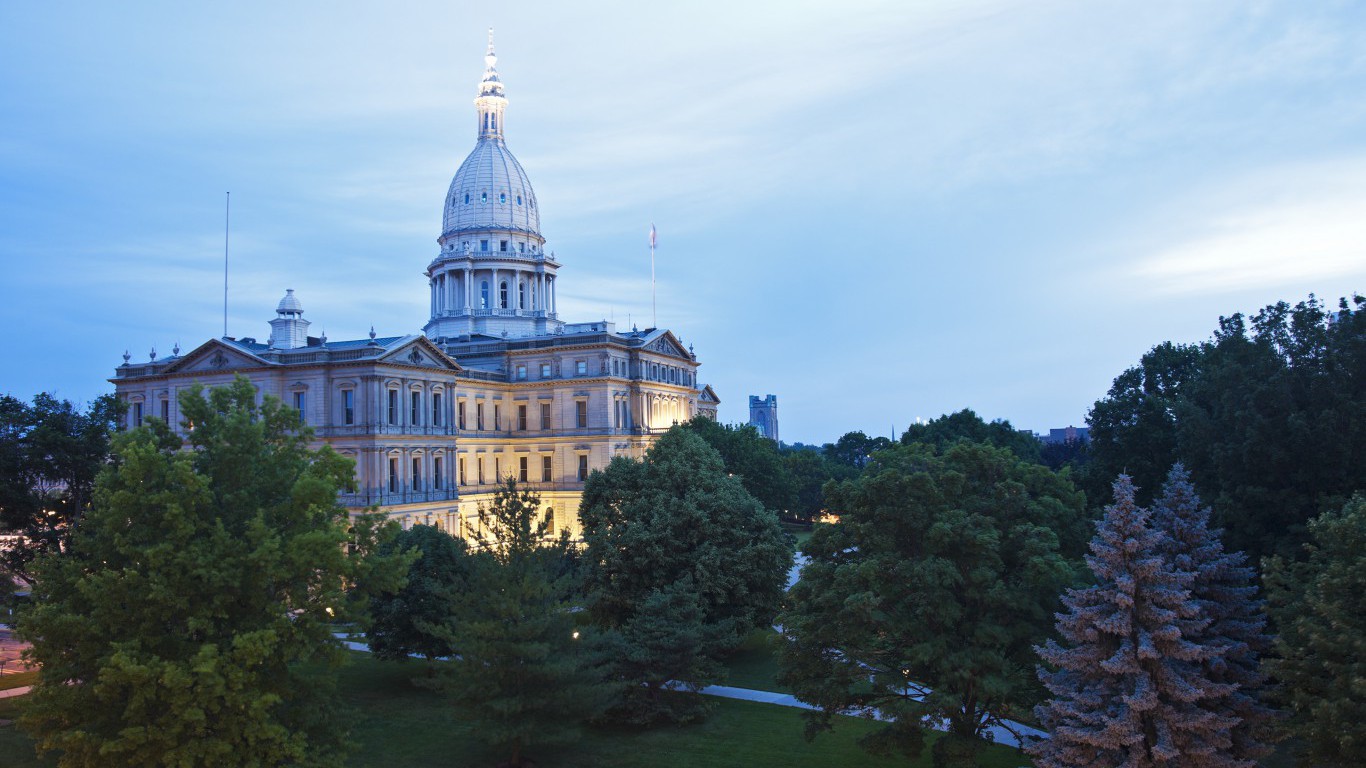
34. Michigan
> 10-yr. population change: -1.1% (the largest decline)
> Annual unemployment: 4.6% (17th highest)
> Poverty rate: 14.2% (15th highest)
> Life expectancy at birth: 78.3 years (16th shortest)
Michigan’s population is declining at a faster rate than any other state. Michigan and Illinois are the only two states where the population has decreased since 2007. The population declined by more than 100,000 people in the last 10 years. Declining population is often a sign of poor economic and social conditions.
Michigan residents are more likely to be unemployed or live in poverty than the typical American. The state’s poverty rate is 14.2%, the fifteenth highest in the country. The state also has one of the lower median household incomes in the country. At $54,909 a year, the typical Michigan household earns more than $5,000 less than the typical American household.

33. Texas
> 10-yr. population change: +18.4% (the largest increase)
> Annual unemployment: 4.3% (23rd highest)
> Poverty rate: 14.7% (13th highest)
> Life expectancy at birth: 78.5 years (19th shortest)
Most Americans get their health insurance through their employer. Even though Texas has one of the lower unemployment rates in the country, it has the largest share of uninsured residents. Of the state’s adult population, 17.3% have no health insurance, nearly double the U.S. uninsured rate. Texans could also struggle to find medical care, as there are just 61 doctors per 100,000 residents, one of the lowest doctor-to-population ratios nationwide.
Though the state has challenges, people are flocking to Texas. The state’s population has grown more quickly than the other 49 states over the past decade, growing to 28.3 million in 2017, an 18.4% increase since 2007.

32. Arizona
> 10-yr. population change: +10.7% (14th largest increase)
> Annual unemployment: 4.9% (9th highest)
> Poverty rate: 14.9% (11th highest)
> Life expectancy at birth: 79.6 years (17th longest)
Arizona struggles with crime and economic issues more than many other states. For example, about 14.9% of state residents live in poverty, down from 16.4% the previous year but still above the national poverty rate of 13.4%. Violent crime can severely diminish the quality of life in a region — not just for the victims but the broader community as well. In Arizona, there were 508 violent crimes for every 100,000 state residents in 2017, well above the national violent crime rate of 383 for every 100,000 Americans.
[in-text-ad-2]
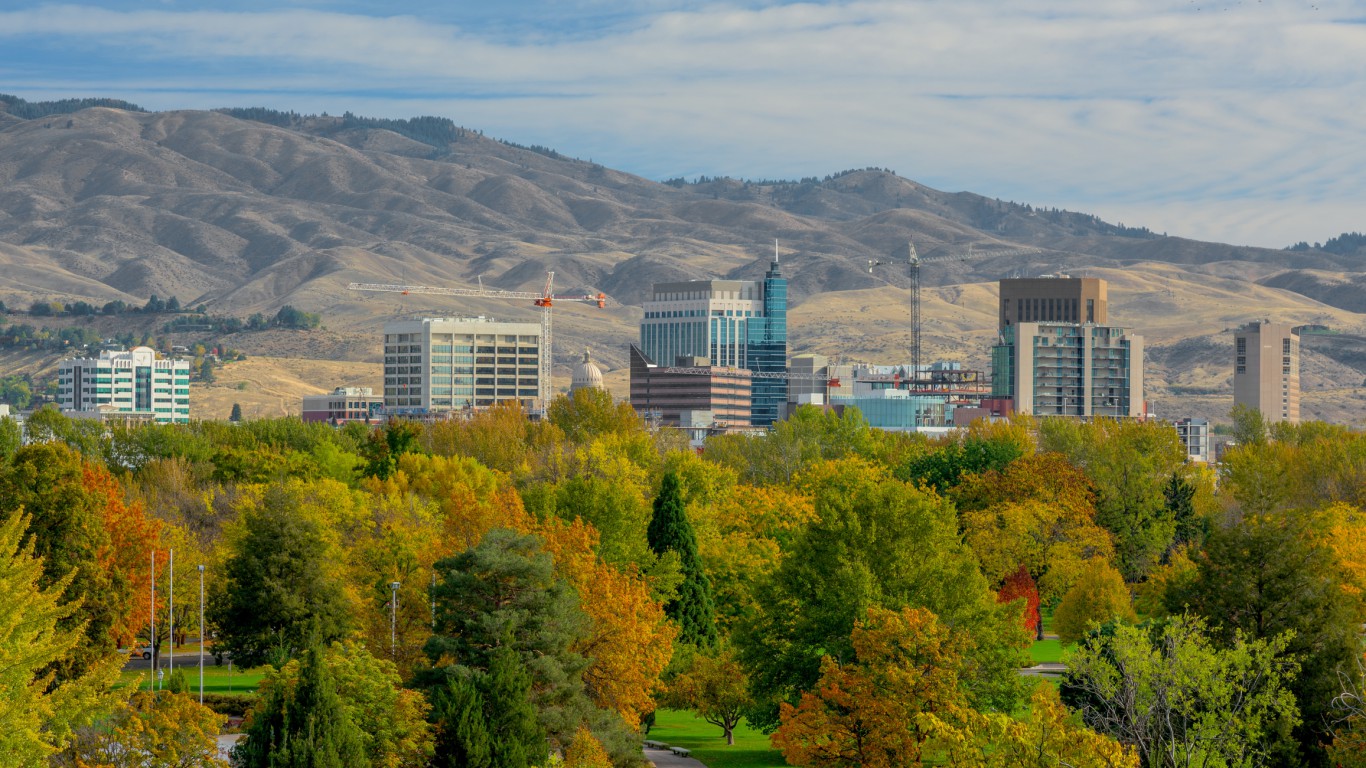
31. Idaho
> 10-yr. population change: +14.5% (7th largest increase)
> Annual unemployment: 3.2% (9th lowest)
> Poverty rate: 12.8% (25th lowest)
> Life expectancy at birth: 79.5 years (20th longest)
The typical household in Idaho earns $52,225 a year, the 10th lowest median household income among states. Though Idaho’s income ranks worse than the majority of states, not all measures point to the state being a bad place to live. A relatively small share of residents are impoverished. The state’s poverty rate of 12.8% is below the U.S. rate of 13.4%. Some 3.0% of families in the state live on less than $10,000 a year, compared to 3.8% of households across the country. Relatively few Idaho residents struggle to find a job, as its annual unemployment rate of 3.2% is lower than all but a handful of states.

30. Delaware
> 10-yr. population change: +11.2% (11th largest increase)
> Annual unemployment: 4.6% (17th highest)
> Poverty rate: 13.6% (19th highest)
> Life expectancy at birth: 78.7 years (21st shortest)
The median household income in Delaware of $62,852 is just slightly above the national median household income of $60,336. There is, however, a high level of economic disparity in Delaware. The state has the ninth highest share of families that make under $10,000 a year, at 4.6%, exceeding the comparable national share of 3.8%.
[in-text-ad]

29. Wyoming
> 10-yr. population change: +10.8% (13th largest increase)
> Annual unemployment: 4.2% (25th lowest)
> Poverty rate: 11.3% (19th lowest)
> Life expectancy at birth: 78.6 years (20th shortest)
Wyoming has the smallest population of the 50 states, but it is growing faster than most. From 2007 to 2017, the state’s population increased by more than 10%. The state’s median household income of $60,434 a year is roughly in line with the U.S. median household income.
Wyoming is one of just two states, along with Alabama, whose annual unemployment dropped by more than a full percentage point from 2016 to 2017. Wyoming’s unemployment rate dropped by 1.1 percentage point, while the U.S. annual unemployment dropped 0.5 percentage points. The state’s annual unemployment rate of 4.2% is just below the national rate of 4.4%.

28. Florida
> 10-yr. population change: +15.0% (6th largest increase)
> Annual unemployment: 4.2% (25th lowest)
> Poverty rate: 14.0% (17th highest)
> Life expectancy at birth: 79.5 years (21st longest)
Florida has one of the higher life expectancies of all states, at 79.5 years, just slightly above the life expectancy nationwide of 79.1 years. While Florida ranks high in life expectancy, it ranks on the lower end in several socioeconomic measures. The median national income of $52,594 is lower than the national figure of $60,336, and the poverty rate of 14.0% exceeds the national rate of 13.4%. Americans with lower incomes are less likely to have health insurance coverage. In Florida, nearly 13.0% of residents do not have health insurance, the fifth highest share among all states.
The housing situation in Florida appears to be less than ideal. About 21.5% of households experience a problem with at least one of the following issues: overcrowding, high housing costs, a lack of kitchen, or a lack of plumbing facilities. Floridians also have a longer commute to work than most other states. Some 39.5% of commuters drive at least 30 minutes to work, the seventh highest share of any state.

27. South Dakota
> 10-yr. population change: +9.2% (19th largest increase)
> Annual unemployment: 3.3% (12th lowest)
> Poverty rate: 13.0% (24th highest)
> Life expectancy at birth: 79.6 years (19th longest)
South Dakota residents report feeling healthier than those in any other state. Just 11.8% of South Dakota adults report they are in either fair or poor health — the lowest share of any state. This means that more than 88% of adults say they are in good, very good, or excellent health. Nationwide, 16.0% of Americans report being in fair or poor health. South Dakota is also one of the more inexpensive places to live. Residents spend about 88 cents on goods and services for every dollar the typical American spends.
South Dakota is one of just three states that had an increase in unemployment in 2017. The state is tied with Alaska for the largest increase in unemployment — 0.3 percentage points. Nationwide, unemployment fell 0.5 percentage points during that time.
[in-text-ad-2]

26. Alaska
> 10-yr. population change: +8.2% (23rd largest increase)
> Annual unemployment: 7.2% (the highest)
> Poverty rate: 11.1% (16th lowest)
> Life expectancy at birth: 78.4 years (18th shortest)
Alaska is one of the most affluent states, with a median household income of $73,181 a year — nearly $13,000 above the national median. High-income states typically have a higher than average cost of living as well, and in Alaska, goods and services cost 5.4% more on average than they do nationwide. In Alaska, however, the cost of living is likely higher because of how much the non-contiguous state depends on imports. Alaska also has a relatively low poverty rate of 11.1%, below the national rate of 13.4%. There are several measures that Alaska falls behind.
A whopping 13.7% of Alaska residents do not have health insurance, the third largest share among states and far more than the 8.7% of uninsured Americans nationwide. Alaska crime levels also are high. The state has the highest rates of rape, aggravated assault, and motor vehicle theft than any other state. This non-contiguous state also has the highest unemployment rate in the nation at 7.2%.

25. Pennsylvania
> 10-yr. population change: +3.0% (10th smallest increase)
> Annual unemployment: 4.9% (9th highest)
> Poverty rate: 12.5% (23rd lowest)
> Life expectancy at birth: 78.8 years (23rd shortest)
At 4.9%, Pennsylvania has one of the 10 highest 2017 unemployment rates in the country. The state’s median household income is also more than $1,000 below the U.S. median. This high unemployment rate and lower income may contribute to the state’s relatively stagnant population growth. Over the past decade, Pennsylvania’s population increased just 3.0%, while America’s population grew 8.0%. Still, Pennsylvania is the fifth-most populous state with more than 12.8 million people.
Pennsylvania is one of the safer states in the country, as the violent crime rate is 313.3 per 100,000. The U.S. violent crime rate is 382.9 reported instances per 100,000 Americans.There are also relatively few property crimes in the state. Pennsylvania has some of the lowest incidence of burglary, larceny, and car theft nationwide.
[in-text-ad]

24. Montana
> 10-yr. population change: +9.7% (17th largest increase)
> Annual unemployment: 4.0% (21st lowest)
> Poverty rate: 12.5% (23rd lowest)
> Life expectancy at birth: 78.9 years (24th shortest)
Adults with a college education are more likely to lead longer, healthier lives and avoid serious financial hardship. In Montana, 32.3% of adults have a bachelor’s degree, which is in line with the 32.0% nationwide attainment rate. The poverty rate in Montana of 12.5% is also among the lowest in the nation, and less than the national rate of 13.4%. However, just like other states, Montana has its issues.
The state has the second highest share of alcohol-related driving deaths. Nearly 48.0% of all driving deaths are attributable to driving while intoxicated, well above the national rate of 29.0%. Additionally, the median annual household income of $53,386 a year is about $7,000 below the national figure of $60,336.

23. Kansas
> 10-yr. population change: +4.9% (14th smallest increase)
> Annual unemployment: 3.6% (15th lowest)
> Poverty rate: 11.9% (21st lowest)
> Life expectancy at birth: 78.7 years (22nd shortest)
Though the life expectancy at birth in Kansas of 78.7 years is better than most other states, it is still slightly below the U.S. life expectancy of 79.1 years. The state’s life expectancy has increased 4.9% since 1980, behind the national increase of 7.2%. Kansas has one of the highest obesity rates in the country, at 32.4%, meaning nearly a third of Kansas adults are at an elevated risk of high blood pressure, stroke, and heart disease.
Kansas residents are some of the best educated in the country. The state has a 91.0% high school graduation rate and a 33.7% bachelor’s degree attainment rate — both some of the higher rates in the country. High levels of education make a person more likely to be able to find a job, and Kansas also has one of the lower annual unemployment rates, at 3.6%.

22. Oregon
> 10-yr. population change: +10.5% (15th largest increase)
> Annual unemployment: 4.1% (23rd lowest)
> Poverty rate: 13.2% (23rd highest)
> Life expectancy at birth: 79.4 years (22nd longest)
While the median annual household income in Oregon of $60,212 a year is in line with the national figure of $60,336, the share of people using food stamps is very high. Approximately 15.4% of state residents use food stamps and SNAP benefits, a much greater share than the 11.7% who do nationwide and the fourth largest share among states. Oregon residents also experience comparatively little crime. There were only about 282 violent crimes for every 100,000 state residents, well below the national rate of 383 violent crimes per every 100,000 Americans.
As far as health measures go, Oregon residents appear to be in good health. Oregon has the second lowest share of babies born at a low birth weight, which is indicative of good health. Adults in Oregon are also more likely to lead active lifestyles. About 84.2% of adults in the state exercise, the second highest share in the nation. Oregon also has some of the highest concentrations of primary care, dentists, and mental health providers per 100,000 people of any state.
[in-text-ad-2]

21. Illinois
> 10-yr. population change: -0.4% (2nd largest decline)
> Annual unemployment: 5.0% (6th highest)
> Poverty rate: 12.6% (24th lowest)
> Life expectancy at birth: 79.0 years (25th shortest)
Illinois is one of the only two states whose population declined since 2007, dropping by 0.4%. Only Michigan had a larger population decline. Still, Illinois is one of the better places to live in the country. The typical household in the state earns $62,992 a year, more than $2,500 higher than the U.S. median household income.
Though the state’s annual unemployment rate of 5.0% is the sixth highest among states, it is improving relatively quickly. The state’s unemployment rate dropped 0.8 percentage points, compared to the U.S. decline in annual unemployment of 0.5 percentage points.
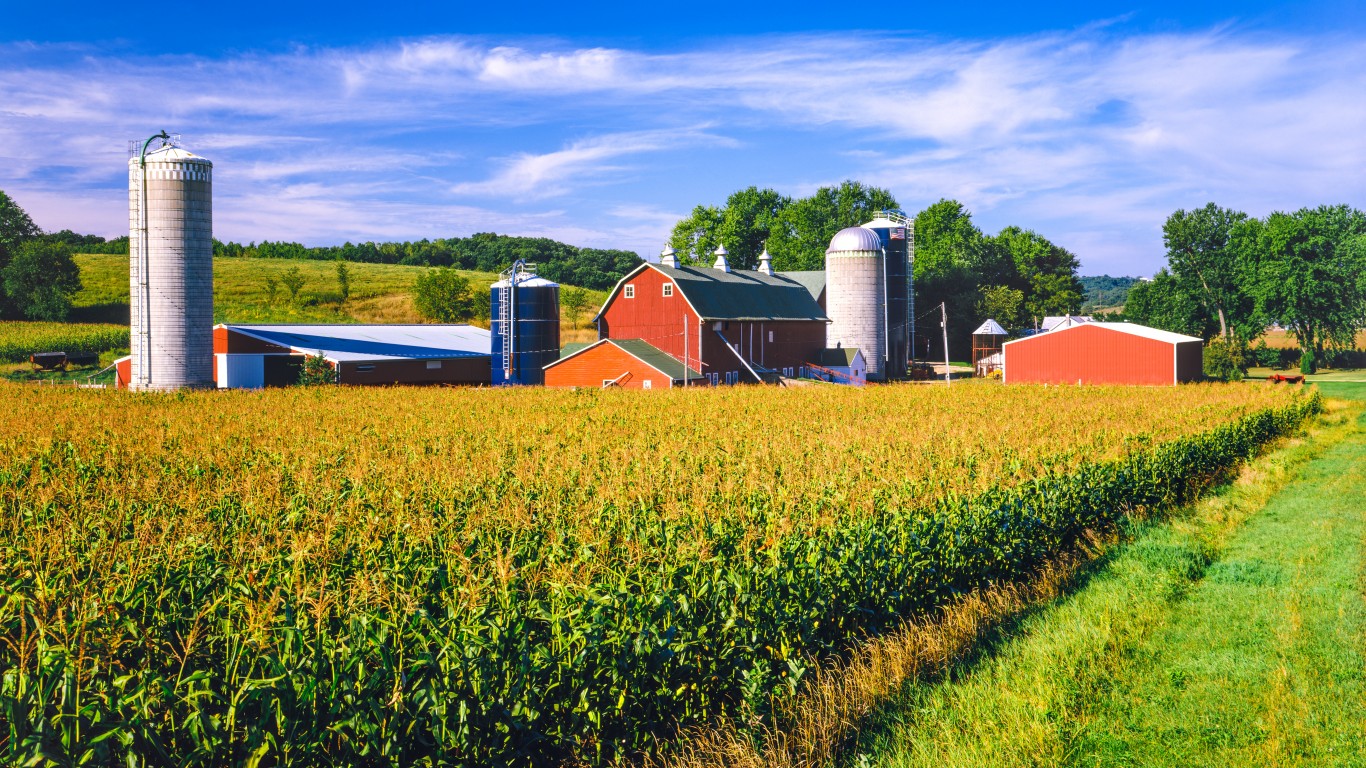
20. Iowa
> 10-yr. population change: +5.3% (17th smallest increase)
> Annual unemployment: 3.1% (7th lowest)
> Poverty rate: 10.7% (12th lowest)
> Life expectancy at birth: 79.7 years (16th longest)
Iowa has a relatively strong economy. The annual unemployment rate of just 3.1% is the seventh lowest in the nation and below the national unemployment rate of 4.4%. In addition, only 2.5% of families in Iowa make less than $10,000 a year, the sixth lowest share in the nation and below the national share of 3.8%. While the annual median household income of $58,570 a year is below the national figure of $60,336, the cost of living in Iowa is lower than in most other states. Good and services cost about 9.8% less in the state than they do on average nationwide.
The share of people who have health insurance in Iowa is also high, at 95.3%, the sixth highest share of all states and above the comparable national share of 91.3%.
[in-text-ad]
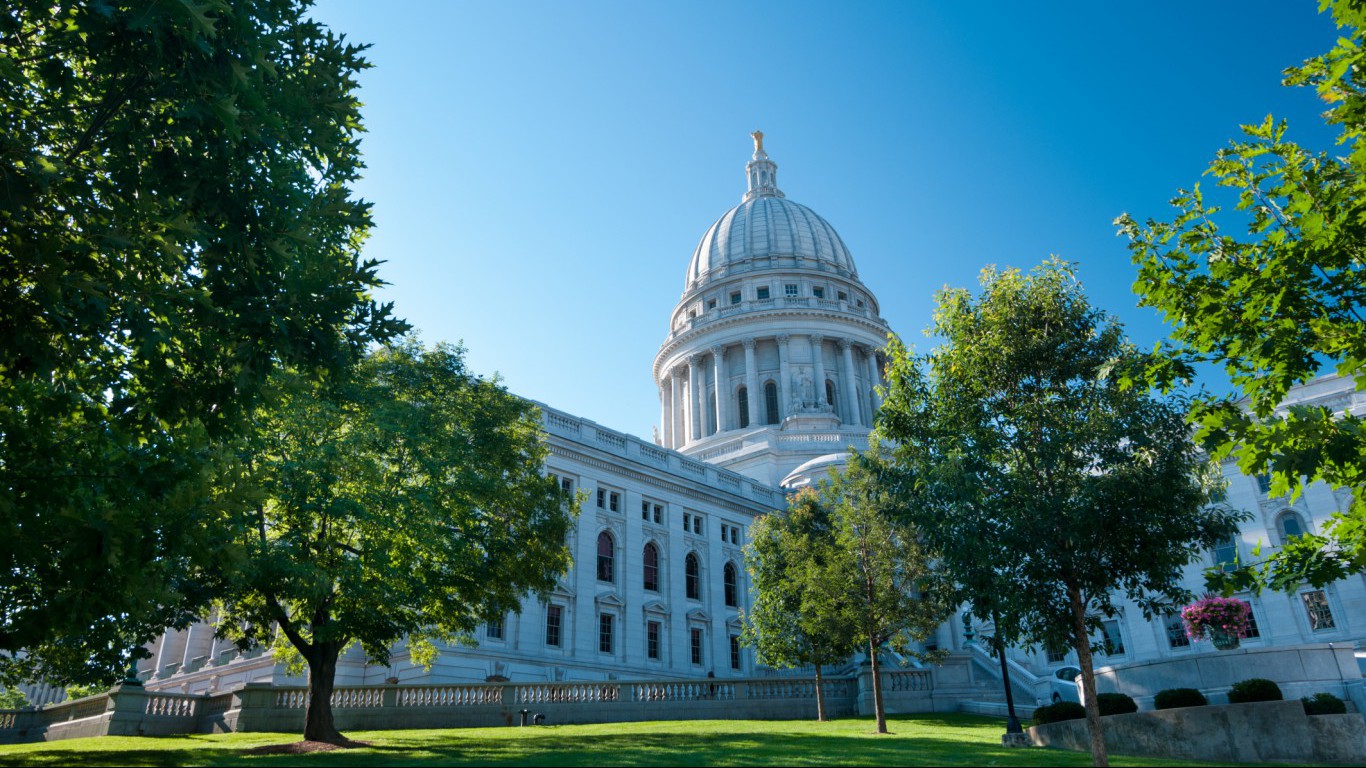
19. Wisconsin
> 10-yr. population change: +3.5% (11th smallest increase)
> Annual unemployment: 3.3% (12th lowest)
> Poverty rate: 11.3% (19th lowest)
> Life expectancy at birth: 79.8 years (14th longest)
Wisconsin has the highest excessive drinking rate in the country. Some 26.2% of state residents report drinking to excess. Excessive drinking can lead to long-term health problems such as liver disease. Excessive drinking can lead to long-term health problems such as liver disease. Still, Wisconsin’s health outcomes tend to be better than national outcomes. The state’s average life expectancy of 79.8 years is longer than the U.S. life expectancy of 79.1 years.
Though the state’s median household income of $59,305 is more than $1,000 lower than the U.S. median, it is still higher than most other states, ranking 22nd. Wisconsin also has a relatively low unemployment rate of just 3.3%.

18. Maine
> 10-yr. population change: +1.4% (4th smallest increase)
> Annual unemployment: 3.3% (12th lowest)
> Poverty rate: 11.1% (16th lowest)
> Life expectancy at birth: 79.3 years (23rd longest)
Residents in Maine tend to have better access to medical care than most states. There are about 111 primary care providers for every 100,000 people in Maine, the second highest concentration of all states. The state also has the third highest concentration of mental health providers, with 441 providers per every 100,000 residents. Having regular checkups can potentially help lengthen one’s life. Life expectancy in Maine of 79.3 is in line with the national life expectancy of 79.1 years.
Maine also has a low crime rate. There are only 121 violent crimes per 100,000 state residents, the lowest violent crime rate of all states. The property crime rate in Maine is also low at 1,507 crimes for every 100,000 residents — the fourth lowest rate in the nation.

17. Nebraska
> 10-yr. population change: +8.2% (24th largest increase)
> Annual unemployment: 2.9% (5th lowest)
> Poverty rate: 10.8% (13th lowest)
> Life expectancy at birth: 79.6 years (17th longest)
Nebraska is one of just a handful of states with an unemployment rate below 3.0%. As a result, many Iowans are able to provide for their families and keep them out of poverty. The state’s poverty rate of 10.8% is below the nationwide rate of 13.4%.
Nebraska adults tend to report feeling healthier than residents of most other states. Residents report 3.2 mentally and physically unhealthy days in the past month, the fifth and seventh fewest days, respectively, when compared to all states. Nebraska also has one of the higher life expectancies in the nation at 79.6 years.
[in-text-ad-2]

16. New York
> 10-yr. population change: +2.9% (9th smallest increase)
> Annual unemployment: 4.7% (14th highest)
> Poverty rate: 14.1% (16th highest)
> Life expectancy at birth: 80.4 years (6th longest)
New Yorkers live some of the longest lives in the nation. The life expectancy of the average New Yorker is 80.4 years, about a year more than the 79.1 years the typical American lives. New York also has one of the higher median household incomes, at $64,894 a year, which exceeds the national figure by about $4,500.
However, the wealth is nowhere near evenly distributed in the state. New York has the highest ratio of high income to low income households. Those in the 80th percentile of income in the state earn about 5.7 times the income those in the 20th percentile earn. Nationwide, those in the 80th percentile of income make 5.0 times the income than those in the 20th percentile.

15. Rhode Island
> 10-yr. population change: +0.2% (the smallest increase)
> Annual unemployment: 4.5% (21st highest)
> Poverty rate: 11.6% (20th lowest)
> Life expectancy at birth: 79.8 years (15th longest)
Rhode Island has one of the highest life expectancies in the country at 79.8, which makes it one of the better places to live. It is also one of the safer states. In Rhode Island, the murder rate is just 1.9 per 100,000. Nationwide, the rate of murder and nonnegligent manslaughter is 5.3 per 100,000 people. Lower murder and violent crime rates can give area residents a better sense of security and increased well-being as compared to a high-crime area.
Rhode Island residents are some of the more affluent in America, with a median household income of $63,870 a year. They are also better able to visit the doctor as there are 96 primary care physicians per 100,000 people, a concentration well above the national one. Despite these advantages, few people are moving to the state. Rhode Island’s population change of 0.2% over the last decade is one of the lowest of all states.
[in-text-ad]
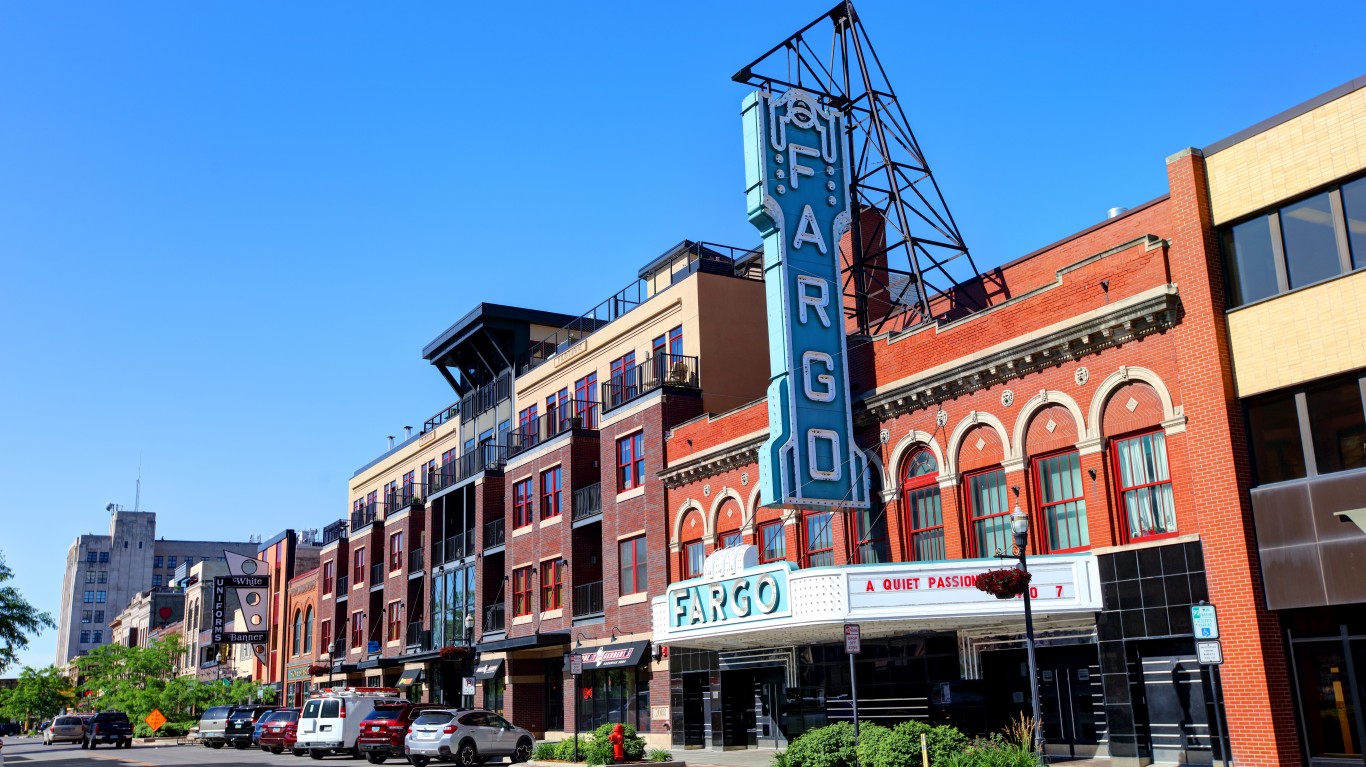
14. North Dakota
> 10-yr. population change: +18.1% (2nd largest increase)
> Annual unemployment: 2.6% (2nd lowest)
> Poverty rate: 10.3% (9th lowest)
> Life expectancy at birth: 80.0 years (12th longest)
North Dakota, the state that has become the poster child to shale oil extraction, continues to attract newcomers. The state’s population posted an 18.1% growth over the past 10 years, more than double the national population growth rate of 8.0% over the same time, and the second highest rate of all states.That is more than double the national population growth rate of 8.0% over the same time and the second highest rate of all states. The state’s low annual unemployment rate of just 2.6% likely contributes to its desirability. For perspective, the national unemployment rate is 4.4%. North Dakota also has one of the lowest poverty rates. Only 10.3% of residents in live in poverty, the ninth lowest rate of any state and below the national poverty rate of 13.4%.
Life expectancy is also high in North Dakota. If born today, the average state resident is projected to live to 80 years, the 12th longest life expectancy of all states.
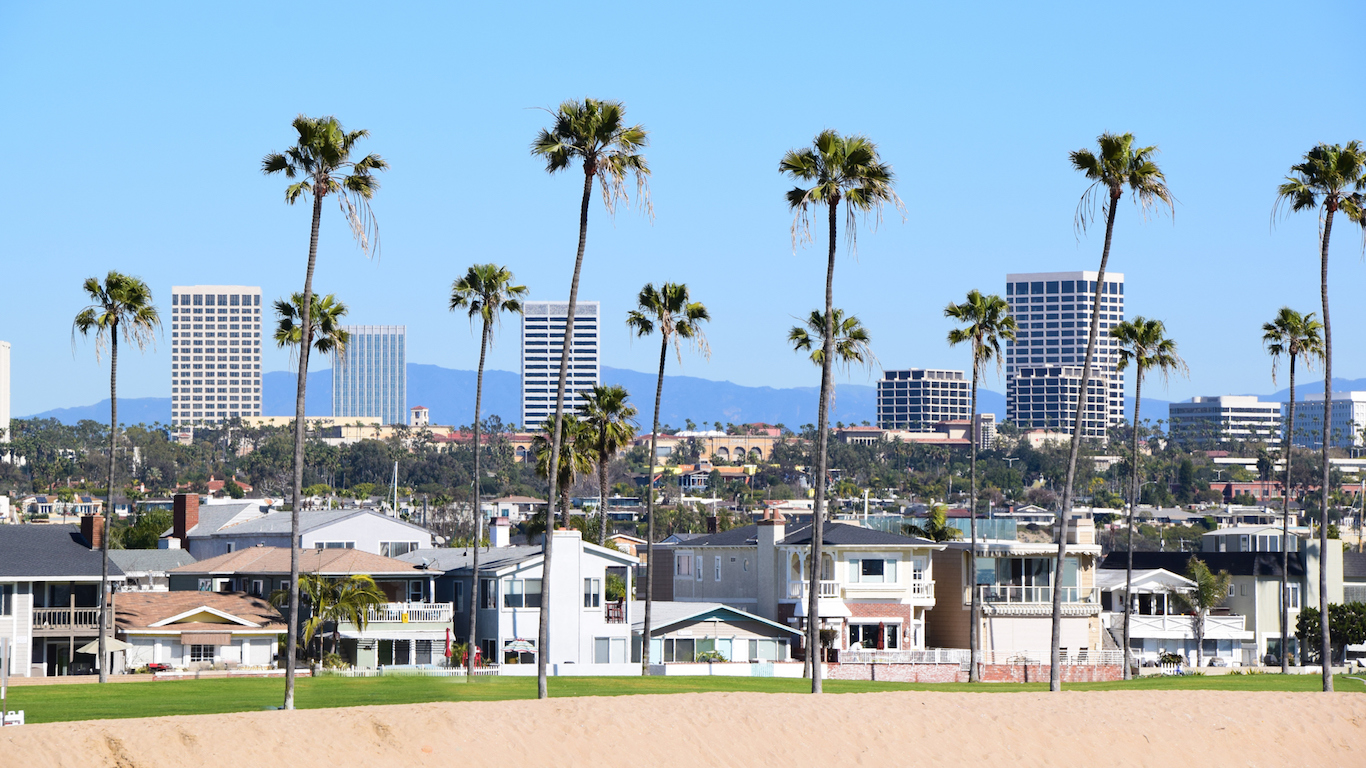
13. California
> 10-yr. population change: +8.2% (24th smallest increase)
> Annual unemployment: 4.8% (12th highest)
> Poverty rate: 13.3% (22nd highest)
> Life expectancy at birth: 80.8 years (3rd longest)
California is one of the best states to live in, largely because its residents tend to be relatively healthy. The state’s 80.8 year average life expectancy is the third highest nationwide. The state ranks near the top in a number of key health indicators. Very few Californians smoke, and a high percentage of adults in the state exercise. These healthy behaviors contribute to lower risk of heart disease and other conditions.
California’s $71,805 median annual household income is more than $11,000 higher than the U.S. median. Some 13.2% of California households are very wealthy, earning at least $200,000 a year. Roughly the same share of Californians live in poverty at 13.3% — just under the U.S. poverty rate of 13.4%.

12. Washington
> 10-yr. population change: +14.5% (8th largest increase)
> Annual unemployment: 4.8% (12th highest)
> Poverty rate: 11.0% (14th lowest)
> Life expectancy at birth: 80.0 years (11th longest)
Americans often relocate to places where they can find work, and Washington state’s strong economy may help explain the influx of new residents. The state’s population increased by 14.5% in the last decade alone — the eighth largest increase of any state. The median household income of $70,979 a year greatly exceeds the national figure of $60,336. It is also the 10th highest median household income among all states.
Washington adults are also more likely to be active and less likely to smoke and be obese. Healthy lifestyle habits such as these likely contribute to the state’s low premature death rate. About 287 out of every 100,000 state residents die before the age of 75, the ninth lowest premature death rate in the nation and well below the national rate of 336 per 100,000. This likely contributes to Washington’s long life expectancy of 80 years, one of the longest of all states.
[in-text-ad-2]

11. Virginia
> 10-yr. population change: +9.8% (16th largest increase)
> Annual unemployment: 3.8% (20th lowest)
> Poverty rate: 10.6% (11th lowest)
> Life expectancy at birth: 79.2 years (24th longest)
Virginia ranks highly in several important indicators. The state has the fifth highest college attainment rate, at 38.7%. Nationwide, 32.0% of adults have at least a bachelor’s degree. Virginia also has one of the lower state poverty rates in the country, at 10.6%. Virginia households tend to be relatively affluent, pulling in a median income of $71,535 a year.
While Virginia’s life expectancy is nearly in line with the U.S. life expectancy, the state is improving faster than the nation. From 1980 to 2014, Virginia’s life expectancy increased by 8.3%, the fifth greatest increase in the country and more than a full percentage point ahead of the U.S. increase. Virginia is also one of the safest states, with a violent crime rate of 208.2 incidents reported per 100,000 residents. The U.S. violent crime rate is 382.9 per 100,000.

10. Utah
> 10-yr. population change: +17.3% (3rd largest increase)
> Annual unemployment: 3.2% (9th lowest)
> Poverty rate: 9.7% (6th lowest)
> Life expectancy at birth: 79.9 years (13th longest)
Over the past decade, Utah’s population expanded by 17.3%, the third largest population growth of any state. Americans from out of state have likely moved to Utah also because of its robust job market. Only 3.2% of the workforce in Utah are unemployed, one of the lowest rates in the nation and below the comparable national rate of 4.4%. Utah also has the sixth lowest poverty rate at just 9.7%, much less than the national rate of 13.4%. Utah also has the lowest income inequality of any state. State residents in the 80th percentile of income only make 3.8 times more than those in the 20th percentile. This is well below the national average of five times.
[in-text-ad]
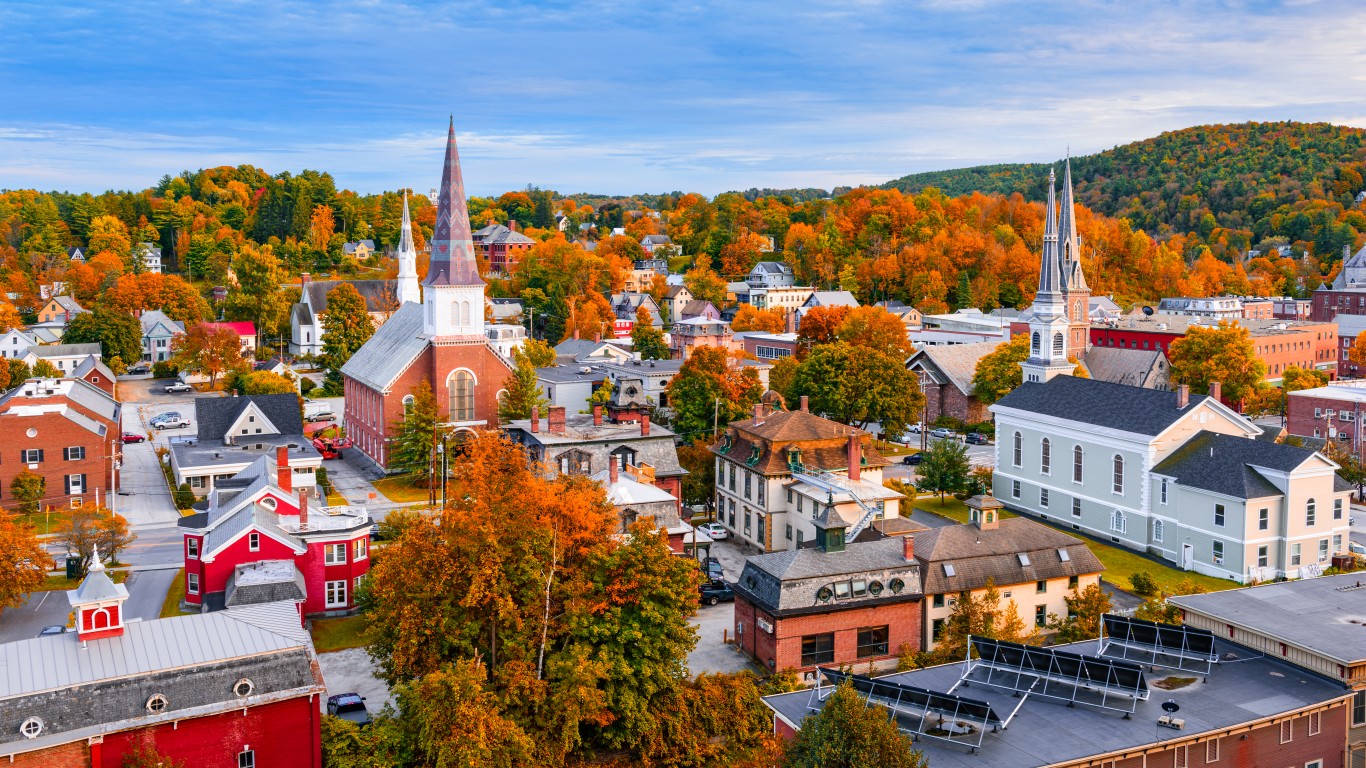
9. Vermont
> 10-yr. population change: +0.4% (3rd smallest increase)
> Annual unemployment: 3.0% (6th lowest)
> Poverty rate: 11.3% (19th lowest)
> Life expectancy at birth: 80.2 years (7th longest)
Vermont has the second lowest incidences of violent and property crime in the country. In fact, the state’s violent crime rate of 165.8 incidents per 100,000 residents is less than half the U.S. violent crime rate. In addition to the harm done to victims of crime, high-crime areas are less likely to attract new businesses than safer places, and those who live in high-crime areas can lack a sense of safety and well-being.
Vermont residents tend to be well educated — 38.3% of adults in the state have at least a bachelor’s degree, compared with 32.0% of Americans. Areas with a greater share of degree-holding residents tend to have higher employment rates because workers with higher education levels have higher employment rates and tend to work in better-paying jobs.
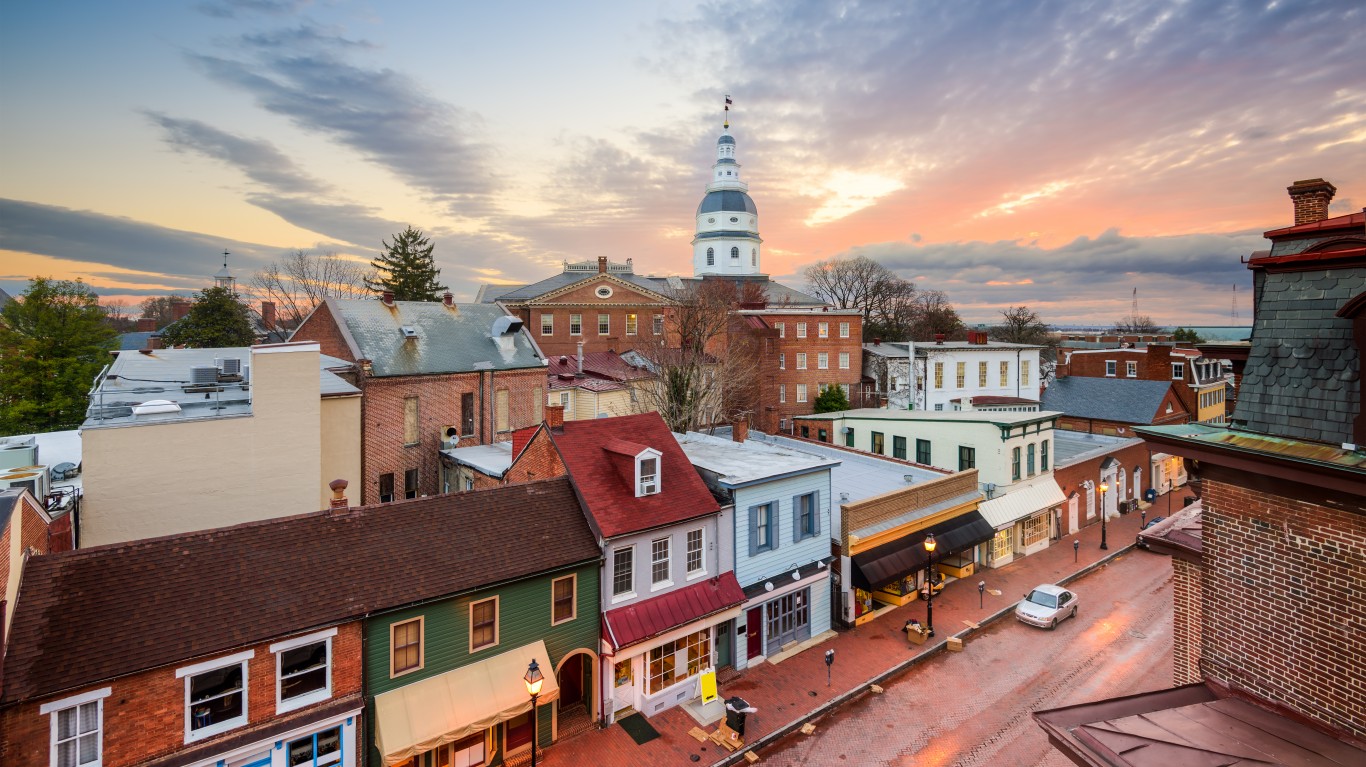
8. Maryland
> 10-yr. population change: +7.7% (23rd smallest increase)
> Annual unemployment: 4.1% (23rd lowest)
> Poverty rate: 9.3% (2nd lowest)
> Life expectancy at birth: 79.2 years (25th longest)
High educational attainment can lead to higher-paying, and often more steady jobs. In Maryland, 39.7% of adults have their bachelor’s degree, the third highest share of any other state and well above the 32.0% of adults who have the same education level nationwide. Maryland also has the highest median household income of all states. The typical household in Maryland earns $80,776 a year, over $20,400 more than the national figure.
Maryland also has the second lowest poverty rate in the nation, with just 9.3% of the state population living in poverty. The state also has the fourth largest share of households making at least $200,000 annually.

7. Hawaii
> 10-yr. population change: +11.2% (12th largest increase)
> Annual unemployment: 2.4% (the lowest)
> Poverty rate: 9.5% (4th lowest)
> Life expectancy at birth: 81.2 years (the longest)
Based on its tropical climate and expansive beaches, Hawaii has a reputation as a great place to live. But it also performs well in a number of more objective quality of life indicators. For instance, the state is home to some of the healthiest Americans. The average life expectancy at birth in the state of 81.2 years is the highest of all states. Similarly, just 22.3% of adult residents are obese, the second lowest obesity rate in the country.
The state also performs well in a number of key economic measures. The state’s poverty rate is 9.5%, well below the 13.4% national poverty rate. Hawaii residents also tend to make a good living, with a median household income of $77,765 a year, well above the national median. However, since it is so far away from the, it has the highest cost of living by a wide margin, offsetting some of the high incomes.
[in-text-ad-2]

6. New Jersey
> 10-yr. population change: +3.7% (12th smallest increase)
> Annual unemployment: 4.6% (17th highest)
> Poverty rate: 10.0% (7th lowest)
> Life expectancy at birth: 80.0 years (10th longest)
New Jersey is the second most affluent state on this list behind Maryland. The median annual household income of $80,088 exceeds the national figure of $60,336 by almost $20,000. In New Jersey, 16.7% of households earn at least $200,000 annually, the largest share of any state and well above the comparable national share of 9.0%. In addition, only 10.0% of New Jersey residents live in poverty, the seventh lowest share of all states and below the 13.4% of Americans that live in poverty nationwide.
New Jersey is also a relatively safe place to live. The rates of violent and property crime are among the lowest in the nation. For example, there are only about 1,555 cases of property crime for every 100,000 state residents — the sixth lowest property crime rate among all states.

5. Minnesota
> 10-yr. population change: +7.3% (22nd smallest increase)
> Annual unemployment: 3.5% (14th lowest)
> Poverty rate: 9.5% (4th lowest)
> Life expectancy at birth: 80.9 years (2nd longest)
Education can be a crucial factor that helps people obtain high-paying jobs and stay out of poverty. Minnesota’s high school graduation rate of 93.1% is the highest of any state. Similarly, 74.4% of adults have at least some postsecondary education, also the highest share of any state. This means state residents are better equipped to find high-paying jobs. The state has one of the lower poverty rates, at 9.5%. It also has the absolute lowest rate of extreme poverty. Just 2.1% of state families earn less than $10,000 annually.
Minnesota has the second highest life expectancy, at 80.9 years, trailing only Hawaii. The state also has the lowest premature mortality rate in the country. Just 263.1 per 100,000 residents die before age 75 in a given year.
[in-text-ad]

4. Colorado
> 10-yr. population change: +15.3% (5th largest increase)
> Annual unemployment: 2.8% (4th lowest)
> Poverty rate: 10.3% (9th lowest)
> Life expectancy at birth: 80.2 years (8th longest)
Colorado is the fourth best state to live in for a number of reasons. Only 2.8% of the state’s labor force is out of work, the fourth lowest unemployment rate of any state and less than the nationwide jobless rate of 4.4%. In Colorado, 41.2% of adults have at least a bachelor’s degree, the second largest share of any state.
Educated individuals tend to lead healthier and longer lives. Only about one in five Colorado adults are obese, the smallest share of any other state and well below the national obesity rate of 28.0%. State adults also exercise more than adults in any other state. Also, the premature death rate in the state of 281 deaths before age 75 per 100,000 people is well below the national rate of 336 premature deaths per 100,000 people. This likely contributes to Colorado’s high life expectancy of 80.2 years, the eighth longest of all states.

3. Connecticut
> 10-yr. population change: +2.5% (8th smallest increase)
> Annual unemployment: 4.7% (14th highest)
> Poverty rate: 9.6% (5th lowest)
> Life expectancy at birth: 80.6 years (4th longest)
Connecticut residents are some of the best educated in the country. Some 38.7% of adults in the state have at least a bachelor’s degree. The state’s high educational attainment has likely led to higher incomes among residents. The state’s median household income of $77,385 a year is the fifth highest among states. Connecticut also has one of the lowest poverty rates in the country, at 9.6%. Only a handful of states have poverty rates below 10%. Connecticut also has one of the healthiest populations — it is one of 10 states with a life expectancy above 80 years.

2. New Hampshire
> 10-yr. population change: +2.0% (6th smallest increase)
> Annual unemployment: 2.7% (3rd lowest)
> Poverty rate: 7.7% (the lowest)
> Life expectancy at birth: 80.2 years (9th longest)
New Hampshire has one of the strongest job markets in the nation with only 2.7% of the labor force out of work — the third lowest unemployment rate nationwide. People who have consistent work are more likely to earn incomes that exceed the poverty level. In New Hampshire, this appears to be the case. The median annual household income of $73,381 is about $10,000 more than the median nationwide. New Hampshire also has the lowest poverty rate in the nation, with only 7.7% of the population living in poverty. This is well below the national poverty rate of 13.4%.
New Hampshire is also one of the most crime-free states. In the United States, there were 2,362 property crimes per 100,000 people, but in New Hampshire, there were just 1,382 property crimes per every 100,000 people.
[in-text-ad-2]

1. Massachusetts
> 10-yr. population change: +6.4% (21st smallest increase)
> Annual unemployment: 3.7% (18th lowest)
> Poverty rate: 10.5% (10th lowest)
> Life expectancy at birth: 80.4 years (5th longest)
Massachusetts is America’s best state to live for many reasons. State adults are the best educated in the country, as 43.4% hold at least a bachelor’s degree. This high level of educational attainment sets these residents up for higher paying positions in their career. Massachusetts has the fourth highest median household income, at $77,385 a year. The state’s poverty rate of 10.5% is well below the U.S. rate.
Massachusetts also has some of the best health outcomes in the country, possibly because residents are the most likely to have health insurance. Nationwide, 8.7% of people lack health insurance. In Massachusetts, just 2.8% lack insurance. The state also has among the highest concentrations of doctors, dentists, and mental health professionals per capita. Massachusetts’ life expectancy of 80.4 years is the fifth highest nationwide.
Detailed findings:
Many quality of life factors are interdependent and affect each other. Higher incomes provide financial security and affords access to education, health care, and an overall healthier lifestyle. In states where incomes tend to be higher, other measures of quality of life, including health outcomes, tend to be better as well. For example, the states that have higher median household incomes rank among those with the longest life expectancy.
Not all high-income states have a strong economy across the entirety of the state. Massachusetts and New York have some of the highest median household incomes, but they both have high rates of income inequality. New York, in particular, has an above average share of people living in poverty, as well.
Those who hold a bachelor’s degree tend to live longer, healthier lives and earn higher incomes. Having a college degree can also increase the likelihood of securing a stable job.
Health outcomes are another factor in determining the quality of life in a state. The rates of obesity and premature death, as well as the share of state residents who report they are in good mental and physical health all play a role in life expectancy.
Methodology:
To identify the best and worst states to live in, 24/7 Wall St. constructed an index comprised of three socioeconomic measures for each state: poverty rate, the percentage of adults who have at least a bachelor’s degree, and life expectancy at birth. The selection of these three measures was inspired by the United Nations’ Human Development Index. Poverty rates and bachelor degree attainment rates came from the U.S. Census Bureau’s 2017 American Community Survey (ACS). Life expectancies at birth are from the The Institute for Health Metrics and Evaluation (IHME) and are as of 2014, the latest year for which data is available. Unemployment rates are from the Bureau of Labor Statistics and are annual for 2017. Crime data came from the FBI’s 2017 Uniform Crime Report.
The thought of burdening your family with a financial disaster is most Americans’ nightmare. However, recent studies show that over 100 million Americans still don’t have proper life insurance in the event they pass away.
Life insurance can bring peace of mind – ensuring your loved ones are safeguarded against unforeseen expenses and debts. With premiums often lower than expected and a variety of plans tailored to different life stages and health conditions, securing a policy is more accessible than ever.
A quick, no-obligation quote can provide valuable insight into what’s available and what might best suit your family’s needs. Life insurance is a simple step you can take today to help secure peace of mind for your loved ones tomorrow.
Click here to learn how to get a quote in just a few minutes.
Thank you for reading! Have some feedback for us?
Contact the 24/7 Wall St. editorial team.