Special Report
The Most Productive Countries In The World

Published:
Last Updated:

There are many different ways of measuring a nation’s productivity, including total exports, economic output, and the share of workers who work full-time. Another way is measuring total economic output, or GDP, relative to the number of people in a population.
24/7 Wall St. ranked countries by GDP per capita, using International Monetary Fund data, to find the most productive countries in the world. GDP highly depends on a country’s population, natural resources, and manufacturing infrastructure. In addition, each country’s laws, including minimum wage, taxes, consumer protection, and anti-trust regulations, impacts the earning power of the country’s residents.
The countries with the highest GDPs per capita in the world are not limited to a single region and can in fact be found in many areas. The most productive countries aim to balance business policy regulation with the free market. Among the top 10 are several countries that may be considered oppressive in terms of individual rights. However, many of their laws have been established in order to attract financial and manufacturing companies from around the world.
Another group of countries that comprise the list is the energy-rich nations. These include Norway, as well as a number of nations in the Middle East. These countries have small populations, particularly in relationship to their vast oil and gas resources.
Natural resources are not limited to crude oil. Some of the countries on the most productive list have a very broad range of raw materials, including Canada, Australia, and the United States.
Methodology
To identify the most productive countries in the world, 24/7 Wall St. reviewed GDP per capita data from the IMF for 2017, in purchasing power parity. Population, labor force participation, and life expectancy data are from the World Bank, and are for the most recent available period.
Click here to see the most productive countries in the world.

34. Puerto Rico
> GDP per capita: $35,045
> Population: 3,337,177
> Labor force participation rate: 41.6%
> Life expectancy at birth: 79.8
[in-text-ad]

33. Italy
> GDP per capita: $35,220
> Population: 60,551,416
> Labor force participation rate: 48.6%
> Life expectancy at birth: 82.5

32. Republic of Korea
> GDP per capita: $35,938
> Population: 51,466,201
> Labor force participation rate: 62.6%
> Life expectancy at birth: 82.0

31. New Zealand
> GDP per capita: $36,086
> Population: 4,793,900
> Labor force participation rate: 69.2%
> Life expectancy at birth: 81.6
[in-text-ad-2]

30. Malta
> GDP per capita: $36,513
> Population: 465,292
> Labor force participation rate: 54.5%
> Life expectancy at birth: 81.8

29. Oman
> GDP per capita: $37,961
> Population: 4,636,262
> Labor force participation rate: 70.2%
> Life expectancy at birth: 77.0
[in-text-ad]

28. France
> GDP per capita: $38,606
> Population: 67,118,648
> Labor force participation rate: 55.2%
> Life expectancy at birth: 82.3

27. Japan
> GDP per capita: $39,002
> Population: 126,785,797
> Labor force participation rate: 60.2%
> Life expectancy at birth: 84.0

26. United Kingdom
> GDP per capita: $39,753
> Population: 66,022,273
> Labor force participation rate: 62.3%
> Life expectancy at birth: 81.0
[in-text-ad-2]

25. Finland
> GDP per capita: $40,586
> Population: 5,511,303
> Labor force participation rate: 58.3%
> Life expectancy at birth: 81.8

24. Belgium
> GDP per capita: $42,659
> Population: 11,372,068
> Labor force participation rate: 53.2%
> Life expectancy at birth: 81.0
[in-text-ad]

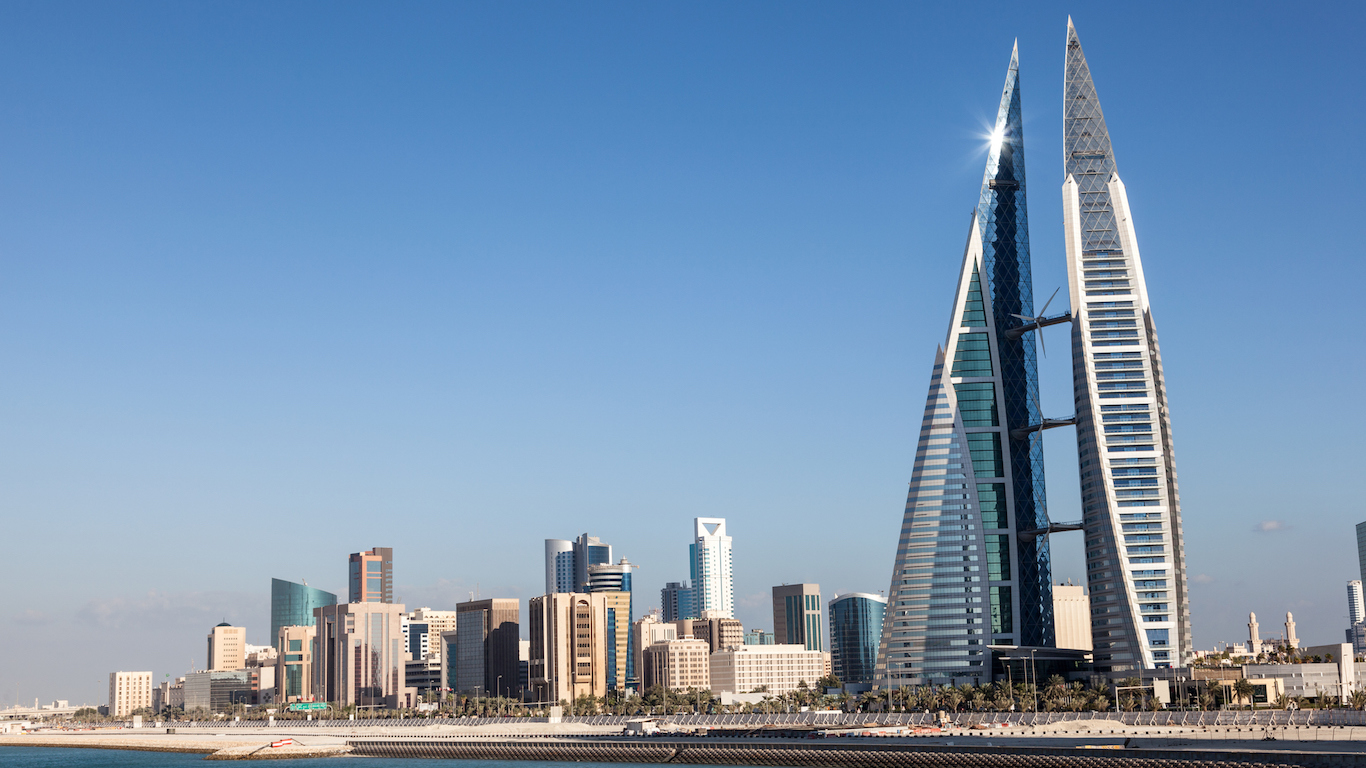
23. Bahrain
> GDP per capita: $43,291
> Population: 1,492,584
> Labor force participation rate: 72.2%
> Life expectancy at birth: 76.9

22. Canada
> GDP per capita: $44,018
> Population: 36,708,083
> Labor force participation rate: 65.2%
> Life expectancy at birth: 82.3

21. Australia
> GDP per capita: $44,649
> Population: 24,598,933
> Labor force participation rate: 64.8%
> Life expectancy at birth: 82.5
[in-text-ad-2]

20. Germany
> GDP per capita: $45,229
> Population: 82,695,000
> Labor force participation rate: 60.5%
> Life expectancy at birth: 80.6

19. Austria
> GDP per capita: $45,437
> Population: 8,809,212
> Labor force participation rate: 60.3%
> Life expectancy at birth: 80.9
[in-text-ad]

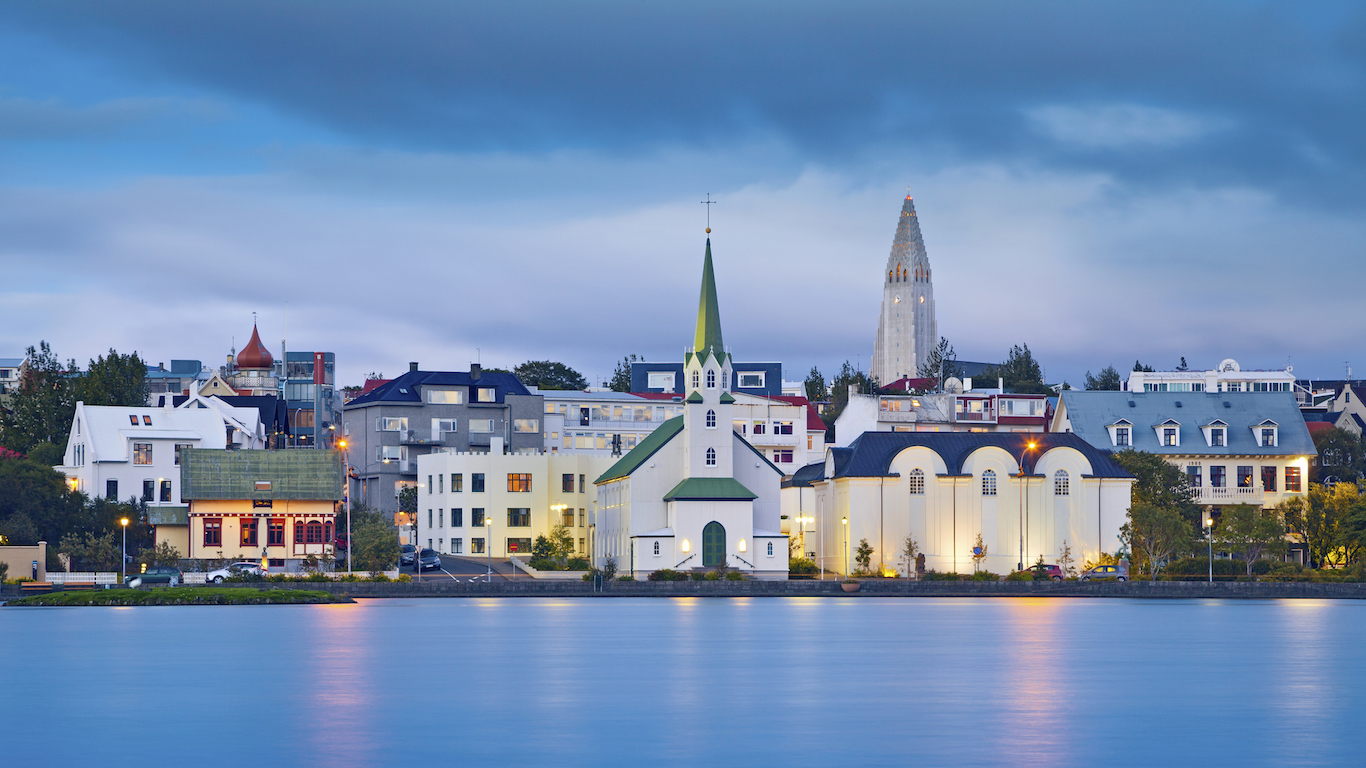
18. Iceland
> GDP per capita: $46,483
> Population: 341,284
> Labor force participation rate: 77.3%
> Life expectancy at birth: 82.5

17. Denmark
> GDP per capita: $46,683
> Population: 5,769,603
> Labor force participation rate: 63.1%
> Life expectancy at birth: 80.7

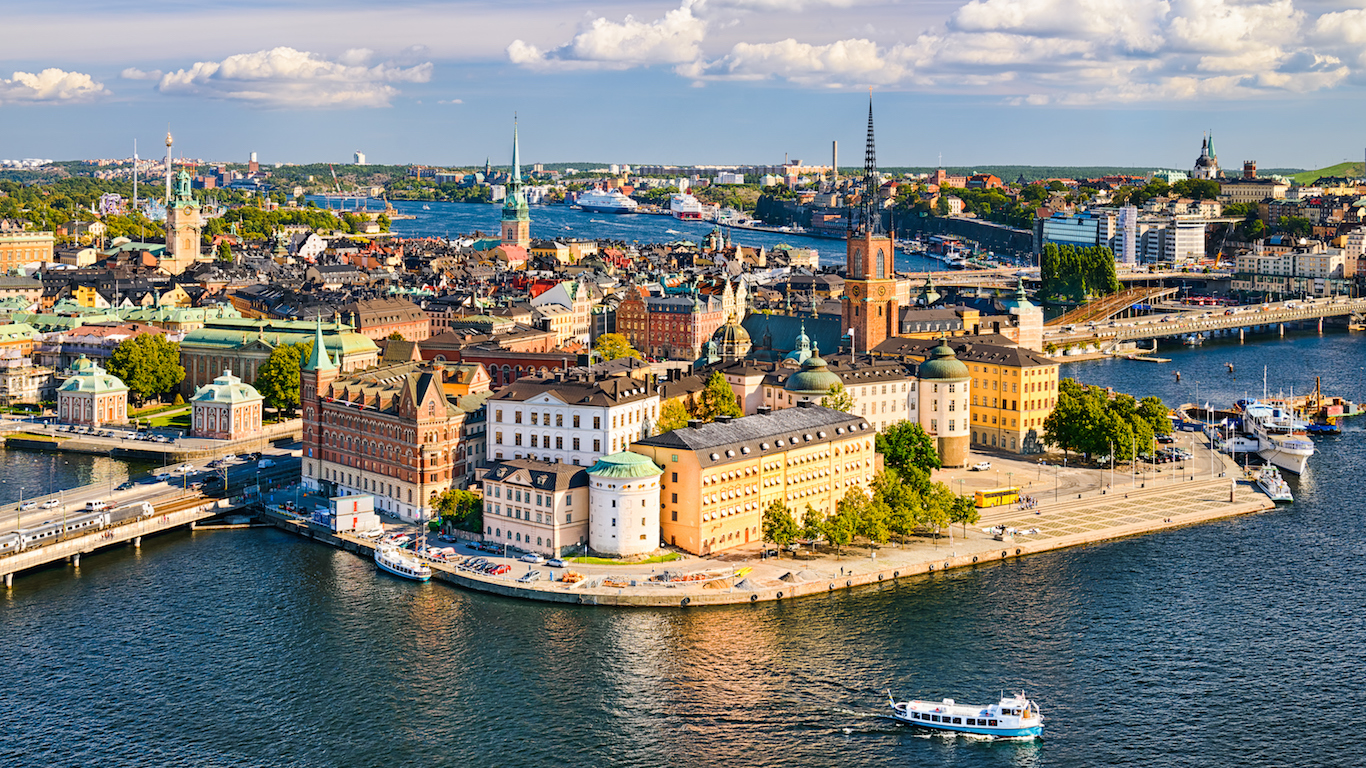
16. Sweden
> GDP per capita: $46,949
> Population: 10,067,744
> Labor force participation rate: 64.0%
> Life expectancy at birth: 82.2
[in-text-ad-2]

15. Netherlands
> GDP per capita: $48,473
> Population: 17,132,854
> Labor force participation rate: 63.5%
> Life expectancy at birth: 81.5

14. Saudi Arabia
> GDP per capita: $49,045
> Population: 32,938,213
> Labor force participation rate: 56.1%
> Life expectancy at birth: 74.6
[in-text-ad]

13. United States
> GDP per capita: $54,225
> Population: 325,719,178
> Labor force participation rate: 61.9%
> Life expectancy at birth: 78.7

12. Hong Kong SAR, China
> GDP per capita: $56,055
> Population: 7,391,700
> Labor force participation rate: 60.4%
> Life expectancy at birth: 84.2

11. San Marino
> GDP per capita: $56,861
> Population: 33,400
> Labor force participation rate: 0.0%
> Life expectancy at birth: 0.0
[in-text-ad-2]

10. Switzerland
> GDP per capita: $57,410
> Population: 8,466,017
> Labor force participation rate: 68.4%
> Life expectancy at birth: 82.9

9. Norway
> GDP per capita: $64,800
> Population: 5,282,223
> Labor force participation rate: 64.2%
> Life expectancy at birth: 82.5
[in-text-ad]

8. Kuwait
> GDP per capita: $65,531
> Population: 4,136,528
> Labor force participation rate: 69.0%
> Life expectancy at birth: 74.7

7. United Arab Emirates
> GDP per capita: $67,293
> Population: 9,400,145
> Labor force participation rate: 79.7%
> Life expectancy at birth: 77.3

6. Ireland
> GDP per capita: $67,335
> Population: 4,813,608
> Labor force participation rate: 60.0%
> Life expectancy at birth: 81.6
[in-text-ad-2]

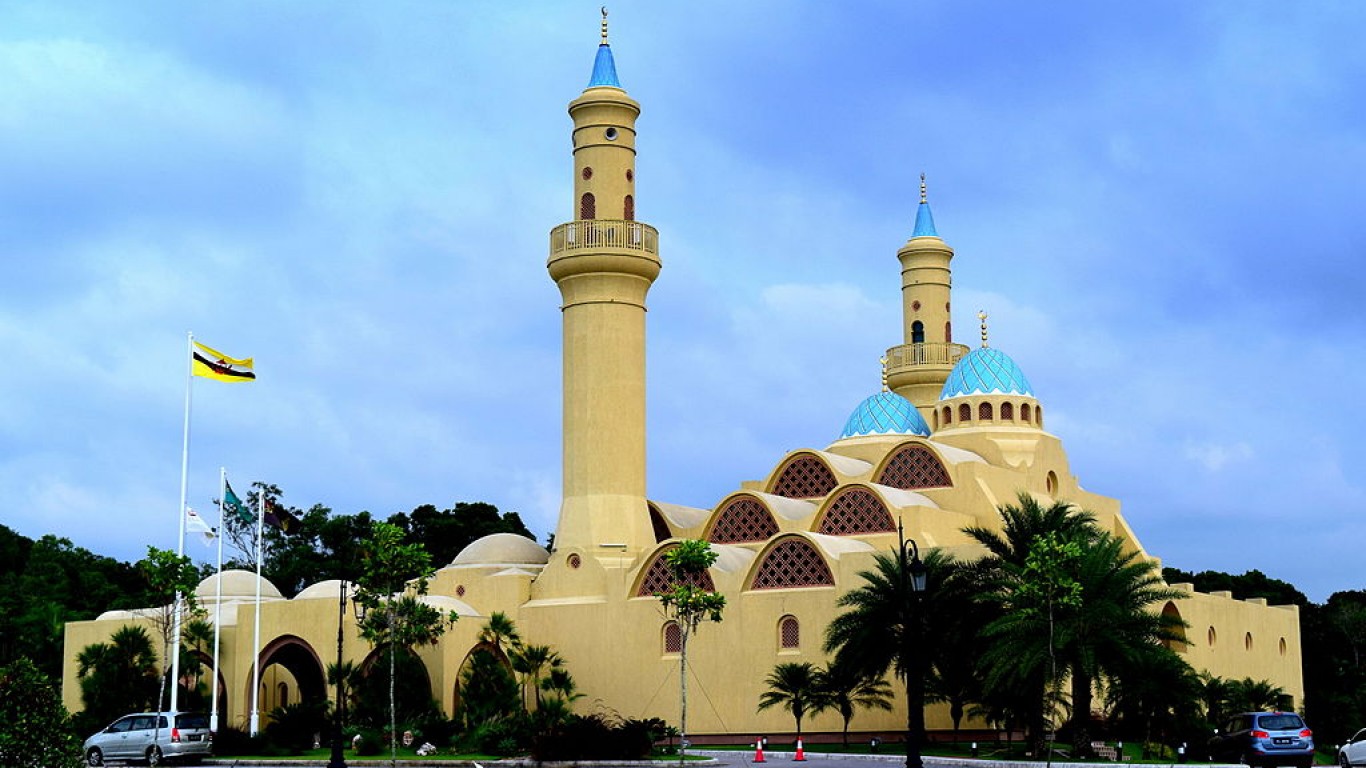
5. Brunei Darussalam
> GDP per capita: $71,809
> Population: 428,697
> Labor force participation rate: 67.1%
> Life expectancy at birth: 77.2

4. Singapore
> GDP per capita: $85,535
> Population: 5,612,253
> Labor force participation rate: 68.5%
> Life expectancy at birth: 82.8
[in-text-ad]

3. Luxembourg
> GDP per capita: $94,278
> Population: 599,449
> Labor force participation rate: 57.9%
> Life expectancy at birth: 82.3

2. Macao SAR, China
> GDP per capita: $104,862
> Population: 622,567
> Labor force participation rate: 70.8%
> Life expectancy at birth: 83.8

1. Qatar
> GDP per capita: $116,936
> Population: 2,639,211
> Labor force participation rate: 86.9%
> Life expectancy at birth: 78.2
Thank you for reading! Have some feedback for us?
Contact the 24/7 Wall St. editorial team.