In his 1964 State of the Union address, President Lyndon Johnson declared war on poverty. The ambitious initiative gave way to a range of policies aimed at eliminating poverty in the United States.
Now, over half a decade later, 42.6 million Americans still live below the poverty line.
The Department of Health and Human Services sets the poverty line at an annual income of $12,140 for an individual and $25,100 for a family of four. Since peaking at just under 16% in the wake of the Great Recession, the U.S. poverty rate has improved considerably. As of 2017, 13.4% of Americans live below the poverty line.
While the Johnson’s war on poverty ultimately proved unsuccessful, poverty reduction remains a central policy goal of federal, state, and local governments. And some cities have done better than others in reducing poverty.
24/7 Wall St. reviewed metro area level poverty data from the U.S. Census Bureau to identify the cities with the lowest poverty rates. In 30 of the 382 metro areas reviewed, fewer than 9% of residents live in poverty.
Click here to see the cities with the lowest poverty rates.
Click here to read our detailed findings and methodology.
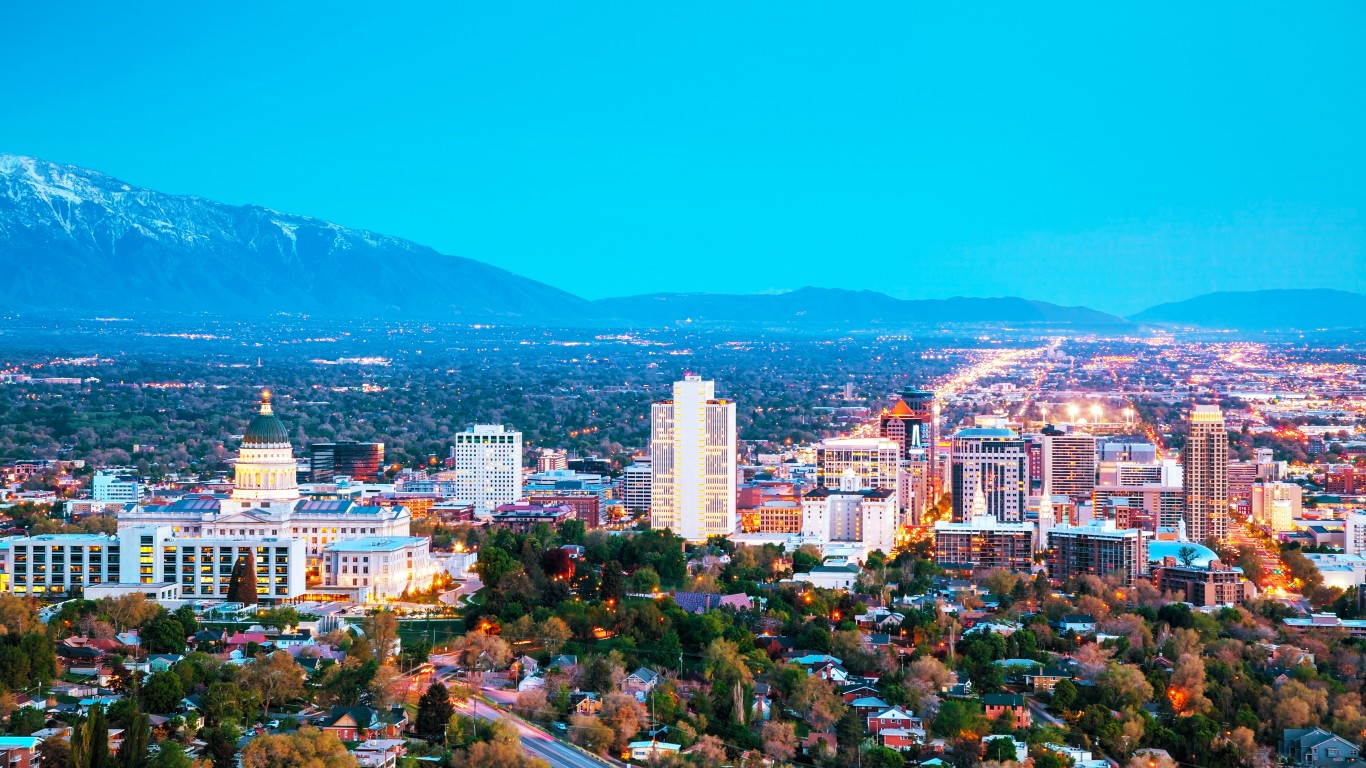
30. Salt Lake City, UT
> Poverty rate: 8.9%
> 2017 unemployment: 3.1% (bottom 25%)
> Households receiving SNAP benefits: 6.6% (bottom 10%)
> Median household income: $71,510 (top 10%)
[in-text-ad]

29. Idaho Falls, ID
> Poverty rate: 8.8%
> 2017 unemployment: 2.6% (bottom 10%)
> Households receiving SNAP benefits: 11.1%
> Median household income: $54,515

28. Bridgeport-Stamford-Norwalk, CT
> Poverty rate: 8.8%
> 2017 unemployment: 4.7%
> Households receiving SNAP benefits: 8.3% (bottom 25%)
> Median household income: $91,198 (top 10%)

27. San Francisco-Oakland-Hayward, CA
> Poverty rate: 8.8%
> 2017 unemployment: 3.3% (bottom 25%)
> Households receiving SNAP benefits: 5.3% (bottom 10%)
> Median household income: $101,714 (top 10%)
[in-text-ad-2]

26. Sebastian-Vero Beach, FL
> Poverty rate: 8.7%
> 2017 unemployment: 5.0%
> Households receiving SNAP benefits: 9.0% (bottom 25%)
> Median household income: $49,177
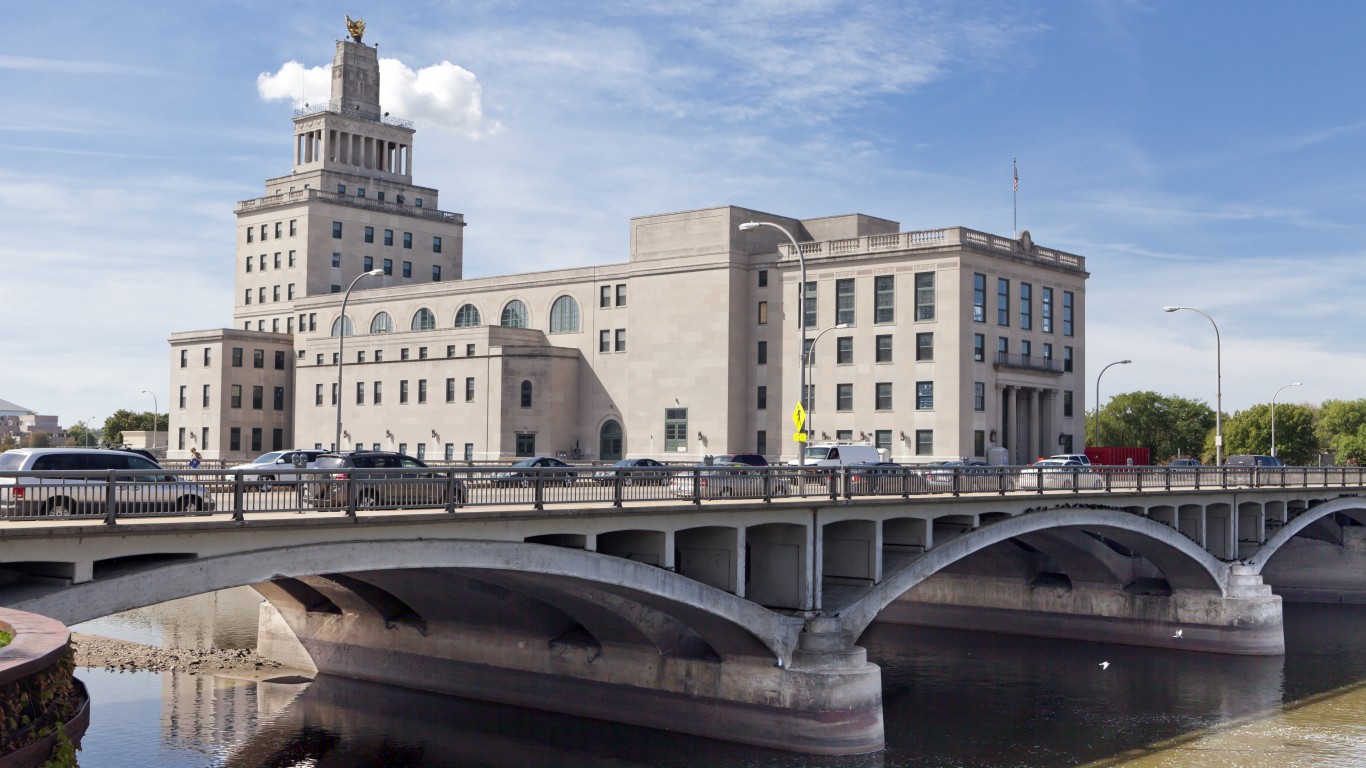
25. Cedar Rapids, IA
> Poverty rate: 8.7%
> 2017 unemployment: 3.4% (bottom 25%)
> Households receiving SNAP benefits: 9.2%
> Median household income: $63,697 (top 25%)
[in-text-ad]

24. Denver-Aurora-Lakewood, CO
> Poverty rate: 8.6%
> 2017 unemployment: 2.7% (bottom 10%)
> Households receiving SNAP benefits: 6.0% (bottom 10%)
> Median household income: $76,643 (top 10%)
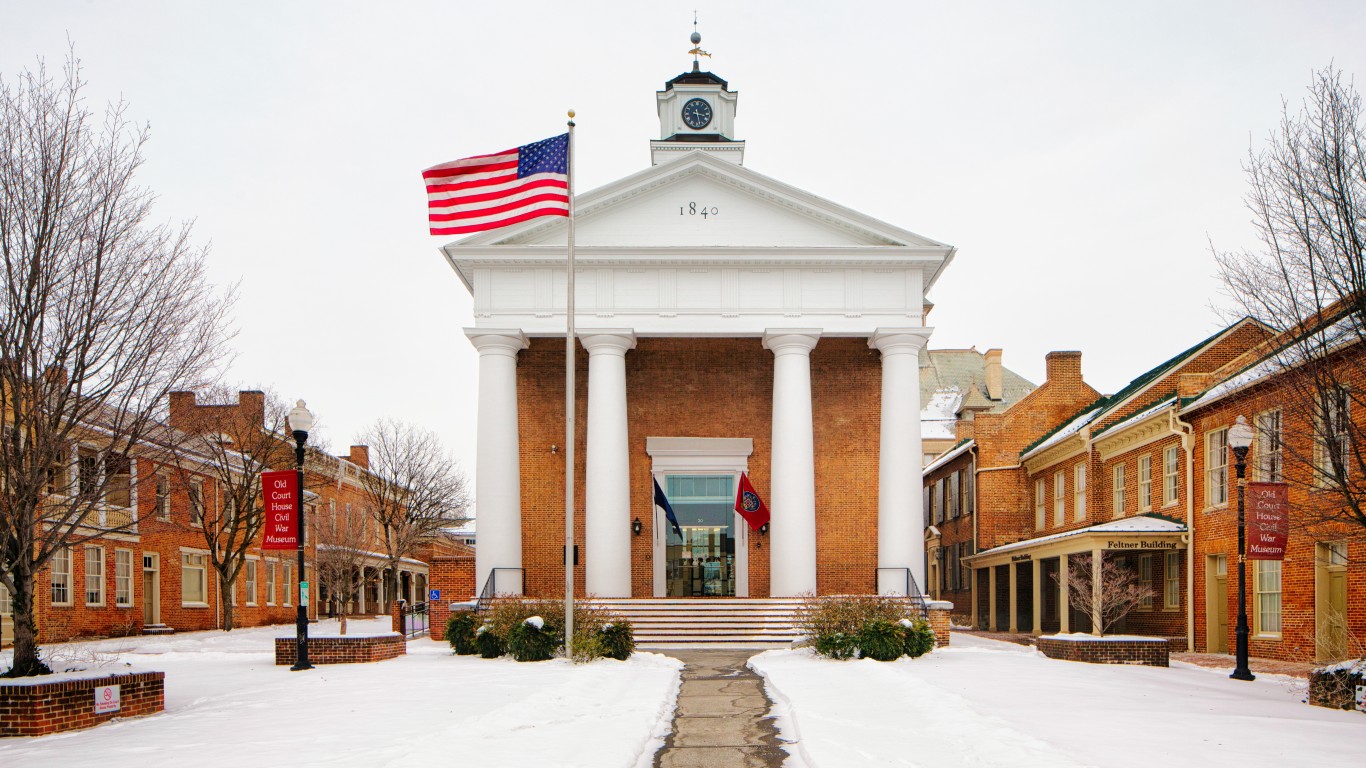
23. Winchester, VA-WV
> Poverty rate: 8.5%
> 2017 unemployment: 3.4% (bottom 25%)
> Households receiving SNAP benefits: 6.5% (bottom 10%)
> Median household income: $65,334 (top 25%)

22. Urban Honolulu, HI
> Poverty rate: 8.4%
> 2017 unemployment: 2.2% (bottom 10%)
> Households receiving SNAP benefits: 9.2%
> Median household income: $81,284 (top 10%)
[in-text-ad-2]

21. Des Moines-West Des Moines, IA
> Poverty rate: 8.3%
> 2017 unemployment: 2.9% (bottom 10%)
> Households receiving SNAP benefits: 9.5%
> Median household income: $68,649 (top 25%)
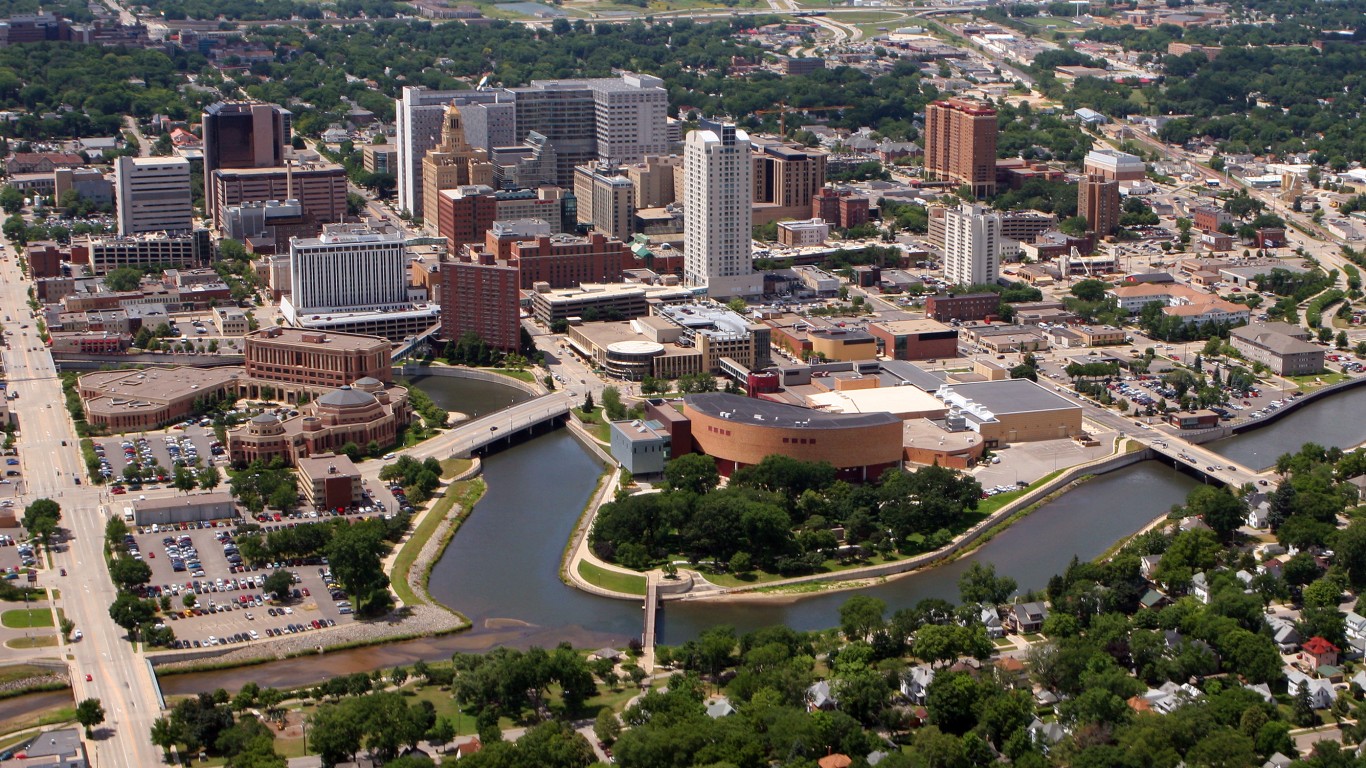
20. Rochester, MN
> Poverty rate: 8.3%
> 2017 unemployment: 2.9% (bottom 10%)
> Households receiving SNAP benefits: 7.6% (bottom 25%)
> Median household income: $71,985 (top 10%)
[in-text-ad]

19. Norwich-New London, CT
> Poverty rate: 8.2%
> 2017 unemployment: 4.6%
> Households receiving SNAP benefits: 10.4%
> Median household income: $71,987 (top 10%)

18. Manchester-Nashua, NH
> Poverty rate: 8.2%
> 2017 unemployment: 2.6% (bottom 10%)
> Households receiving SNAP benefits: 7.5% (bottom 25%)
> Median household income: $78,769 (top 10%)

17. The Villages, FL
> Poverty rate: 8.1%
> 2017 unemployment: 6.0% (top 10%)
> Households receiving SNAP benefits: 4.9% (bottom 10%)
> Median household income: $54,057
[in-text-ad-2]

16. Fond du Lac, WI
> Poverty rate: 8.1%
> 2017 unemployment: 2.8% (bottom 10%)
> Households receiving SNAP benefits: 9.3%
> Median household income: $61,417

15. Minneapolis-St. Paul-Bloomington, MN-WI
> Poverty rate: 8.1%
> 2017 unemployment: 3.2% (bottom 25%)
> Households receiving SNAP benefits: 7.2% (bottom 25%)
> Median household income: $76,856 (top 10%)
[in-text-ad]

14. Washington-Arlington-Alexandria, DC-VA-MD-WV
> Poverty rate: 7.9%
> 2017 unemployment: 3.7%
> Households receiving SNAP benefits: 6.5% (bottom 10%)
> Median household income: $99,669 (top 10%)

13. Portland-South Portland, ME
> Poverty rate: 7.8%
> 2017 unemployment: 2.6% (bottom 10%)
> Households receiving SNAP benefits: 8.2% (bottom 25%)
> Median household income: $68,570 (top 25%)

12. Bremerton-Silverdale, WA
> Poverty rate: 7.8%
> 2017 unemployment: 4.9%
> Households receiving SNAP benefits: 11.0%
> Median household income: $73,026 (top 10%)
[in-text-ad-2]

11. Gettysburg, PA
> Poverty rate: 7.6%
> 2017 unemployment: 3.7%
> Households receiving SNAP benefits: 8.5% (bottom 25%)
> Median household income: $63,107 (top 25%)

10. Carson City, NV
> Poverty rate: 7.5%
> 2017 unemployment: 5.1%
> Households receiving SNAP benefits: 10.8%
> Median household income: $55,700
[in-text-ad]
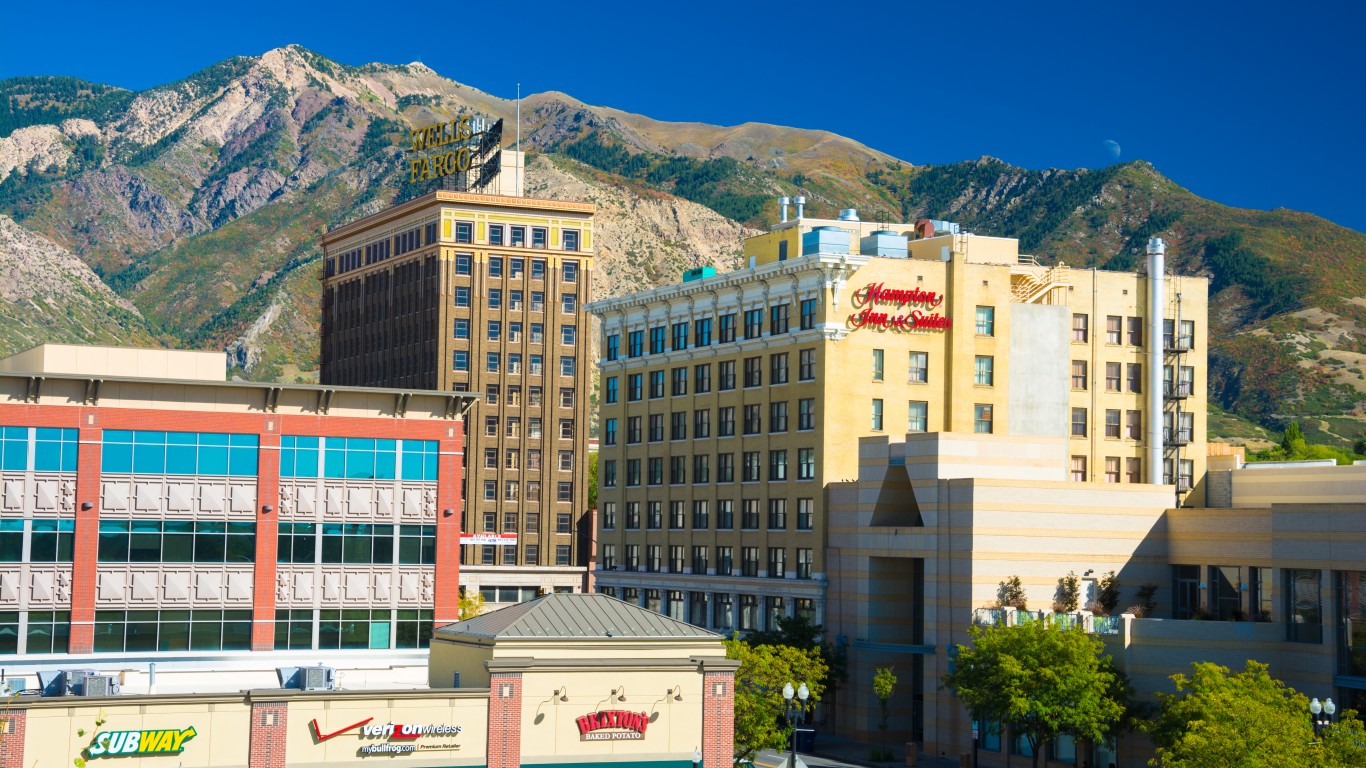
9. Ogden-Clearfield, UT
> Poverty rate: 7.4%
> 2017 unemployment: 3.3% (bottom 25%)
> Households receiving SNAP benefits: 6.6% (bottom 10%)
> Median household income: $71,629 (top 10%)
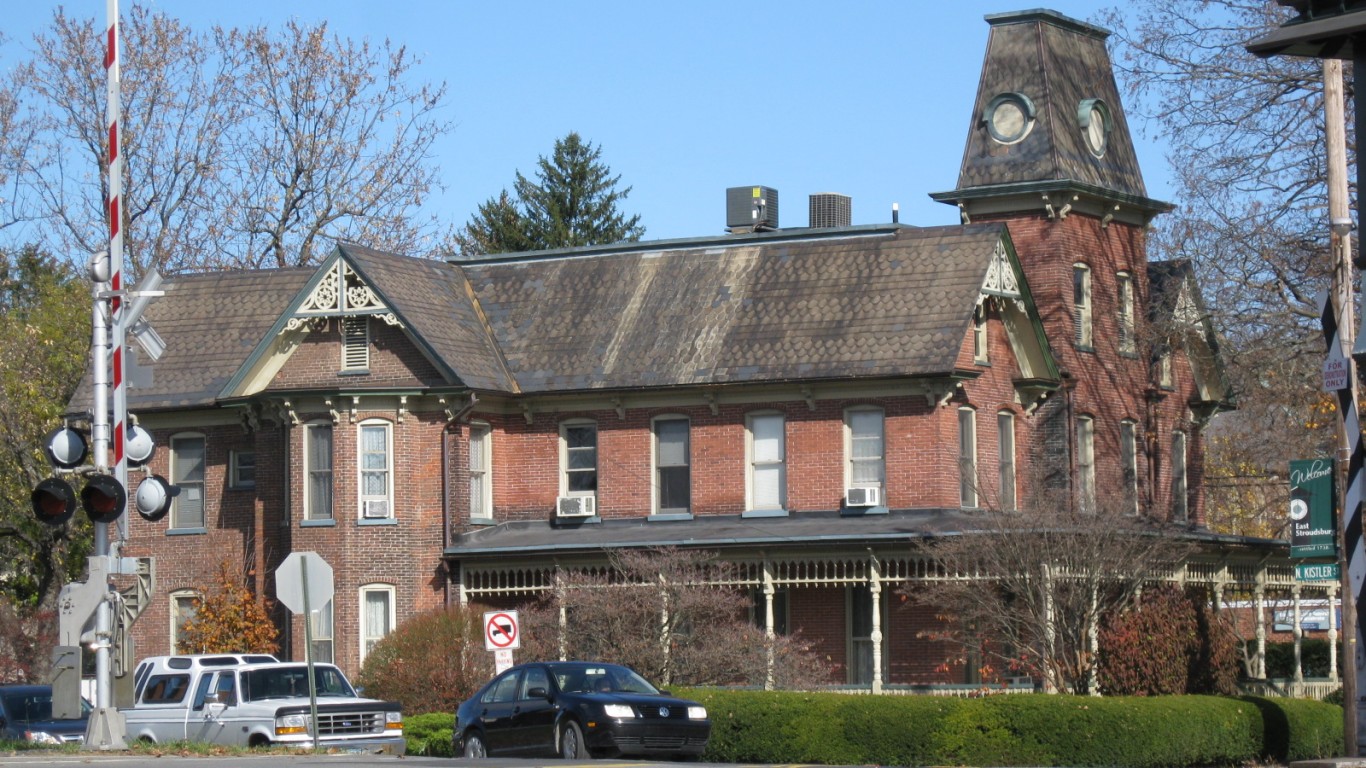
8. East Stroudsburg, PA
> Poverty rate: 7.3%
> 2017 unemployment: 5.9% (top 10%)
> Households receiving SNAP benefits: 11.9%
> Median household income: $61,612 (top 25%)
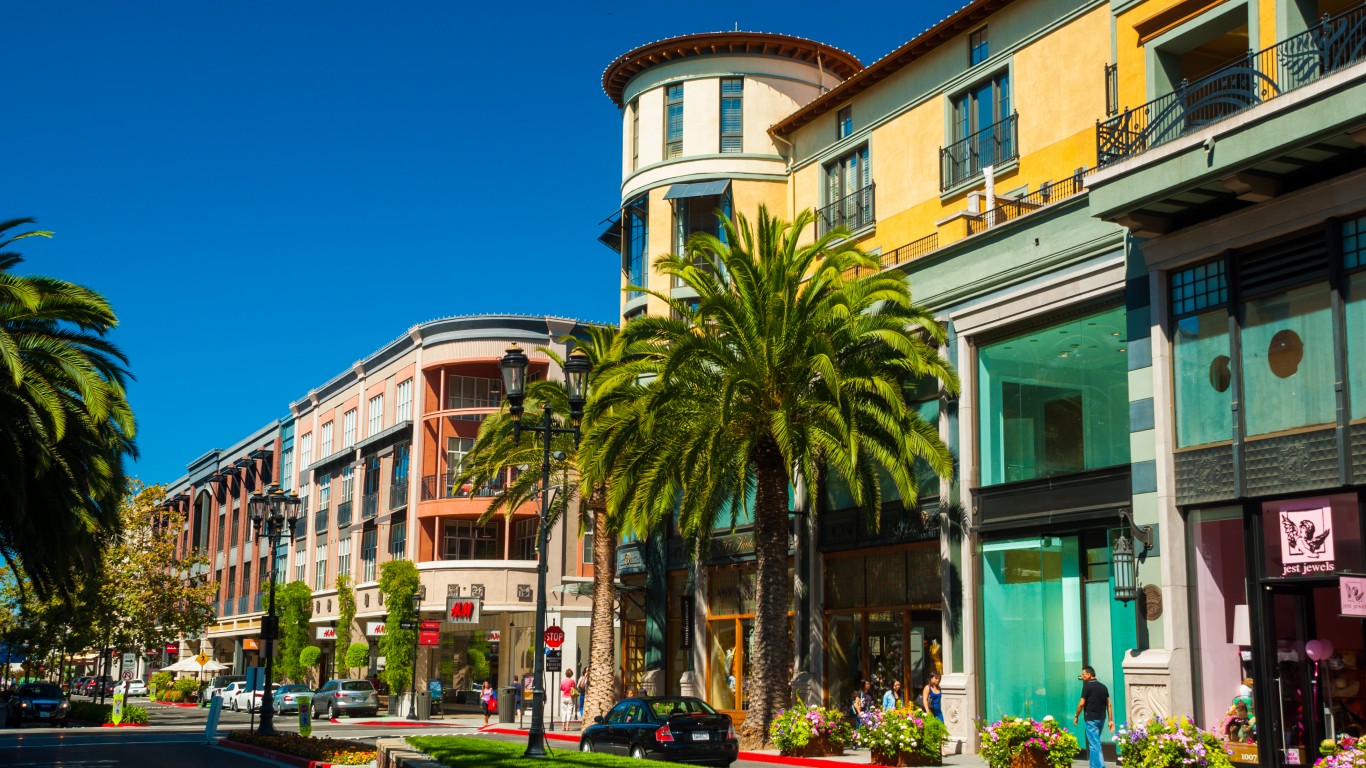
7. San Jose-Sunnyvale-Santa Clara, CA
> Poverty rate: 7.3%
> 2017 unemployment: 3.3% (bottom 25%)
> Households receiving SNAP benefits: 4.7% (bottom 10%)
> Median household income: $117,474 (top 10%)
[in-text-ad-2]
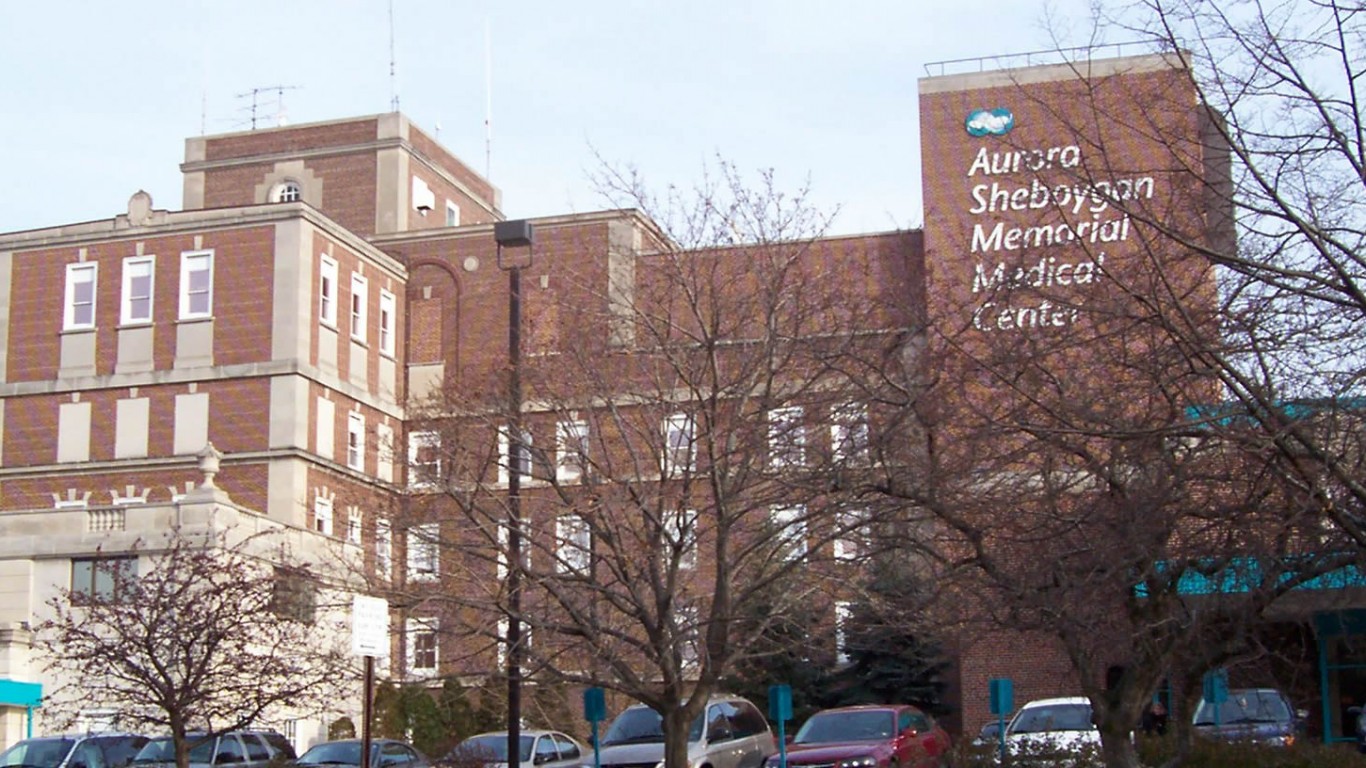
6. Sheboygan, WI
> Poverty rate: 7.2%
> 2017 unemployment: 2.8% (bottom 10%)
> Households receiving SNAP benefits: 9.9%
> Median household income: $58,361
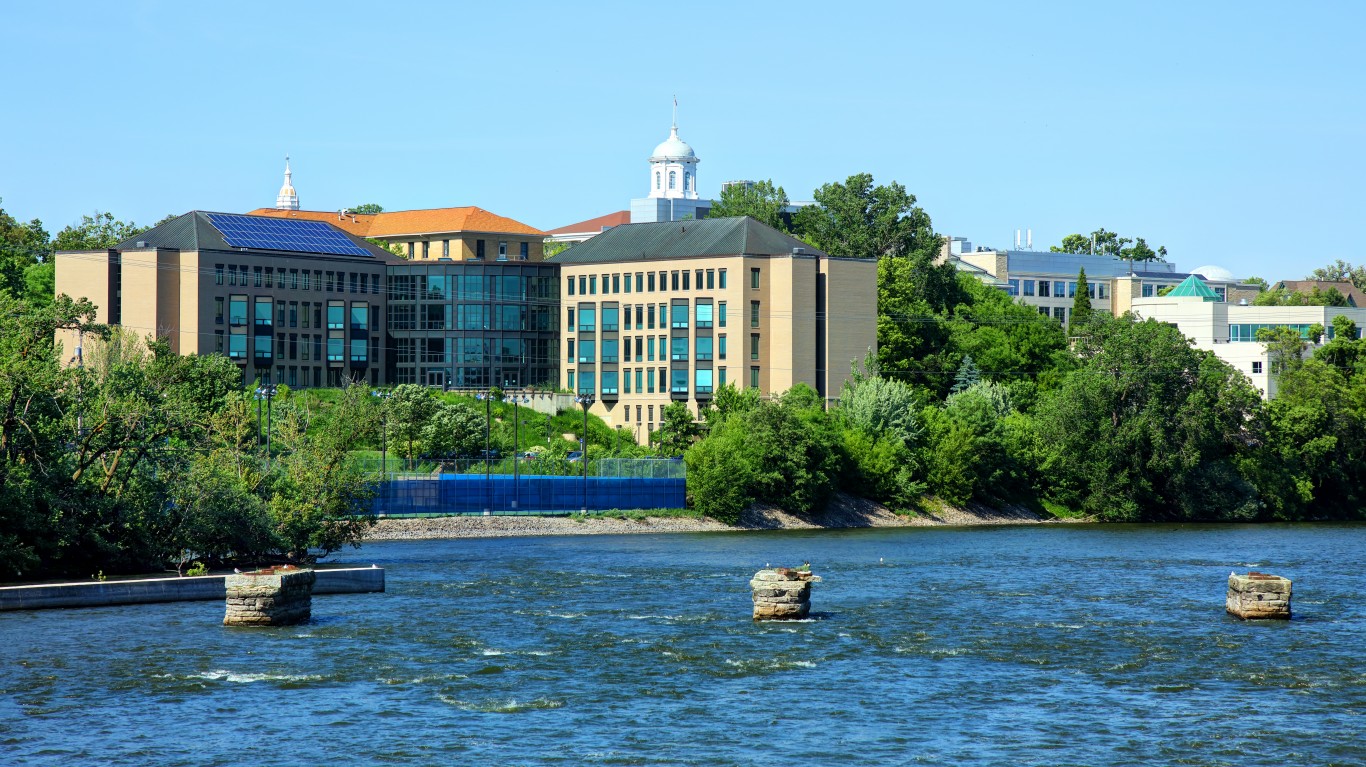
5. Appleton, WI
> Poverty rate: 6.9%
> 2017 unemployment: 3.0% (bottom 25%)
> Households receiving SNAP benefits: 6.6% (bottom 10%)
> Median household income: $65,990 (top 25%)
[in-text-ad]

4. Sioux Falls, SD
> Poverty rate: 6.8%
> 2017 unemployment: 2.8% (bottom 10%)
> Households receiving SNAP benefits: 6.5% (bottom 10%)
> Median household income: $64,882 (top 25%)

3. Barnstable Town, MA
> Poverty rate: 6.8%
> 2017 unemployment: 4.4%
> Households receiving SNAP benefits: 5.7% (bottom 10%)
> Median household income: $71,235 (top 10%)

2. Fairbanks, AK
> Poverty rate: 6.0%
> 2017 unemployment: 6.3% (top 10%)
> Households receiving SNAP benefits: 6.5% (bottom 10%)
> Median household income: $76,747 (top 10%)
[in-text-ad-2]

1. Napa, CA
> Poverty rate: 5.6%
> 2017 unemployment: 3.7%
> Households receiving SNAP benefits: 3.3% (bottom 10%)
> Median household income: $86,562 (top 10%)
Detailed Findings
A strong job market makes it easier for those who want work to find it, and can result in reduced financial hardship. Not surprisingly, economic conditions in cities with low poverty rates are generally good.
Of the 30 cities with poverty rates below 9.0%, 22 have an unemployment rate at or below the 4.4% annual national rate. In one third of the cities on this list, the unemployment rate ranks among the lowest 10% of all U.S. metro areas.
Federal programs like SNAP — formerly known as food stamps — are meant to help those struggling with serious financial hardship afford groceries. Due in to low poverty rates, the share of residents in the cities on this list who depend on SNAP is relatively low. East Stroudsburg, Pennsylvania is the only city on this list with a higher SNAP recipiency rate than the 11.7% national rate.
Adults with a college education have access to a greater number of high paying jobs and are less likely to face serious financial hardship. Low poverty rates and the higher than typical median incomes common in the cities on this list are likely due in part to high educational attainment rates. Nearly two-thirds of the cities on this list are home to a larger than typical share of adults with a bachelor’s degree.
Methodology
To identify the cities with the lowest poverty rates, 24/7 Wall St. reviewed poverty data for the 382 U.S. metro areas from the U.S. Census Bureau’s 2017 1-year American Community Survey. In cases where two or more cities had the same poverty rate, we used median household income as a tiebreaker, favoring the city with a higher median income. Only those areas with poverty rates below 9.0% were included on this list. Poverty rates, as well as median household income, and SNAP recipiency also came from the ACS. Annual unemployment figures are for 2017 and came from the Bureau of Labor Statistics.
Are You Still Paying With a Debit Card?
The average American spends $17,274 on debit cards a year, and it’s a HUGE mistake. First, debit cards don’t have the same fraud protections as credit cards. Once your money is gone, it’s gone. But more importantly you can actually get something back from this spending every time you swipe.
Issuers are handing out wild bonuses right now. With some you can earn up to 5% back on every purchase. That’s like getting a 5% discount on everything you buy!
Our top pick is kind of hard to imagine. Not only does it pay up to 5% back, it also includes a $200 cash back reward in the first six months, a 0% intro APR, and…. $0 annual fee. It’s quite literally free money for any one that uses a card regularly. Click here to learn more!
Flywheel Publishing has partnered with CardRatings to provide coverage of credit card products. Flywheel Publishing and CardRatings may receive a commission from card issuers.
Thank you for reading! Have some feedback for us?
Contact the 24/7 Wall St. editorial team.
 24/7 Wall St.
 24/7 Wall St.
 24/7 Wall St.
 24/7 Wall St.

