
The U.S. economy was in better condition in 2018 than it has been in decades. The job market posted its 96th consecutive month of job growth in September, the longest job creation streak in U.S. history, and the unemployment rate fell to 3.7% — its lowest point in nearly 50 years.
As of October, the U.S. economy has added 1.9 million jobs this year. If the current rate of job growth continues through December, the year-over-year job growth in 2018 will be among the fastest of the last two decades.
Approximately 80% of U.S. metropolitan areas have posted positive job growth figures for the year. In several cities — largely midsize manufacturing and mining hubs in the Northeast and Midwest — job growth from January 2018 to October 2018 was more than triple the 1.4% national growth. Conversely, in 25 metro areas — many located in Louisiana, North Dakota, Ohio, and West Virginia — employment has fallen by more than 1.1% in 2018.
Nationwide, the sectors with the fastest job growth in 2018 were construction, mining and logging, leisure and hospitality, and professional and business services. Sectors with the slowest job growth included retail trade, financial activities, and information.
Population growth and a robust economy are two of the main factors that contribute to employment growth, but not necessarily to lower unemployment. Cities that added residents — often due to available job growth — generally saw the size of their labor force rise as well. The size of the civilian labor force grew in approximately 90% of cities with job growth in 2018.
To identify the cities adding (and losing) the most jobs in 2018, 24/7 Wall st. reviewed monthly metro area employment figures from the Bureau of Labor Statistics. We calculated the percentage change from January 2018 through October 2018, the latest month for which employment data at the metro area level is available. All figures are seasonally adjusted. January and October unemployment rates came from the BLS. We identified the industry contributing the most to job growth using employment breakdowns by sector (NAICS level 2), also from the BLS.
Click here to see the 25 cities that added the most jobs in 2018.

25. Syracuse, NY
> 2018 employment change: 9,076 (+3.1%)
> Jan. 2018 employment: 289,411
> Oct. 2018 employment: 298,487
> Unemployment, Oct. 2018: 4.0%
> Strongest sector: Mining, logging and construction (+31.1% employment chg.)
[in-text-ad]

24. Manchester, NH
> 2018 employment change: 3,620 (+3.2%)
> Jan. 2018 employment: 112,792
> Oct. 2018 employment: 116,412
> Unemployment, Oct. 2018: 2.3%
> Strongest sector: Education and health services (+8.5% employment chg.)
 24/7 Wall St.
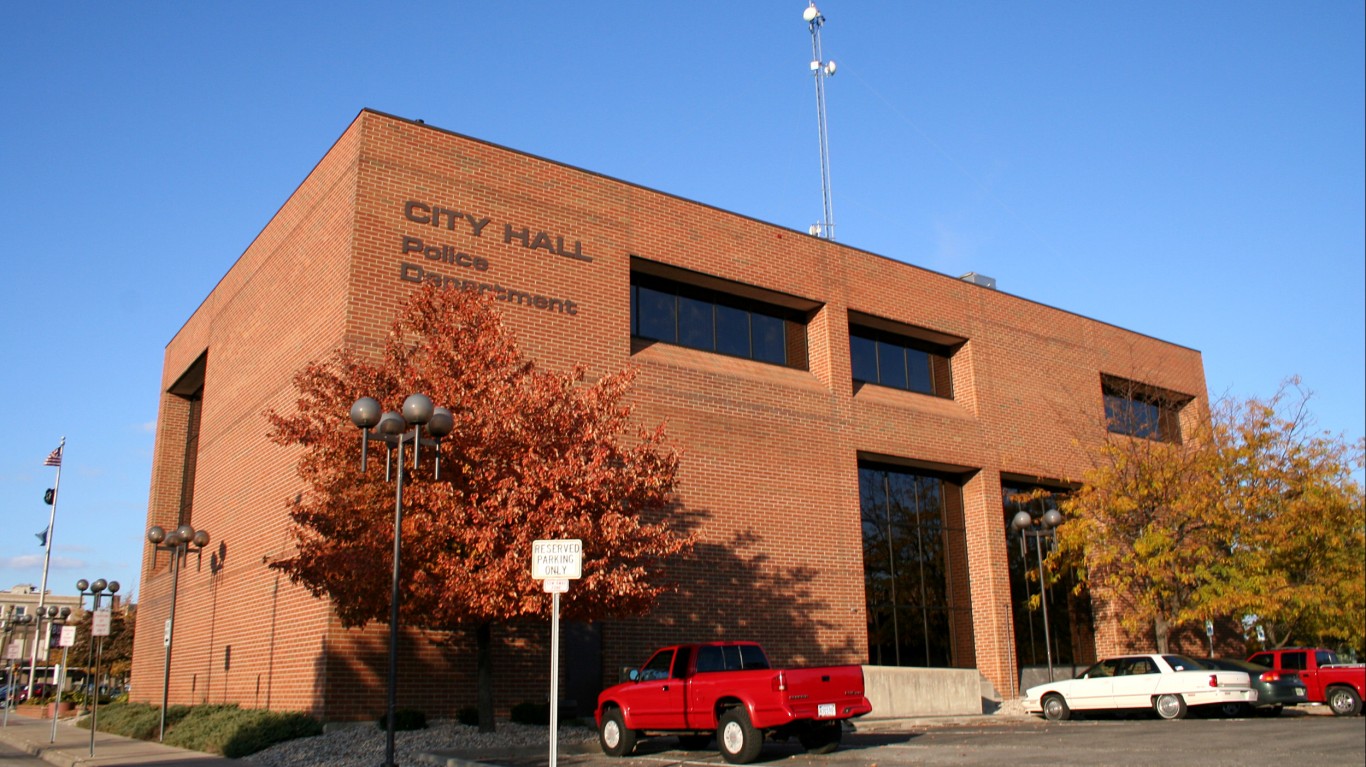
23. Kokomo, IN
> 2018 employment change: 1,203 (+3.2%)
> Jan. 2018 employment: 37,206
> Oct. 2018 employment: 38,409
> Unemployment, Oct. 2018: 3.6%
> Strongest sector: Transportation, warehousing, and utilities (+12.5% employment chg.)

22. Elkhart-Goshen, IN
> 2018 employment change: 3,639 (+3.3%)
> Jan. 2018 employment: 111,692
> Oct. 2018 employment: 115,331
> Unemployment, Oct. 2018: 2.8%
> Strongest sector: Mining, logging and construction (+21.9% employment chg.)
[in-text-ad-2]

21. Phoenix-Mesa-Scottsdale, AZ
> 2018 employment change: 73,199 (+3.3%)
> Jan. 2018 employment: 2.2 million
> Oct. 2018 employment: 2.3 million
> Unemployment, Oct. 2018: 4.0%
> Strongest sector: Construction (+14.8% employment chg.)
20. Pittsfield, MA
> 2018 employment change: 1,371 (+3.3%)
> Jan. 2018 employment: 41,471
> Oct. 2018 employment: 42,842
> Unemployment, Oct. 2018: 4.0%
> Strongest sector: Mining, logging and construction (+31.6% employment chg.)
[in-text-ad]

19. Charlottesville, VA
> 2018 employment change: 3,851 (+3.3%)
> Jan. 2018 employment: 116,348
> Oct. 2018 employment: 120,199
> Unemployment, Oct. 2018: 2.5%
> Strongest sector: Leisure and hospitality (+15.9% employment chg.)

18. Kingston, NY
> 2018 employment change: 2,903 (+3.4%)
> Jan. 2018 employment: 84,457
> Oct. 2018 employment: 87,360
> Unemployment, Oct. 2018: 3.6%
> Strongest sector: Leisure and hospitality (+26.8% employment chg.)

17. Columbus, IN
> 2018 employment change: 1,537 (+3.5%)
> Jan. 2018 employment: 43,509
> Oct. 2018 employment: 45,046
> Unemployment, Oct. 2018: 2.9%
> Strongest sector: Mining, logging and construction (+18.8% employment chg.)
[in-text-ad-2]
16. Florence-Muscle Shoals, AL
> 2018 employment change: 2,224 (+3.6%)
> Jan. 2018 employment: 61,061
> Oct. 2018 employment: 63,285
> Unemployment, Oct. 2018: 4.4%
> Strongest sector: Mining, logging and construction (+16.1% employment chg.)
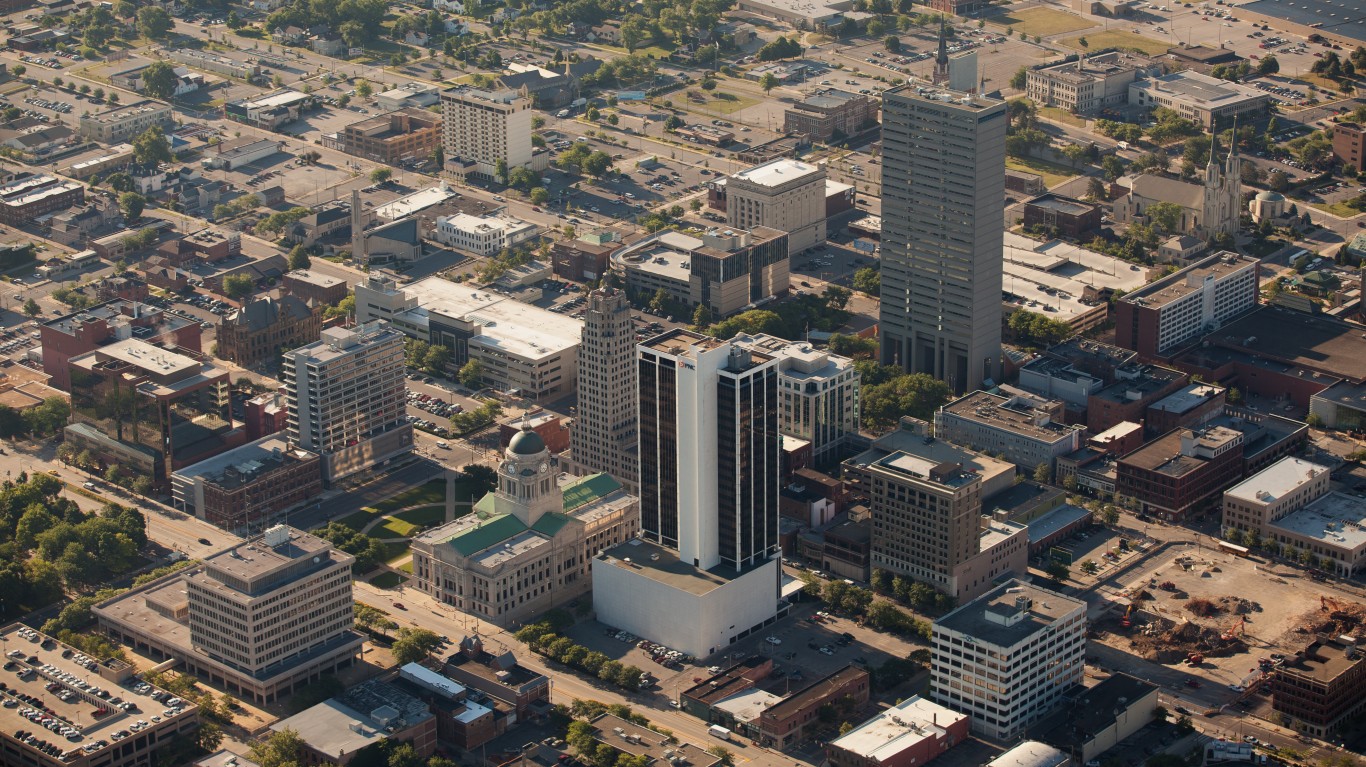
15. Fort Wayne, IN
> 2018 employment change: 7,479 (+3.7%)
> Jan. 2018 employment: 204,876
> Oct. 2018 employment: 212,355
> Unemployment, Oct. 2018: 3.3%
> Strongest sector: Mining, logging and construction (+22.7% employment chg.)
[in-text-ad]

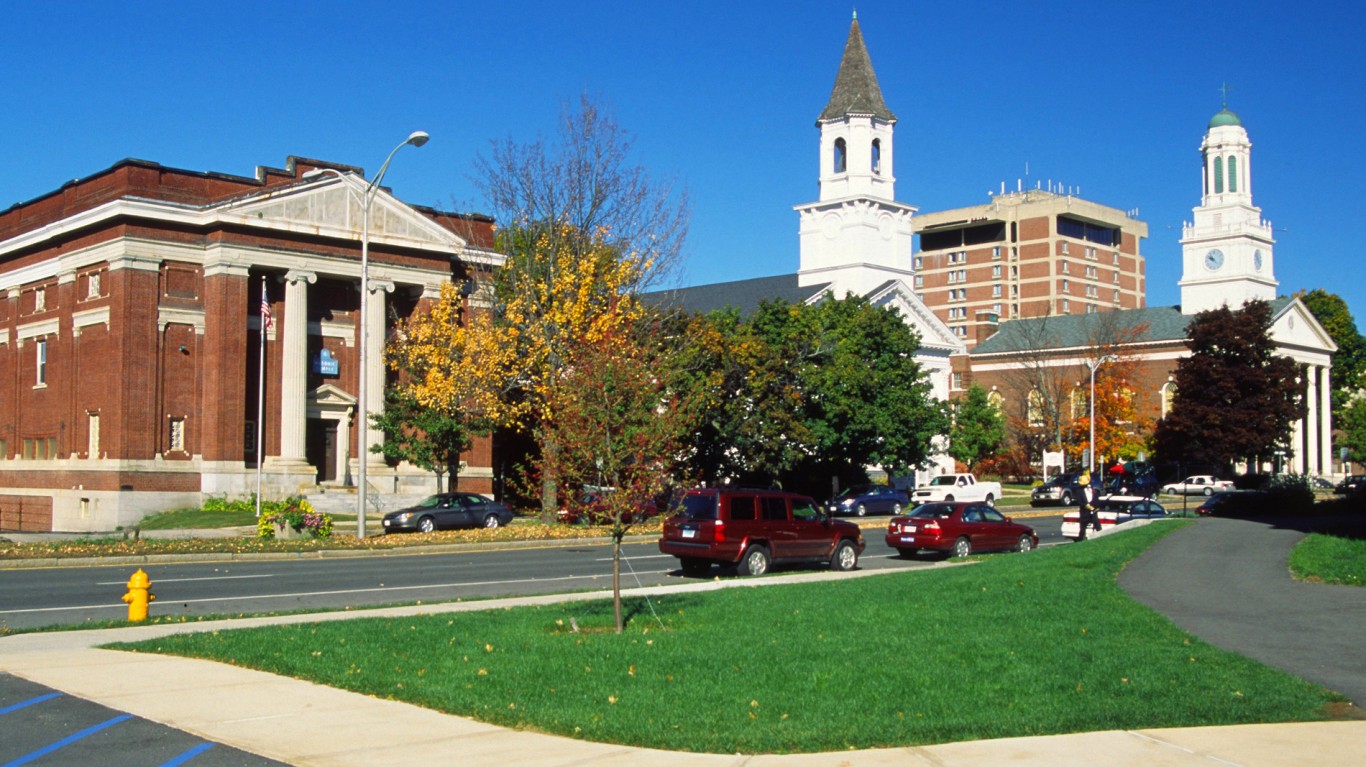
14. Springfield, MA-CT
> 2018 employment change: 13,169 (+3.7%)
> Jan. 2018 employment: 354,153
> Oct. 2018 employment: 367,322
> Unemployment, Oct. 2018: 4.1%
> Strongest sector: Leisure and hospitality (+20.7% employment chg.)

13. Las Vegas-Henderson-Paradise, NV
> 2018 employment change: 39,204 (+3.8%)
> Jan. 2018 employment: 1.0 million
> Oct. 2018 employment: 1.1 million
> Unemployment, Oct. 2018: 4.5%
> Strongest sector: Mining and logging (+25.0% employment chg.)
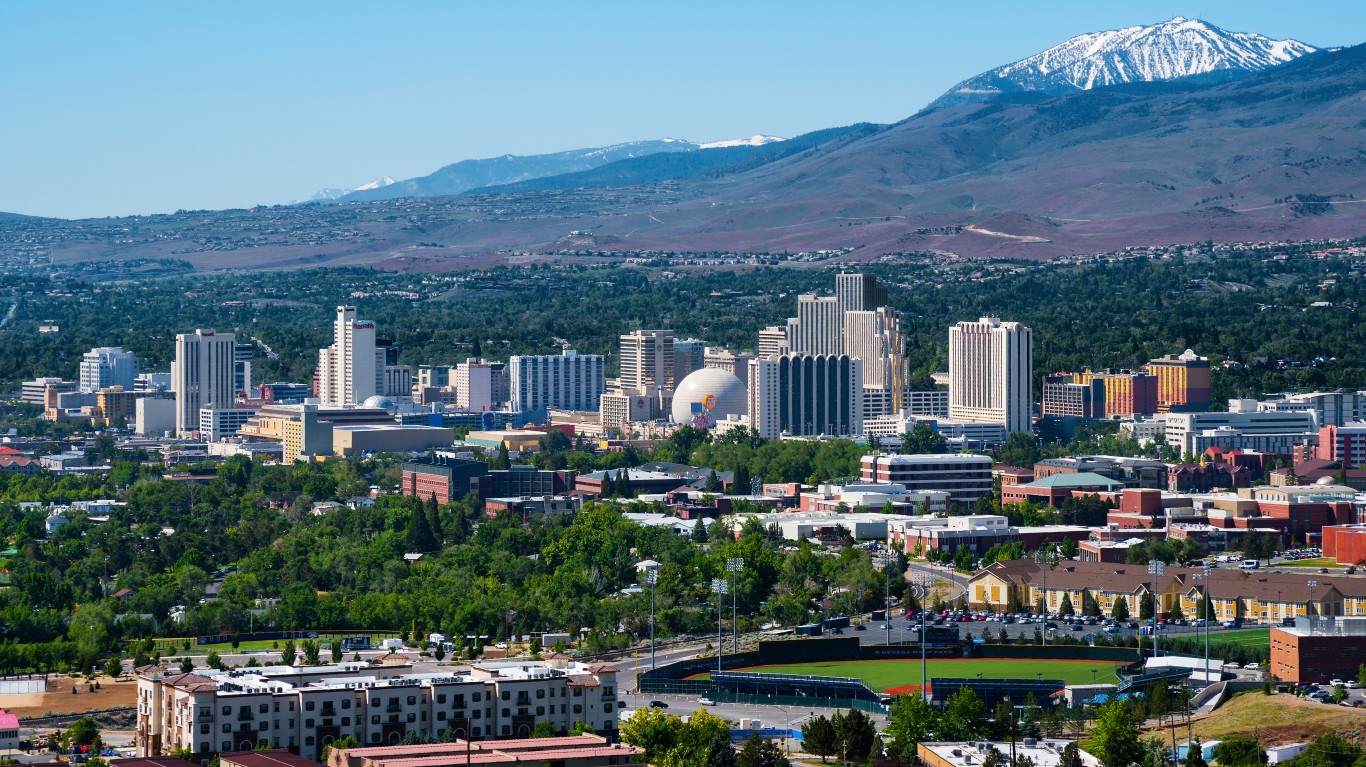
12. Reno, NV
> 2018 employment change: 9,033 (+3.8%)
> Jan. 2018 employment: 236,176
> Oct. 2018 employment: 245,209
> Unemployment, Oct. 2018: 3.5%
> Strongest sector: Construction (+20.1% employment chg.)
[in-text-ad-2]

11. Des Moines-West Des Moines, IA
> 2018 employment change: 13,507 (+4.0%)
> Jan. 2018 employment: 336,874
> Oct. 2018 employment: 350,381
> Unemployment, Oct. 2018: 2.3%
> Strongest sector: Mining, logging and construction (+32.8% employment chg.)

10. Sebring, FL
> 2018 employment change: 1,360 (+4.1%)
> Jan. 2018 employment: 33,304
> Oct. 2018 employment: 34,664
> Unemployment, Oct. 2018: 3.8%
> Strongest sector: N/A
[in-text-ad]
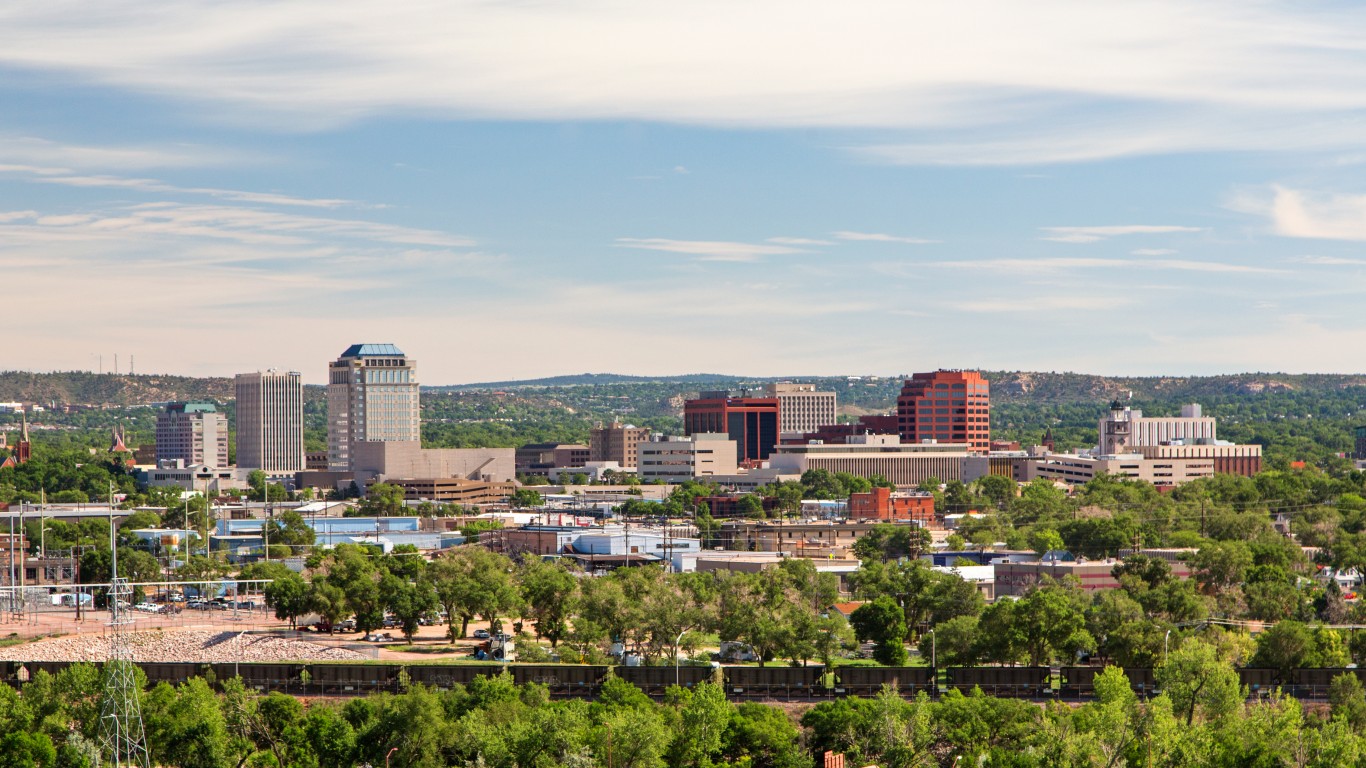
9. Colorado Springs, CO
> 2018 employment change: 14,083 (+4.2%)
> Jan. 2018 employment: 331,932
> Oct. 2018 employment: 346,015
> Unemployment, Oct. 2018: 3.9%
> Strongest sector: Professional and business services (+14.3% employment chg.)
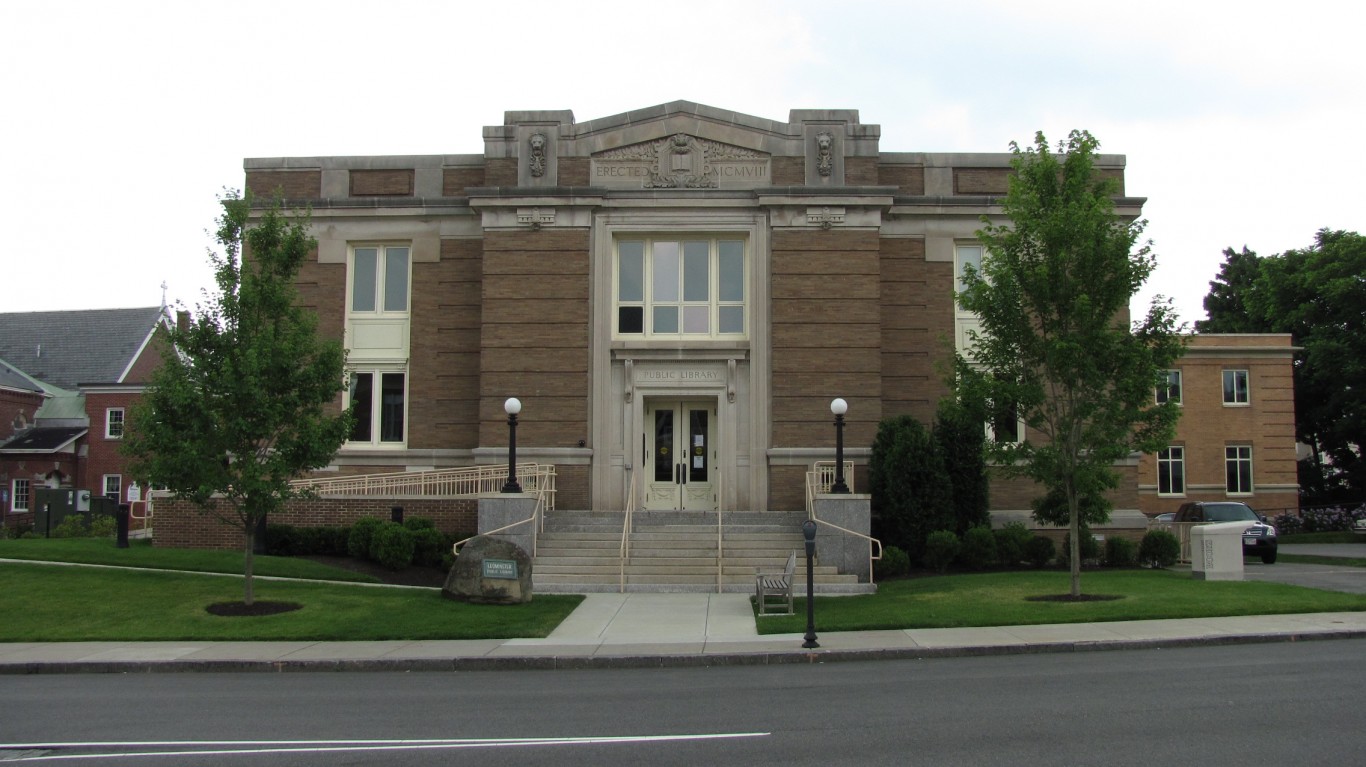
8. Leominster-Gardner, MA
> 2018 employment change: 3,203 (+4.3%)
> Jan. 2018 employment: 75,340
> Oct. 2018 employment: 78,543
> Unemployment, Oct. 2018: 3.8%
> Strongest sector: Mining, logging and construction (+31.6% employment chg.)

7. Worcester, MA-CT
> 2018 employment change: 14,905 (+4.4%)
> Jan. 2018 employment: 340,938
> Oct. 2018 employment: 355,843
> Unemployment, Oct. 2018: 3.6%
> Strongest sector: Mining, logging and construction (+18.1% employment chg.)
[in-text-ad-2]

6. Huntsville, AL
> 2018 employment change: 9,884 (+4.7%)
> Jan. 2018 employment: 208,740
> Oct. 2018 employment: 218,624
> Unemployment, Oct. 2018: 3.5%
> Strongest sector: Mining, logging and construction (+11.8% employment chg.)

5. Boston-Cambridge-Nashua, MA-NH
> 2018 employment change: 129,367 (+4.9%)
> Jan. 2018 employment: 2.6 million
> Oct. 2018 employment: 2.8 million
> Unemployment, Oct. 2018: 3.0%
> Strongest sector: Mining, logging and construction (+16.2% employment chg.)
[in-text-ad]

4. New Bedford, MA
> 2018 employment change: 3,959 (+4.9%)
> Jan. 2018 employment: 80,157
> Oct. 2018 employment: 84,116
> Unemployment, Oct. 2018: 5.0%
> Strongest sector: Mining, logging and construction (+37.5% employment chg.)
 24/7 Wall St.
3. Lafayette-West Lafayette, IN
> 2018 employment change: 5,645 (+5.4%)
> Jan. 2018 employment: 104,921
> Oct. 2018 employment: 110,566
> Unemployment, Oct. 2018: 3.3%
> Strongest sector: Mining, logging and construction (+19.4% employment chg.)
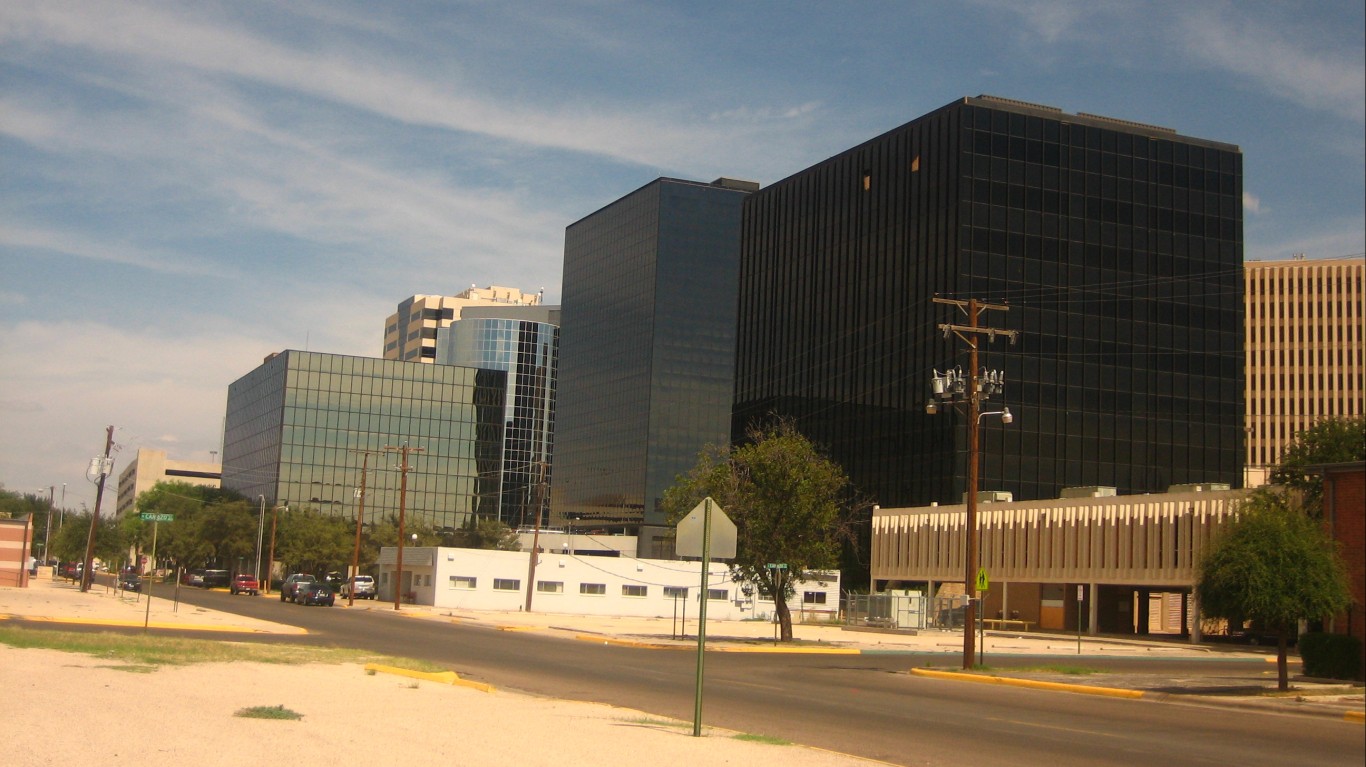
2. Midland, TX
> 2018 employment change: 5,282 (+5.7%)
> Jan. 2018 employment: 93,228
> Oct. 2018 employment: 98,510
> Unemployment, Oct. 2018: 2.2%
> Strongest sector: Mining, logging and construction (+18.8% employment chg.)
[in-text-ad-2]
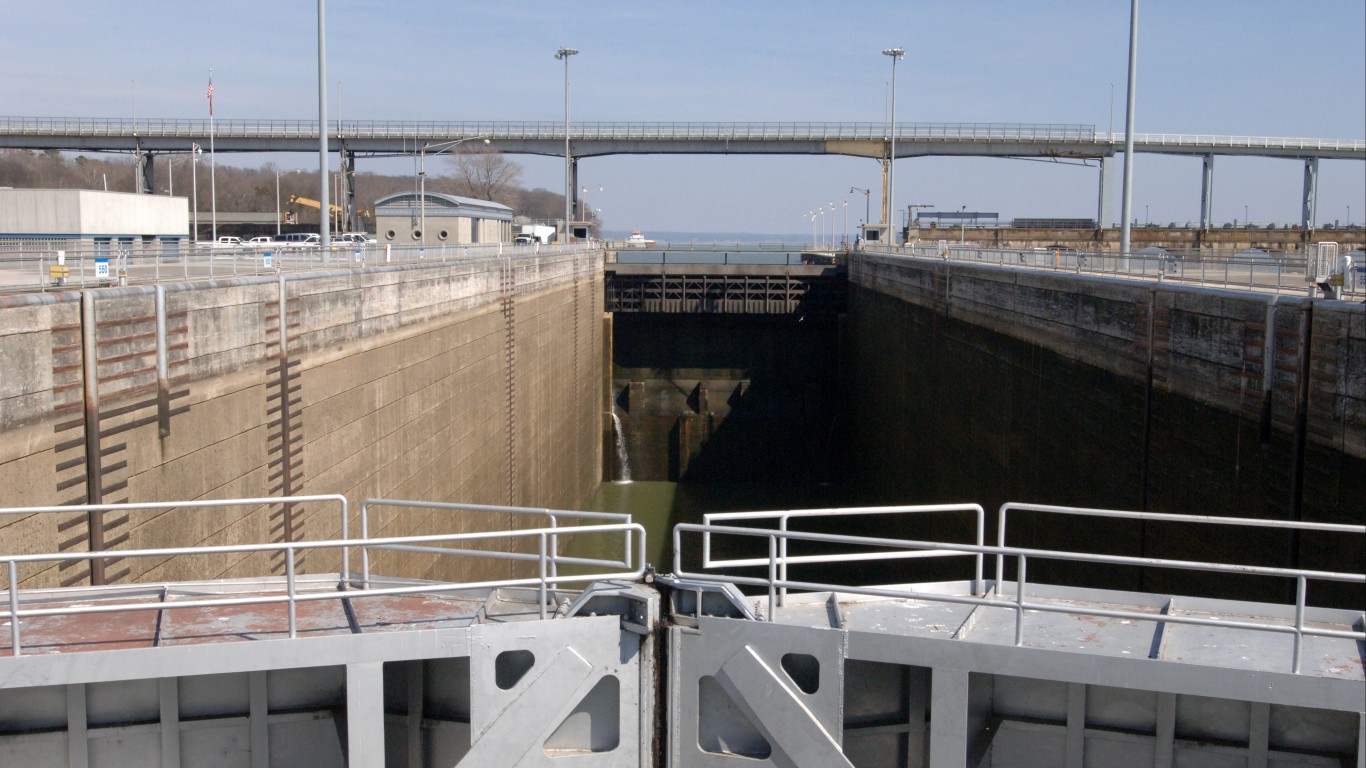
1. Kankakee, IL
> 2018 employment change: 3,081 (+5.7%)
> Jan. 2018 employment: 53,650
> Oct. 2018 employment: 56,731
> Unemployment, Oct. 2018: 5.0%
> Strongest sector: Mining, logging and construction (+45.5% employment chg.)
The Average American Has No Idea How Much Money You Can Make Today (Sponsor)
The last few years made people forget how much banks and CD’s can pay. Meanwhile, interest rates have spiked and many can afford to pay you much more, but most are keeping yields low and hoping you won’t notice.
But there is good news. To win qualified customers, some accounts are paying almost 10x the national average! That’s an incredible way to keep your money safe and earn more at the same time. Our top pick for high yield savings accounts includes other benefits as well. You can earn up to 3.80% with a Checking & Savings Account today Sign up and get up to $300 with direct deposit. No account fees. FDIC Insured.
Click here to see how much more you could be earning on your savings today. It takes just a few minutes to open an account to make your money work for you.
Our top pick for high yield savings accounts includes other benefits as well. You can earn up to 4.00% with a Checking & Savings Account from Sofi. Sign up and get up to $300 with direct deposit. No account fees. FDIC Insured.
Thank you for reading! Have some feedback for us?
Contact the 24/7 Wall St. editorial team.
Latest from 24/7


Our expert who first called NVIDIA in 2009 is predicting 2025 will see a historic AI breakthrough.
You can follow him investing $500,000 of his own money on our top AI stocks for free.