Special Report
States With the Most Unsheltered Homeless People
Published:
Last Updated:

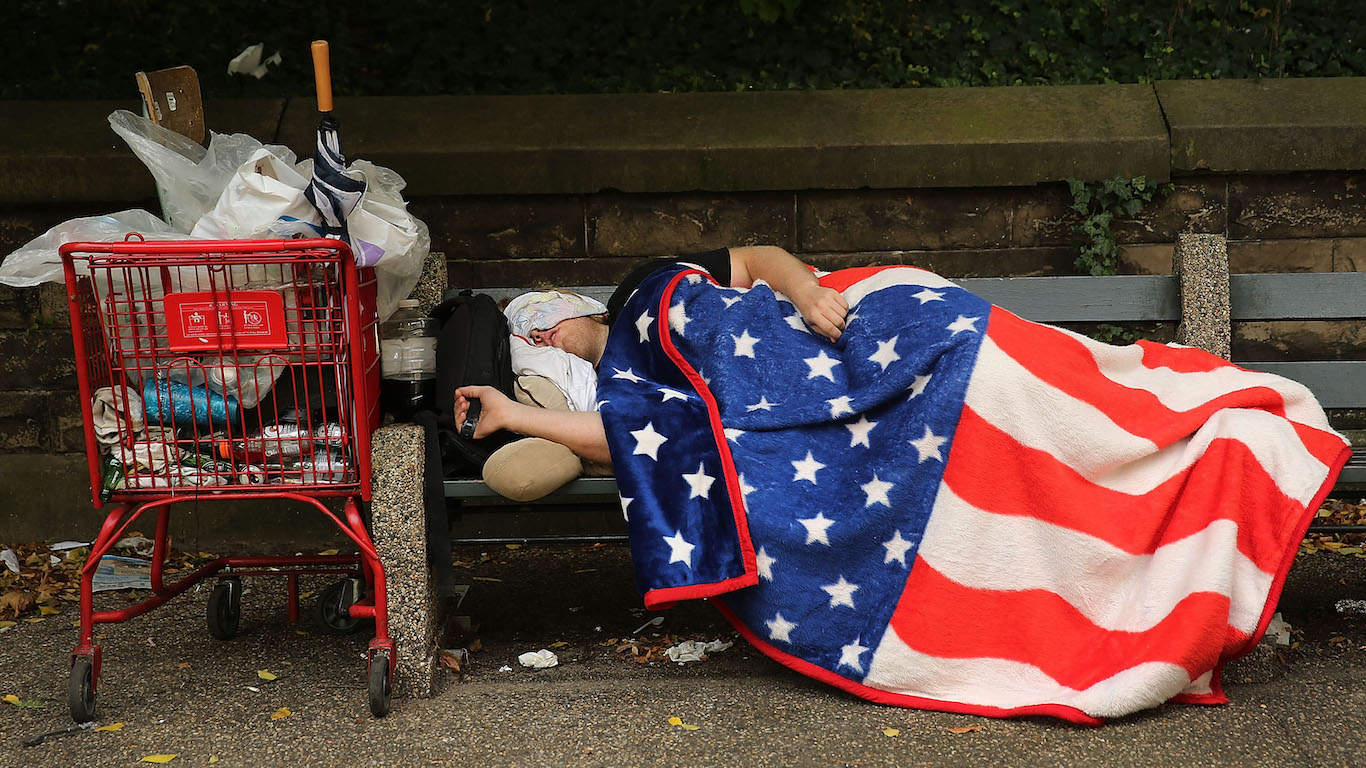
There were an estimated 552,830 people experiencing homelessness across the United States in January 2018, essentially the same number as the same time last year.
The U.S. Department of Housing and Urban Development delivers to Congress annual estimates of homelessness across the nation. There is a great deal of variation in homelessness across the country.
Based on the latest report from HUD, 24/7 Wall St. reviewed the share of each state’s homeless population that is unsheltered. Nationwide, approximately two-thirds of homeless individuals were staying in sheltered locations, while one-third lived on the street, in abandoned buildings, and other unsheltered places.
Click here to see the states with the most unsheltered homeless people.
Click here to see our detailed findings and methodology.
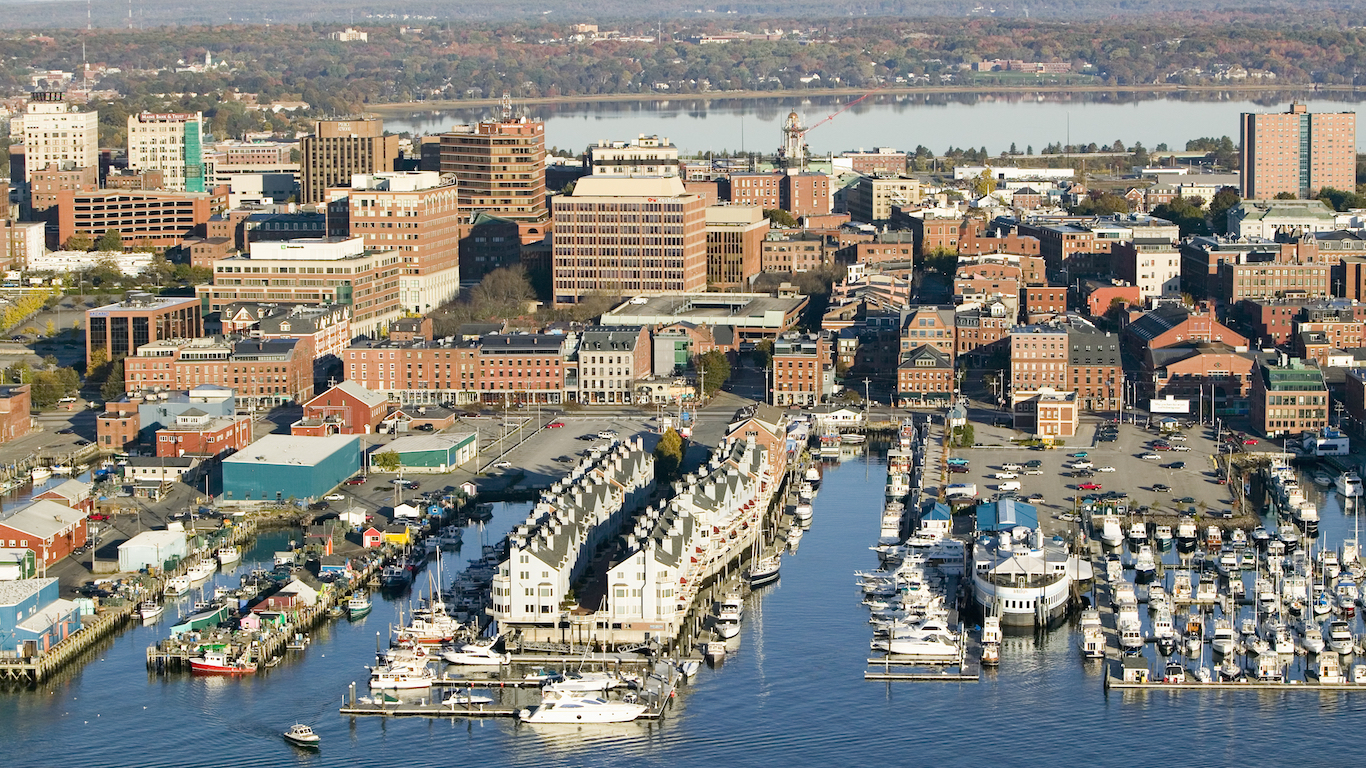
50. Maine
> Homeless individuals w/o shelter: 3.9% (total: 98)
> Overall homelessness: 2,516 (19 in every 10,000 people — 11th highest)
> Change in overall homelessness 2017-2018: +10.4%
> Change in overall homelessness 2008-2018: -4.4%
> Poverty rate: 11.1% (16th lowest)
[in-text-ad]
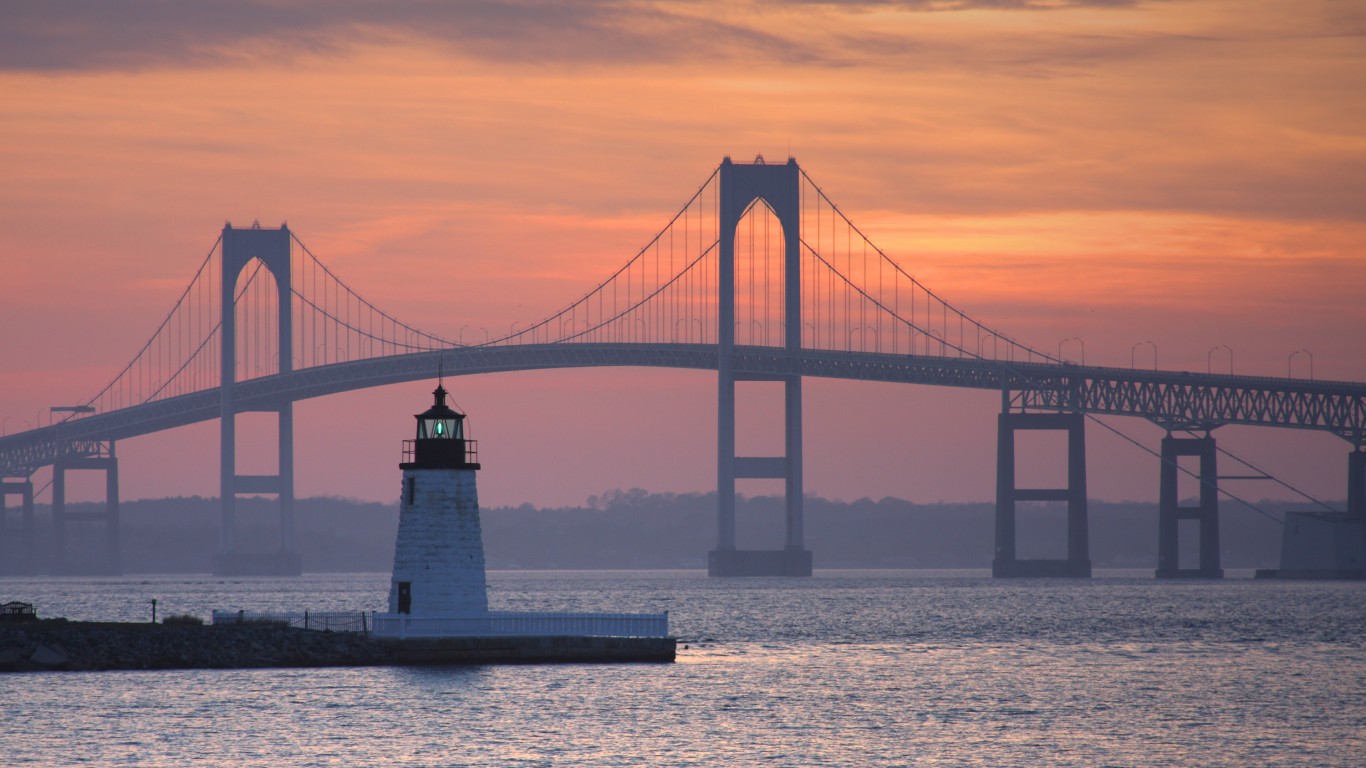
49. Rhode Island
> Homeless individuals w/o shelter: 4.6% (total: 51)
> Overall homelessness: 1,101 (10 in every 10,000 people — 23rd lowest)
> Change in overall homelessness 2017-2018: -6.7%
> Change in overall homelessness 2008-2018: -7.9%
> Poverty rate: 11.6% (20th lowest)

48. New York
> Homeless individuals w/o shelter: 4.7% (total: 4,294)
> Overall homelessness: 91,897 (46 in every 10,000 people — the highest)
> Change in overall homelessness 2017-2018: +2.7%
> Change in overall homelessness 2008-2018: +50.3%
> Poverty rate: 14.1% (16th highest)
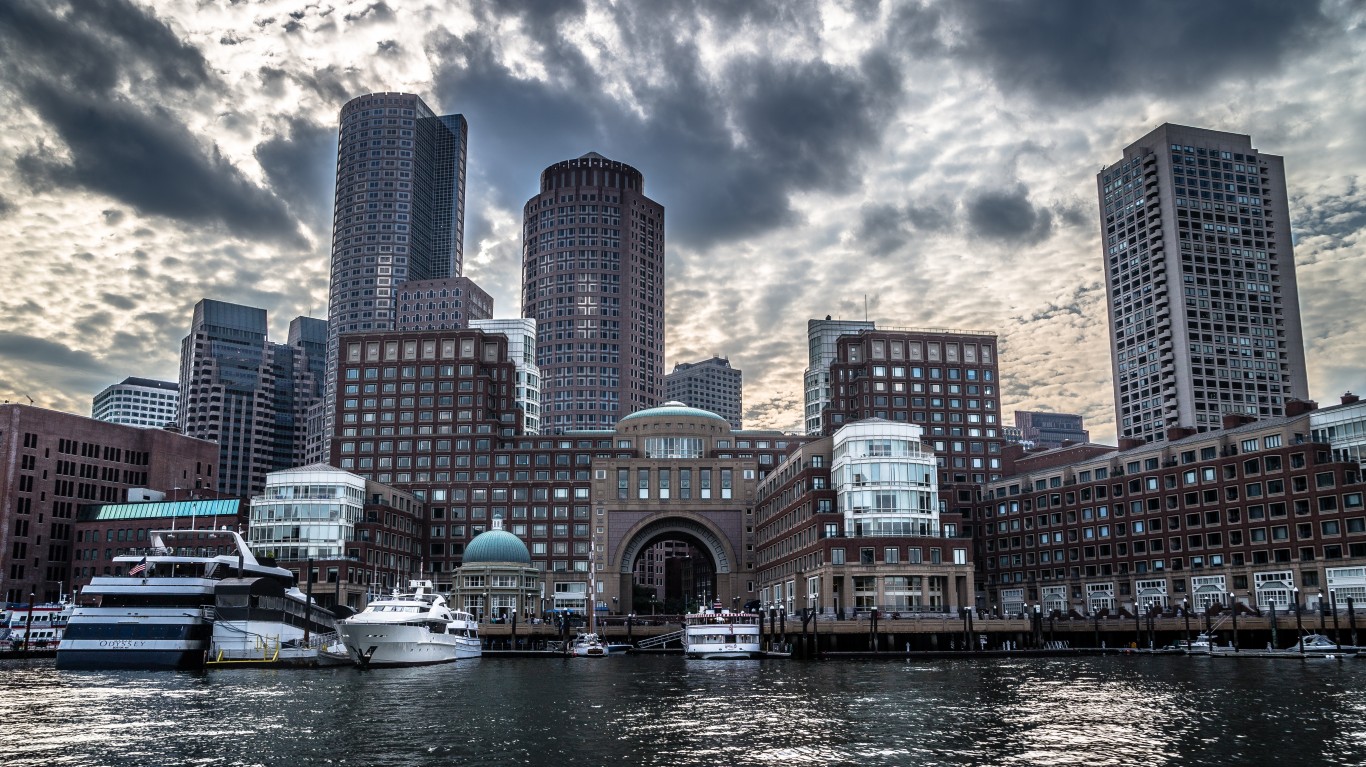
47. Massachusetts
> Homeless individuals w/o shelter: 4.9% (total: 985)
> Overall homelessness: 20,068 (29 in every 10,000 people — 6th highest)
> Change in overall homelessness 2017-2018: +14.2%
> Change in overall homelessness 2008-2018: +38.3%
> Poverty rate: 10.5% (10th lowest)
[in-text-ad-2]
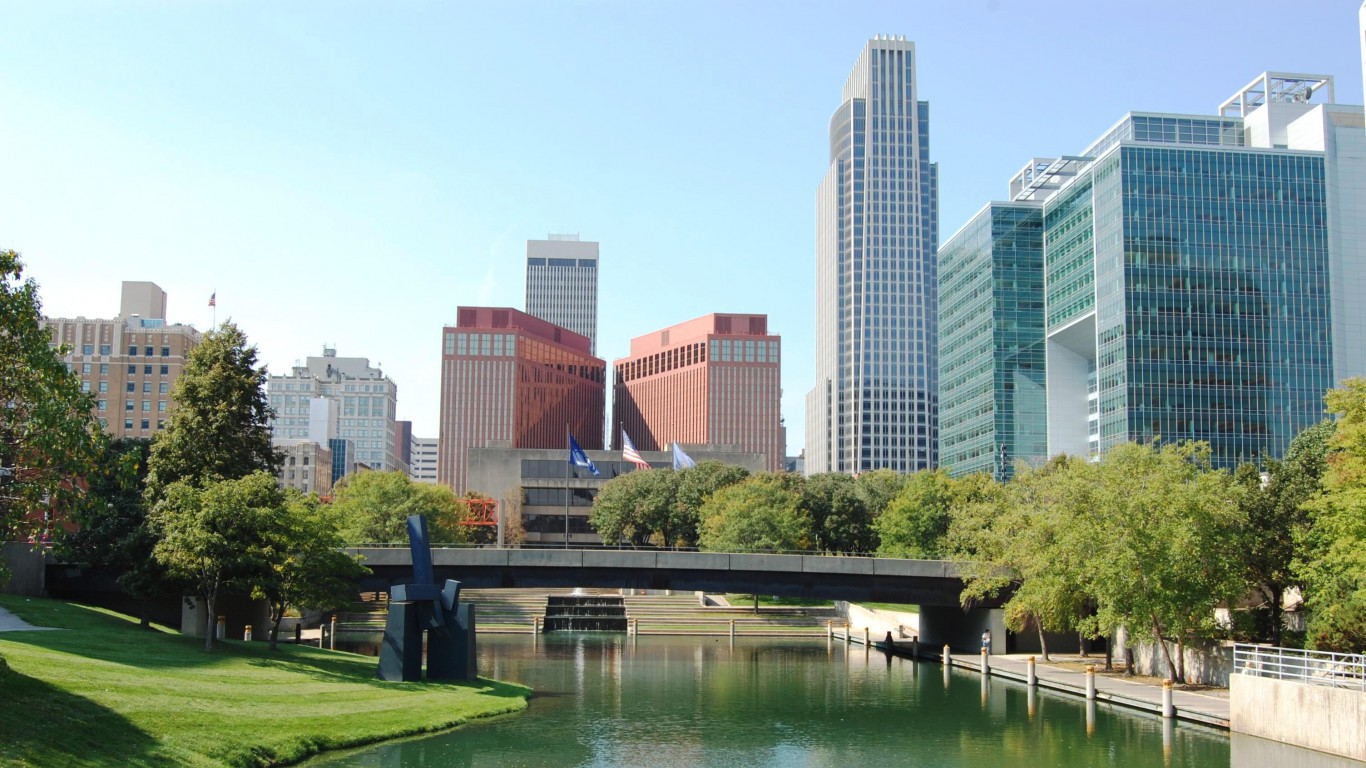
46. Nebraska
> Homeless individuals w/o shelter: 5.9% (total: 144)
> Overall homelessness: 2,421 (13 in every 10,000 people — 17th highest)
> Change in overall homelessness 2017-2018: -3.2%
> Change in overall homelessness 2008-2018: -39.2%
> Poverty rate: 10.8% (13th lowest)
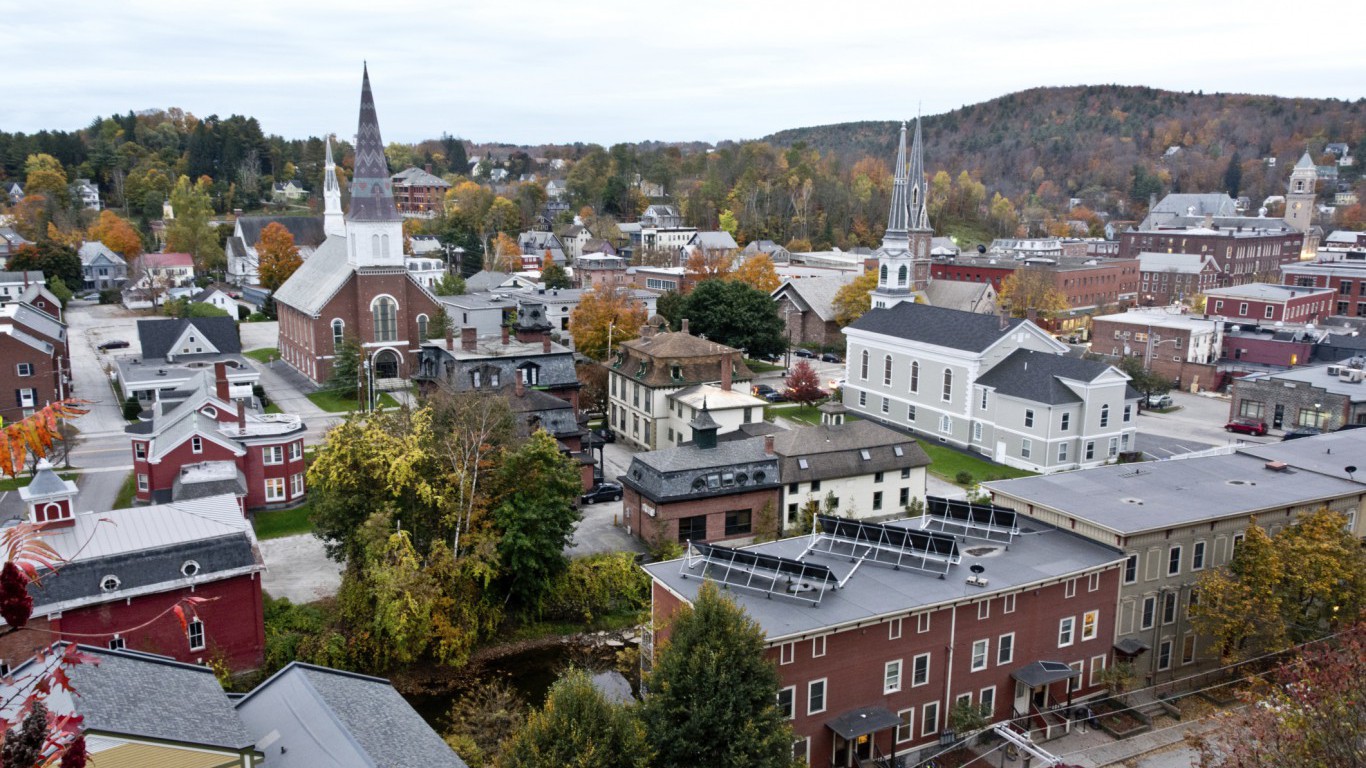
45. Vermont
> Homeless individuals w/o shelter: 6.4% (total: 82)
> Overall homelessness: 1,291 (21 in every 10,000 people — 9th highest)
> Change in overall homelessness 2017-2018: +5.4%
> Change in overall homelessness 2008-2018: +35.3%
> Poverty rate: 11.3% (19th lowest)
[in-text-ad]

44. Wisconsin
> Homeless individuals w/o shelter: 7.8% (total: 382)
> Overall homelessness: 4,907 (8 in every 10,000 people — 13th lowest)
> Change in overall homelessness 2017-2018: -2.4%
> Change in overall homelessness 2008-2018: -9.9%
> Poverty rate: 11.3% (19th lowest)
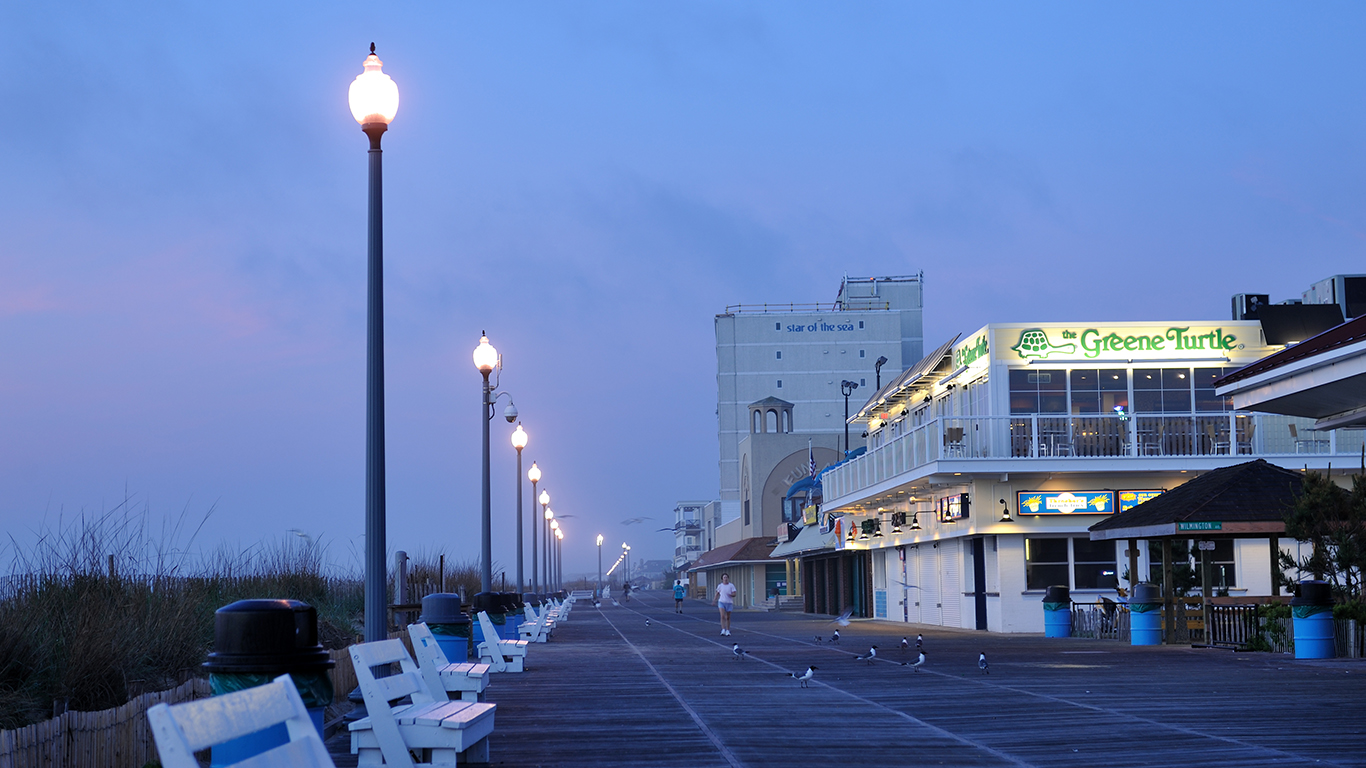
43. Delaware
> Homeless individuals w/o shelter: 8.6% (total: 93)
> Overall homelessness: 1,082 (11 in every 10,000 people — 22nd highest)
> Change in overall homelessness 2017-2018: 8.9%
> Change in overall homelessness 2008-2018: 16.0%
> Poverty rate: 13.6% (19th highest)
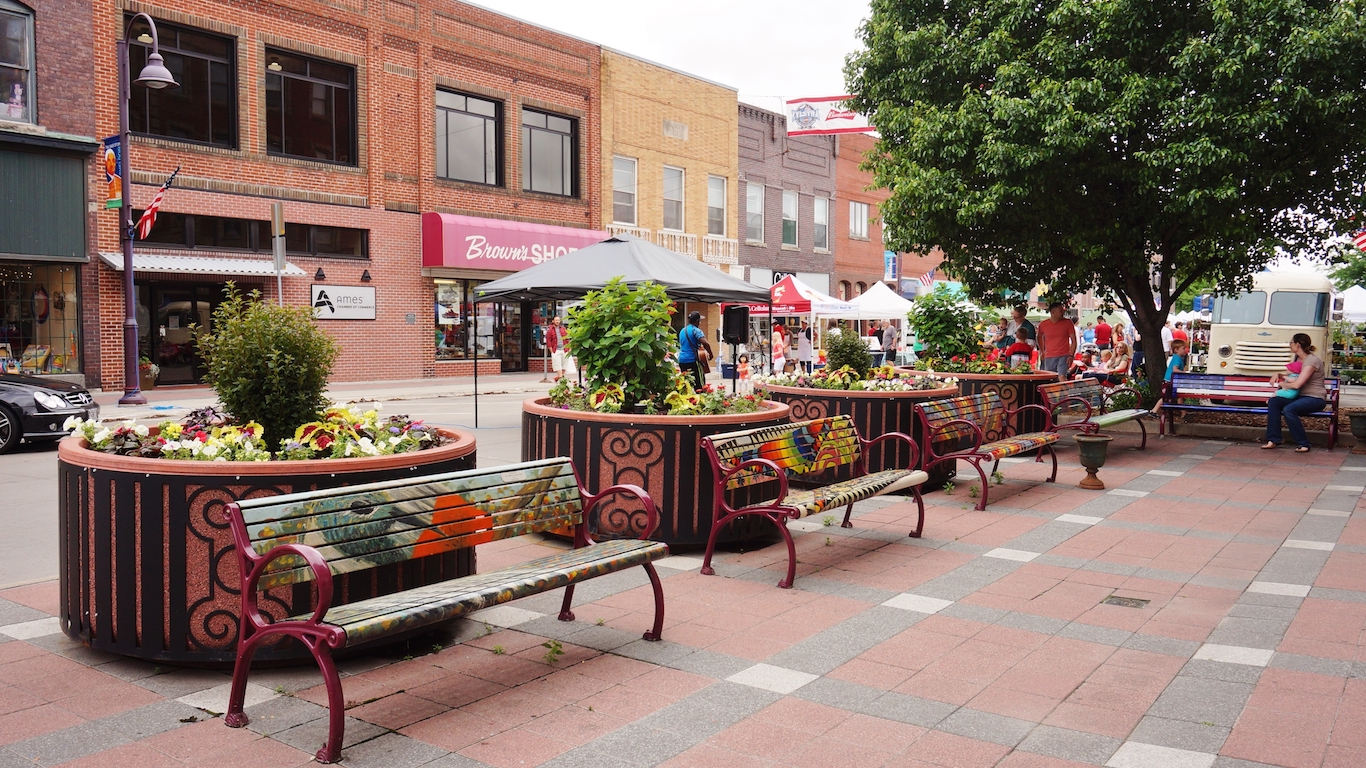
42. Iowa
> Homeless individuals w/o shelter: 8.8% (total: 241)
> Overall homelessness: 2,749 (9 in every 10,000 people — 14th lowest)
> Change in overall homelessness 2017-2018: -0.3%
> Change in overall homelessness 2008-2018: -17.8%
> Poverty rate: 10.7% (12th lowest)
[in-text-ad-2]
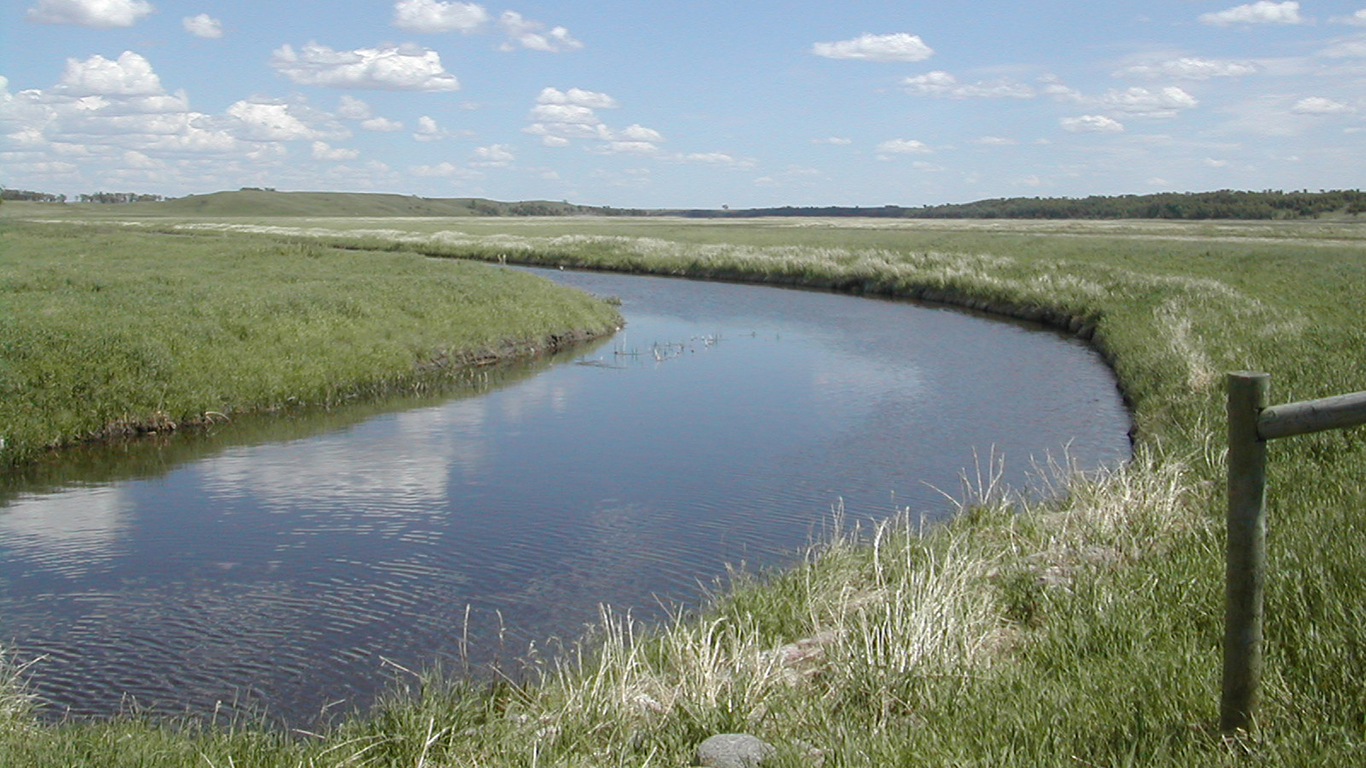
41. North Dakota
> Homeless individuals w/o shelter: 8.9% (total: 48)
> Overall homelessness: 542 (7 in every 10,000 people — 6th lowest)
> Change in overall homelessness 2017-2018: -50.2%
> Change in overall homelessness 2008-2018: -11.9%
> Poverty rate: 10.3% (9th lowest)
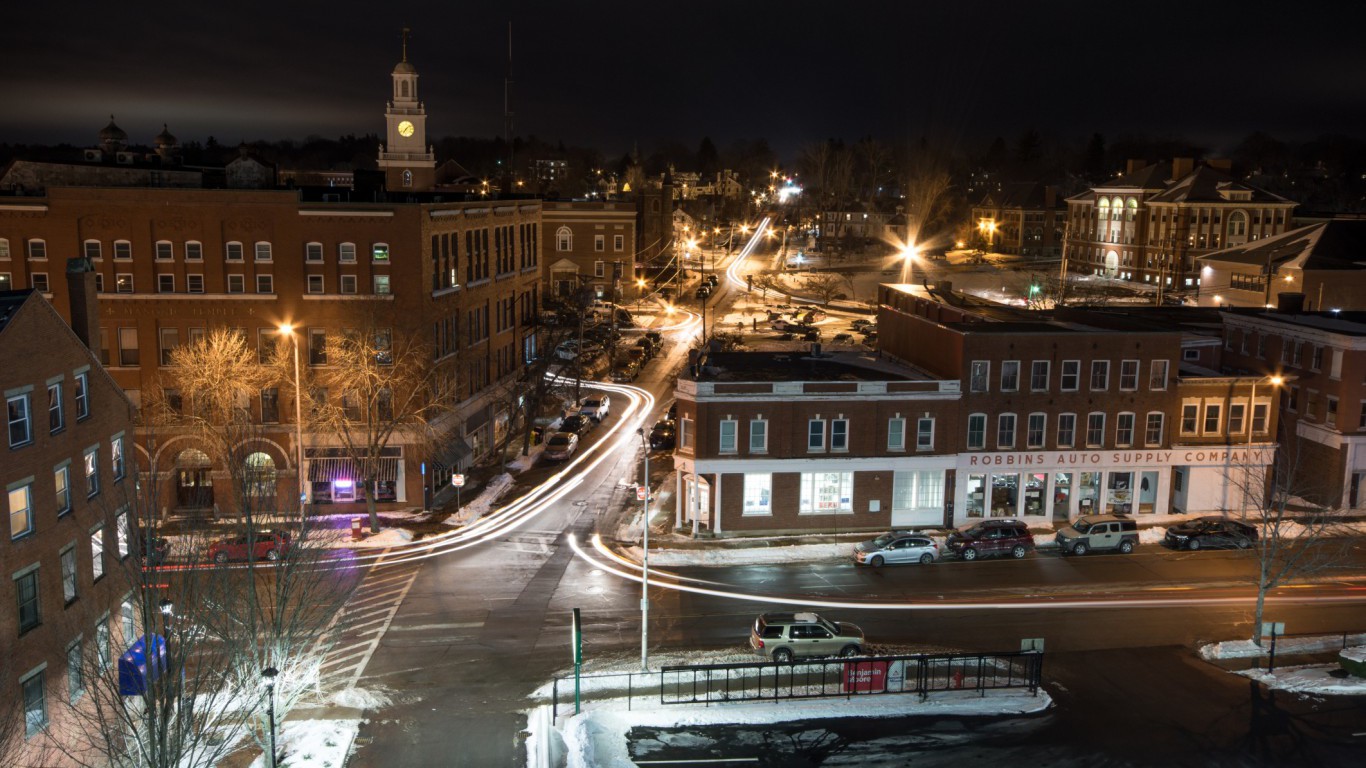
40. New Hampshire
> Homeless individuals w/o shelter: 10.6% (total: 154)
> Overall homelessness: 1,450 (11 in every 10,000 people — 25th highest)
> Change in overall homelessness 2017-2018: -0.4%
> Change in overall homelessness 2008-2018: -28.2%
> Poverty rate: 7.7% (the lowest)
[in-text-ad]
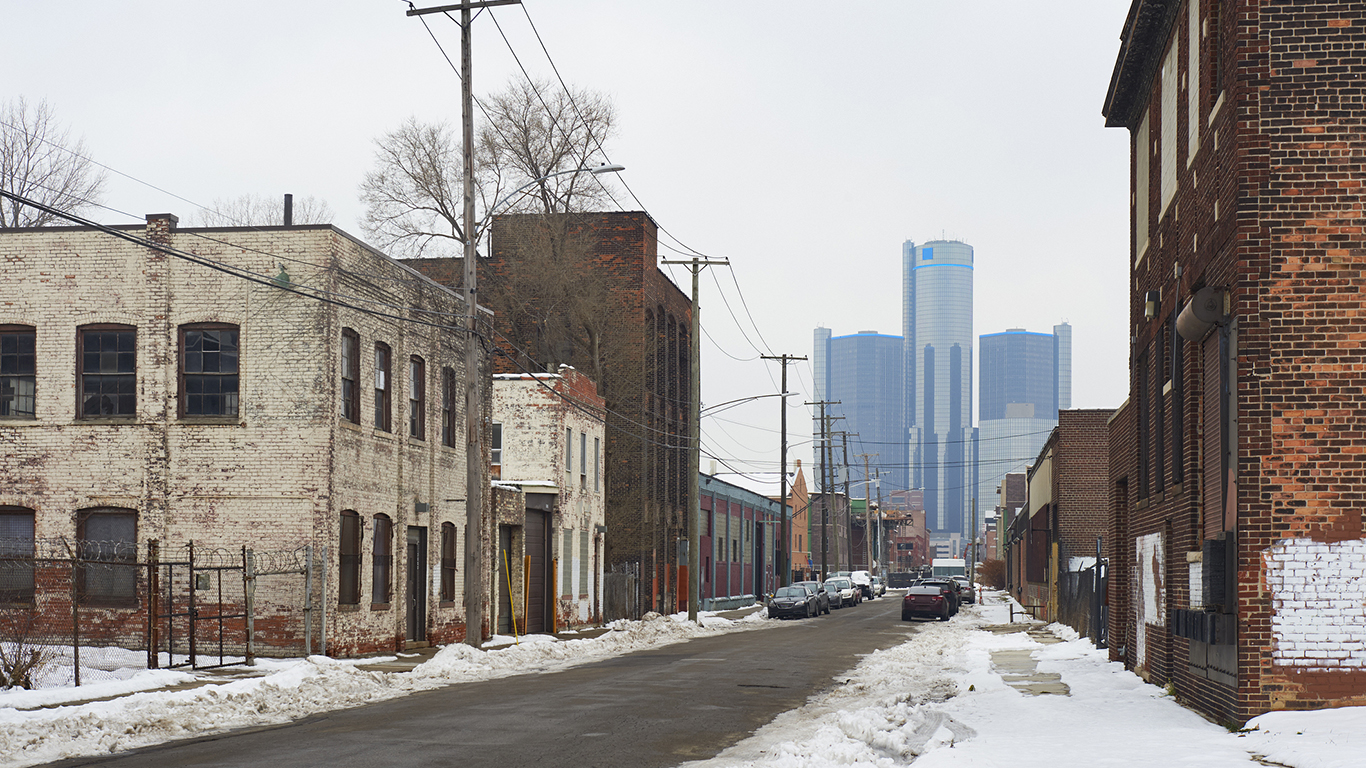
39. Michigan
> Homeless individuals w/o shelter: 10.8% (total: 899)
> Overall homelessness: 8,351 (8 in every 10,000 people — 12th lowest)
> Change in overall homelessness 2017-2018: -7.7%
> Change in overall homelessness 2008-2018: -70.4%
> Poverty rate: 14.2% (15th highest)
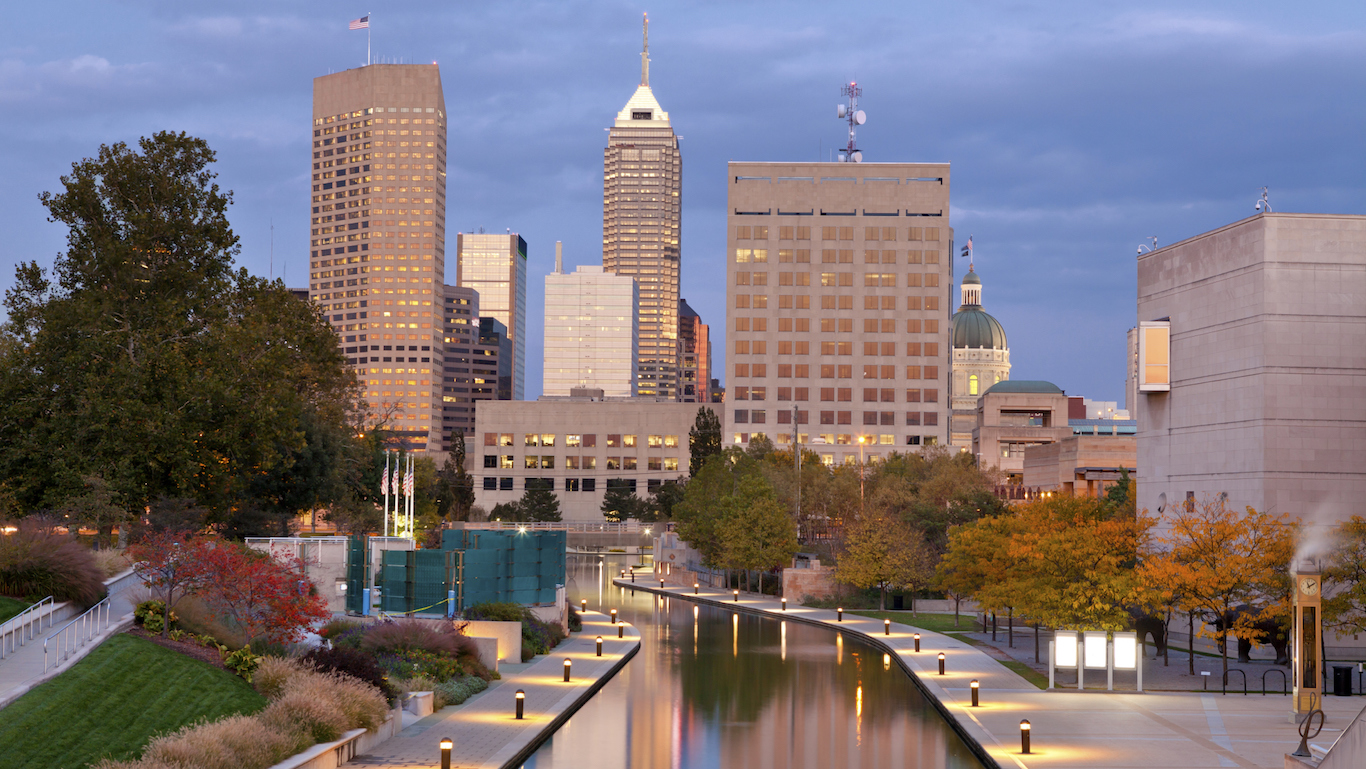
38. Indiana
> Homeless individuals w/o shelter: 11.0% (total: 579)
> Overall homelessness: 5,258 (8 in every 10,000 people — 9th lowest)
> Change in overall homelessness 2017-2018: -3.3%
> Change in overall homelessness 2008-2018: -28.9%
> Poverty rate: 13.5% (20th highest)
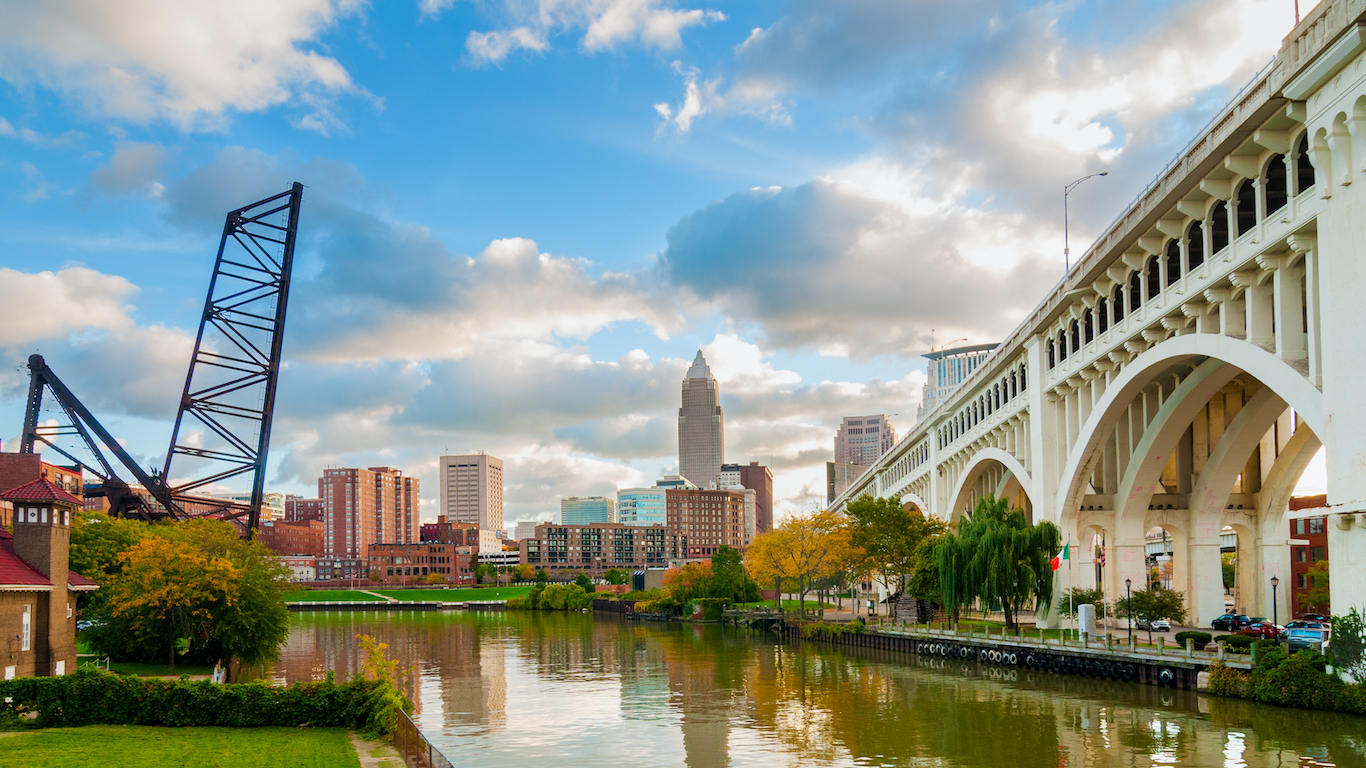
37. Ohio
> Homeless individuals w/o shelter: 12.8% (total: 1,315)
> Overall homelessness: 10,249 (9 in every 10,000 people — 15th lowest)
> Change in overall homelessness 2017-2018: +1.5%
> Change in overall homelessness 2008-2018: -20.6%
> Poverty rate: 14.0% (17th highest)
[in-text-ad-2]

36. Pennsylvania
> Homeless individuals w/o shelter: 12.9% (total: 1,744)
> Overall homelessness: 13,512 (11 in every 10,000 people — 25th lowest)
> Change in overall homelessness 2017-2018: -4.4%
> Change in overall homelessness 2008-2018: -12.1%
> Poverty rate: 12.5% (23rd lowest)
35. Utah
> Homeless individuals w/o shelter: 14.6% (total: 420)
> Overall homelessness: 2,876 (9 in every 10,000 people — 20th lowest)
> Change in overall homelessness 2017-2018: +0.8%
> Change in overall homelessness 2008-2018: -16.2%
> Poverty rate: 9.7% (6th lowest)
[in-text-ad]
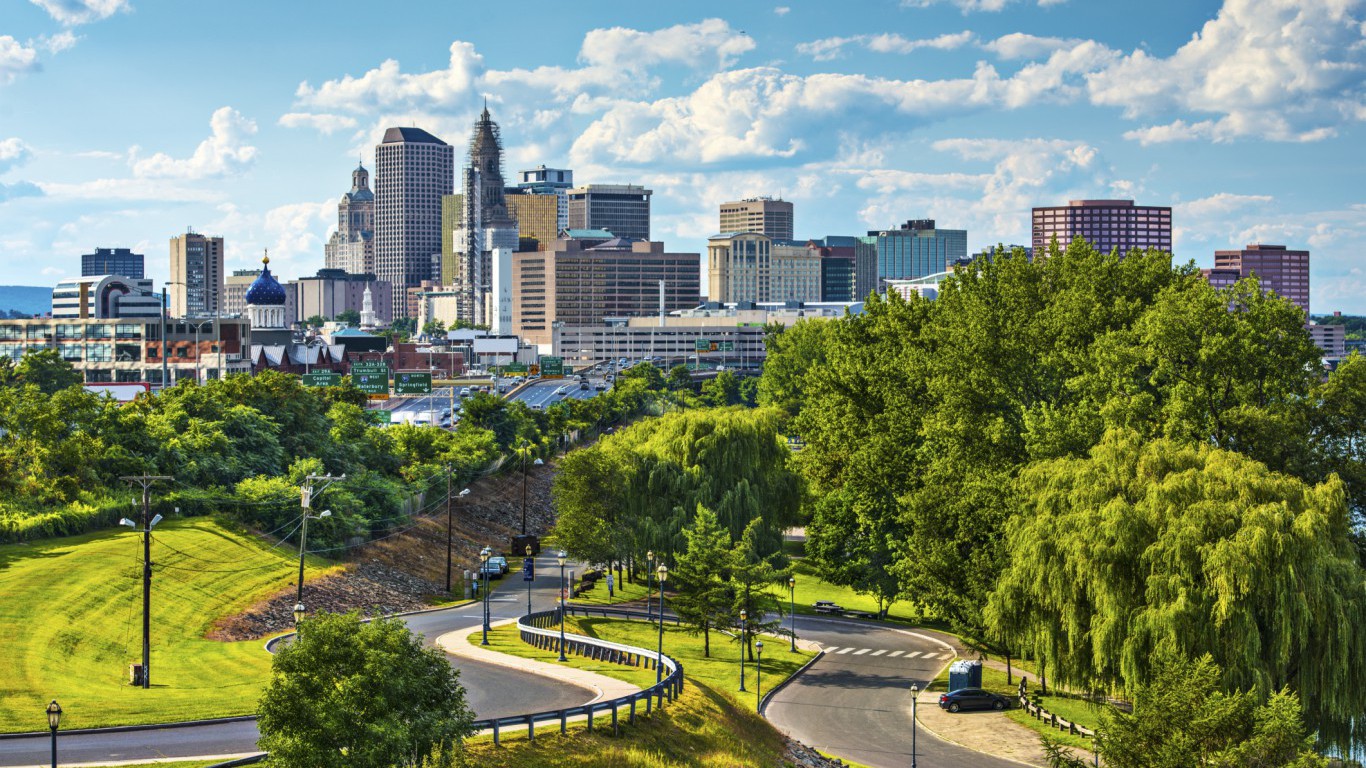
34. Connecticut
> Homeless individuals w/o shelter: 14.6% (total: 581)
> Overall homelessness: 3,976 (11 in every 10,000 people — 23rd highest)
> Change in overall homelessness 2017-2018: +17.4%
> Change in overall homelessness 2008-2018: -14.1%
> Poverty rate: 9.6% (5th lowest)
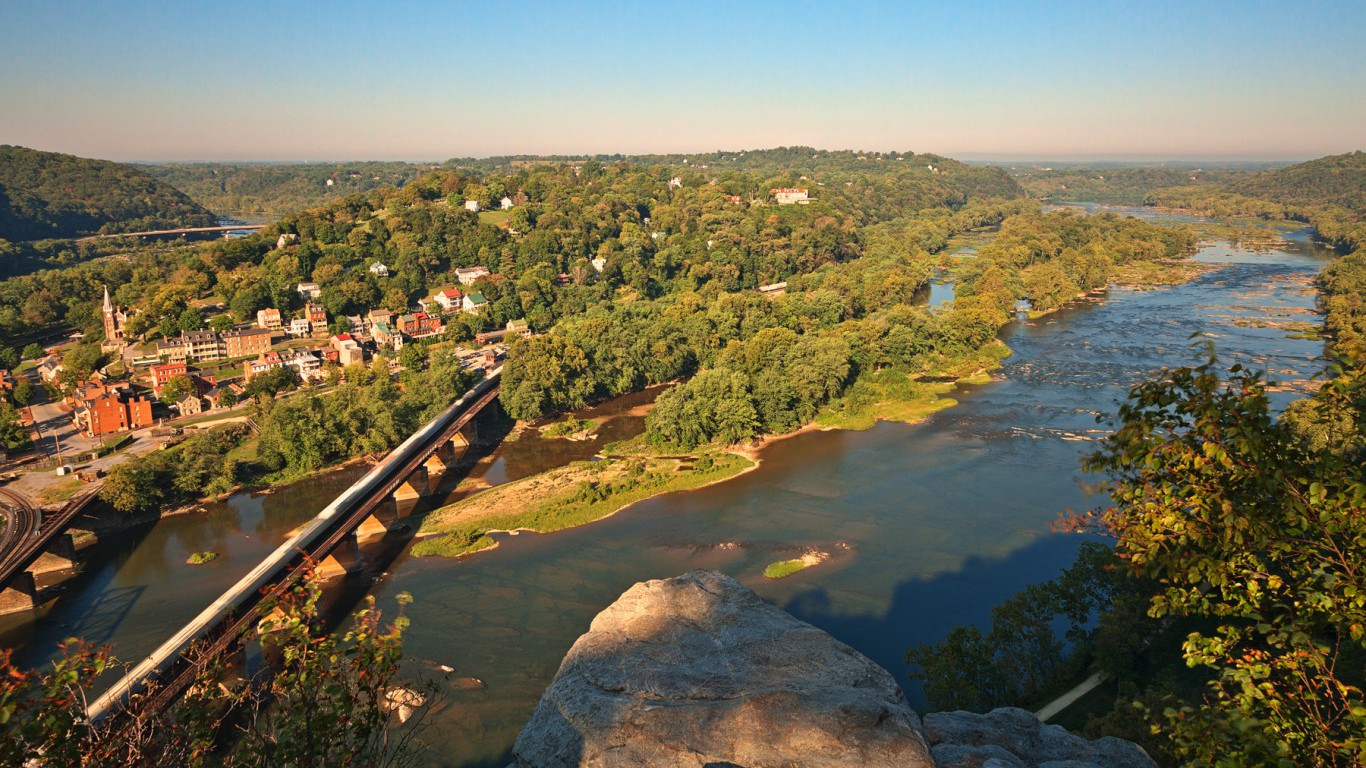
33. West Virginia
> Homeless individuals w/o shelter: 14.7% (total: 183)
> Overall homelessness: 1,243 (7 in every 10,000 people — 3rd lowest)
> Change in overall homelessness 2017-2018: -5.0%
> Change in overall homelessness 2008-2018: -38.3%
> Poverty rate: 19.1% (4th highest)
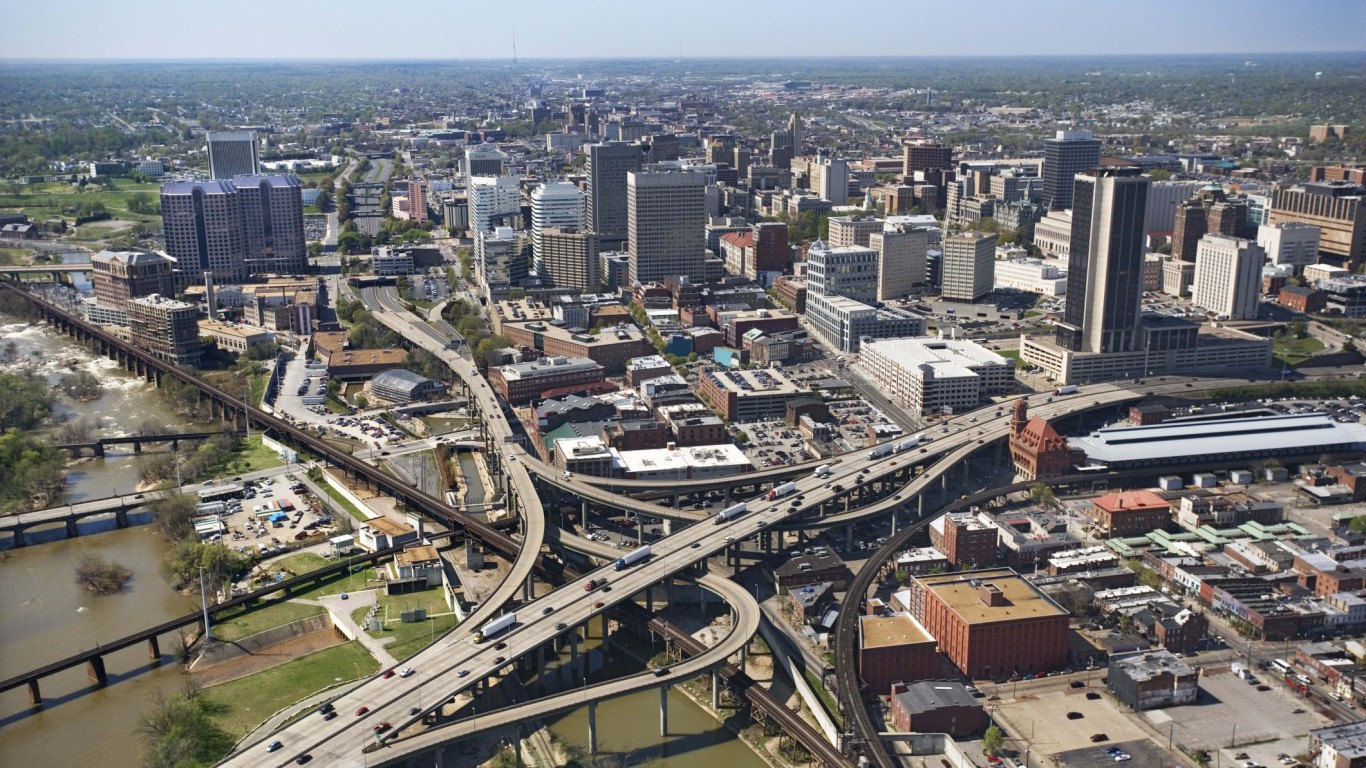
32. Virginia
> Homeless individuals w/o shelter: 15.3% (total: 915)
> Overall homelessness: 5,975 (7 in every 10,000 people — 5th lowest)
> Change in overall homelessness 2017-2018: -1.5%
> Change in overall homelessness 2008-2018: -29.4%
> Poverty rate: 10.6% (11th lowest)
[in-text-ad-2]
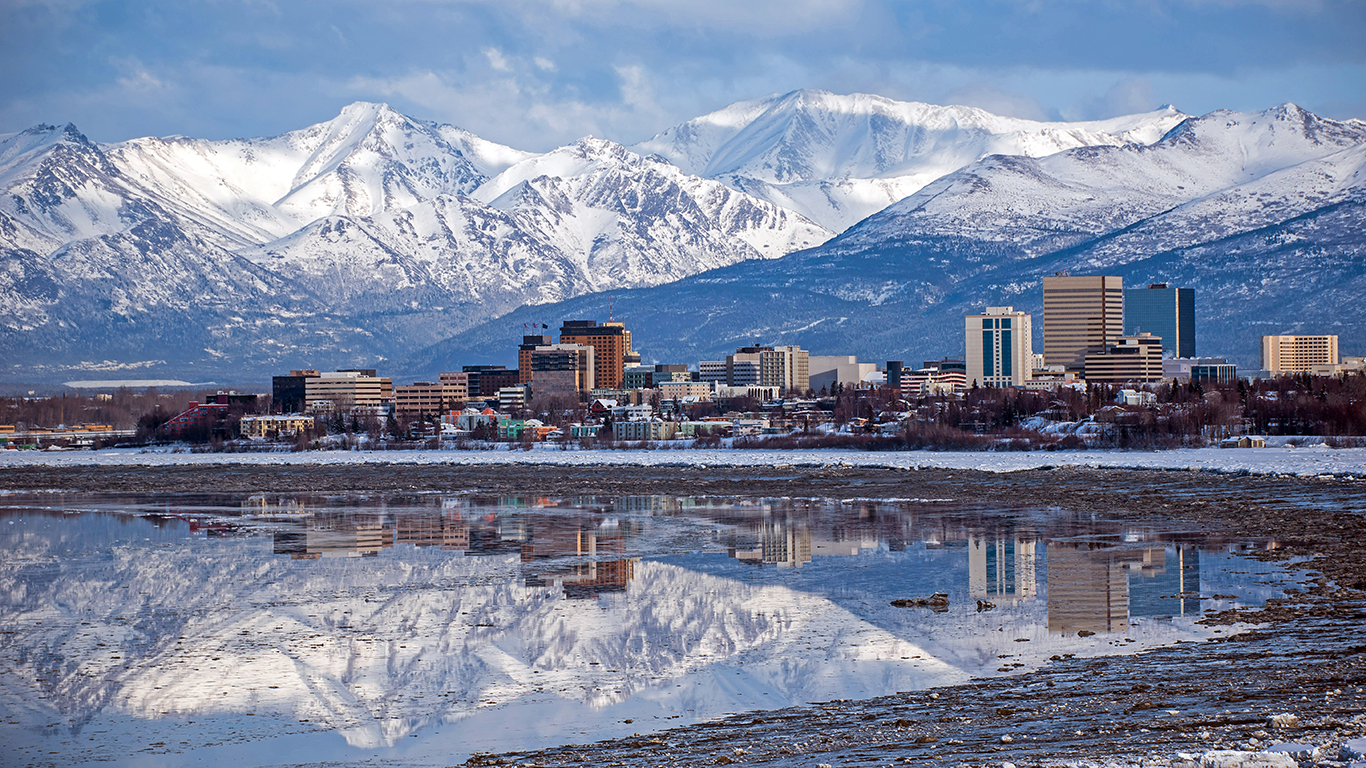
31. Alaska
> Homeless individuals w/o shelter: 15.3% (total: 309)
> Overall homelessness: 2,016 (27 in every 10,000 people — 7th highest)
> Change in overall homelessness 2017-2018: +9.3%
> Change in overall homelessness 2008-2018: +22.5%
> Poverty rate: 11.1% (16th lowest)
30. Minnesota
> Homeless individuals w/o shelter: 15.5% (total: 1,121)
> Overall homelessness: 7,243 (13 in every 10,000 people — 16th highest)
> Change in overall homelessness 2017-2018: -5.5%
> Change in overall homelessness 2008-2018: -5.2%
> Poverty rate: 9.5% (4th lowest)
[in-text-ad]
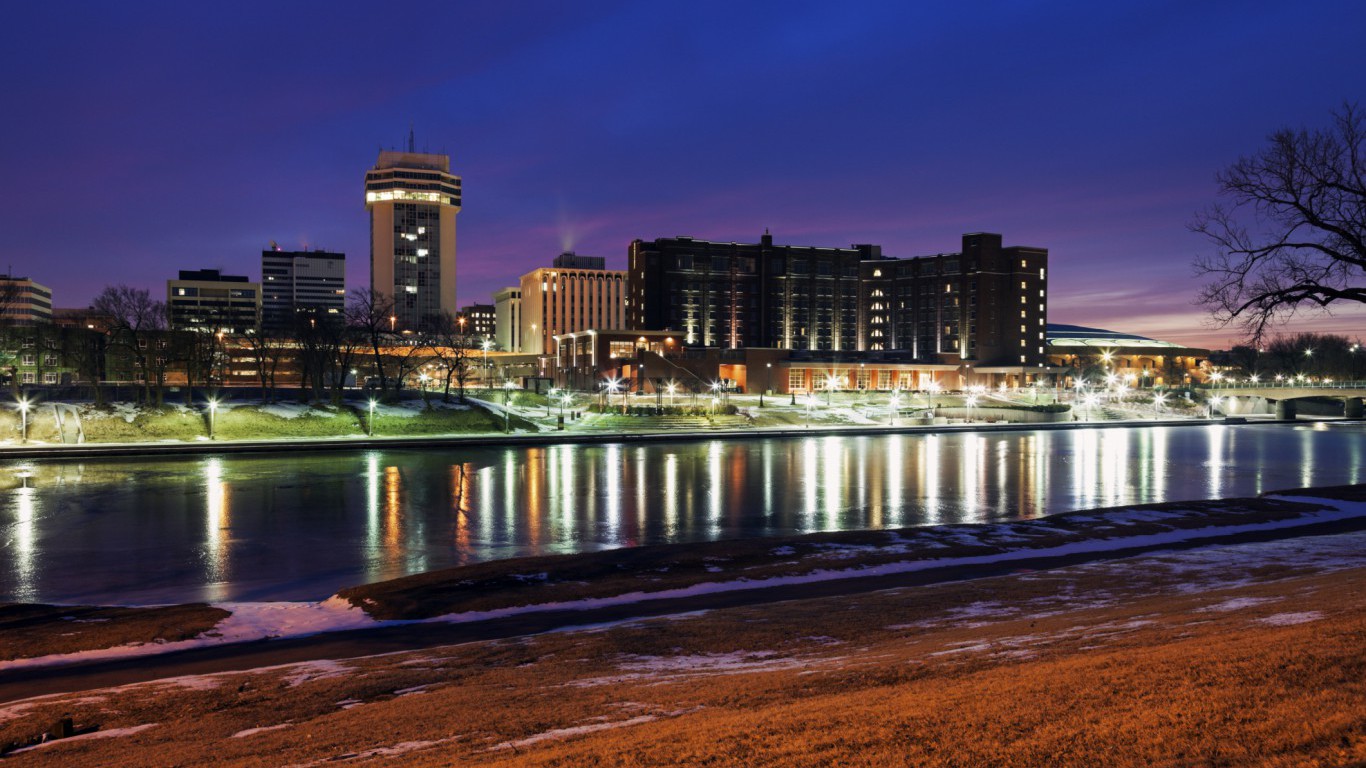
29. Kansas
> Homeless individuals w/o shelter: 16.1% (total: 357)
> Overall homelessness: 2,216 (8 in every 10,000 people — 7th lowest)
> Change in overall homelessness 2017-2018: -3.1%
> Change in overall homelessness 2008-2018: 27.5%
> Poverty rate: 11.9% (21st lowest)
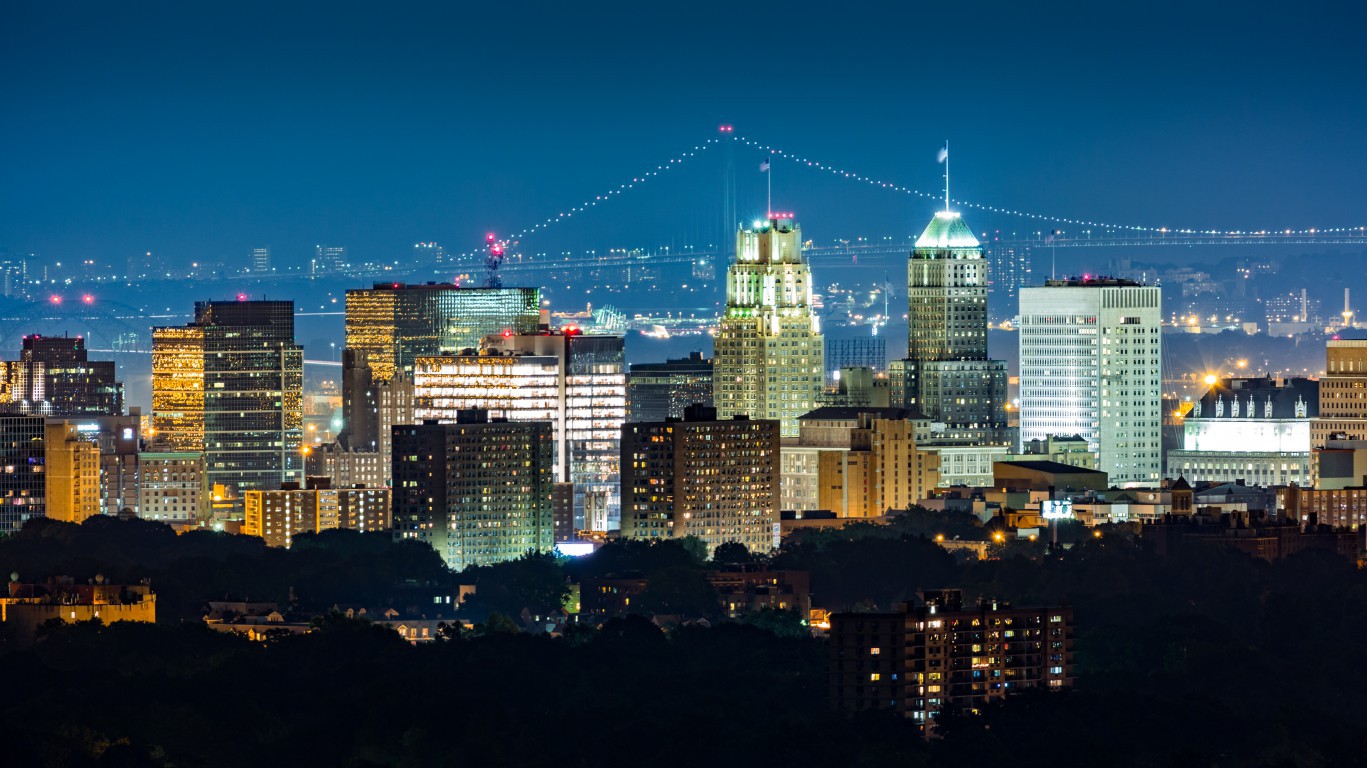
28. New Jersey
> Homeless individuals w/o shelter: 17.3% (total: 1,623)
> Overall homelessness: 9,398 (10 in every 10,000 people — 24th lowest)
> Change in overall homelessness 2017-2018: +10.1%
> Change in overall homelessness 2008-2018: -32.1%
> Poverty rate: 10.0% (7th lowest)

27. Illinois
> Homeless individuals w/o shelter: 18.2% (total: 1,942)
> Overall homelessness: 10,643 (8 in every 10,000 people — 11th lowest)
> Change in overall homelessness 2017-2018: -1.4%
> Change in overall homelessness 2008-2018: -27.7%
> Poverty rate: 12.6% (24th lowest)
[in-text-ad-2]
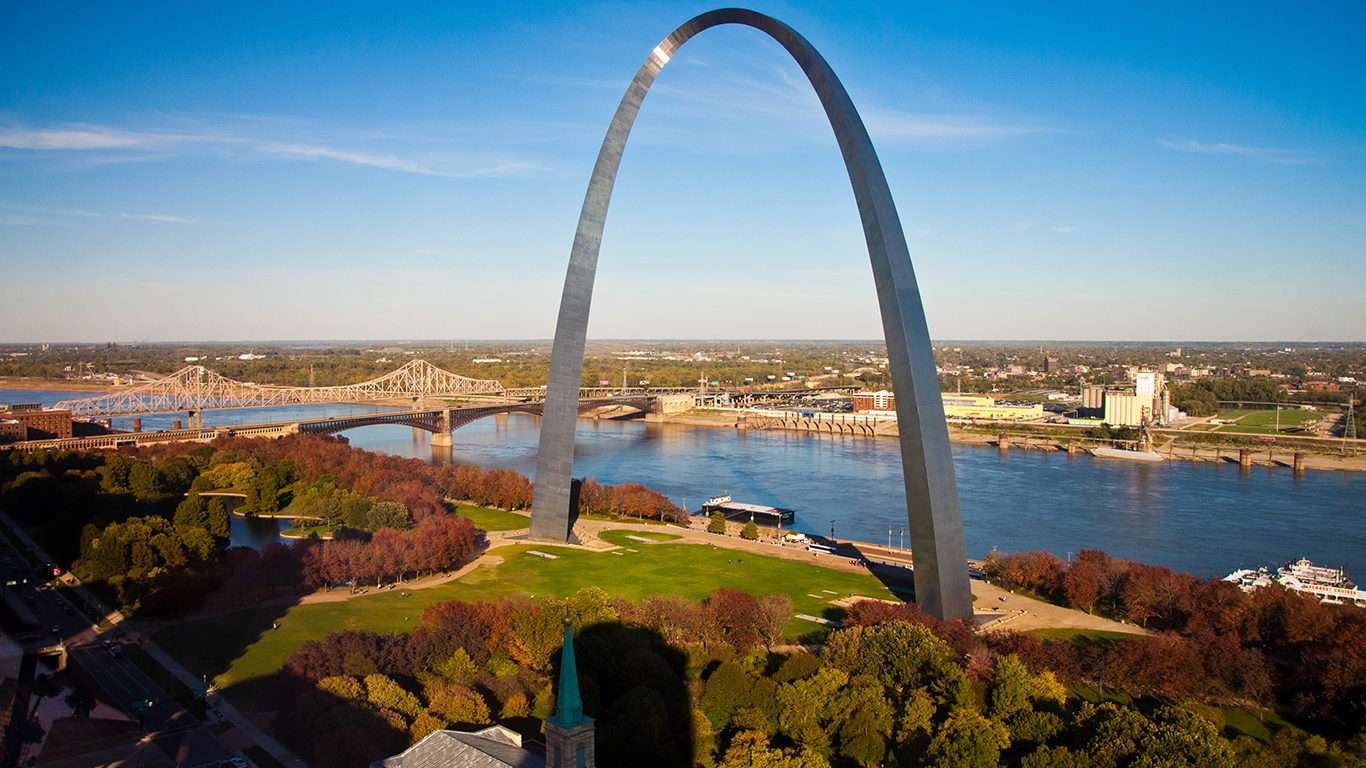
26. Missouri
> Homeless individuals w/o shelter: 20.6% (total: 1,214)
> Overall homelessness: 5,883 (10 in every 10,000 people — 21st lowest)
> Change in overall homelessness 2017-2018: -2.6%
> Change in overall homelessness 2008-2018: -23.5%
> Poverty rate: 13.4% (21st highest)
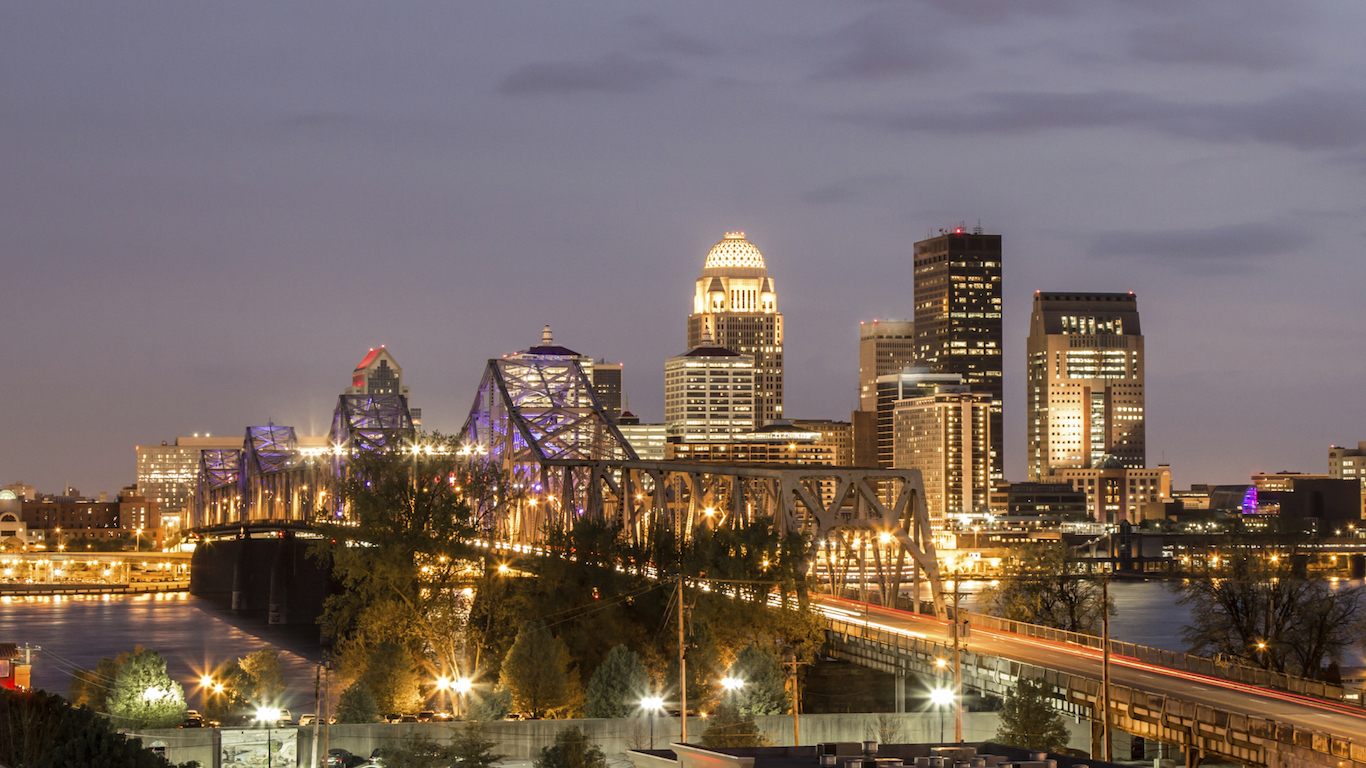
25. Kentucky
> Homeless individuals w/o shelter: 23.5% (total: 868)
> Overall homelessness: 3,688 (8 in every 10,000 people — 10th lowest)
> Change in overall homelessness 2017-2018: -8.4%
> Change in overall homelessness 2008-2018: -54.7%
> Poverty rate: 17.2% (5th highest)
[in-text-ad]
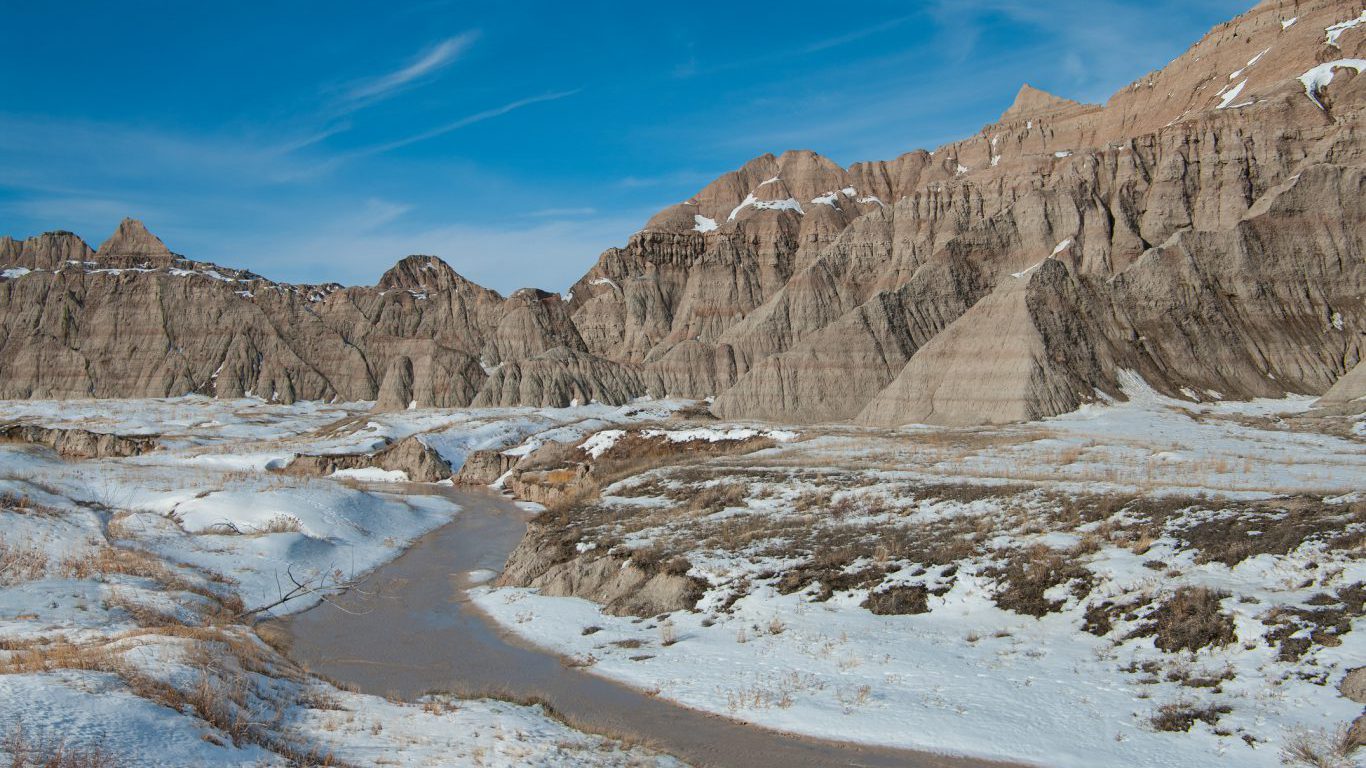
24. South Dakota
> Homeless individuals w/o shelter: 24.6% (total: 285)
> Overall homelessness: 1,159 (13 in every 10,000 people — 15th highest)
> Change in overall homelessness 2017-2018: +22.9%
> Change in overall homelessness 2008-2018: +100.2%
> Poverty rate: 13.0% (24th highest)
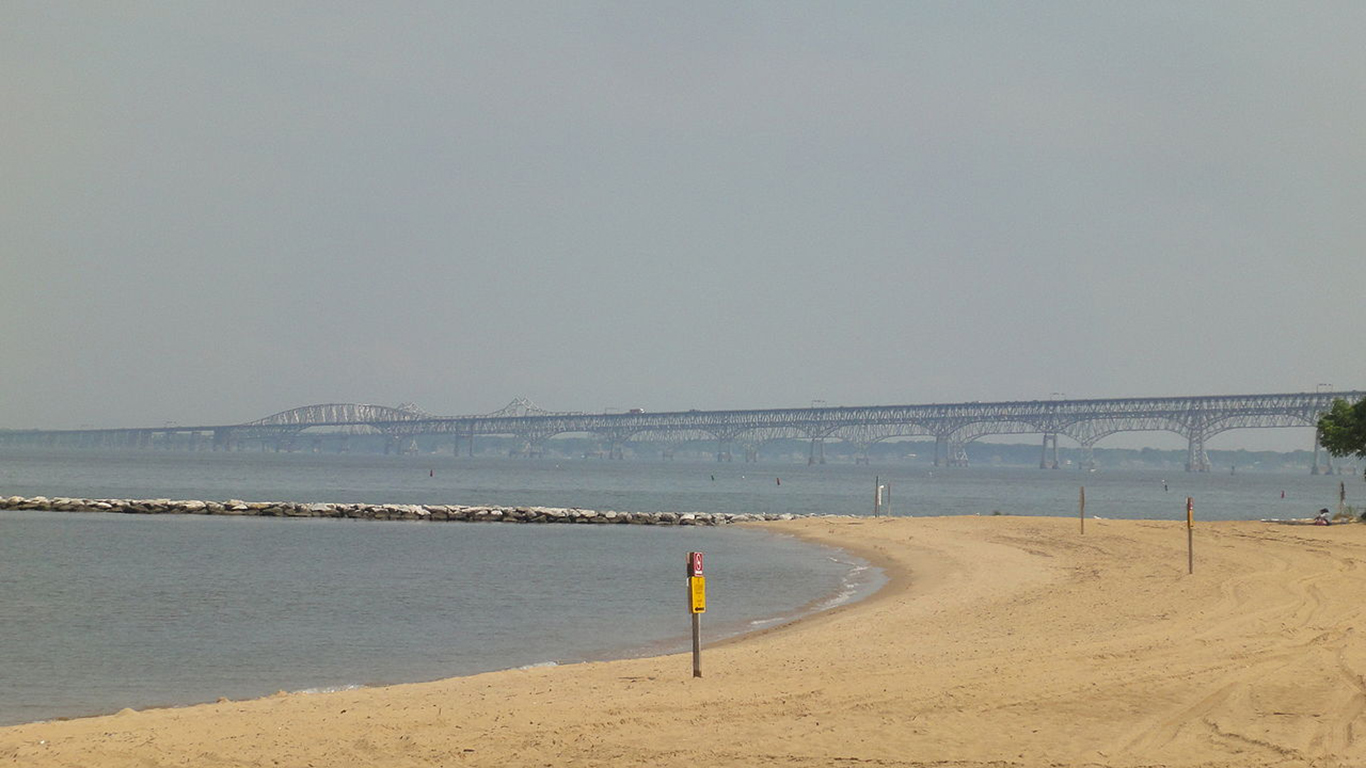
23. Maryland
> Homeless individuals w/o shelter: 24.7% (total: 1,764)
> Overall homelessness: 7,144 (12 in every 10,000 people — 19th highest)
> Change in overall homelessness 2017-2018: -1.4%
> Change in overall homelessness 2008-2018: -22.5%
> Poverty rate: 9.3% (2nd lowest)
22. North Carolina
> Homeless individuals w/o shelter: 26.4% (total: 2,450)
> Overall homelessness: 9,268 (9 in every 10,000 people — 17th lowest)
> Change in overall homelessness 2017-2018: +3.4%
> Change in overall homelessness 2008-2018: -25.3%
> Poverty rate: 14.7% (13th highest)
[in-text-ad-2]
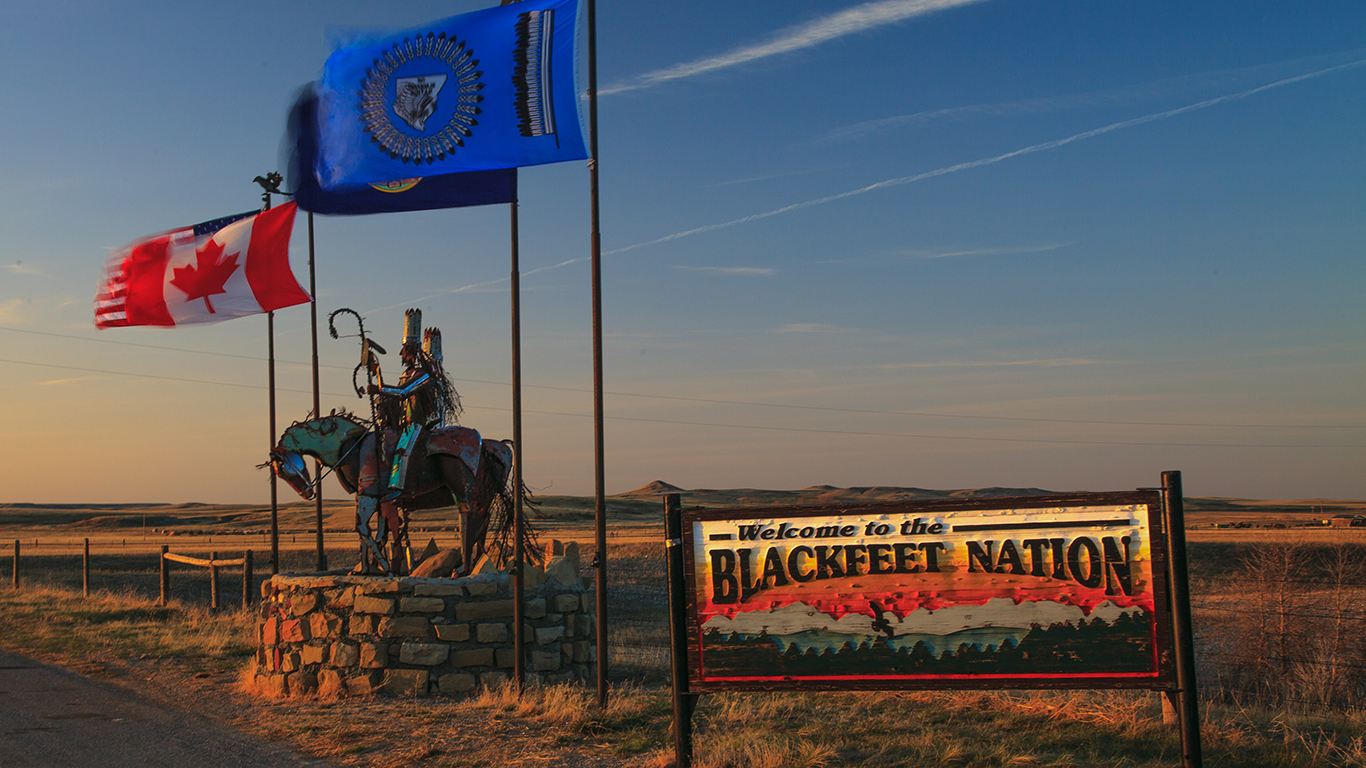
21. Montana
> Homeless individuals w/o shelter: 26.5% (total: 373)
> Overall homelessness: 1,405 (13 in every 10,000 people — 14th highest)
> Change in overall homelessness 2017-2018: -8.1%
> Change in overall homelessness 2008-2018: -0.8%
> Poverty rate: 12.5% (23rd lowest)
20. Alabama
> Homeless individuals w/o shelter: 29.4% (total: 1,010)
> Overall homelessness: 3,434 (7 in every 10,000 people — 4th lowest)
> Change in overall homelessness 2017-2018: -9.5%
> Change in overall homelessness 2008-2018: -36.3%
> Poverty rate: 16.9% (6th highest)
[in-text-ad]
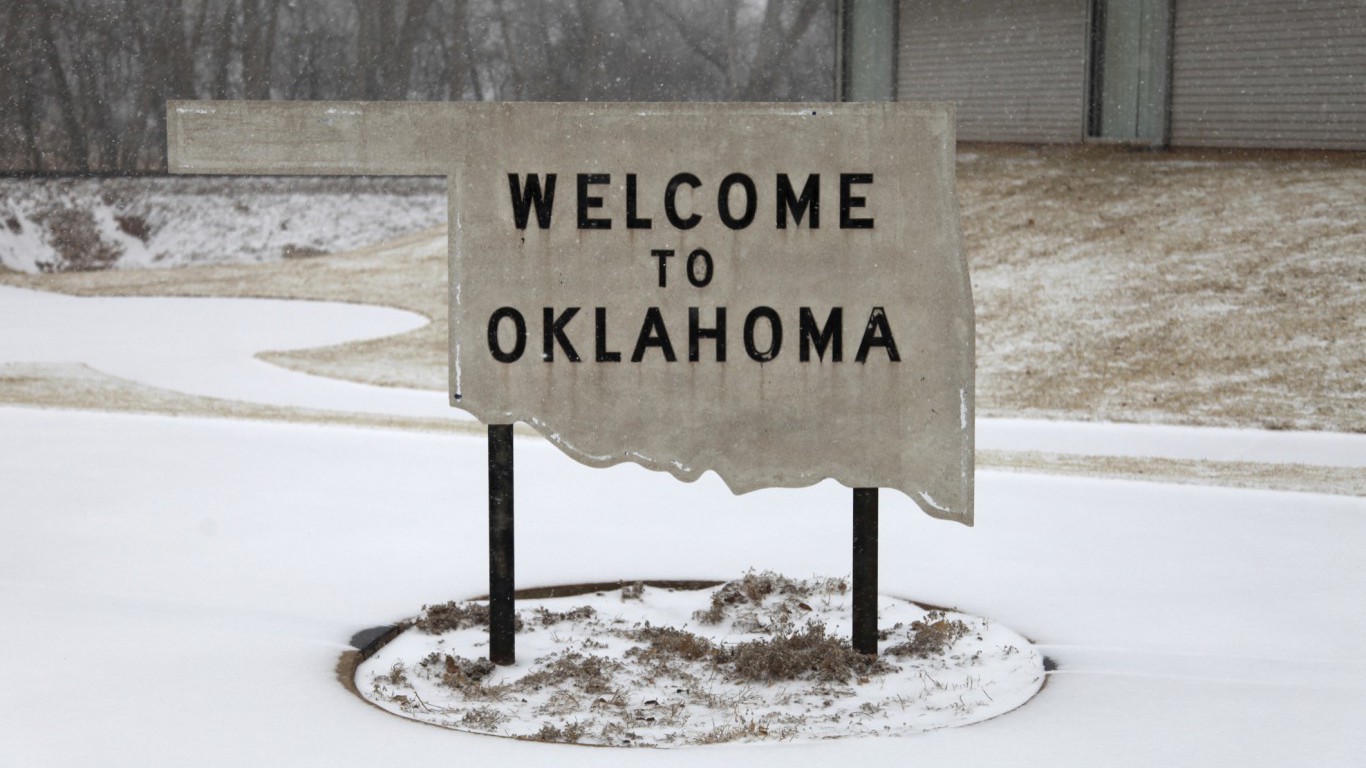
19. Oklahoma
> Homeless individuals w/o shelter: 30.8% (total: 1,191)
> Overall homelessness: 3,871 (10 in every 10,000 people — 22nd lowest)
> Change in overall homelessness 2017-2018: -7.8%
> Change in overall homelessness 2008-2018: +0.7%
> Poverty rate: 15.8% (8th highest)
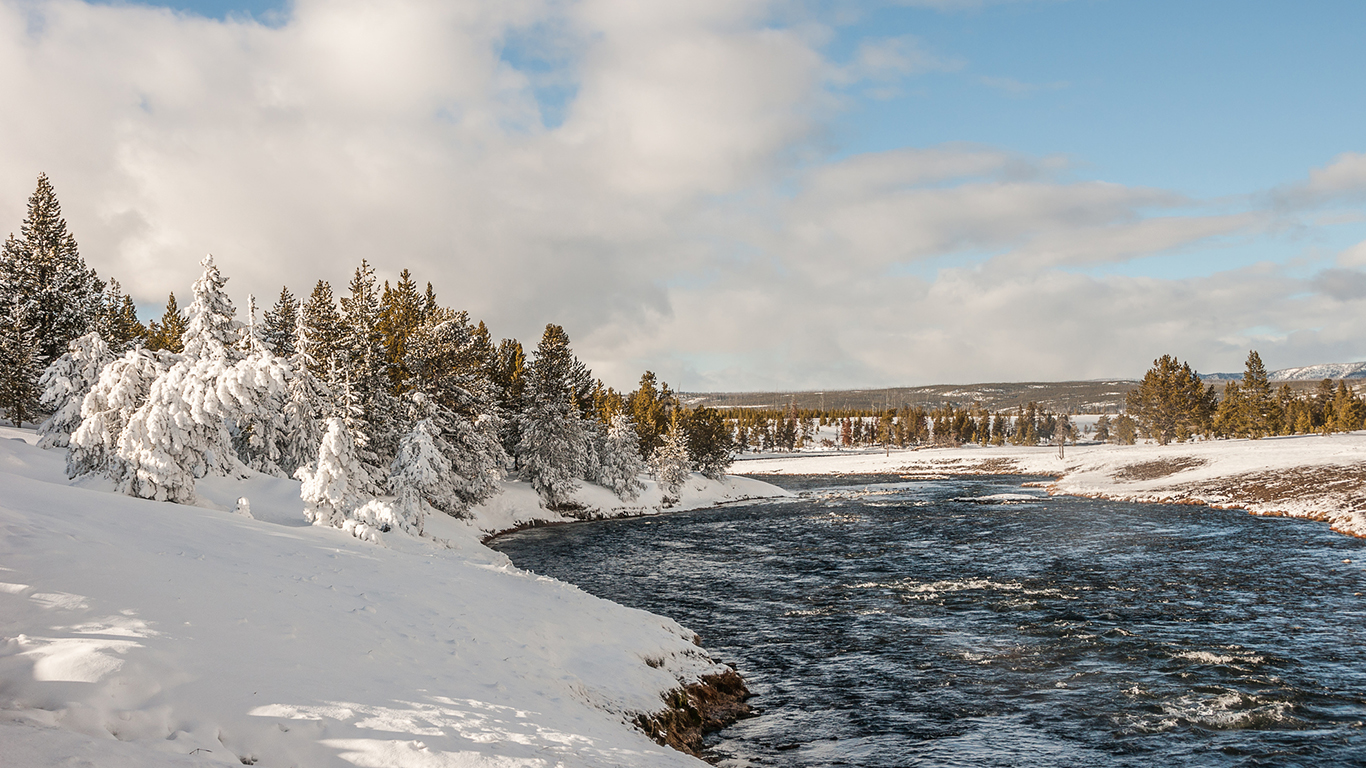
18. Wyoming
> Homeless individuals w/o shelter: 31.1% (total: 199)
> Overall homelessness: 639 (11 in every 10,000 people — 24th highest)
> Change in overall homelessness 2017-2018: -26.8%
> Change in overall homelessness 2008-2018: -14.9%
> Poverty rate: 11.3% (19th lowest)
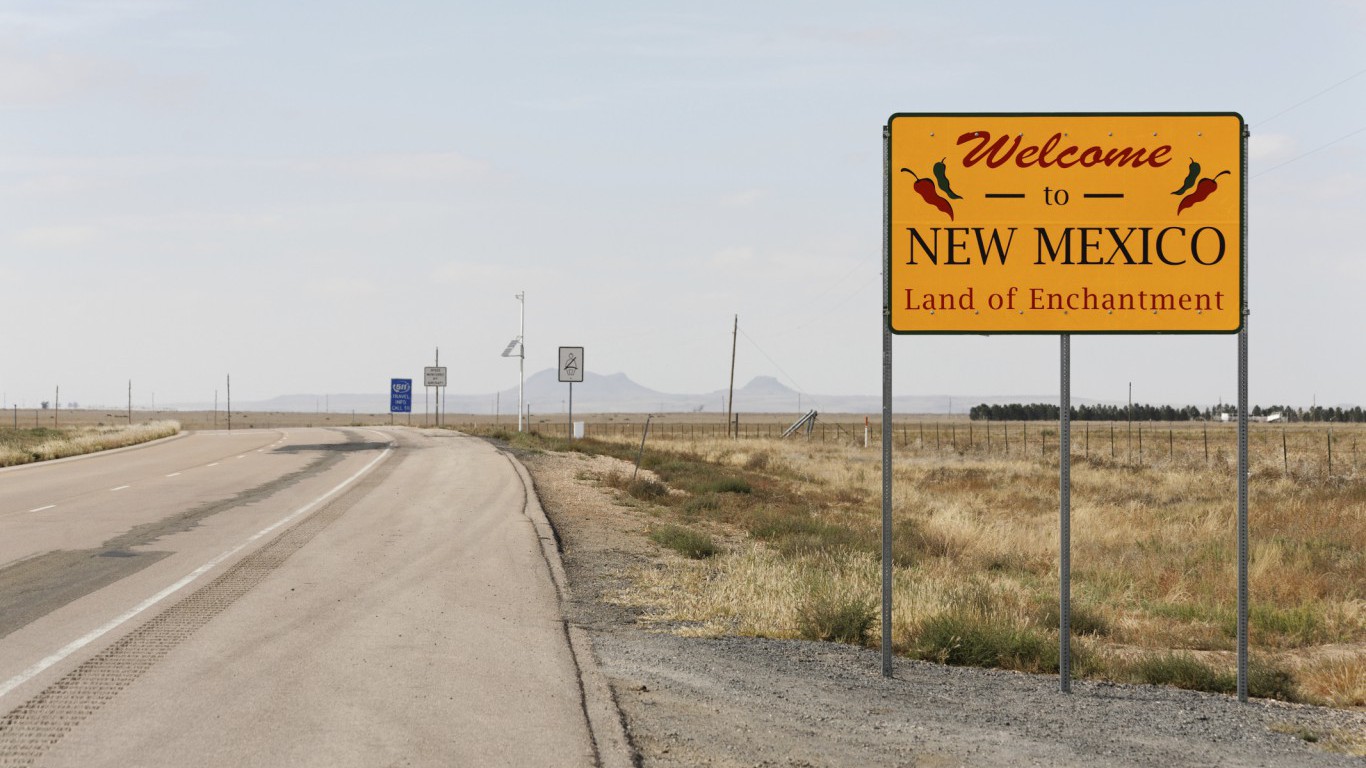
17. New Mexico
> Homeless individuals w/o shelter: 31.2% (total: 796)
> Overall homelessness: 2,551 (12 in every 10,000 people — 18th highest)
> Change in overall homelessness 2017-2018: +2.8%
> Change in overall homelessness 2008-2018: -15.4%
> Poverty rate: 19.7% (2nd highest)
[in-text-ad-2]
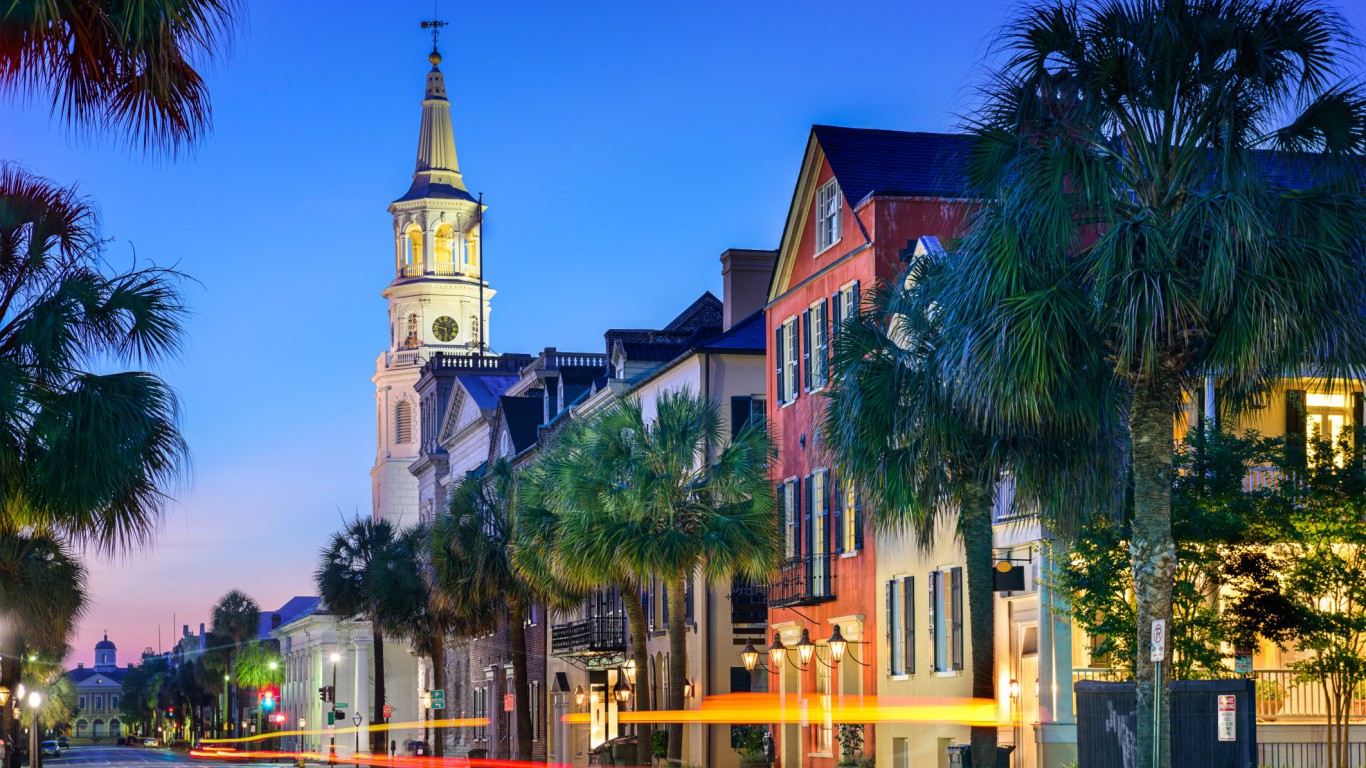
16. South Carolina
> Homeless individuals w/o shelter: 34.2% (total: 1,344)
> Overall homelessness: 3,933 (8 in every 10,000 people — 8th lowest)
> Change in overall homelessness 2017-2018: +0.4%
> Change in overall homelessness 2008-2018: -30.5%
> Poverty rate: 15.4% (9th highest)
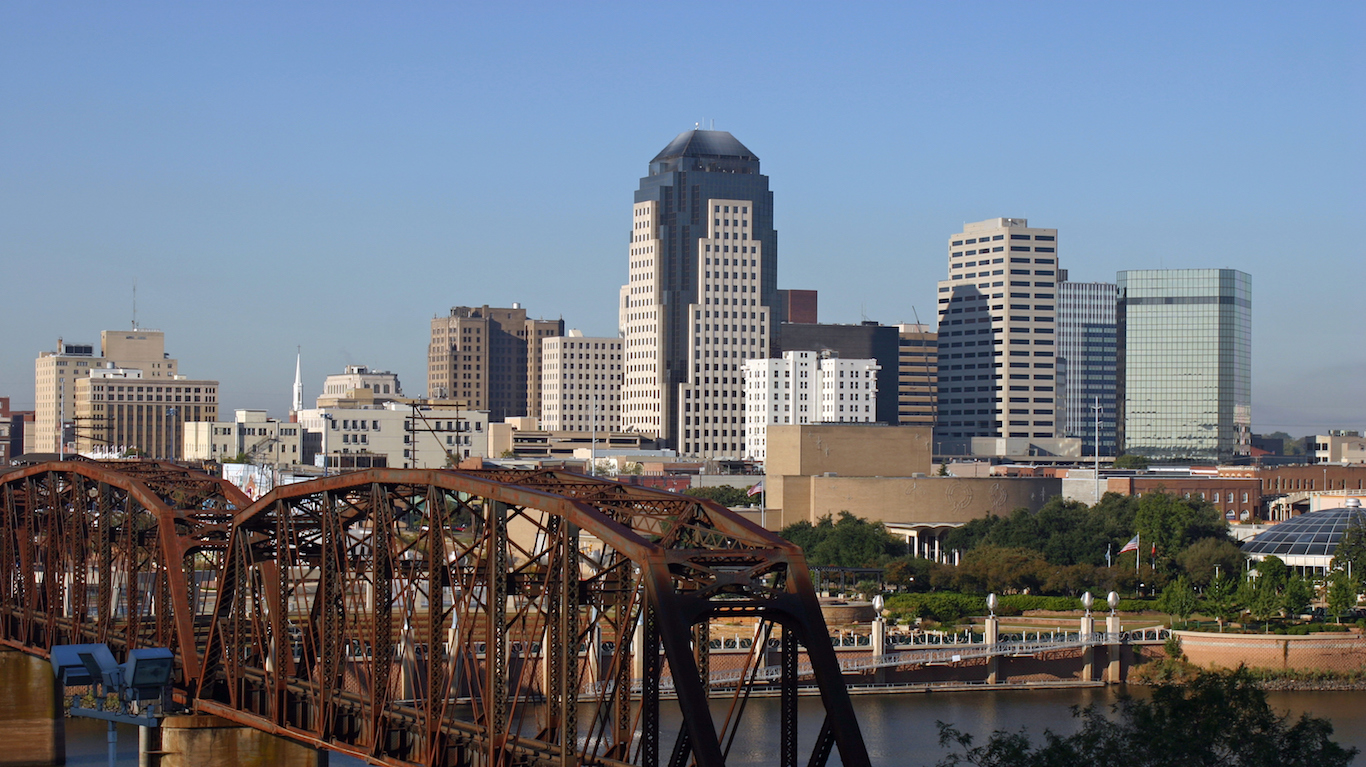
15. Louisiana
> Homeless individuals w/o shelter: 34.8% (total: 1,065)
> Overall homelessness: 3,059 (7 in every 10,000 people — 2nd lowest)
> Change in overall homelessness 2017-2018: -7.4%
> Change in overall homelessness 2008-2018: -44.2%
> Poverty rate: 19.7% (2nd highest)
[in-text-ad]

14. Idaho
> Homeless individuals w/o shelter: 35.9% (total: 723)
> Overall homelessness: 2,012 (12 in every 10,000 people — 21st highest)
> Change in overall homelessness 2017-2018: -1.2%
> Change in overall homelessness 2008-2018: +37.4%
> Poverty rate: 12.8% (25th lowest)
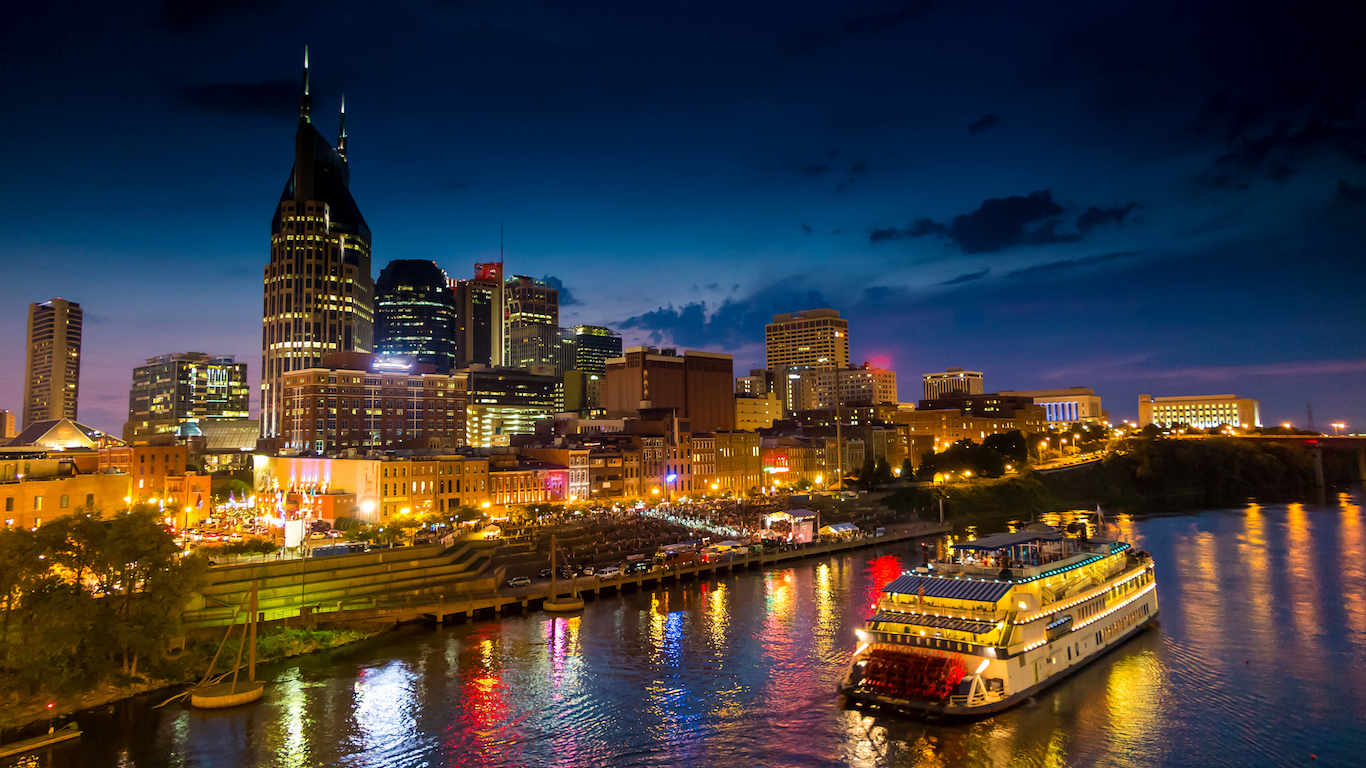
13. Tennessee
> Homeless individuals w/o shelter: 36.2% (total: 2,855)
> Overall homelessness: 7,883 (12 in every 10,000 people — 20th highest)
> Change in overall homelessness 2017-2018: -5.1%
> Change in overall homelessness 2008-2018: -18.8%
> Poverty rate: 15.0% (10th highest)

12. Georgia
> Homeless individuals w/o shelter: 37.9% (total: 3,599)
> Overall homelessness: 9,499 (9 in every 10,000 people — 19th lowest)
> Change in overall homelessness 2017-2018: -6.6%
> Change in overall homelessness 2008-2018: -50.3%
> Poverty rate: 14.9% (11th highest)
[in-text-ad-2]
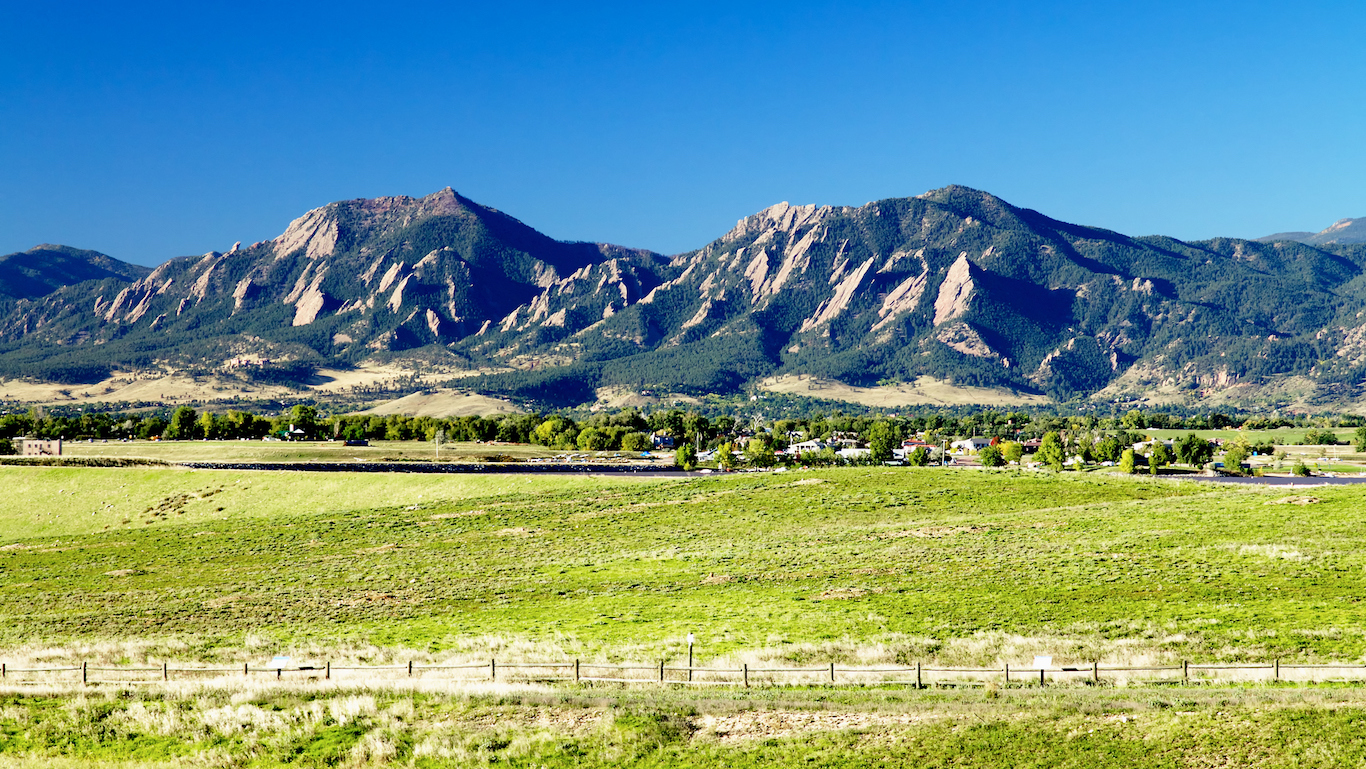
11. Colorado
> Homeless individuals w/o shelter: 39.9% (total: 4,329)
> Overall homelessness: 10,857 (19 in every 10,000 people — 10th highest)
> Change in overall homelessness 2017-2018: -0.8%
> Change in overall homelessness 2008-2018: -26.4%
> Poverty rate: 10.3% (9th lowest)
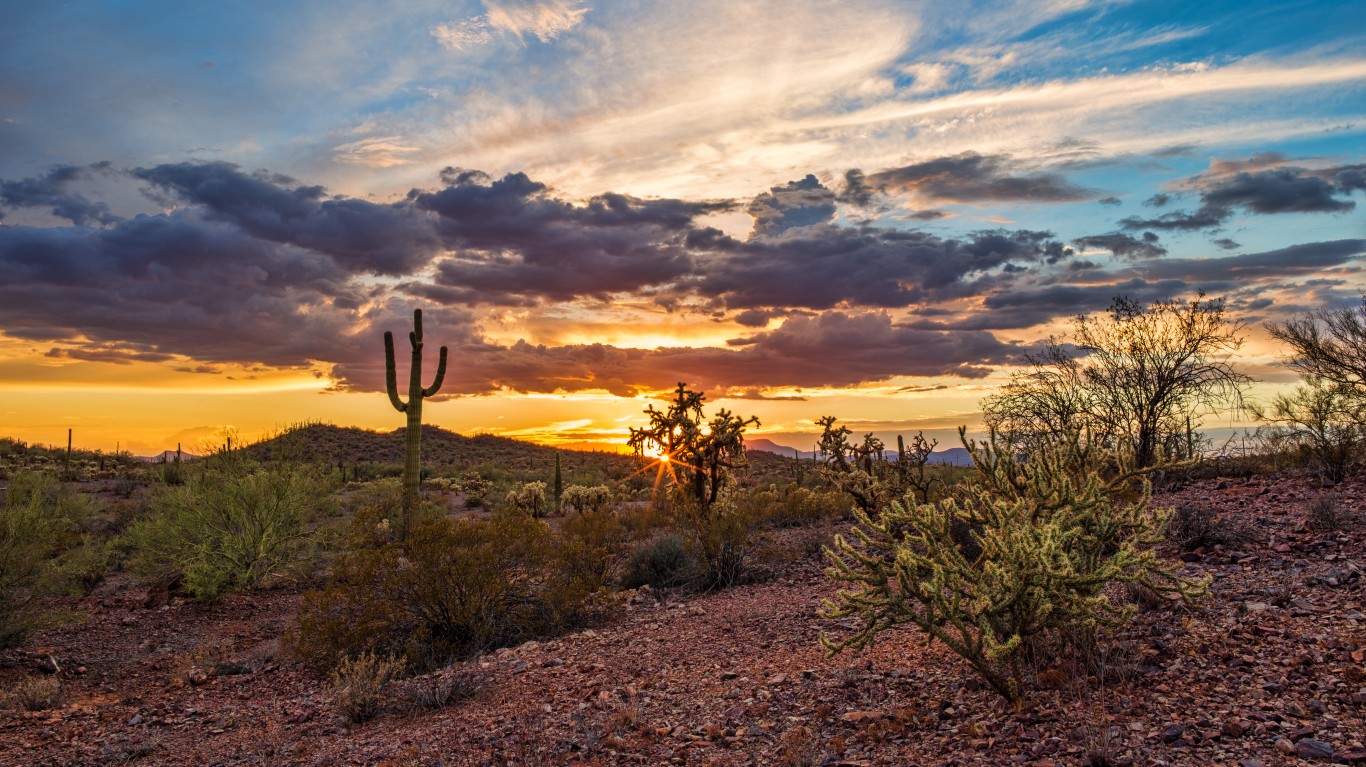
10. Arizona
> Homeless individuals w/o shelter: 41.2% (total: 4,066)
> Overall homelessness: 9,865 (14 in every 10,000 people — 13th highest)
> Change in overall homelessness 2017-2018: +10.3%
> Change in overall homelessness 2008-2018: -21.0%
> Poverty rate: 14.9% (11th highest)
[in-text-ad]
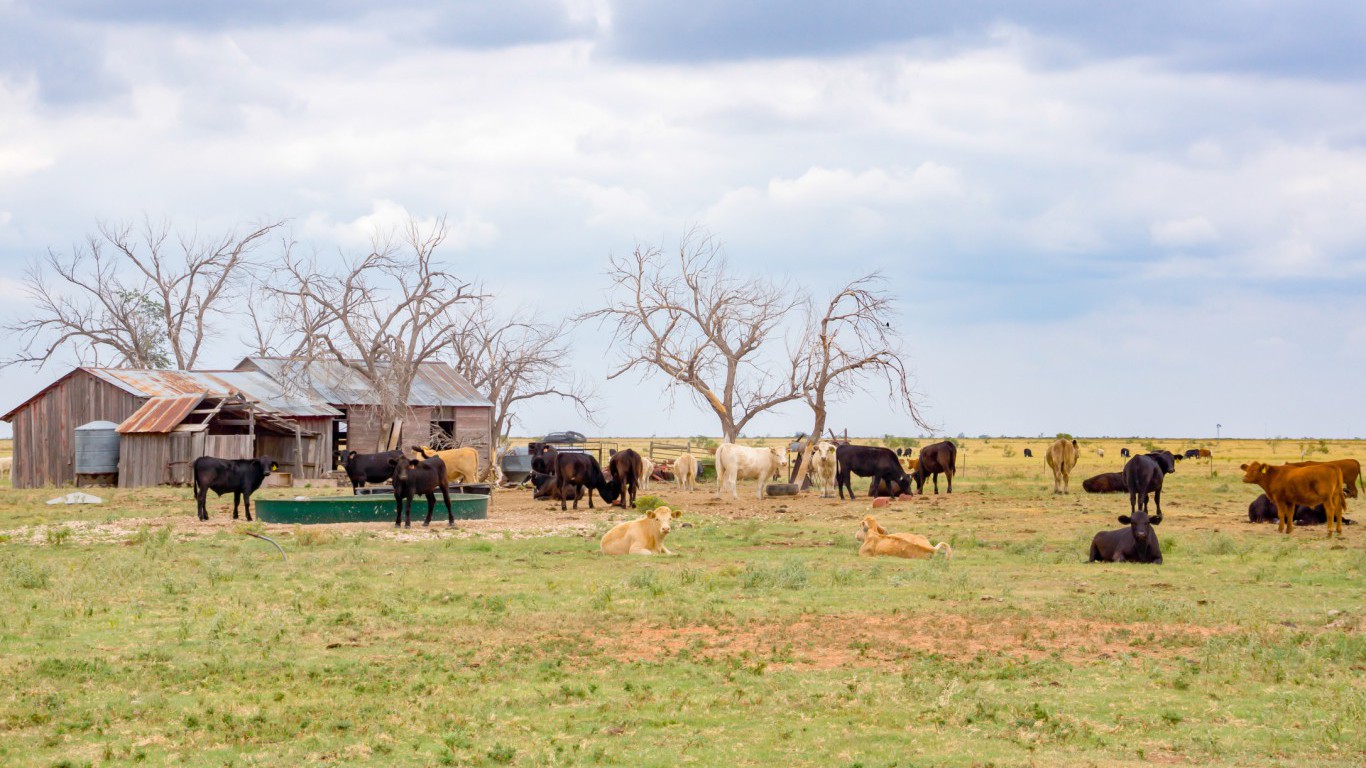
9. Texas
> Homeless individuals w/o shelter: 41.6% (total: 10,534)
> Overall homelessness: 25,310 (9 in every 10,000 people — 16th lowest)
> Change in overall homelessness 2017-2018: +7.5%
> Change in overall homelessness 2008-2018: -37.0%
> Poverty rate: 14.7% (13th highest)
8. Florida
> Homeless individuals w/o shelter: 43.2% (total: 13,393)
> Overall homelessness: 31,030 (15 in every 10,000 people — 12th highest)
> Change in overall homelessness 2017-2018: -3.6%
> Change in overall homelessness 2008-2018: -38.1%
> Poverty rate: 14.0% (17th highest)
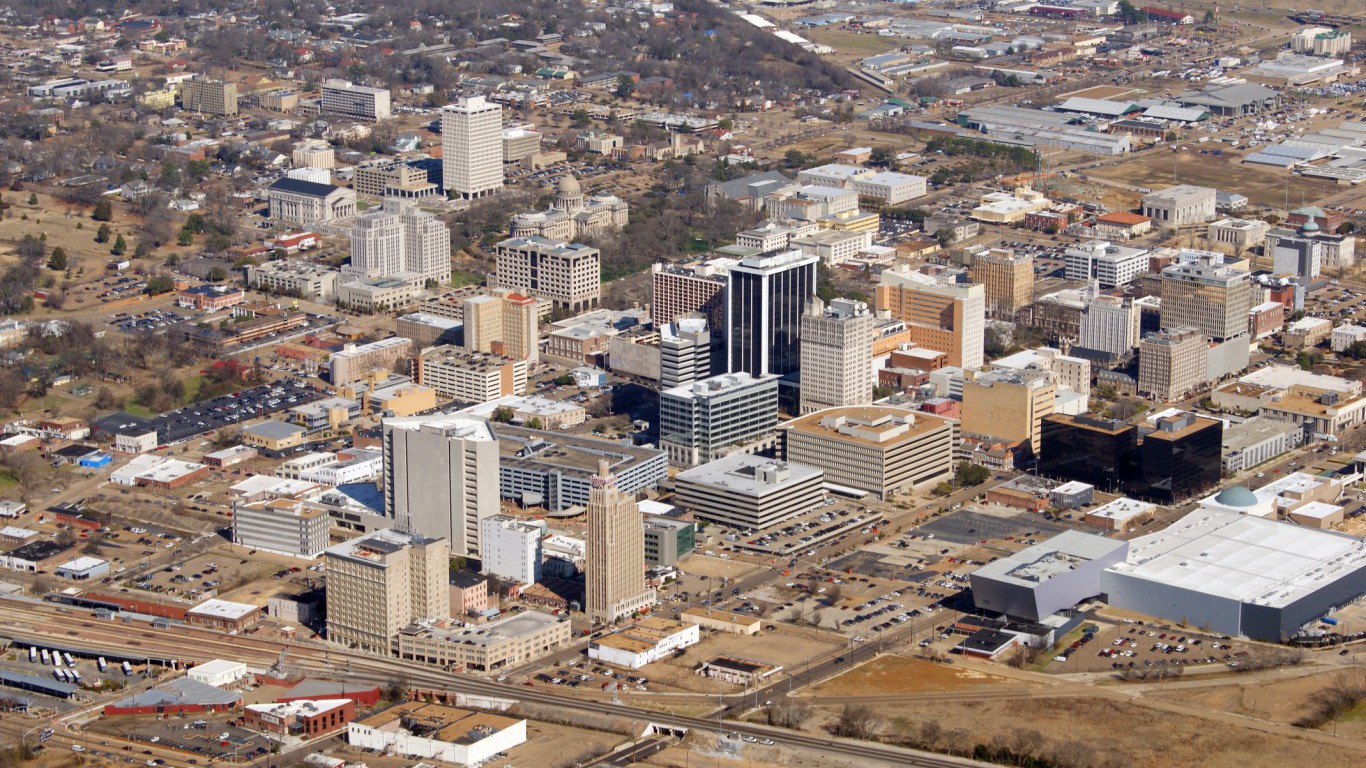
7. Mississippi
> Homeless individuals w/o shelter: 45.9% (total: 621)
> Overall homelessness: 1,352 (5 in every 10,000 people — the lowest)
> Change in overall homelessness 2017-2018: -8.2%
> Change in overall homelessness 2008-2018: -31.1%
> Poverty rate: 19.8% (the highest)
[in-text-ad-2]
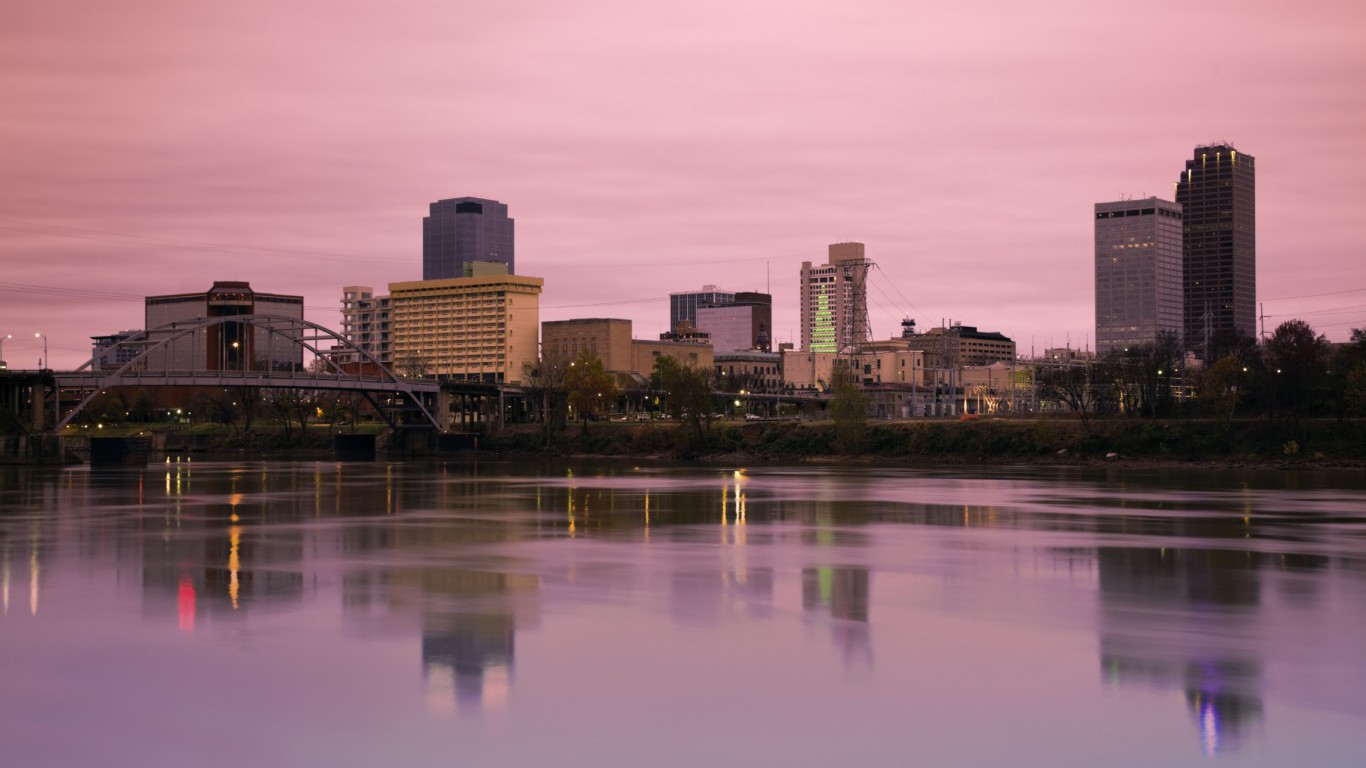
6. Arkansas
> Homeless individuals w/o shelter: 46.3% (total: 1,257)
> Overall homelessness: 2,712 (9 in every 10,000 people — 18th lowest)
> Change in overall homelessness 2017-2018: +9.9%
> Change in overall homelessness 2008-2018: -16.7%
> Poverty rate: 16.4% (7th highest)
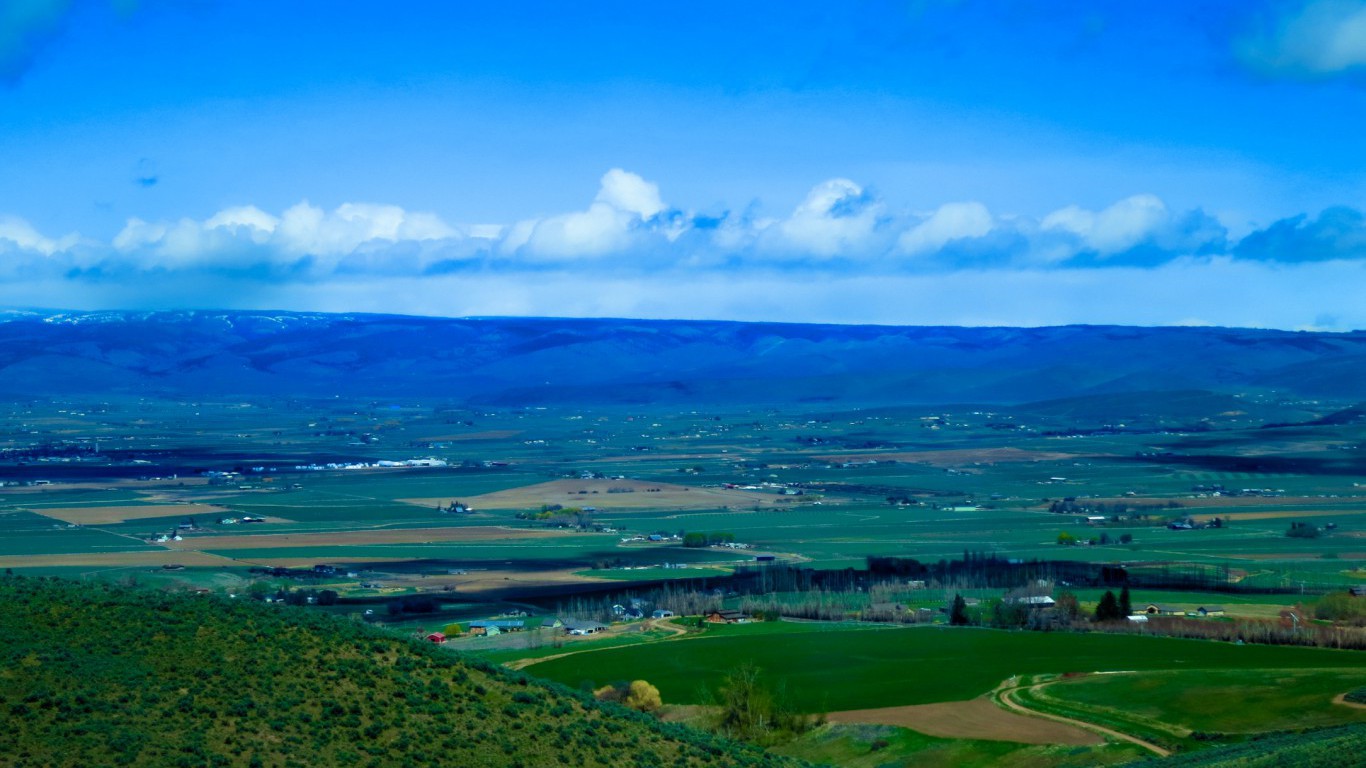
5. Washington
> Homeless individuals w/o shelter: 47.6% (total: 10,621)
> Overall homelessness: 22,304 (30 in every 10,000 people — 5th highest)
> Change in overall homelessness 2017-2018: +5.6%
> Change in overall homelessness 2008-2018: +1.6%
> Poverty rate: 11.0% (14th lowest)
[in-text-ad]
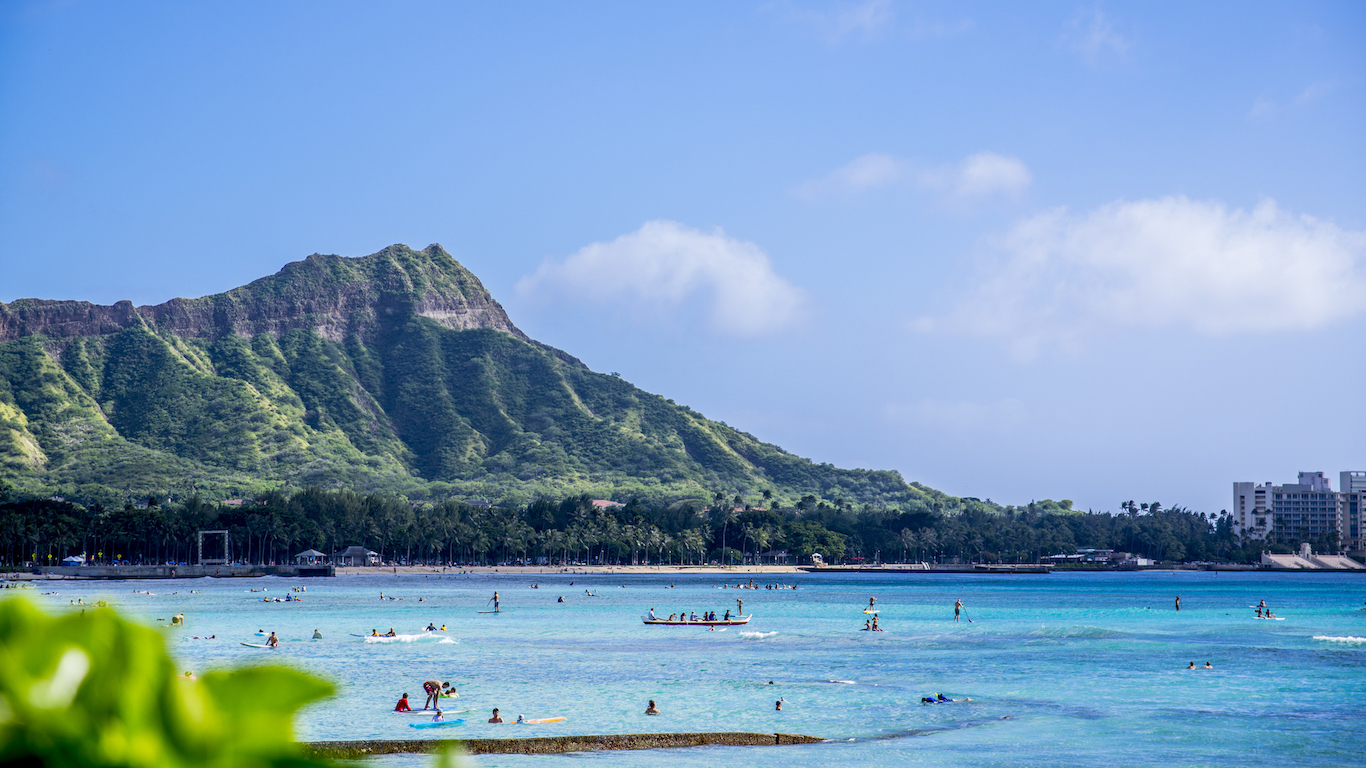
4. Hawaii
> Homeless individuals w/o shelter: 53.2% (total: 3,475)
> Overall homelessness: 6,530 (46 in every 10,000 people — 2nd highest)
> Change in overall homelessness 2017-2018: -9.6%
> Change in overall homelessness 2008-2018: +7.7%
> Poverty rate: 9.5% (4th lowest)
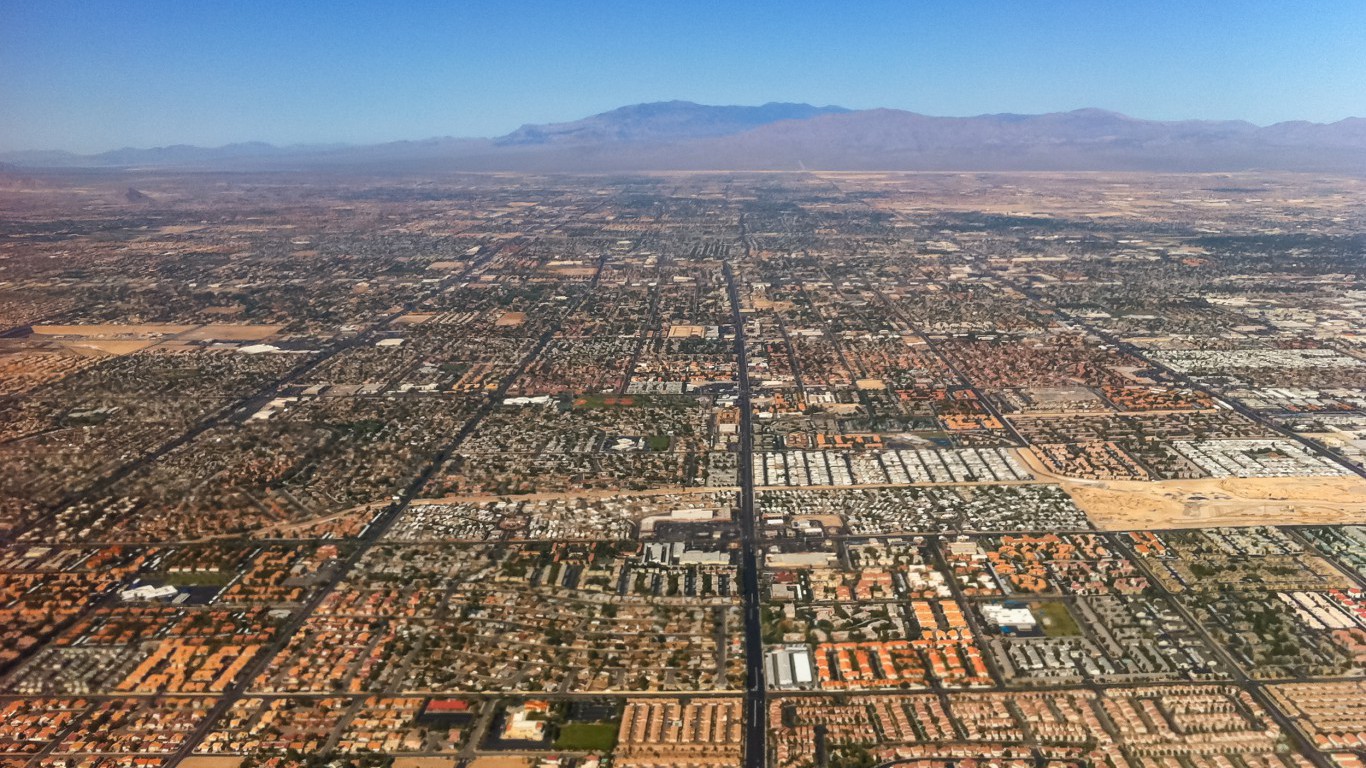
3. Nevada
> Homeless individuals w/o shelter: 56.2% (total: 4,239)
> Overall homelessness: 7,544 (25 in every 10,000 people — 8th highest)
> Change in overall homelessness 2017-2018: -3.7%
> Change in overall homelessness 2008-2018: -13.5%
> Poverty rate: 13.0% (24th highest)
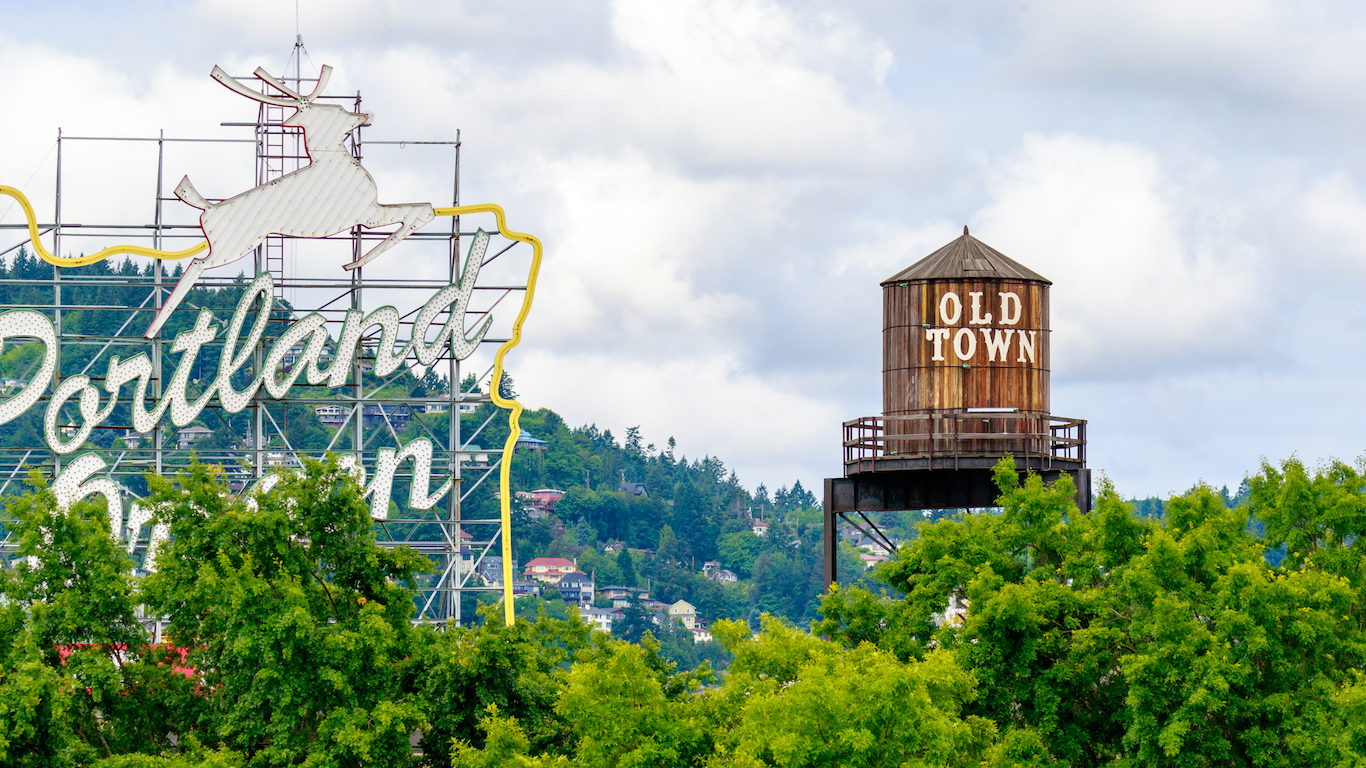
2. Oregon
> Homeless individuals w/o shelter: 61.7% (total: 8,925)
> Overall homelessness: 14,476 (35 in every 10,000 people — 3rd highest)
> Change in overall homelessness 2017-2018: +3.7%
> Change in overall homelessness 2008-2018: -29.9%
> Poverty rate: 13.2% (23rd highest)
[in-text-ad-2]
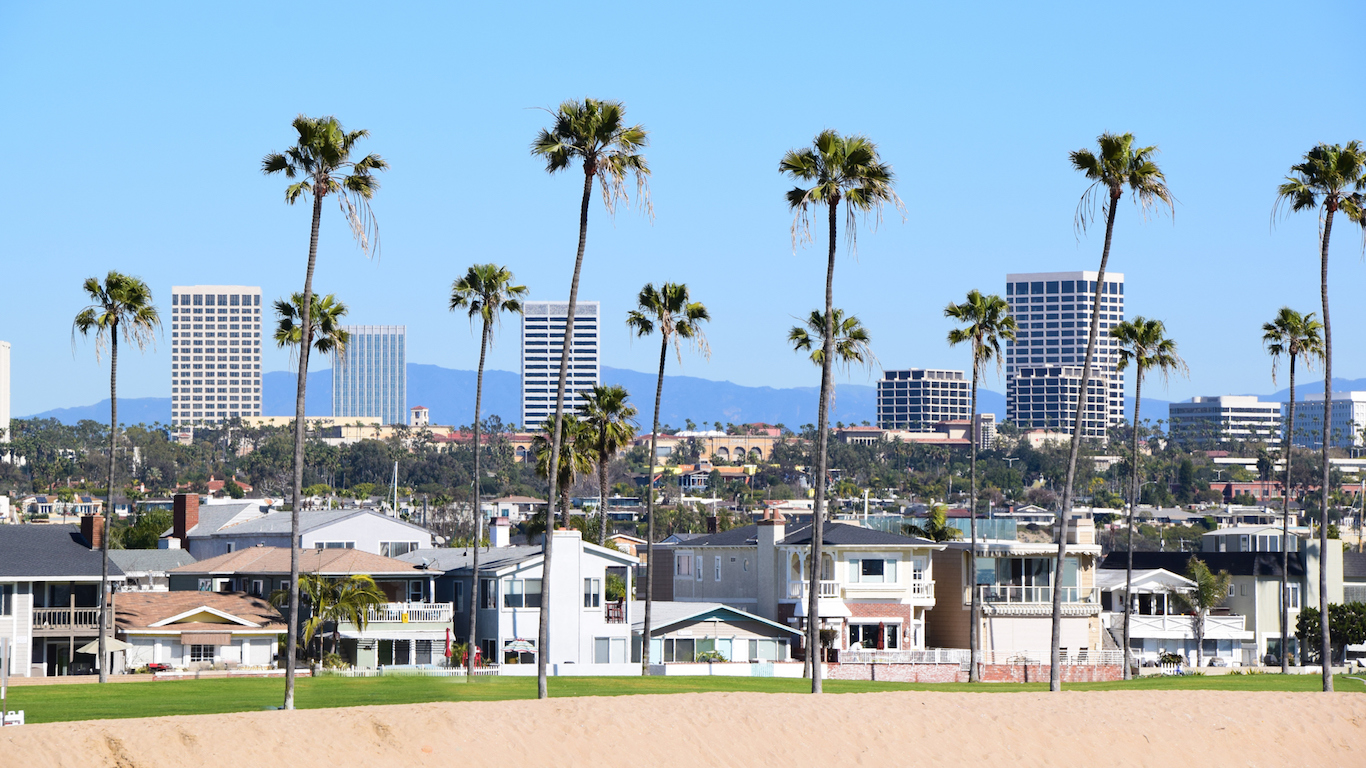
1. California
> Homeless individuals w/o shelter: 68.9% (total: 89,543)
> Overall homelessness: 129,972 (33 in every 10,000 people — 4th highest)
> Change in overall homelessness 2017-2018: -1.2%
> Change in overall homelessness 2008-2018: -4.8%
> Poverty rate: 13.3% (22nd highest)
Detailed Findings
While the overall level of homelessness was flat across the country, in some states there have been some notable improvements, and in other states the problem has gotten worse.
For instance, the number of veterans experiencing homelessness dropped 5% between 2017 and 2018, and by a remarkable 48% since 2009.
Over the one-year period, overall homelessness declined in 31 states and rose in 19 states. Over the period between 2008 and 2018, homelessness dropped in 39 states and increased in 11 states.
Presenting the report, Housing and Urban Development (HUD) Secretary Ben Carson said, “This year’s small increase was in part driven by a significant increase of nearly 3,800 people living in emergency shelters set up after the 2017 hurricanes Harvey, Irma, and Maria and in other areas impacted by disasters.”
“Increases in recent years [also] appear to be at least partially explained by more effective practices in documenting chronic patterns of homelessness by local communities,” he said.
The HUD recognized the problem of affordable housing. “Housing is too expensive overall. When housing costs outstrip incomes more people fall into homelessness and there are fewer avenues out.”
Methodology
To identify the states with the most unsheltered homeless people, 24/7 Wall St. reviewed the percentage of each state’s homeless population that is unsheltered from The Department of Housing and Urban Development (HUD)’s report, “The 2018 Annual Homeless Assessment Report (AHAR) to Congress Part 1: Point-in-Time Estimates of Homelessness.”
In Part 1, HUD provides a snapshot of homelessness on a single night. The one-night counts are conducted in late January of each year. This is the most recent available data. Shelters include emergency shelters, transitional housing programs, safe havens, rapid re-housing programs, permanent supportive housing programs, and other permanent housing programs. The percentage of homeless people in families, in families with children, and the level of chronic homelessness — individuals who have been homeless for one year or more — also came from the HUD.
We also reviewed for each state the median annual household income, poverty rates, median home values, and the share of households receiving SNAP benefits (food stamps) data from the U.S. Census Bureau’s 2017 American Community Survey. Cost of living in each state was obtained from the U.S. Bureau of Economic Analysis.
Credit card companies are at war. The biggest issuers are handing out free rewards and benefits to win the best customers.
It’s possible to find cards paying unlimited 1.5%, 2%, and even more today. That’s free money for qualified borrowers, and the type of thing that would be crazy to pass up. Those rewards can add up to thousands of dollars every year in free money, and include other benefits as well.
We’ve assembled some of the best credit cards for users today. Don’t miss these offers because they won’t be this good forever.
Flywheel Publishing has partnered with CardRatings for our coverage of credit card products. Flywheel Publishing and CardRatings may receive a commission from card issuers.
Thank you for reading! Have some feedback for us?
Contact the 24/7 Wall St. editorial team.