Special Report
Most Important Agricultural Product From Each State
Published:
Last Updated:

The U.S. agricultural sector contributed less than 1% to the national GDP in the second quarter of 2018, the smallest share in recorded history. While the economic impact of the sector on a national scale is the smallest ever, it remains a major sector in some parts of the country, accounting for more than 5% of GDP and 10% of total employment.
U.S. agricultural production is largely concentrated in the Great Plains, which is characterized by expanses of flat, arable land. In many Great Plains states, the most important agricultural products — the crop or livestock with the largest total production values — are cattle, corn, and soybeans. Relative to their size of their economy, these states have the largest agriculture sectors in the country, with farm output per worker more than 10 times greater than in Northeastern states with smaller farm economies.
24/7 Wall St. reviewed the total production value of approximately 170 agricultural commodities in 2017 using data from the United States Department of Agriculture’s National Agricultural Statistics Service. We considered livestock and plants and excluded non-food agricultural products, such as cotton, tobacco, and hay.
Click here to see the most important agricultural product from each state.
Click here to see our detailed findings and methodology.
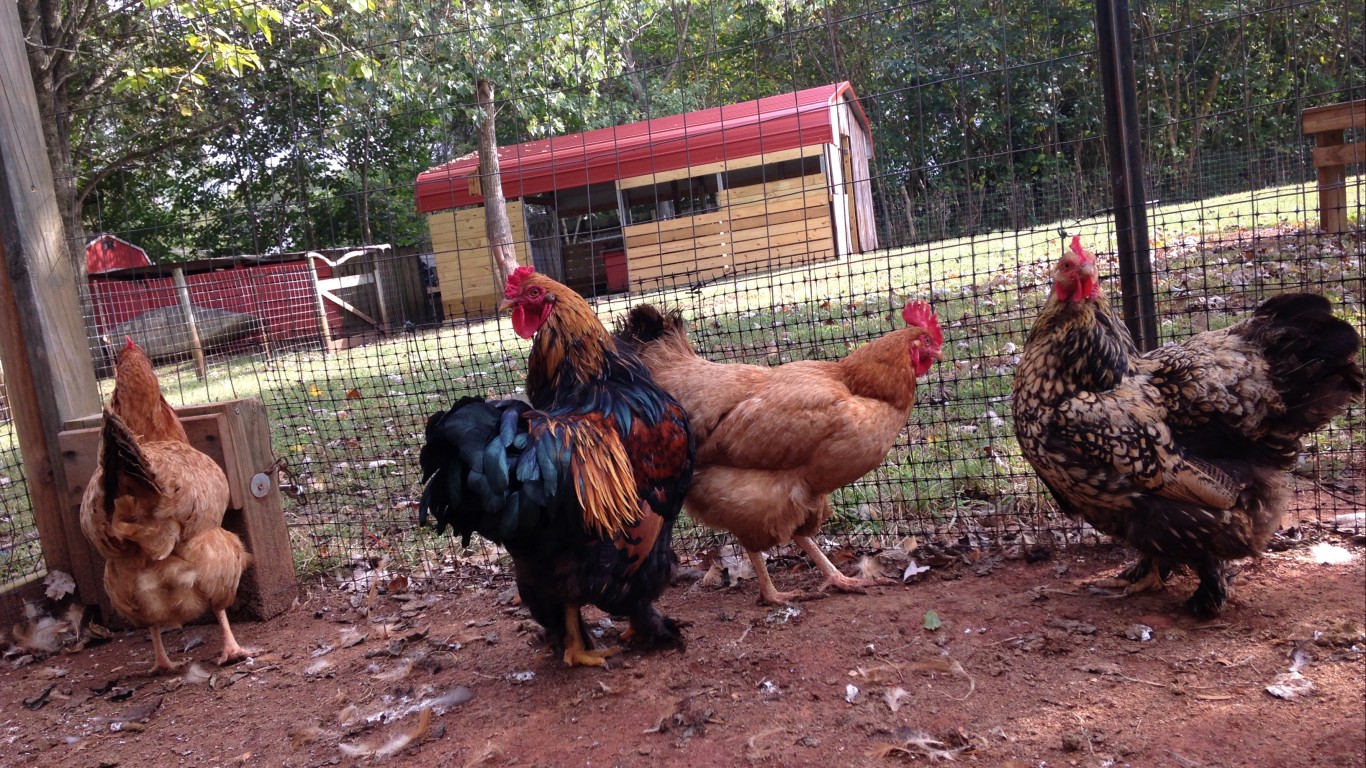
1. Alabama: Chickens
> Value of most important product: $3.3 billion
> Total crop production: $5.6 billion (25th largest)
> Pct. of workforce in agriculture: 3.0% (25th largest)
> Other major crops: Cattle, corn, and peanuts
[in-text-ad]
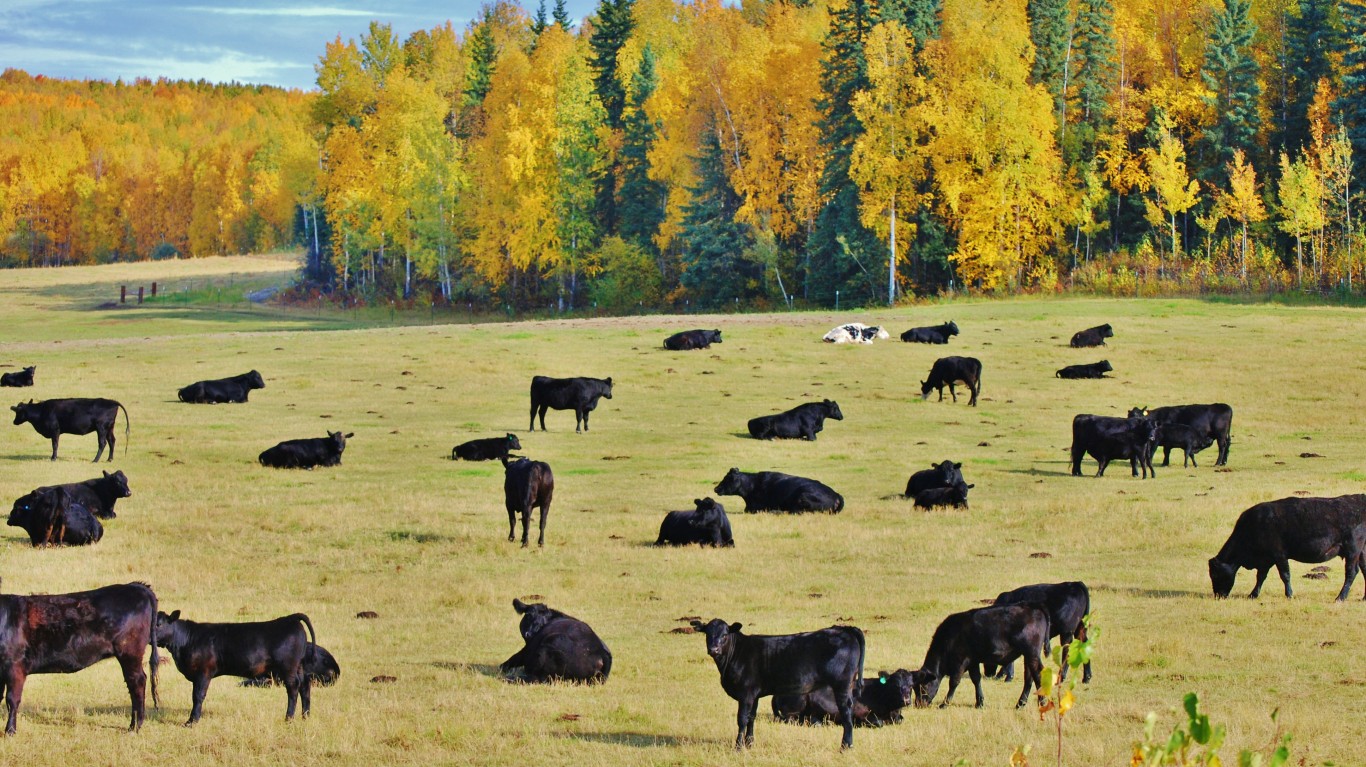
2. Alaska: Cattle
> Value of most important product: $4.2 million
> Total crop production: $58.9 million (2nd smallest)
> Pct. of workforce in agriculture: 0.9% (the smallest)
> Other major crops: Potatoes, barley, and oats
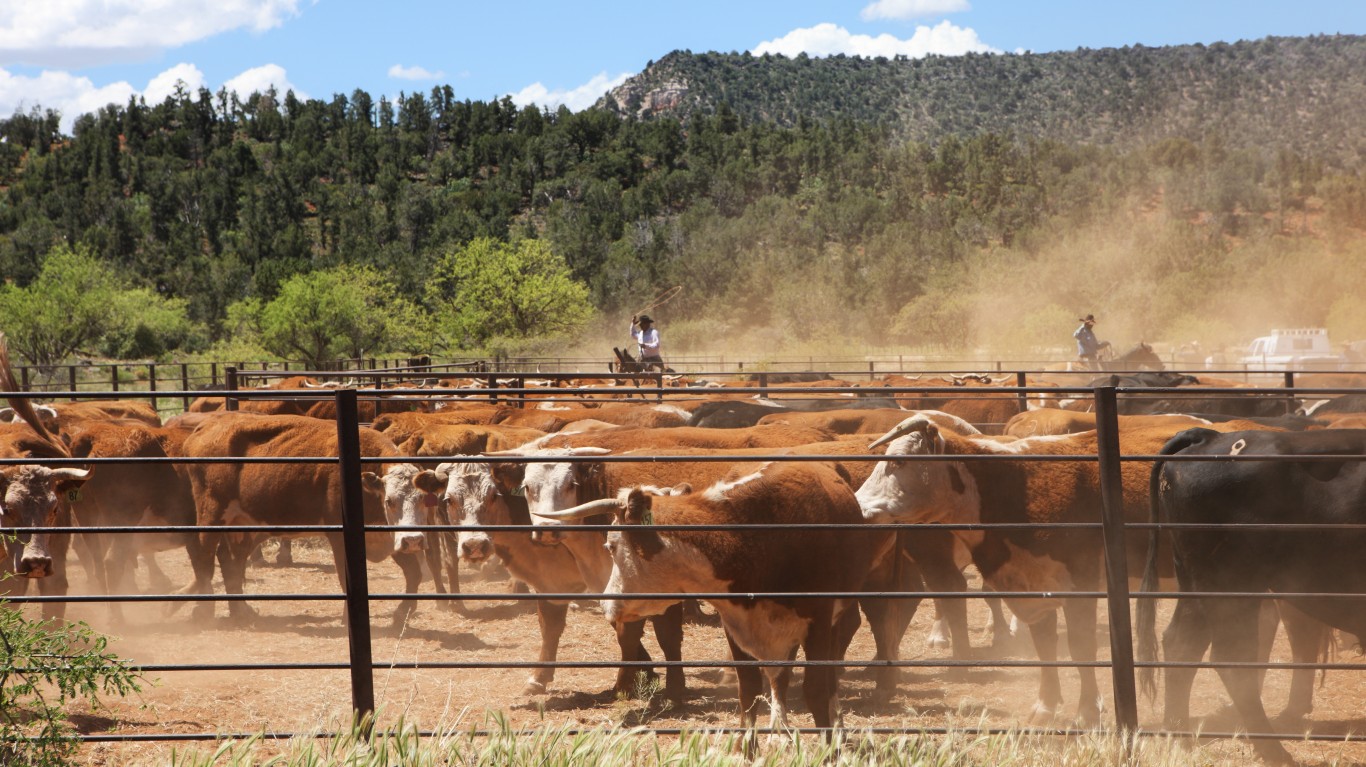
3. Arizona: Cattle
> Value of most important product: $584.6 million
> Total crop production: $3.7 billion (13th smallest)
> Pct. of workforce in agriculture: 2.1% (19th smallest)
> Other major crops: Lettuce, spinach, and melons
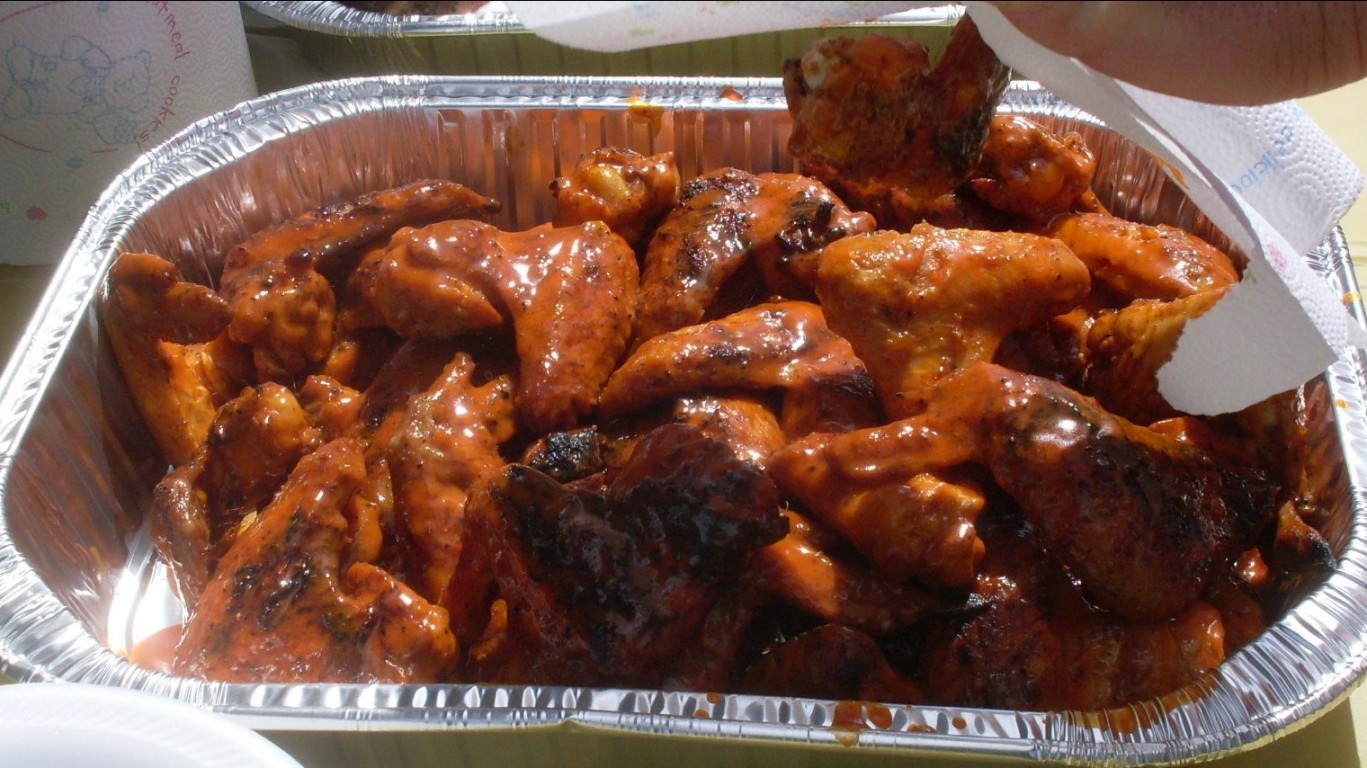
4. Arkansas: Chickens
> Value of most important product: $3.8 billion
> Total crop production: $9.8 billion (19th largest)
> Pct. of workforce in agriculture: 4.8% (14th largest)
> Other major crops: Soybeans, rice, and cattle
[in-text-ad-2]
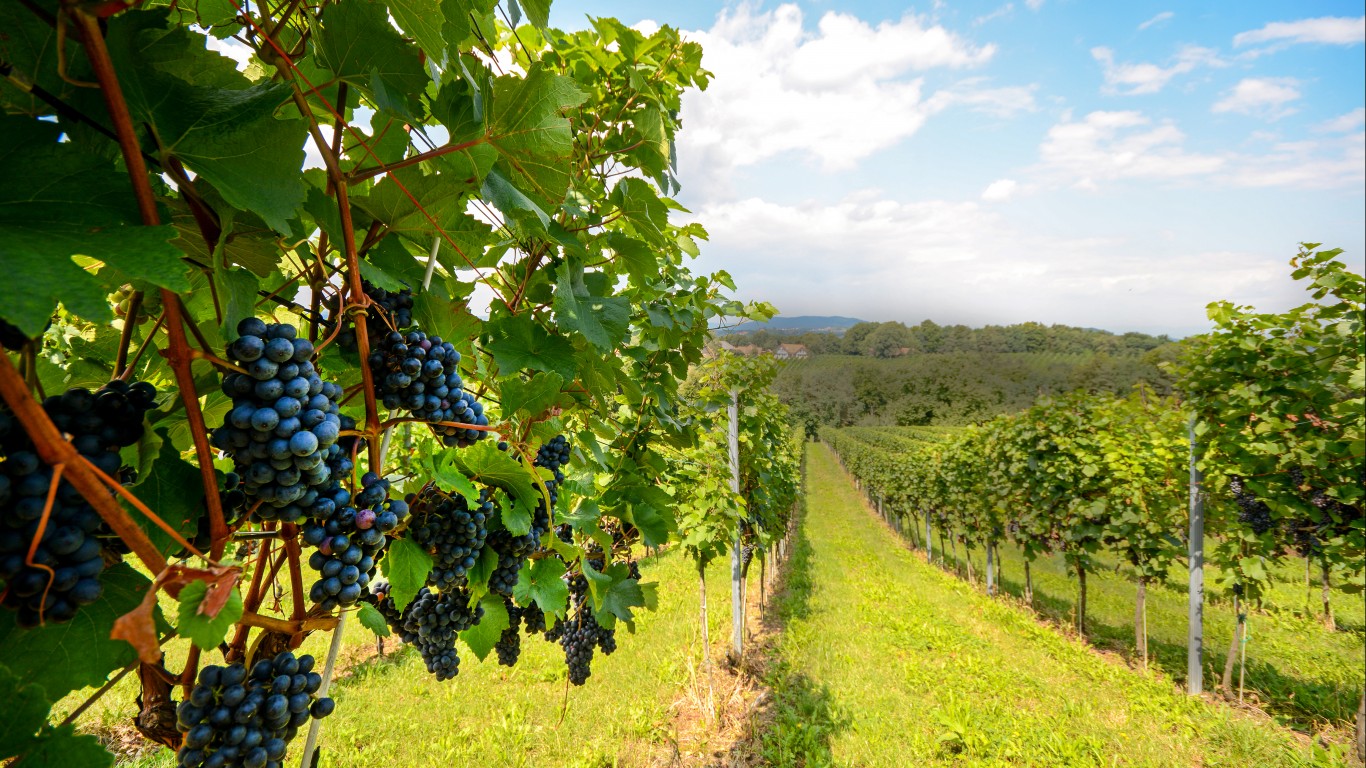
5. California: Grapes
> Value of most important product: $5.8 billion
> Total crop production: $42.6 billion (15th largest)
> Pct. of workforce in agriculture: 5.5% (the largest)
> Other major crops: Almonds, grapes, and strawberries
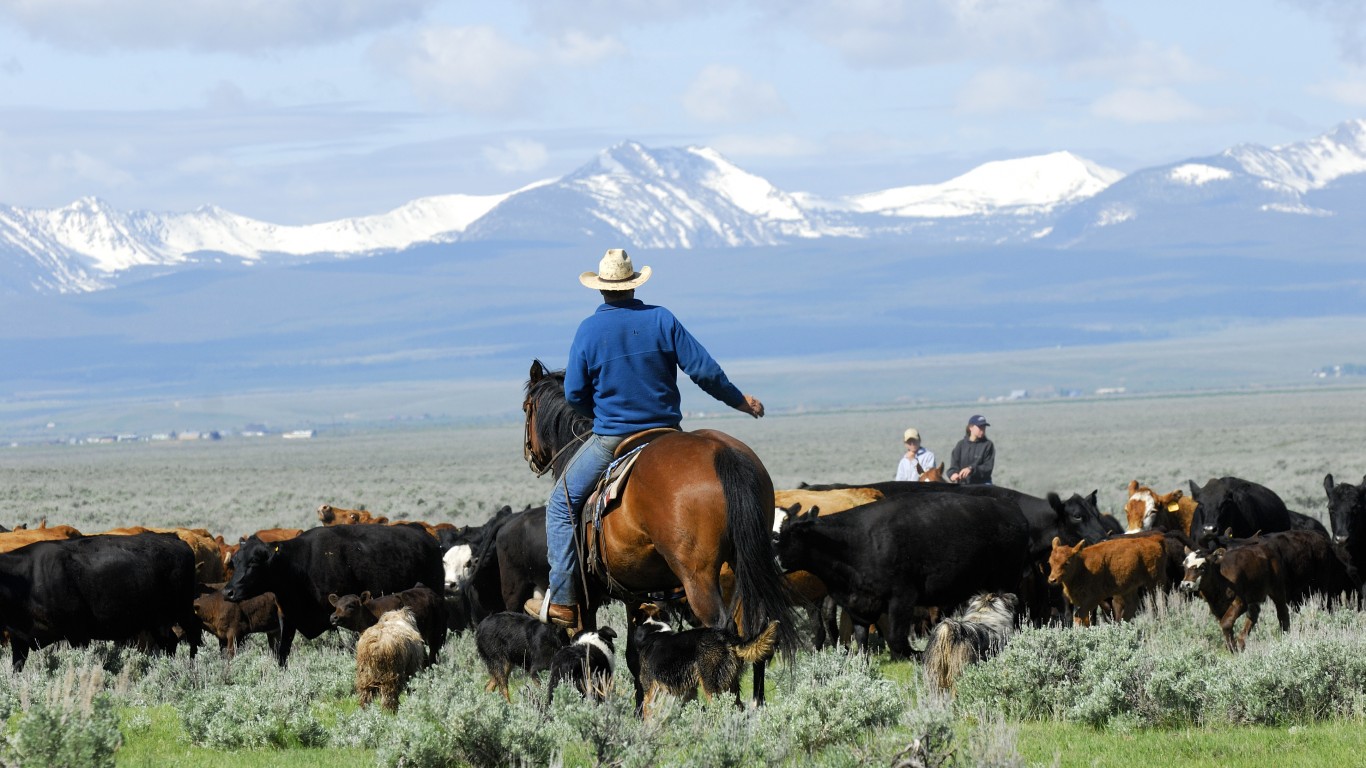
6. Colorado: Cattle
> Value of most important product: $2.0 billion
> Total crop production: $7.8 billion (25th smallest)
> Pct. of workforce in agriculture: 2.8% (20th largest)
> Other major crops: Corn, potatoes, and sorghum
[in-text-ad]

7. Connecticut: Apples
> Value of most important product: $19.9 million
> Total crop production: $550.6 million (8th smallest)
> Pct. of workforce in agriculture: 1.6% (5th smallest)
> Other major crops: Cattle, maple syrup, and apples
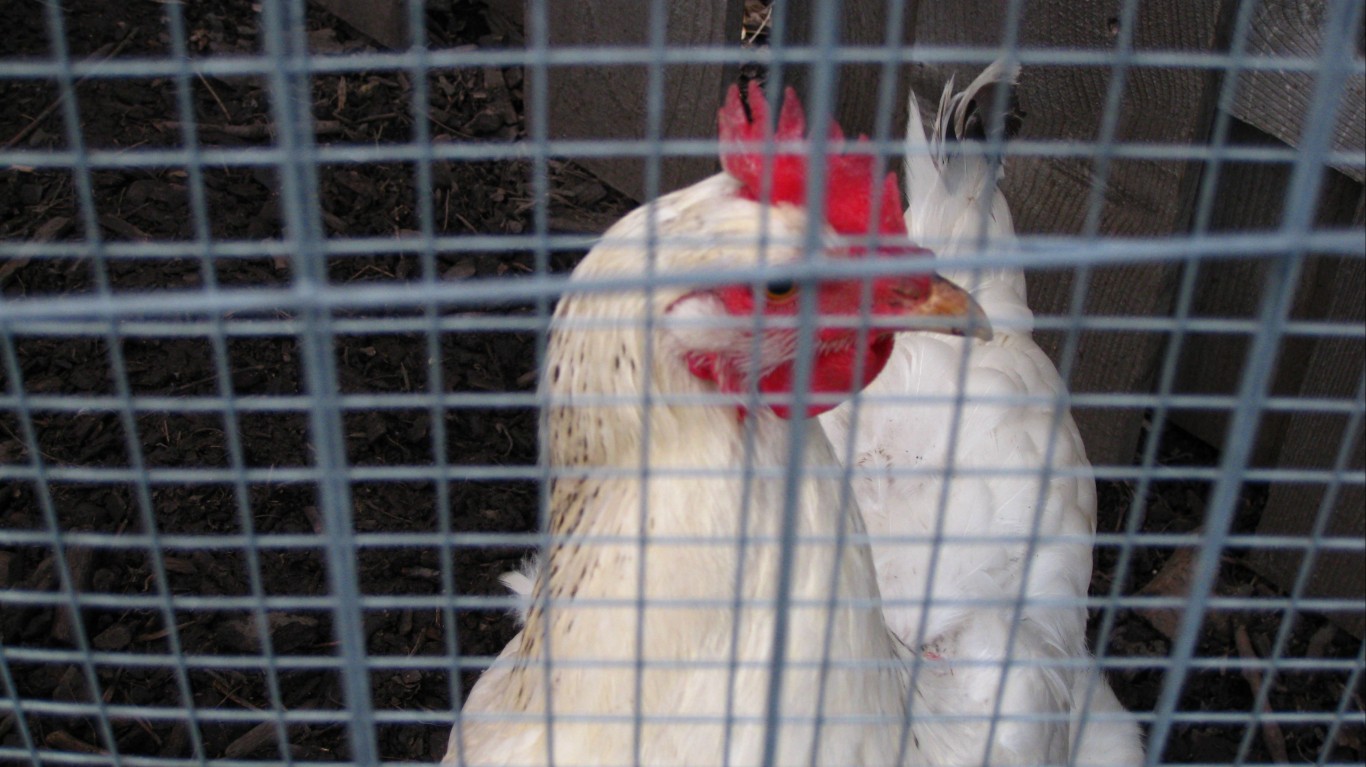
8. Delaware: Chickens
> Value of most important product: $1.0 billion
> Total crop production: $1.3 billion (9th smallest)
> Pct. of workforce in agriculture: 1.7% (12th smallest)
> Other major crops: Corn, soybeans, and melons
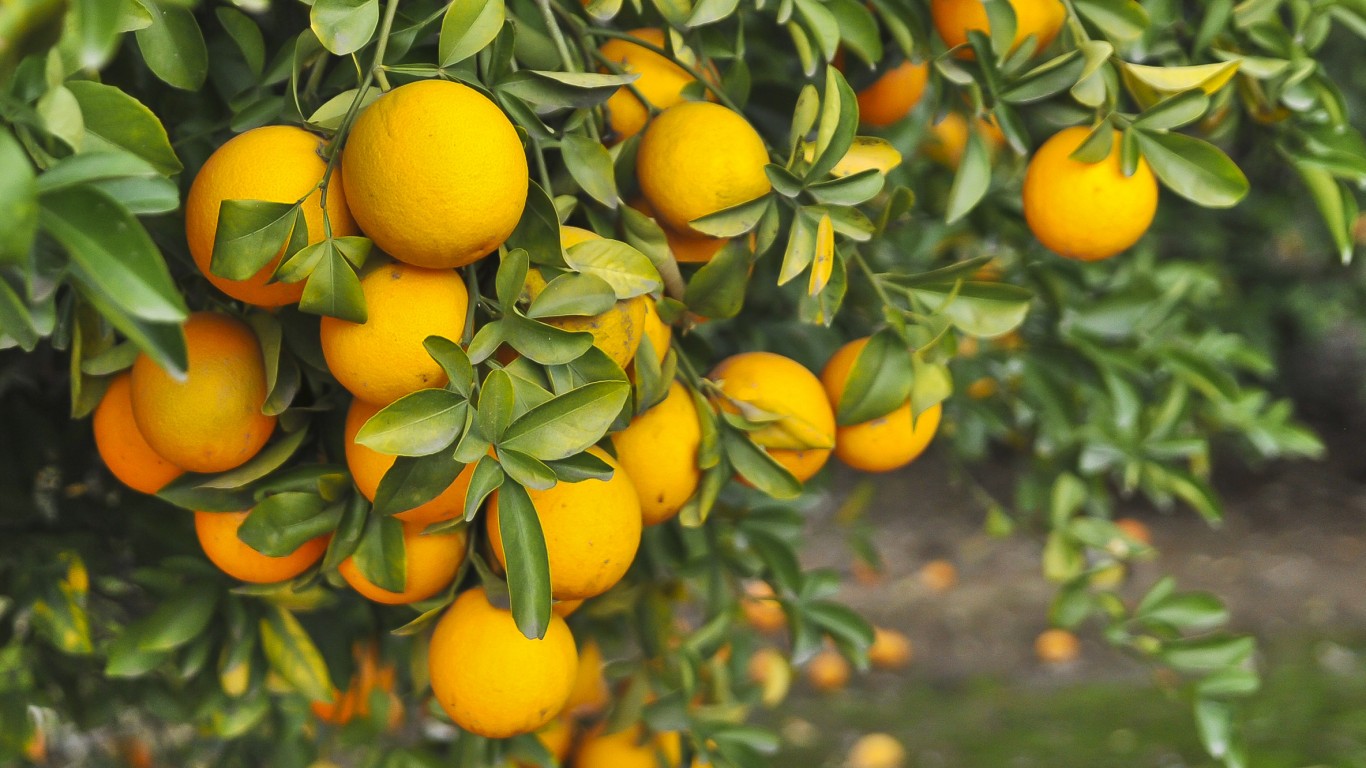
9. Florida: Oranges
> Value of most important product: $1.0 billion
> Total crop production: $7.7 billion (17th smallest)
> Pct. of workforce in agriculture: 2.3% (21st largest)
> Other major crops: Cattle, strawberries, and tomatoes
[in-text-ad-2]
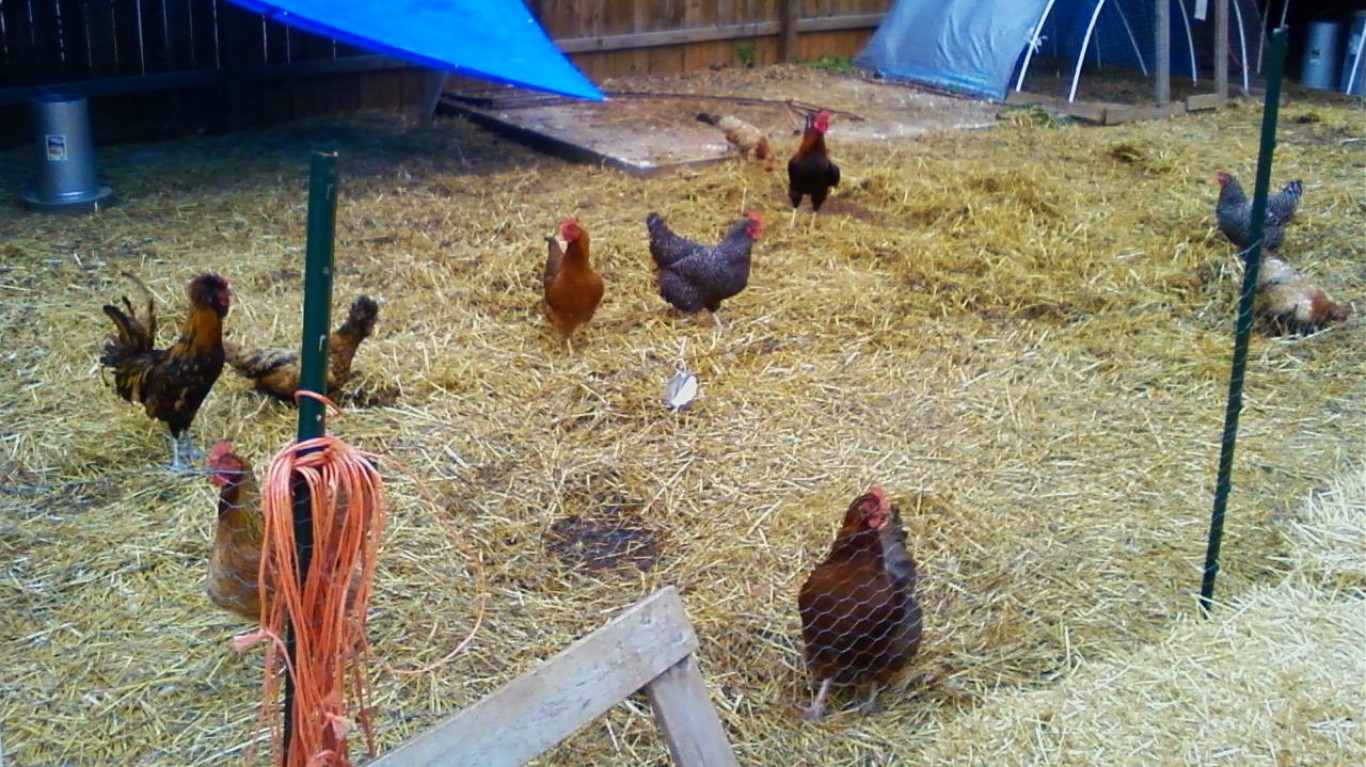
10. Georgia: Chickens
> Value of most important product: $4.4 billion
> Total crop production: $9.3 billion (16th smallest)
> Pct. of workforce in agriculture: 2.2% (15th largest)
> Other major crops: Peanuts, cattle, and pecans
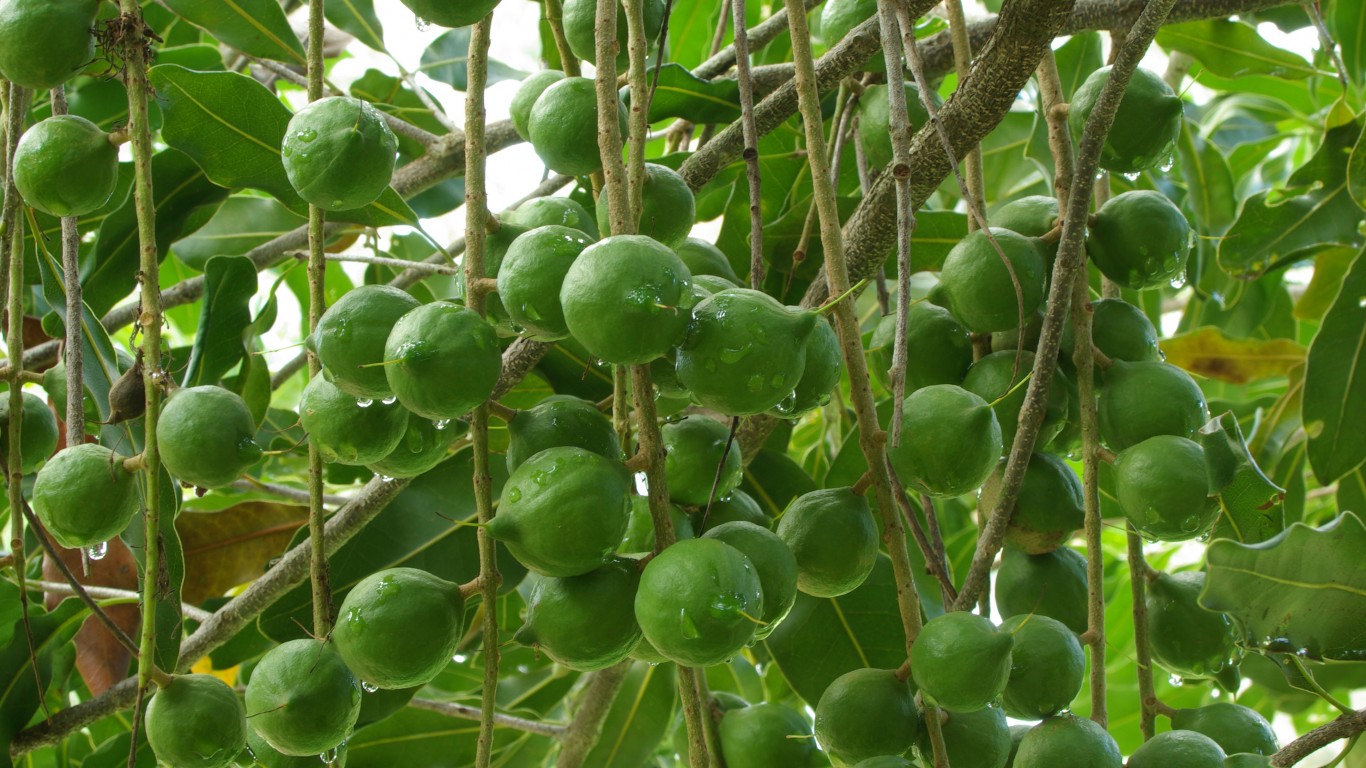
11. Hawaii: Macadamias
> Value of most important product: $53.9 million
> Total crop production: $661.3 million (22nd largest)
> Pct. of workforce in agriculture: 3.7% (6th smallest)
> Other major crops: Cattle, coffee, and papayas
[in-text-ad]

12. Idaho: Cattle
> Value of most important product: $1.4 billion
> Total crop production: $7.8 billion (2nd largest)
> Pct. of workforce in agriculture: 13.5% (19th largest)
> Other major crops: Potatoes, barley, and corn
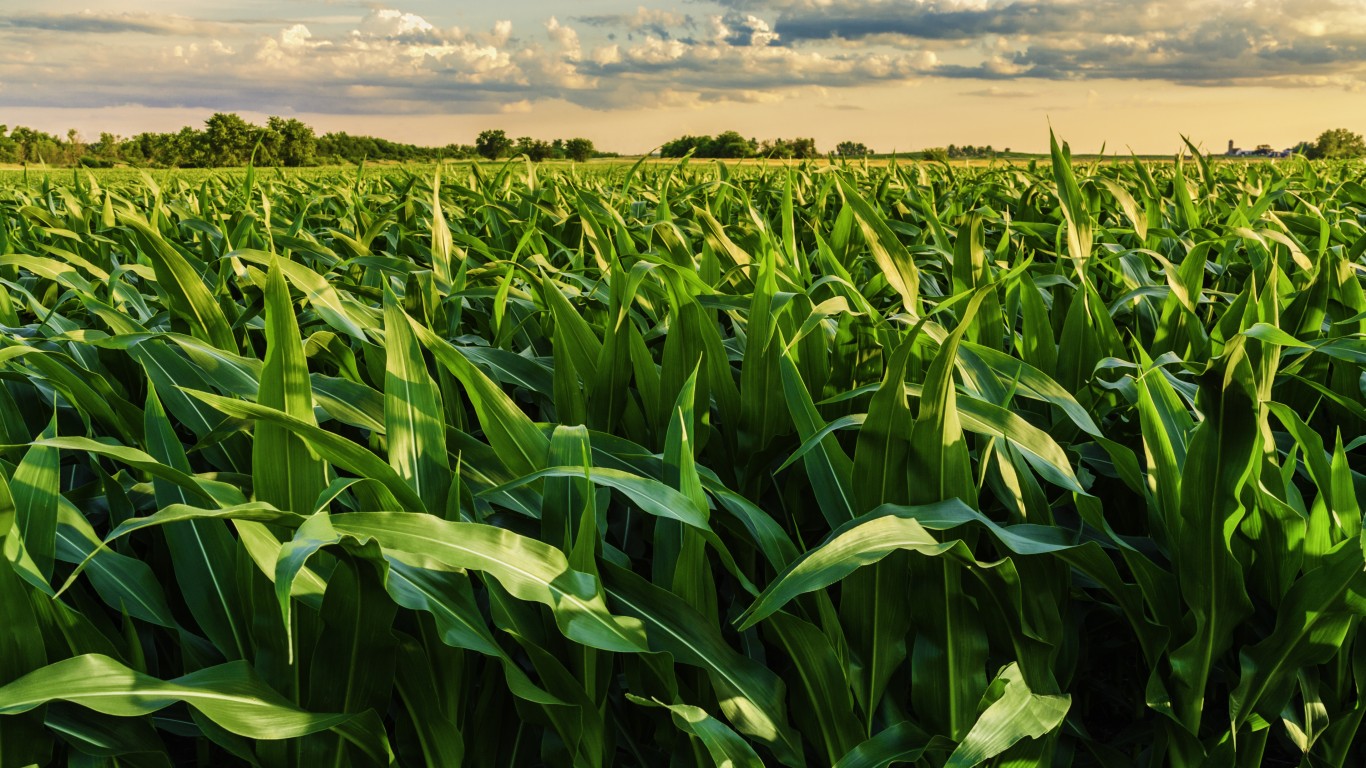
13. Illinois: Corn
> Value of most important product: $7.4 billion
> Total crop production: $17.2 billion (11th smallest)
> Pct. of workforce in agriculture: 1.9% (7th largest)
> Other major crops: Soybeans, cattle, and potatoes
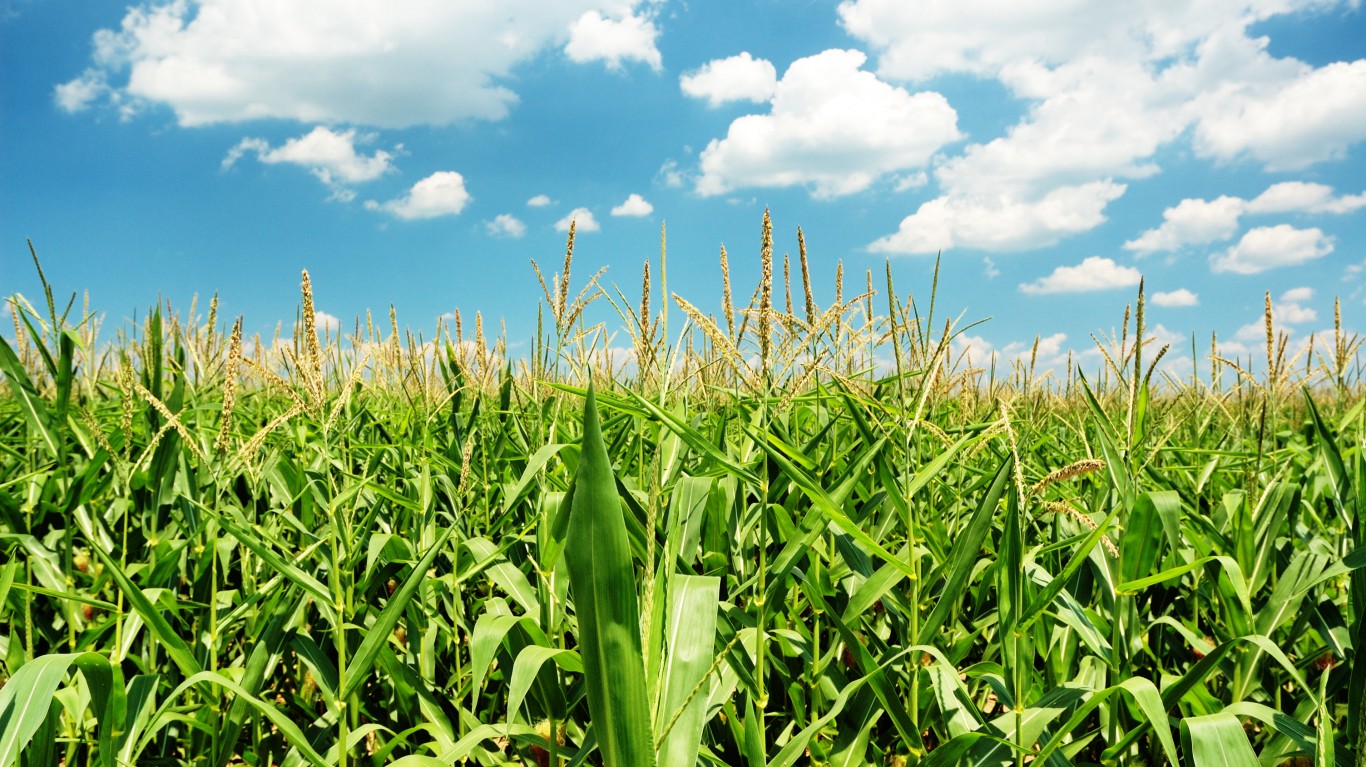
14. Indiana: Corn
> Value of most important product: $3.2 billion
> Total crop production: $11.2 billion (23rd smallest)
> Pct. of workforce in agriculture: 2.7% (10th largest)
> Other major crops: Soybeans, cattle, and tomatoes
[in-text-ad-2]
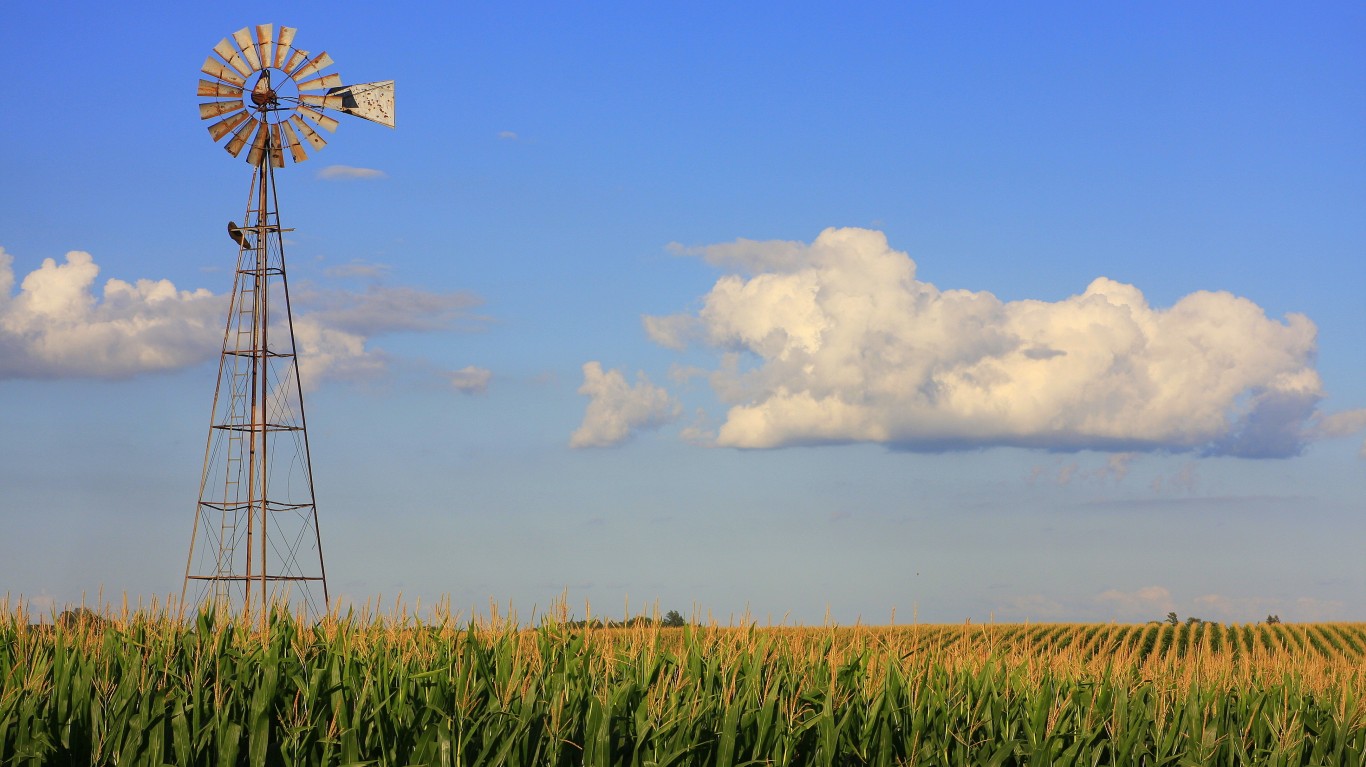
15. Iowa: Corn
> Value of most important product: $8.5 billion
> Total crop production: $30.8 billion (8th largest)
> Pct. of workforce in agriculture: 8.6% (2nd largest)
> Other major crops: Soybeans, cattle, and oats
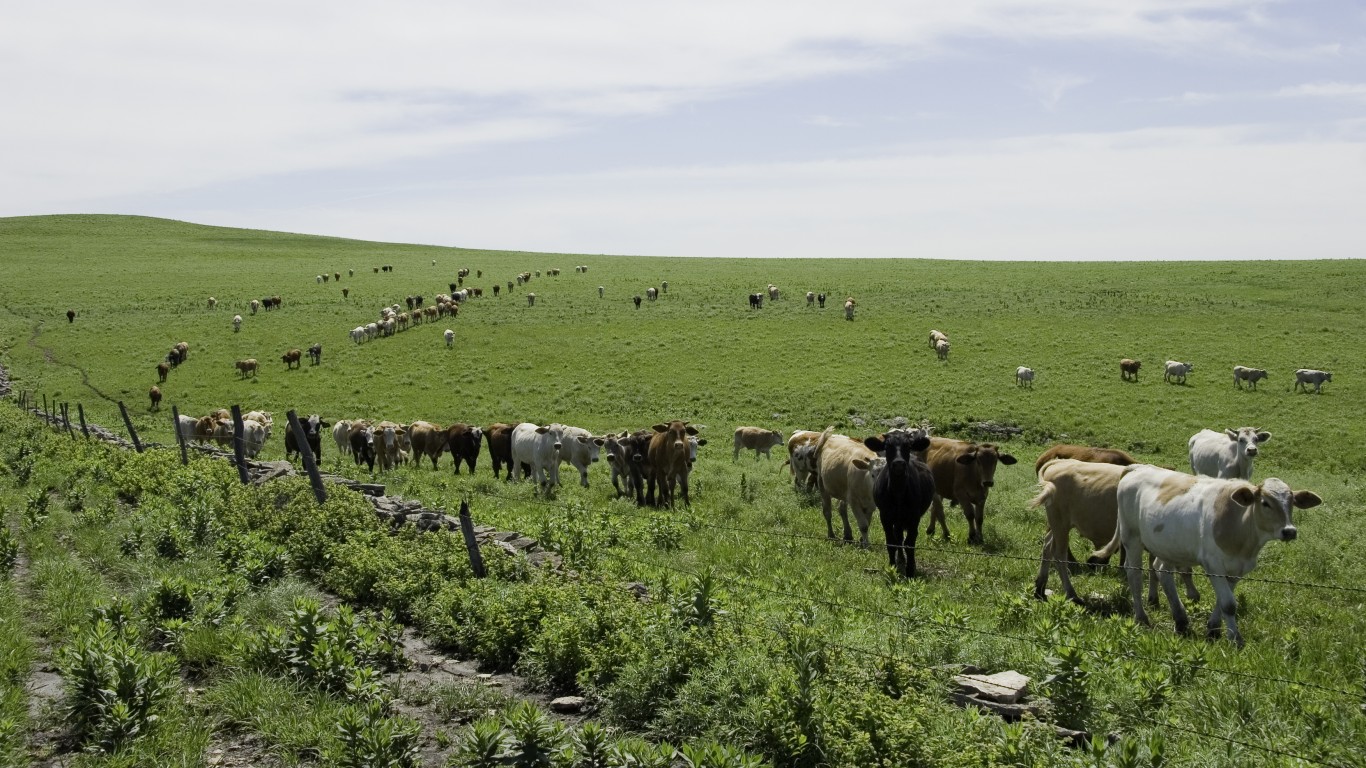
16. Kansas: Cattle
> Value of most important product: $4.5 billion
> Total crop production: $18.5 billion (10th largest)
> Pct. of workforce in agriculture: 6.4% (6th largest)
> Other major crops: Corn, soybeans, and sorghum
[in-text-ad]
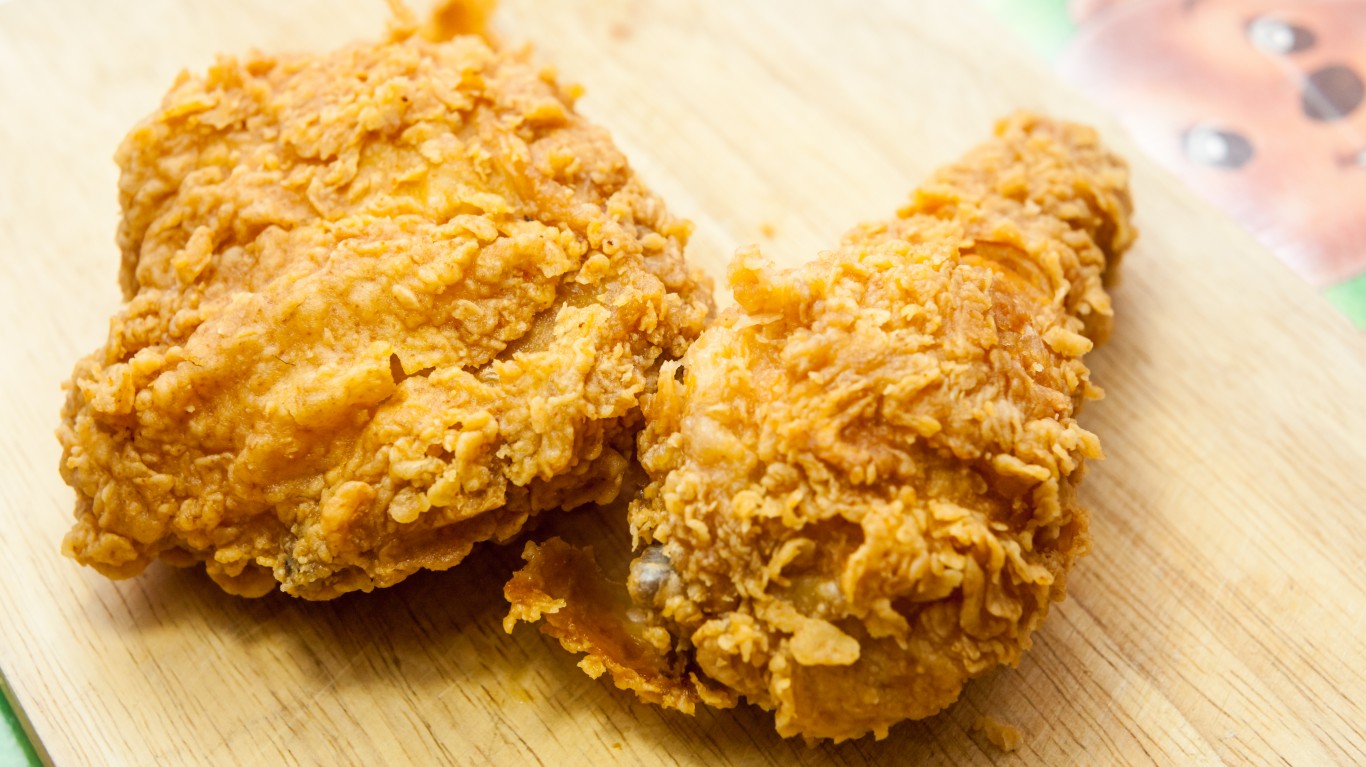
17. Kentucky: Chickens
> Value of most important product: $1.0 billion
> Total crop production: $5.1 billion (9th largest)
> Pct. of workforce in agriculture: 6.4% (24th smallest)
> Other major crops: Soybeans, corn, and cattle
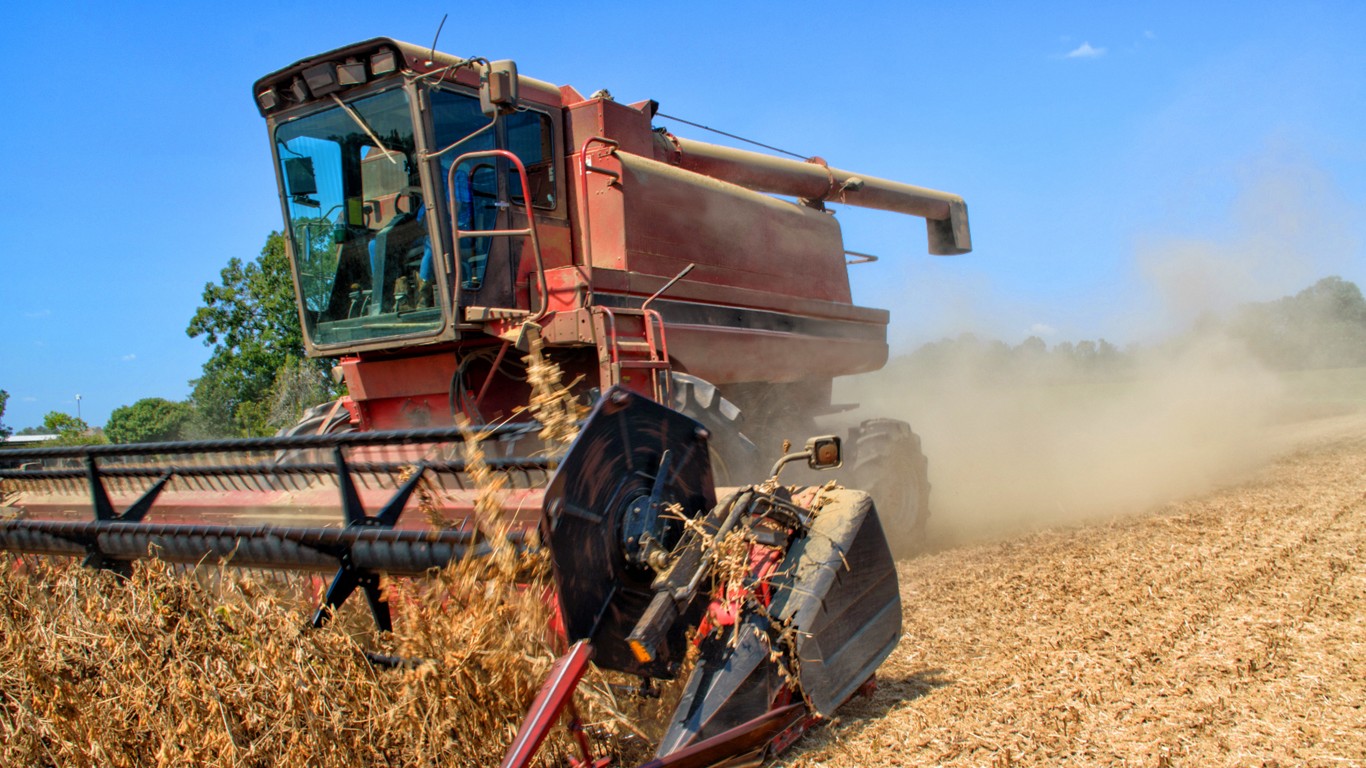
18. Louisiana: Soybeans
> Value of most important product: $654.8 million
> Total crop production: $3.8 billion (19th smallest)
> Pct. of workforce in agriculture: 2.4% (21st smallest)
> Other major crops: Corn, rice, and cattle

19. Maine: Potatoes
> Value of most important product: $155.0 million
> Total crop production: $763.1 million (18th largest)
> Pct. of workforce in agriculture: 5.0% (7th smallest)
> Other major crops: Maple Syrup, cattle, and apples
[in-text-ad-2]
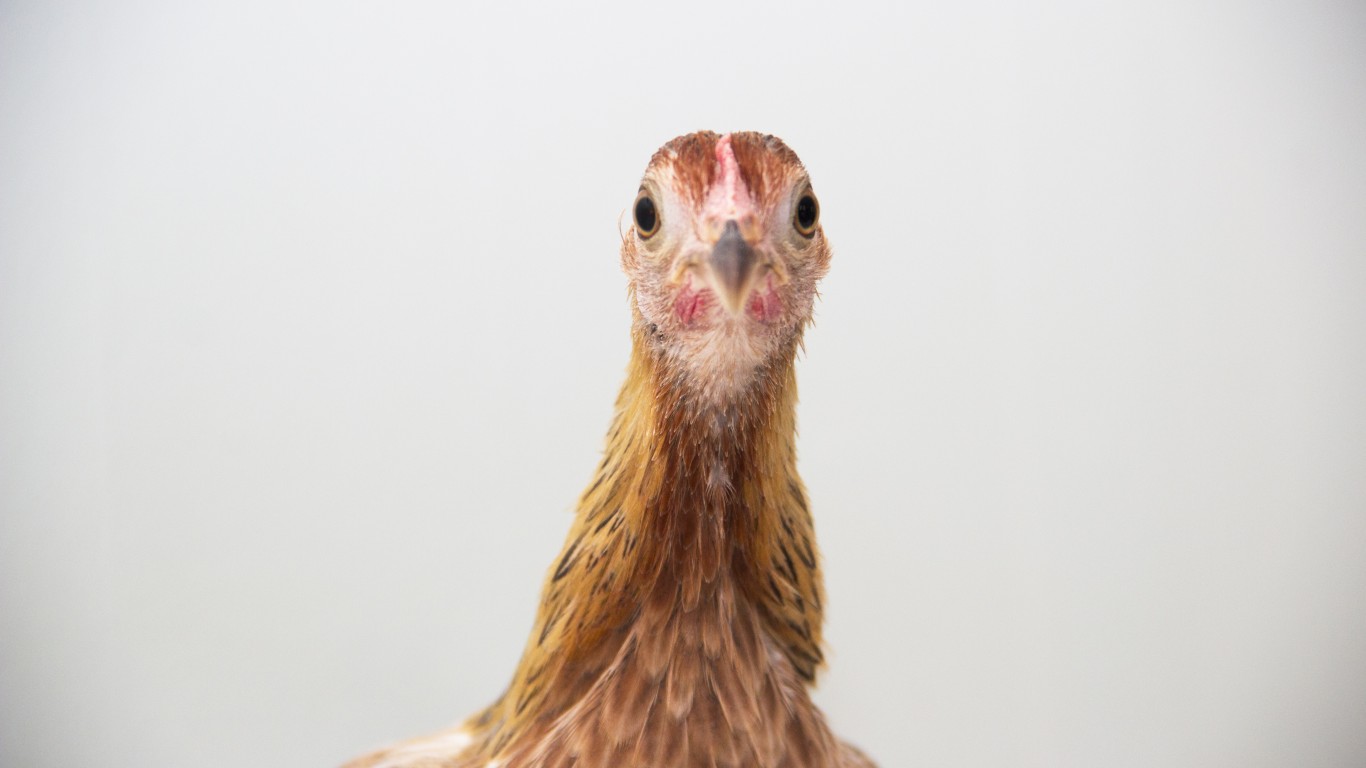
20. Maryland: Chickens
> Value of most important product: $1.0 billion
> Total crop production: $2.3 billion (6th smallest)
> Pct. of workforce in agriculture: 1.2% (15th smallest)
> Other major crops: Corn, soybeans, and cattle
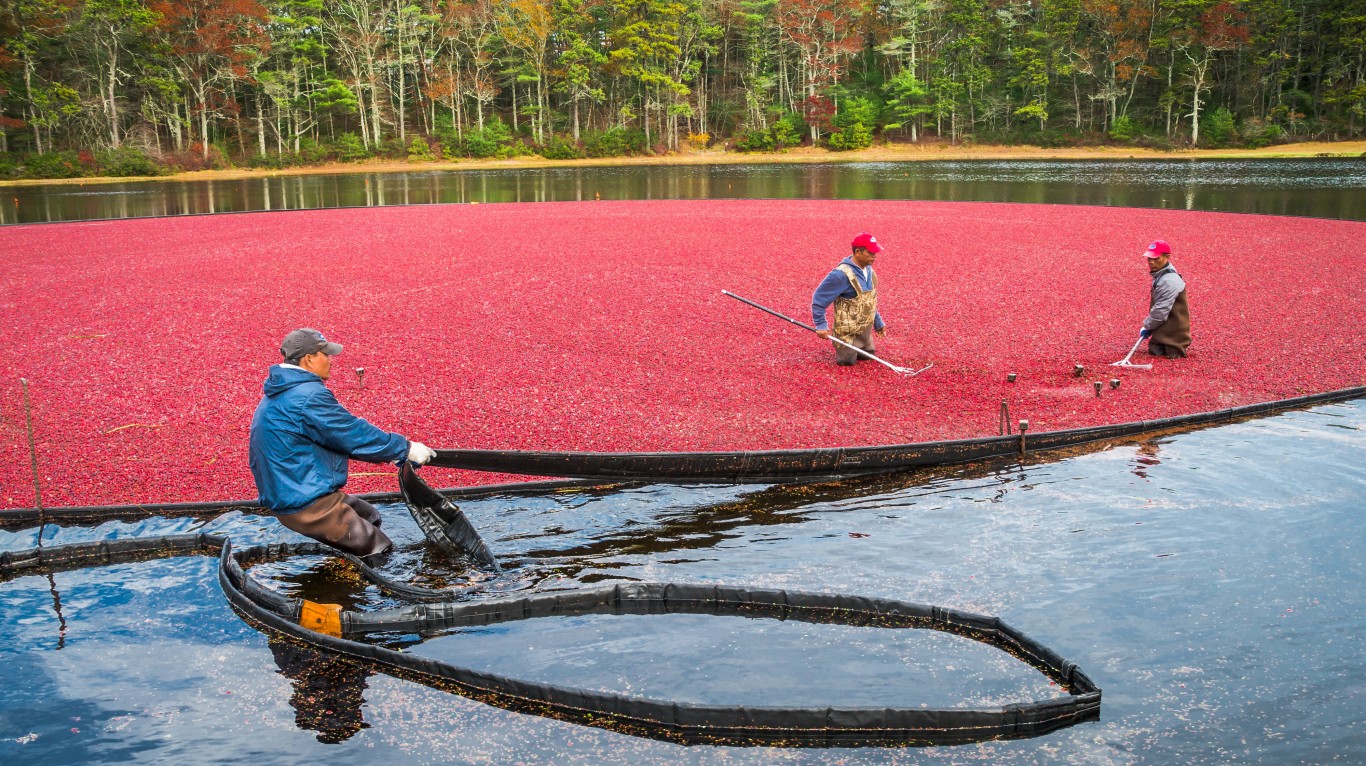
21. Massachusetts: Cranberries
> Value of most important product: $59.7 million
> Total crop production: $492.2 million (3rd smallest)
> Pct. of workforce in agriculture: 0.9% (4th smallest)
> Other major crops: Apples and maple syrup
[in-text-ad]
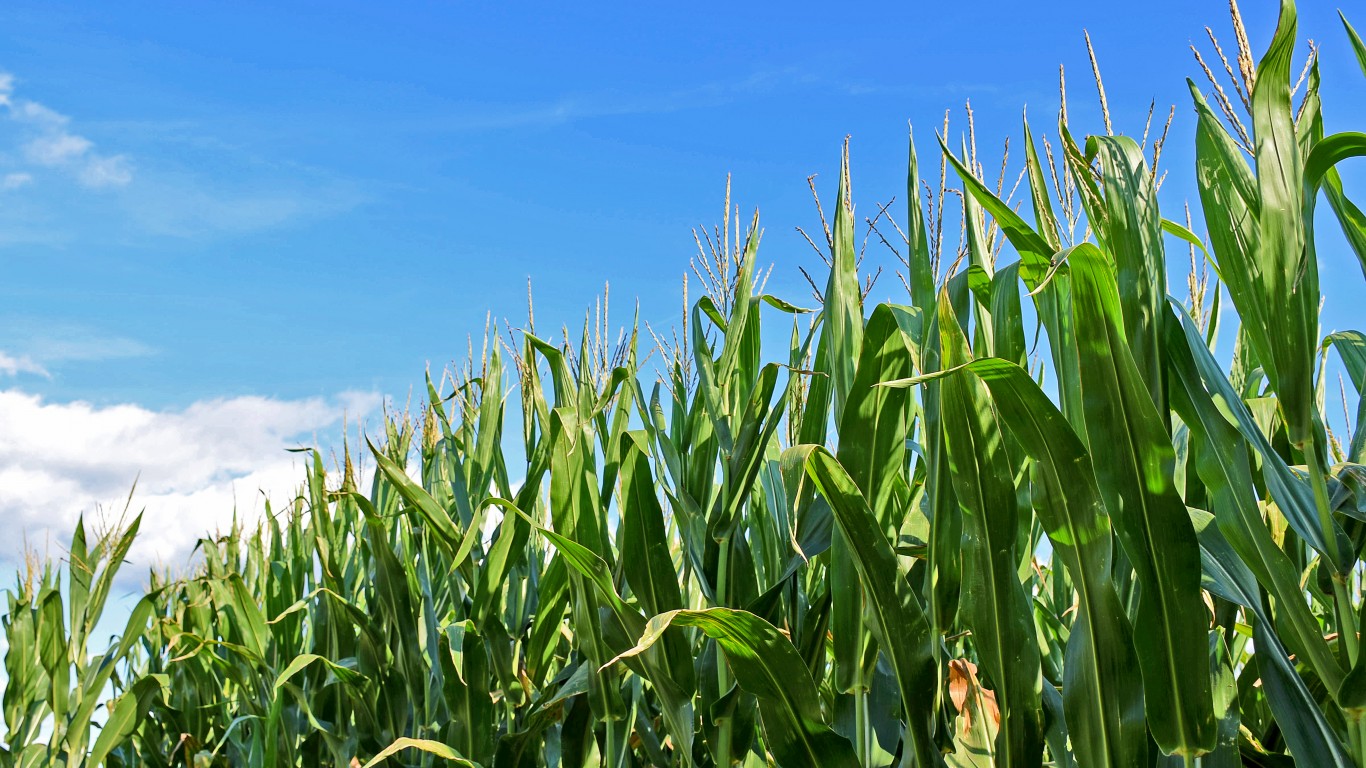
22. Michigan: Corn
> Value of most important product: $1.0 billion
> Total crop production: $8.7 billion (23rd largest)
> Pct. of workforce in agriculture: 3.6% (18th largest)
> Other major crops: Soybeans, cattle, and apples
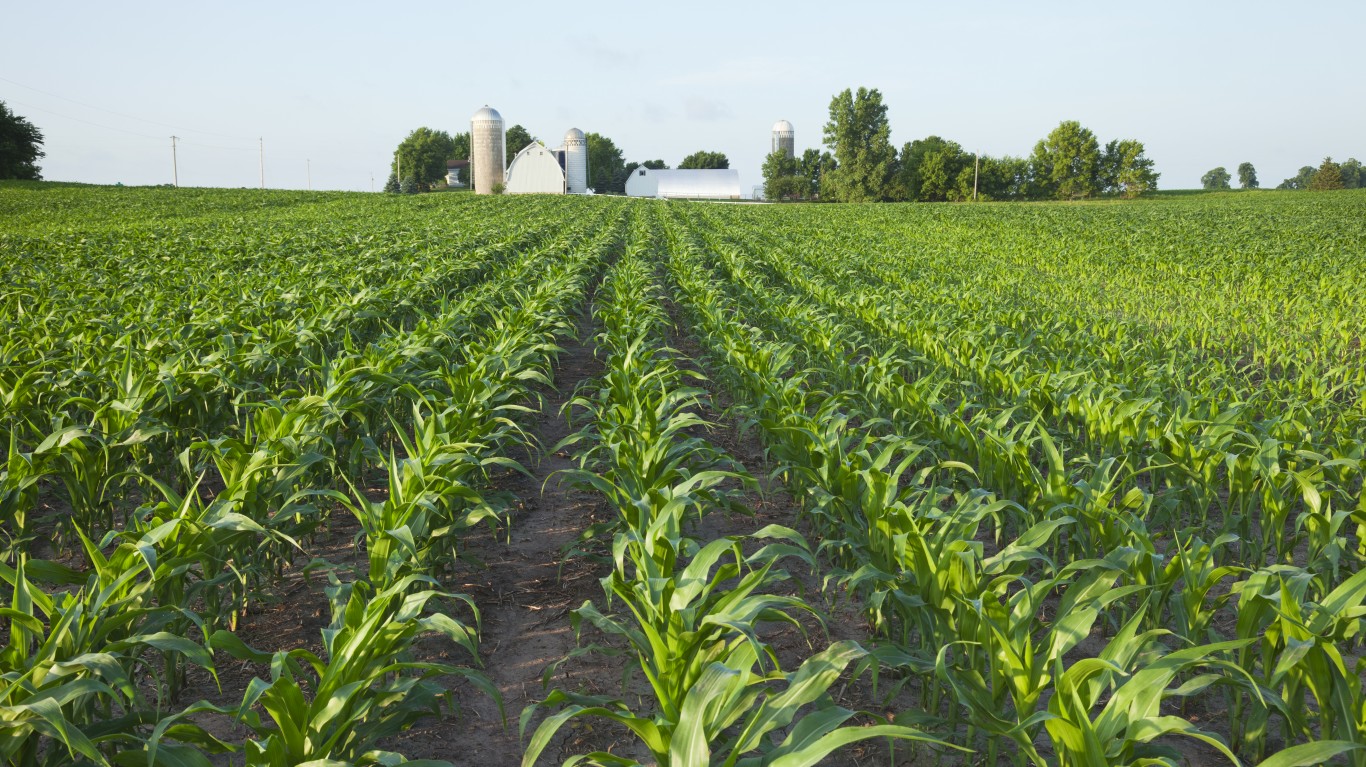
23. Minnesota: Corn
> Value of most important product: $4.5 billion
> Total crop production: $21.3 billion (17th largest)
> Pct. of workforce in agriculture: 5.0% (5th largest)
> Other major crops: Soybeans, cattle, and chickens
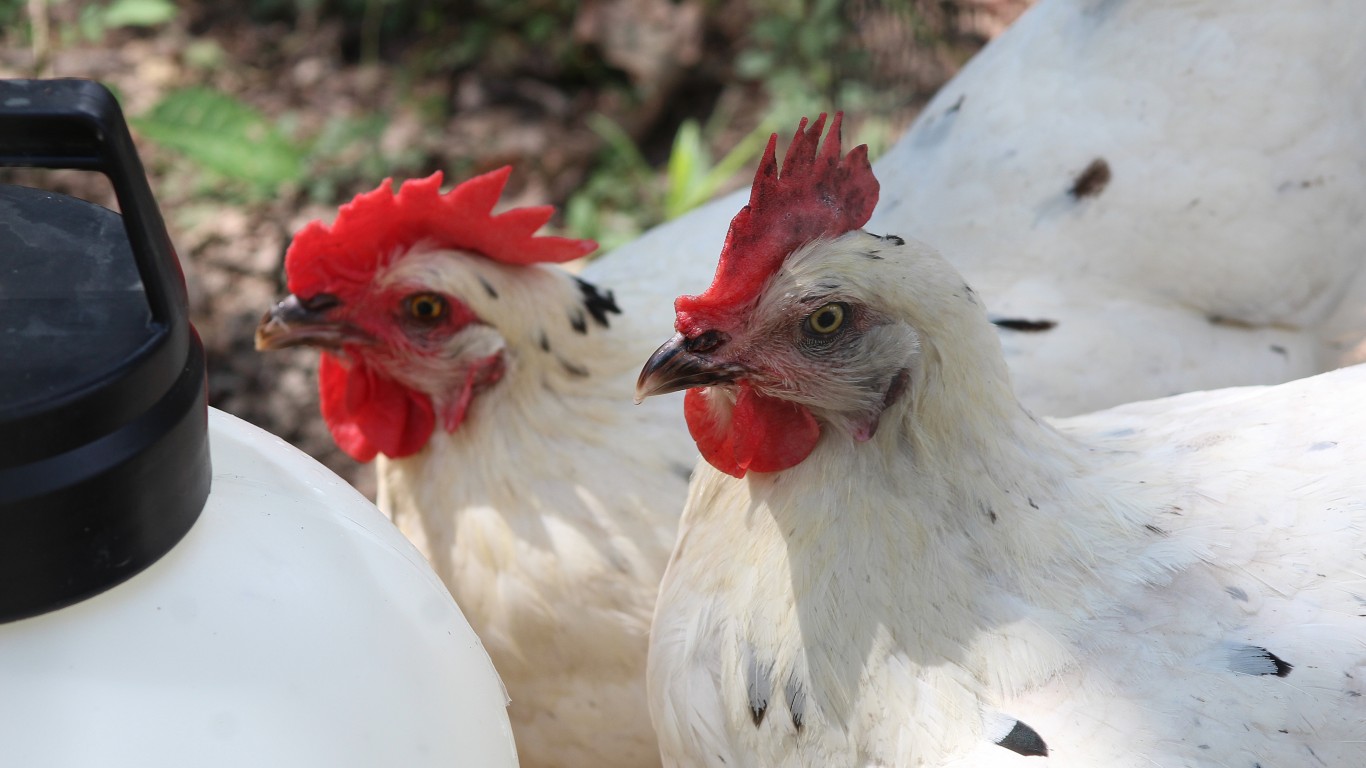
24. Mississippi: Chickens
> Value of most important product: $2.6 billion
> Total crop production: $6.4 billion (16th largest)
> Pct. of workforce in agriculture: 5.2% (24th largest)
> Other major crops: Soybeans, corn, and cattle
[in-text-ad-2]
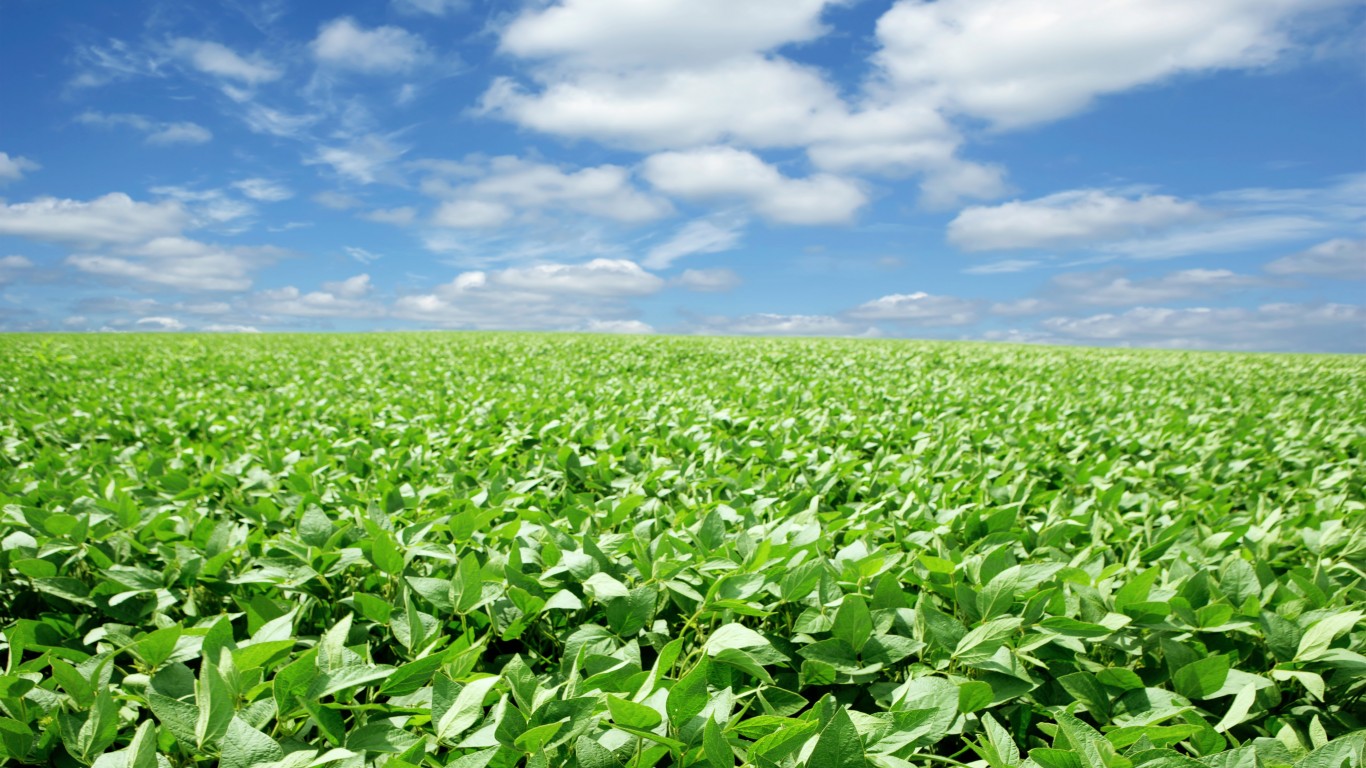
25. Missouri: Soybeans
> Value of most important product: $2.7 billion
> Total crop production: $9.2 billion (21st largest)
> Pct. of workforce in agriculture: 3.8% (16th largest)
> Other major crops: Cattle, corn, and chickens
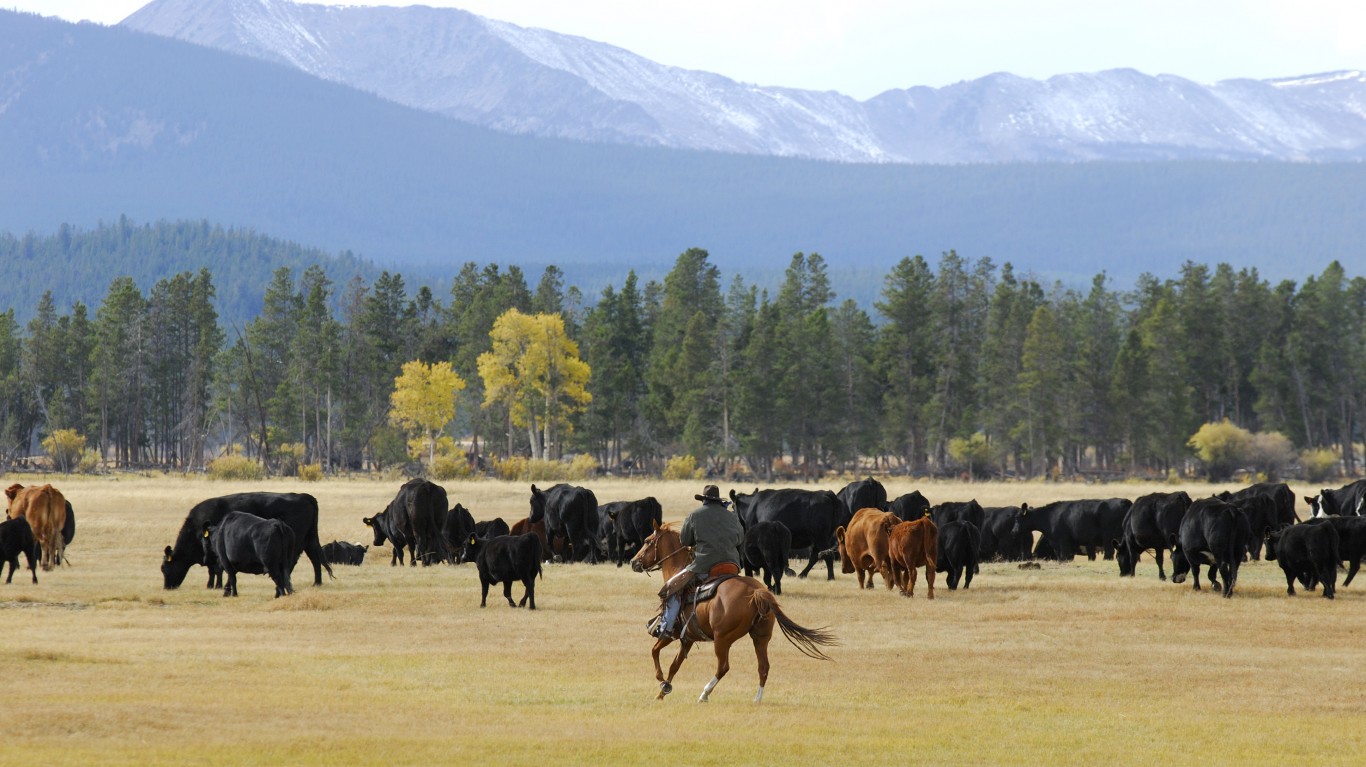
26. Montana: Cattle
> Value of most important product: $1.3 billion
> Total crop production: $4.2 billion (6th largest)
> Pct. of workforce in agriculture: 9.6% (22nd smallest)
> Other major crops: Barley, lentils, and beans
[in-text-ad]
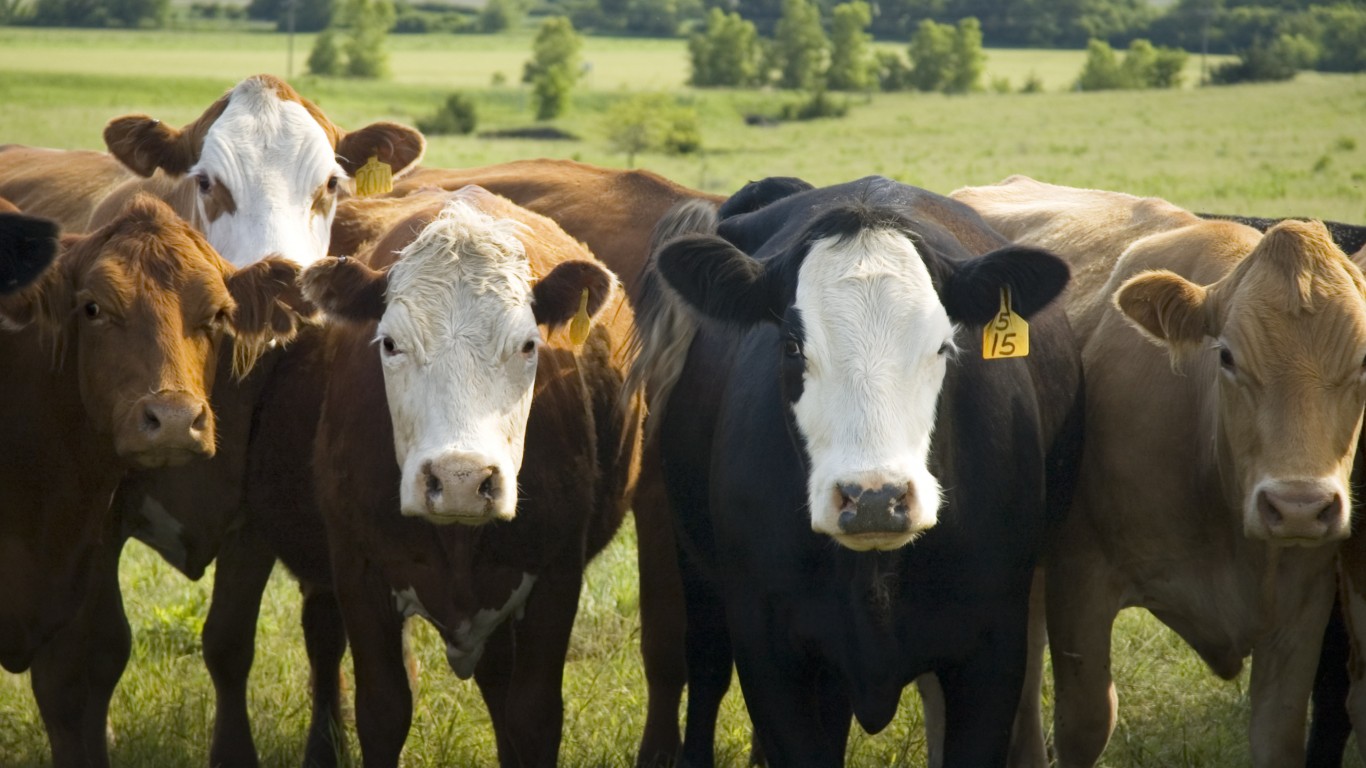
27. Nebraska: Cattle
> Value of most important product: $6.2 billion
> Total crop production: $23.1 billion (7th largest)
> Pct. of workforce in agriculture: 9.1% (4th largest)
> Other major crops: Corn, soybeans, and potatoes

28. Nevada: Cattle
> Value of most important product: $243.2 million
> Total crop production: $764.1 million (4th smallest)
> Pct. of workforce in agriculture: 0.9% (8th smallest)
> Other major crops: Corn
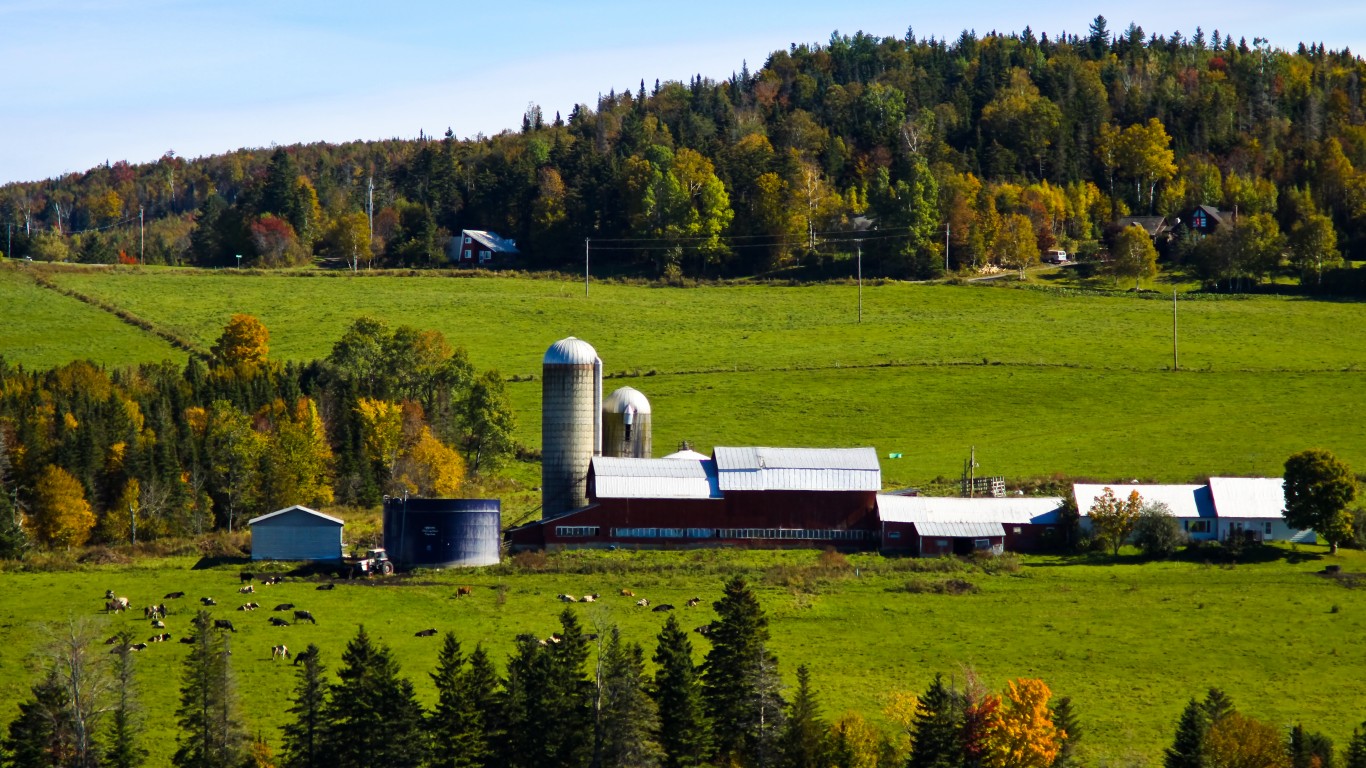
29. New Hampshire: Cattle
> Value of most important product: $9.0 million
> Total crop production: $190.9 million (10th smallest)
> Pct. of workforce in agriculture: 1.7% (3rd smallest)
> Other major crops: Maple Syrup
[in-text-ad-2]
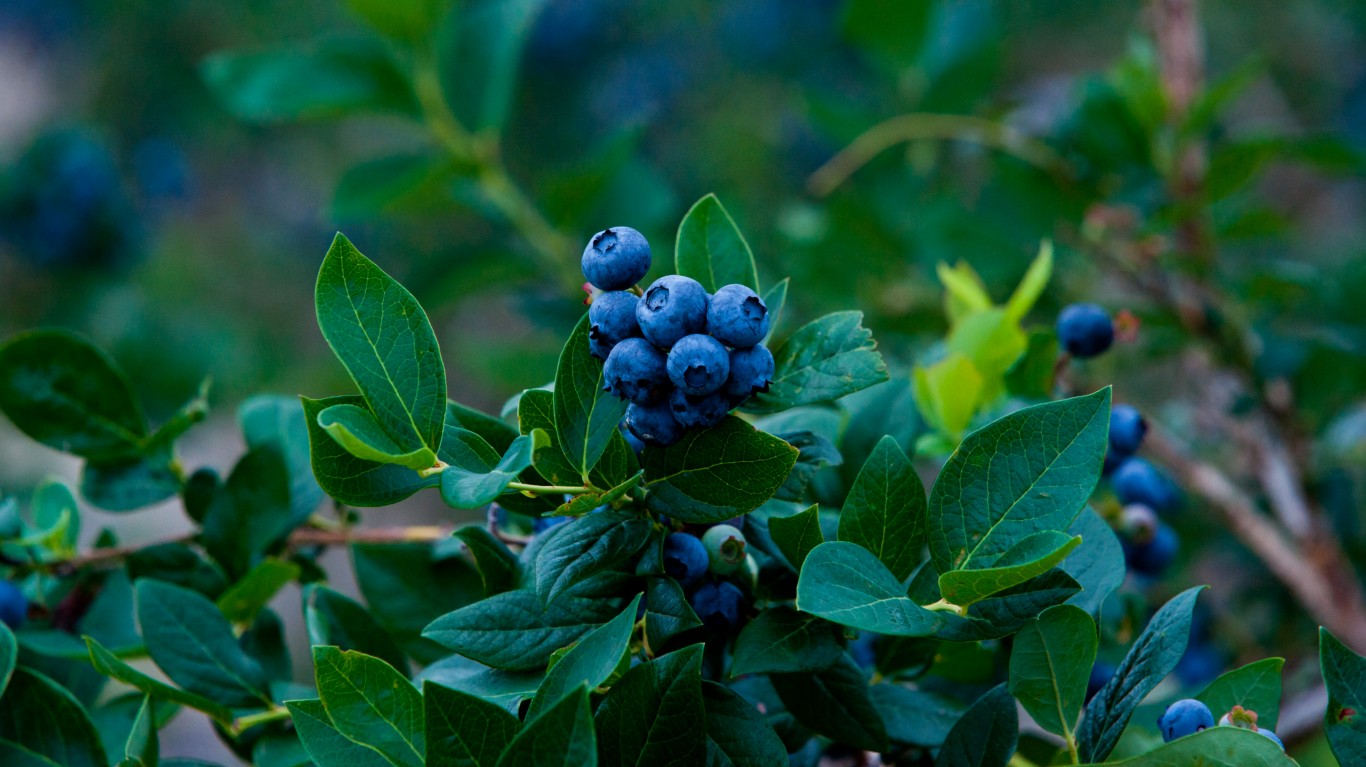
30. New Jersey: Blueberries
> Value of most important product: $83.8 million
> Total crop production: $1.0 billion (5th smallest)
> Pct. of workforce in agriculture: 1.2% (11th smallest)
> Other major crops: Peaches, corn, and soybeans
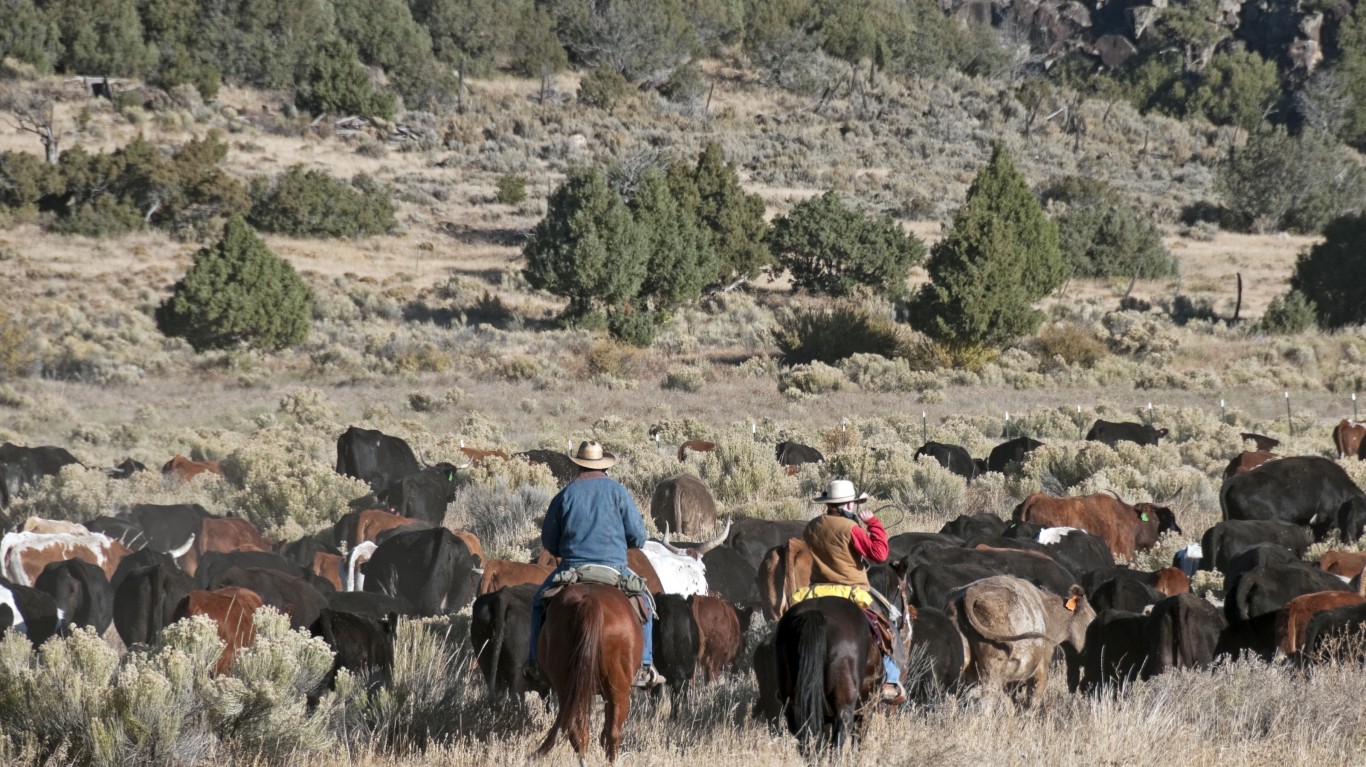
31. New Mexico: Cattle
> Value of most important product: $694.5 million
> Total crop production: $2.6 billion (13th largest)
> Pct. of workforce in agriculture: 5.7% (16th smallest)
> Other major crops: Pecans, peppers, and peppers
[in-text-ad]
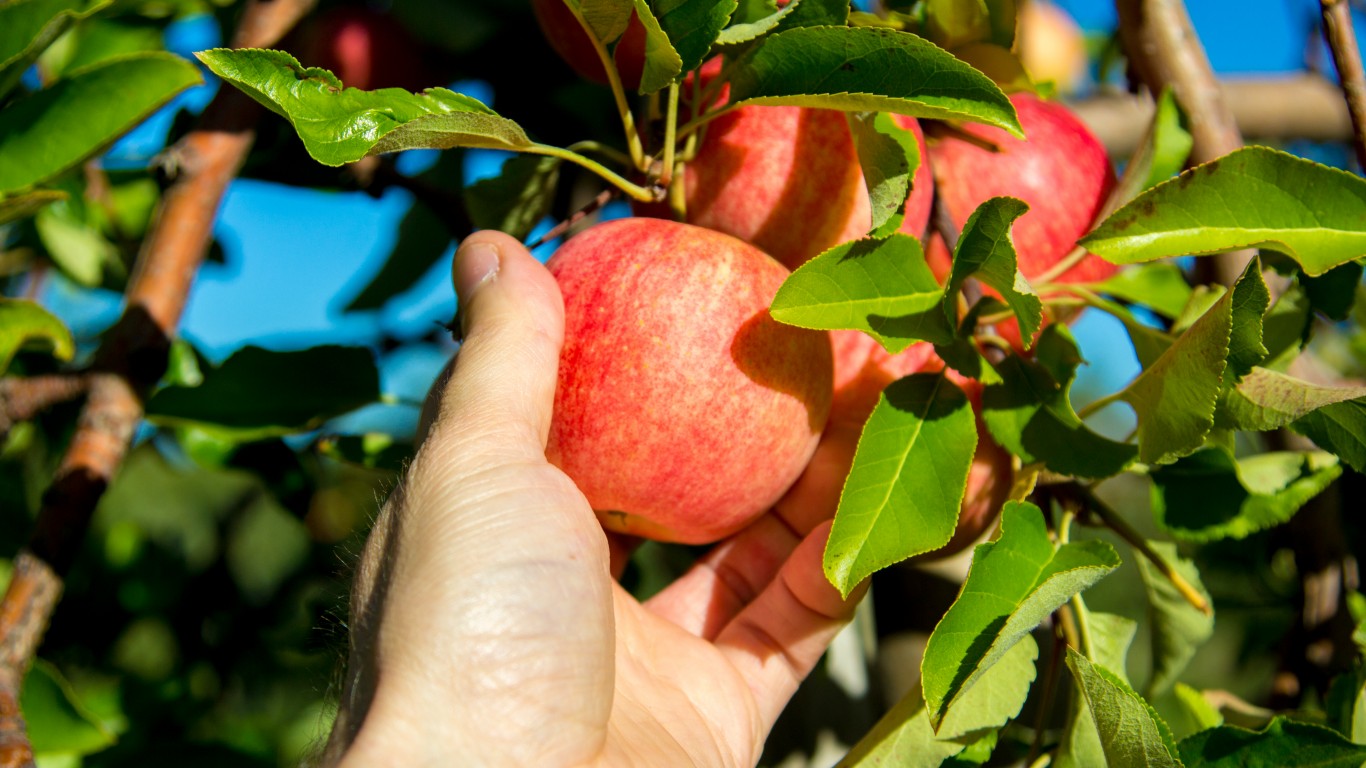
32. New York: Apples
> Value of most important product: $343.1 million
> Total crop production: $5.4 billion (7th smallest)
> Pct. of workforce in agriculture: 1.4% (25th smallest)
> Other major crops: Cattle, corn, and apples

33. North Carolina: Chickens
> Value of most important product: $3.6 billion
> Total crop production: $12.6 billion (24th largest)
> Pct. of workforce in agriculture: 3.5% (8th largest)
> Other major crops: Soybeans, corn, and sweet potatoes
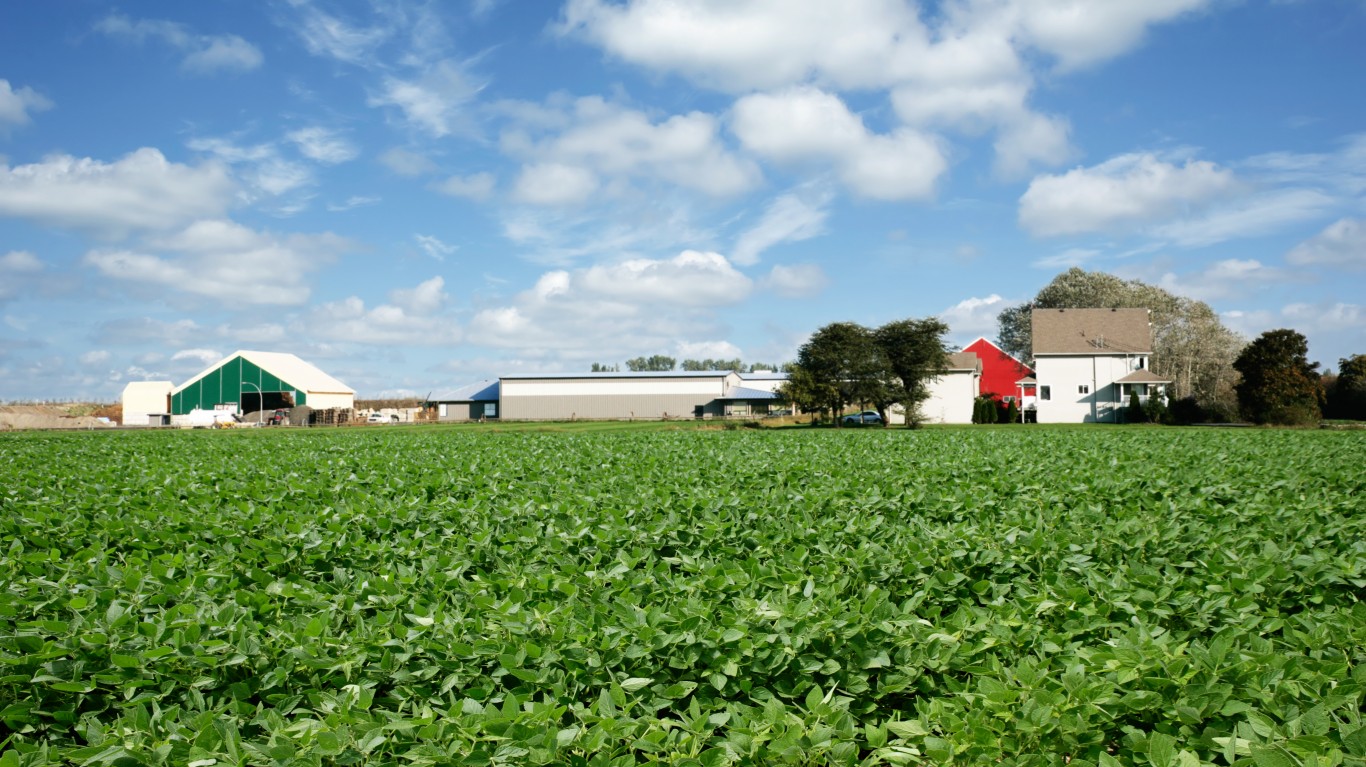
34. North Dakota: Soybeans
> Value of most important product: $2.1 billion
> Total crop production: $11.0 billion (5th largest)
> Pct. of workforce in agriculture: 10.9% (11th largest)
> Other major crops: Corn, cattle, and canola
[in-text-ad-2]
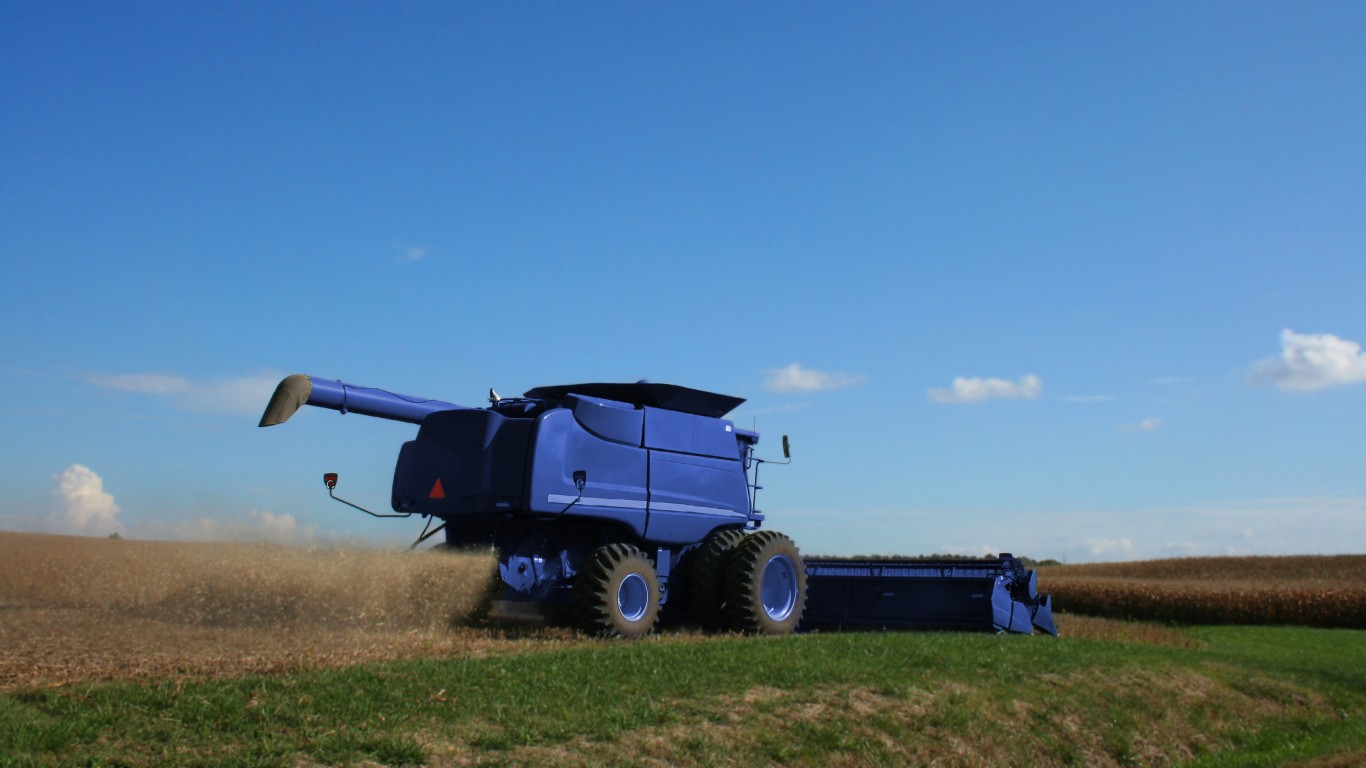
35. Ohio: Soybeans
> Value of most important product: $2.4 billion
> Total crop production: $10.1 billion (14th smallest)
> Pct. of workforce in agriculture: 2.2% (13th largest)
> Other major crops: Corn, cattle, and chickens
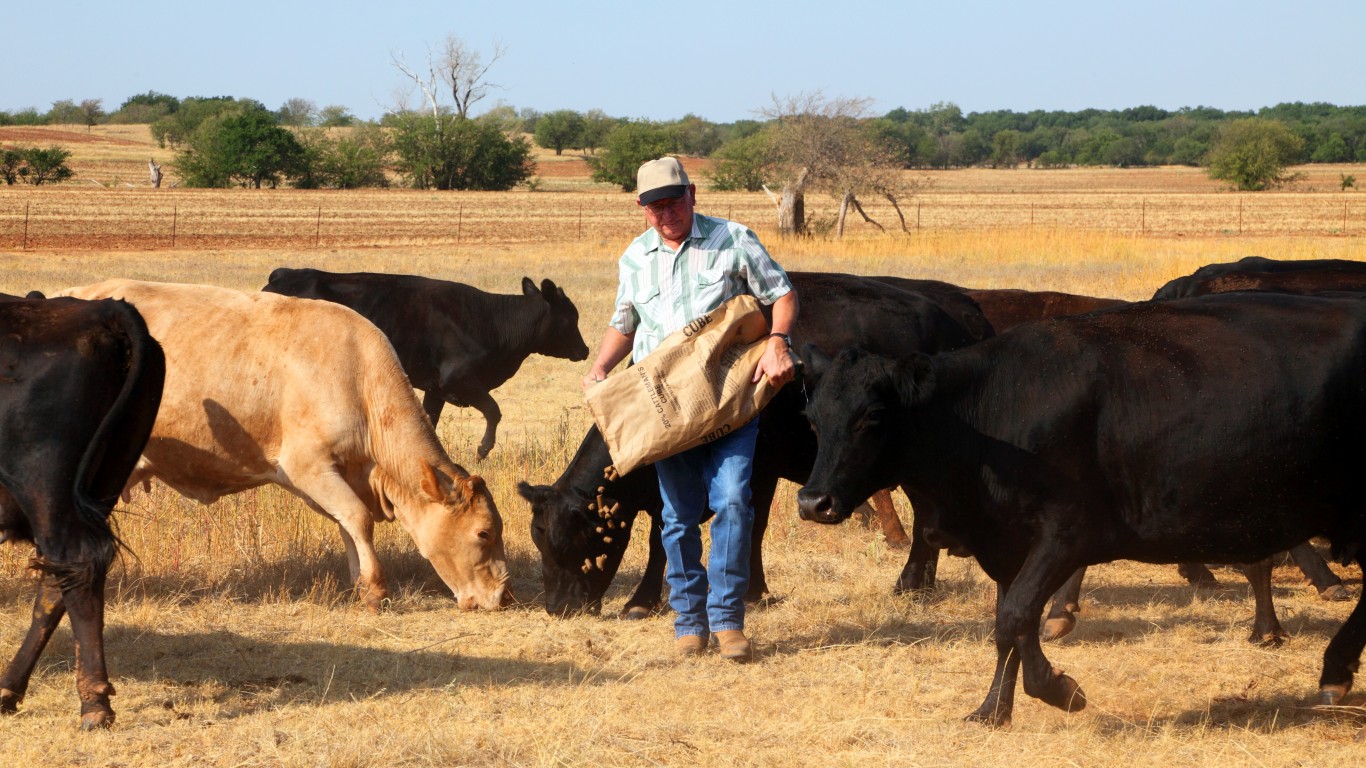
36. Oklahoma: Cattle
> Value of most important product: $2.9 billion
> Total crop production: $7.1 billion (14th largest)
> Pct. of workforce in agriculture: 5.6% (23rd largest)
> Other major crops: Chickens, soybeans, and corn
[in-text-ad]
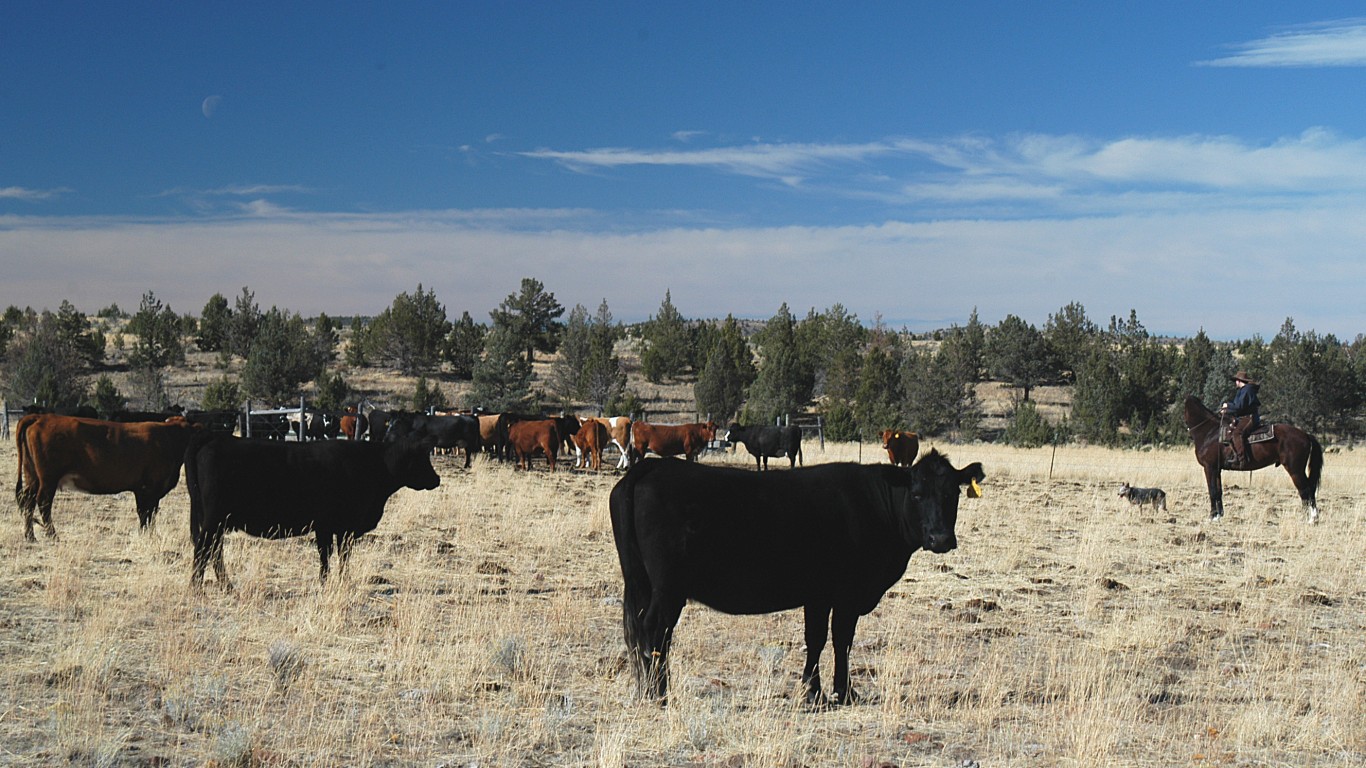
37. Oregon: Cattle
> Value of most important product: $695.3 million
> Total crop production: $4.9 billion (3rd largest)
> Pct. of workforce in agriculture: 12.1% (23rd smallest)
> Other major crops: Pears, grapes, and potatoes
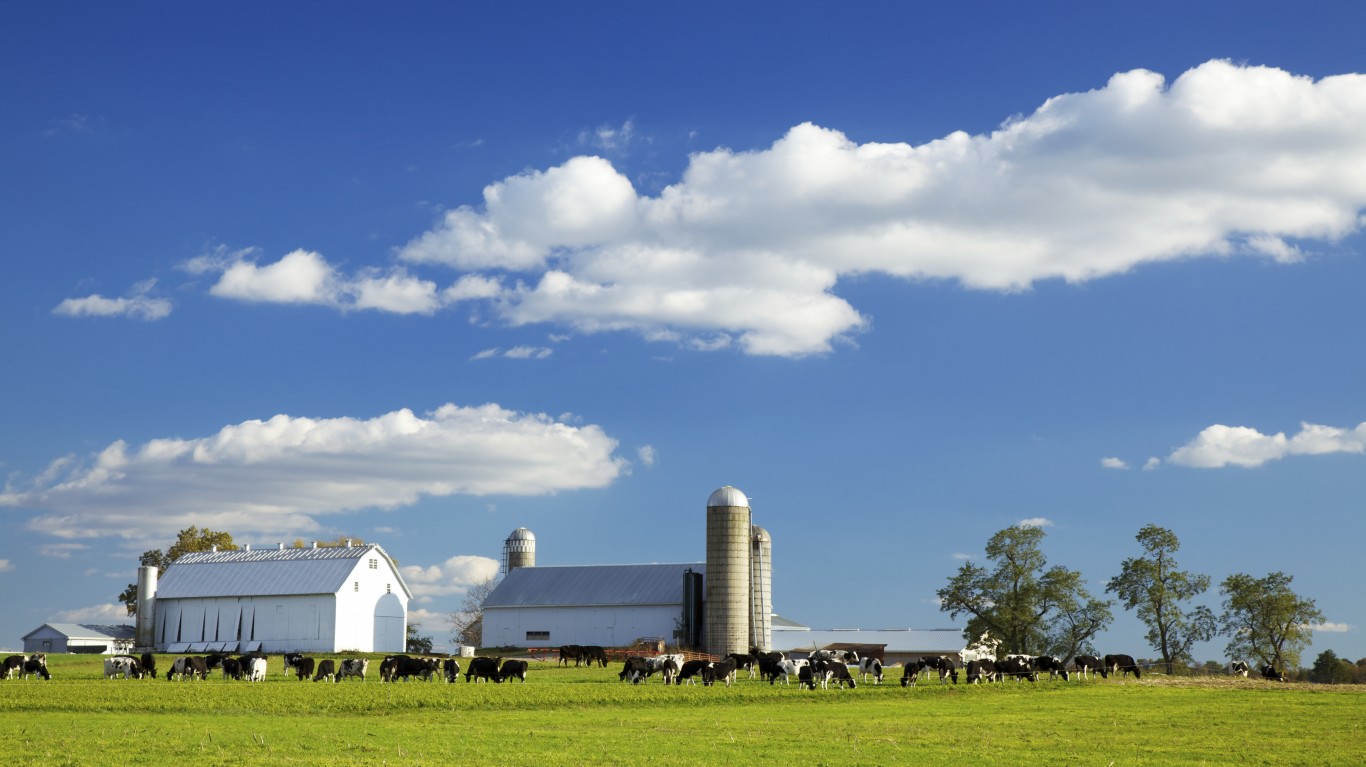
38. Pennsylvania: Cattle
> Value of most important product: $567.1 million
> Total crop production: $7.4 billion (12th smallest)
> Pct. of workforce in agriculture: 2.1% (22nd largest)
> Other major crops: Chickens, corn, and soybeans
[Need Manual Image]
39. Rhode Island: Cattle
> Value of most important product: $1.3 million
> Total crop production: $59.7 million (the smallest)
> Pct. of workforce in agriculture: 0.8% (2nd smallest)
> Other major crops: Corn
[in-text-ad-2]
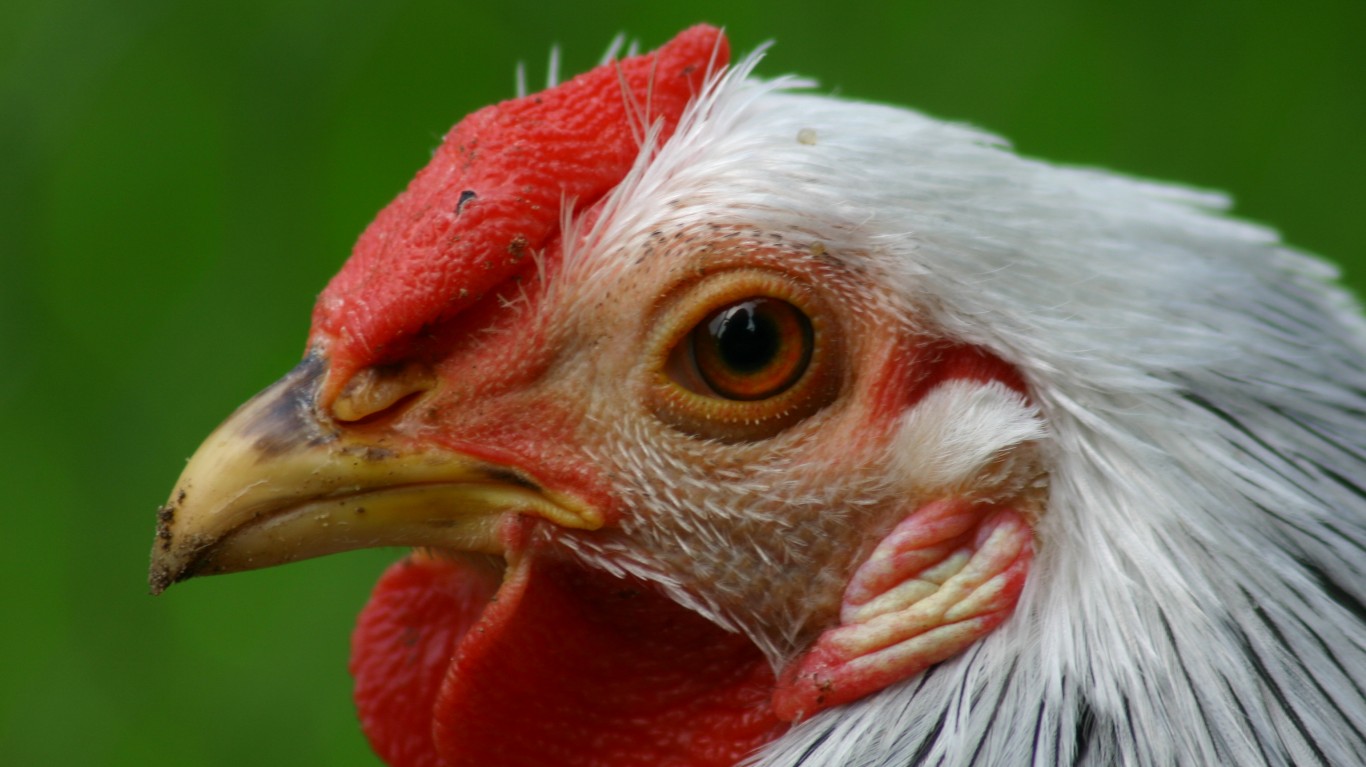
40. South Carolina: Chickens
> Value of most important product: $978.6 million
> Total crop production: $3.0 billion (15th smallest)
> Pct. of workforce in agriculture: 2.2% (17th smallest)
> Other major crops: Corn, soybeans, and cattle
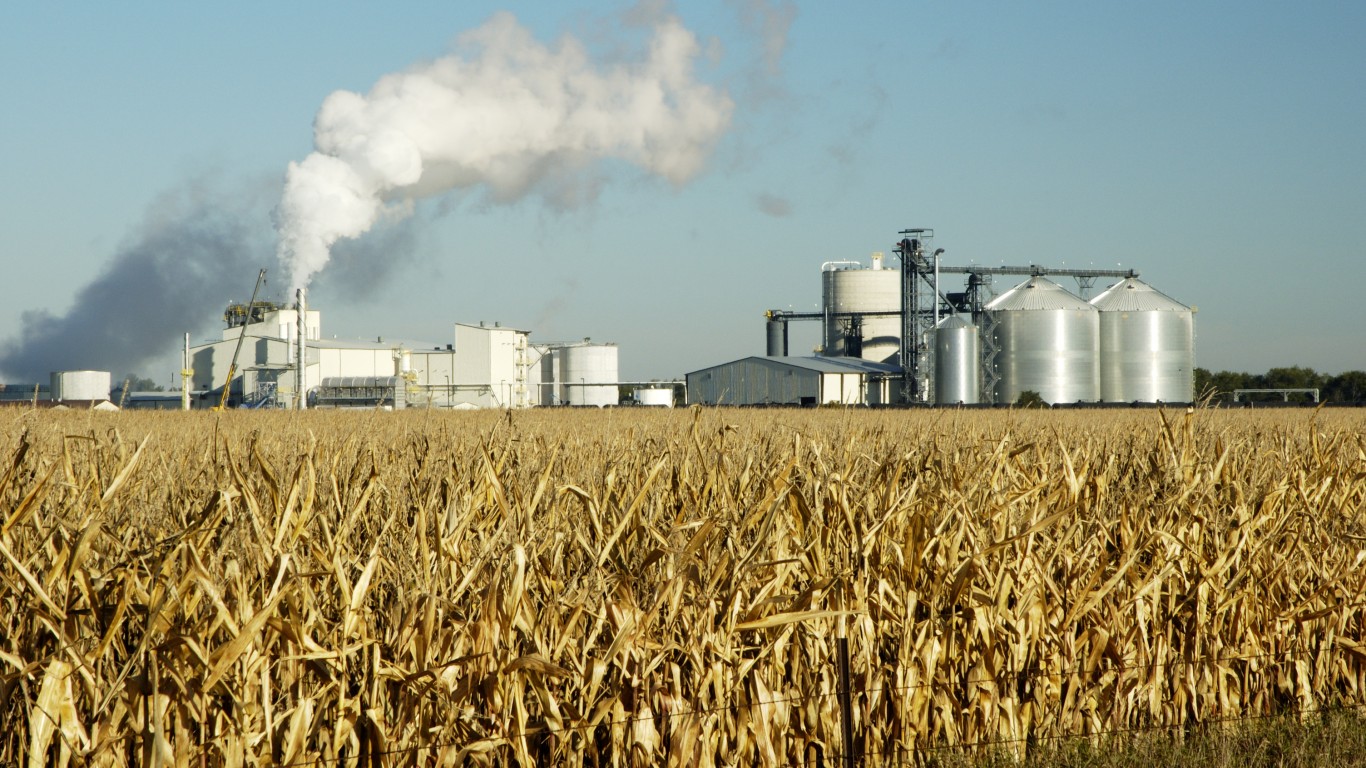
41. South Dakota: Corn
> Value of most important product: $2.2 billion
> Total crop production: $10.2 billion (4th largest)
> Pct. of workforce in agriculture: 11.2% (12th largest)
> Other major crops: Cattle, soybeans, and sunflower
[in-text-ad]
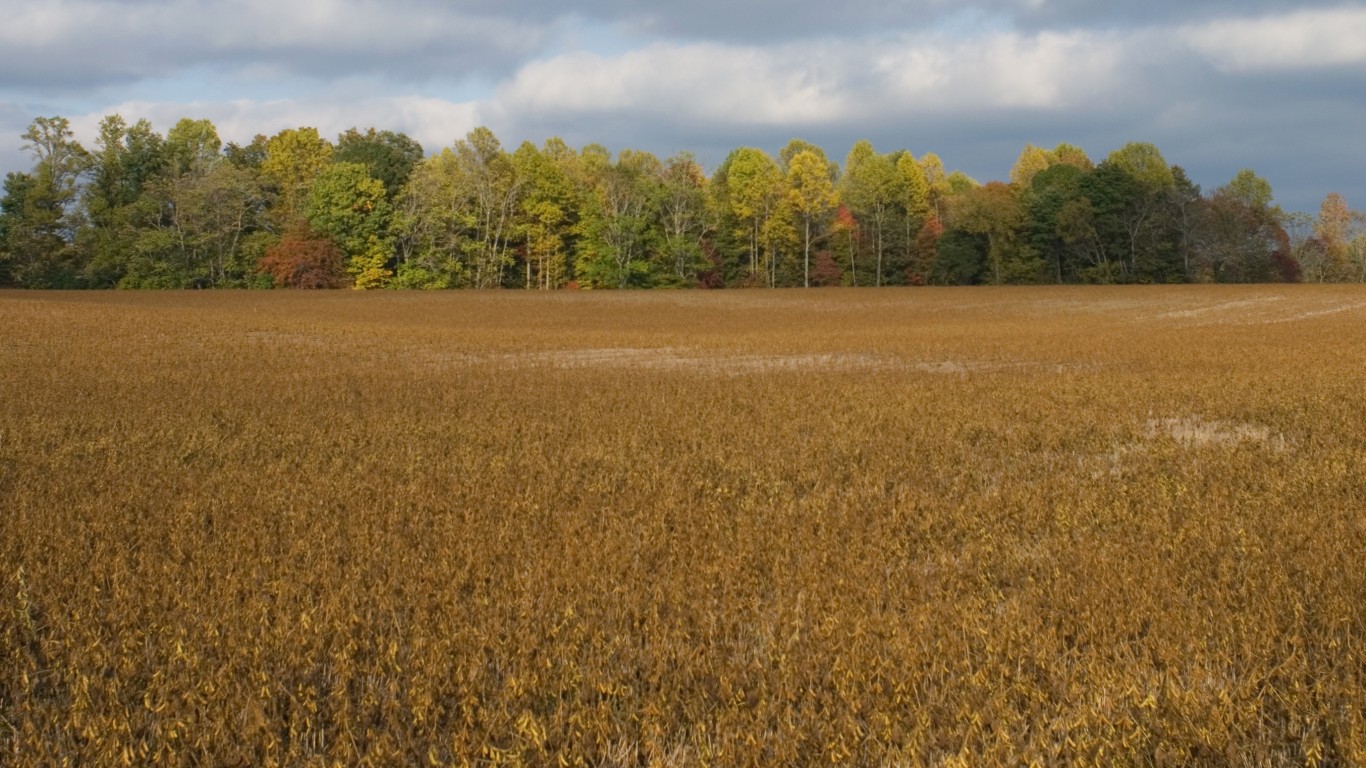
42. Tennessee: Soybeans
> Value of most important product: $805.1 million
> Total crop production: $3.6 billion (22nd smallest)
> Pct. of workforce in agriculture: 2.7% (18th smallest)
> Other major crops: Cattle, chickens, and corn
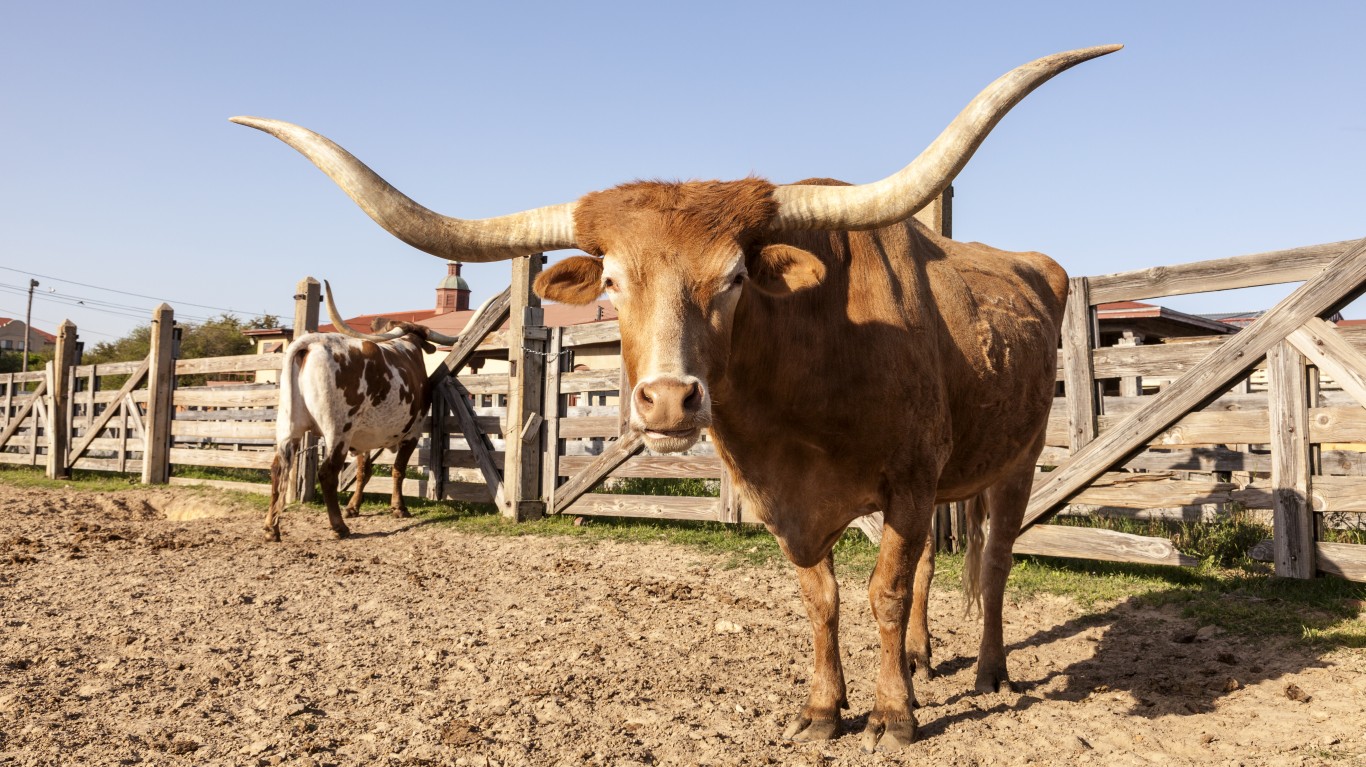
43. Texas: Cattle
> Value of most important product: $7.4 billion
> Total crop production: $25.4 billion (20th smallest)
> Pct. of workforce in agriculture: 2.5% (3rd largest)
> Other major crops: Chickens, corn, and sorghum
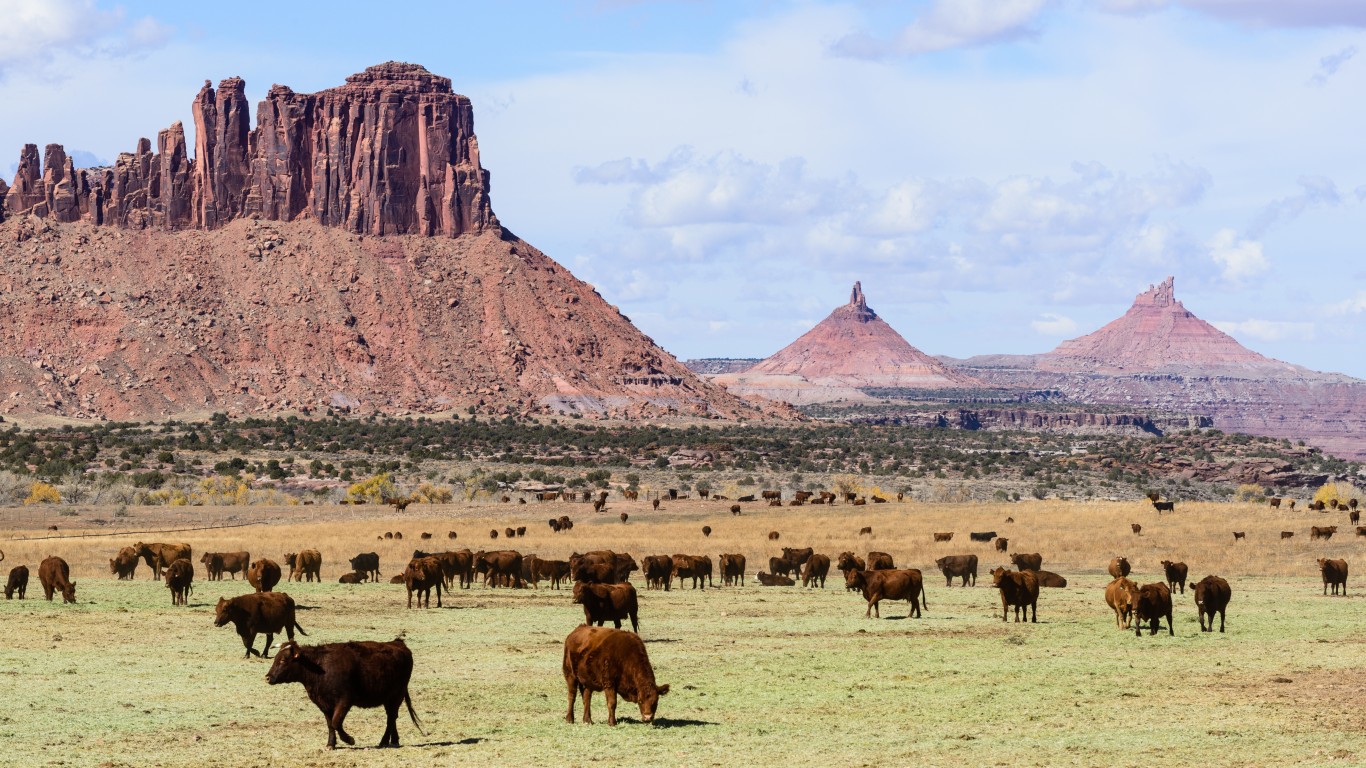
44. Utah: Cattle
> Value of most important product: $415.1 million
> Total crop production: $1.8 billion (21st smallest)
> Pct. of workforce in agriculture: 2.6% (14th smallest)
> Other major crops: Corn, cherries, and peaches
[in-text-ad-2]
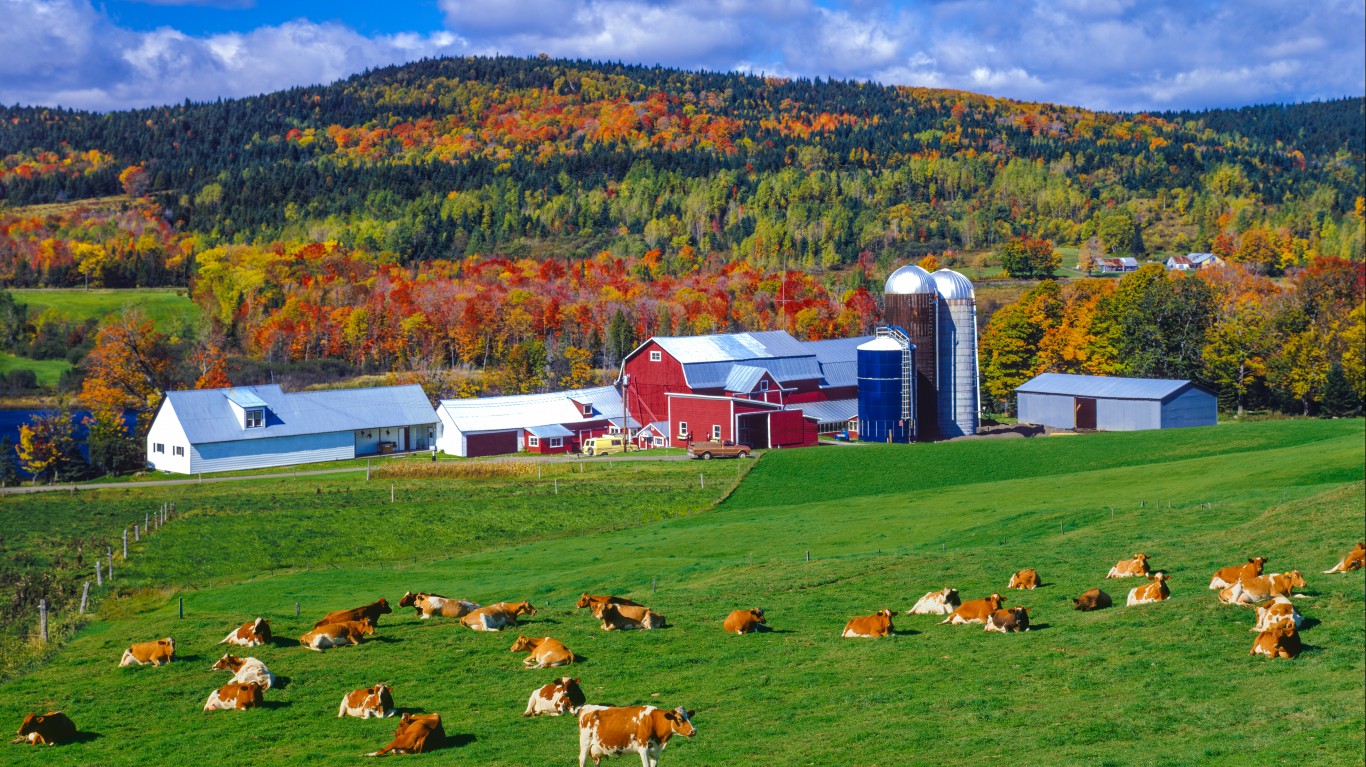
45. Vermont: Cattle
> Value of most important product: $62.7 million
> Total crop production: $776.1 million (12th largest)
> Pct. of workforce in agriculture: 5.8% (9th smallest)
> Other major crops: Maple Syrup and apples
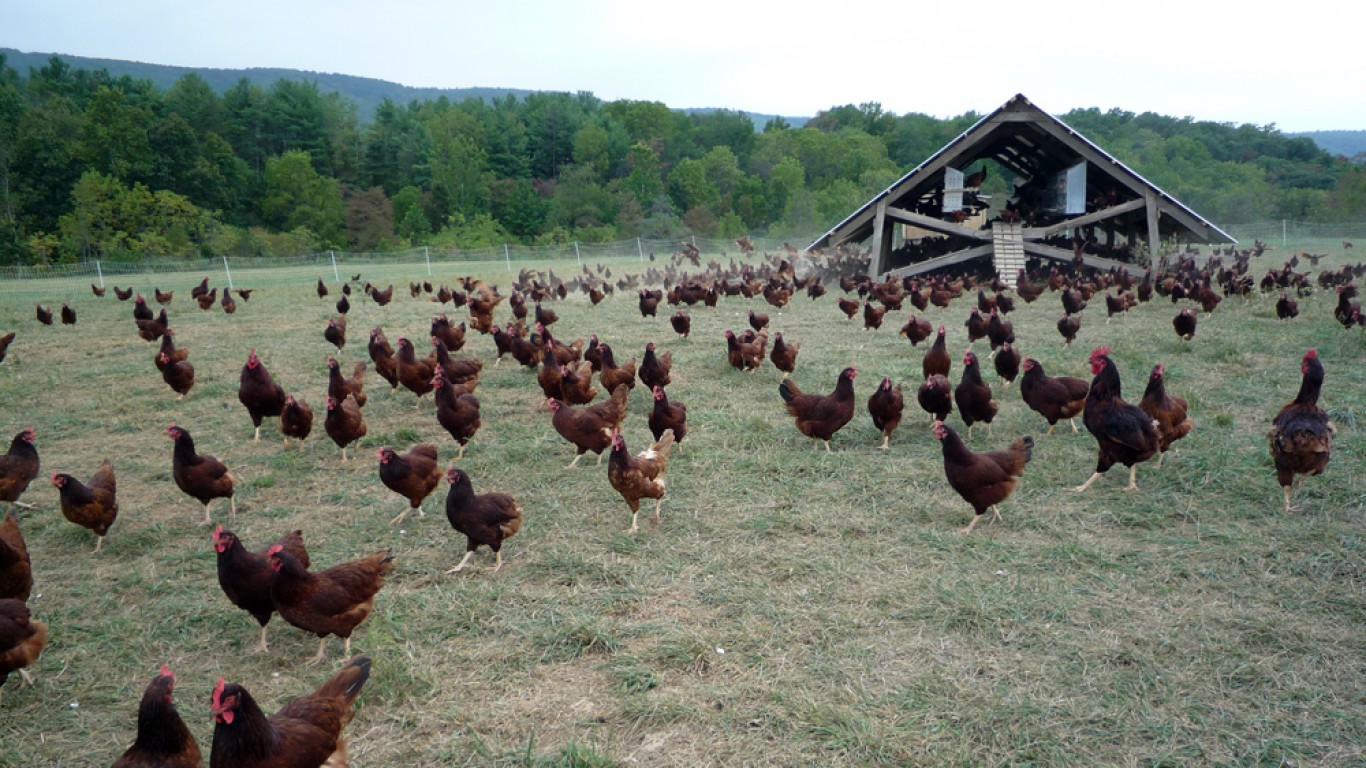
46. Virginia: Chickens
> Value of most important product: $875.2 million
> Total crop production: $3.8 billion (18th smallest)
> Pct. of workforce in agriculture: 2.4% (20th smallest)
> Other major crops: Cattle, soybeans, and corn
[in-text-ad]
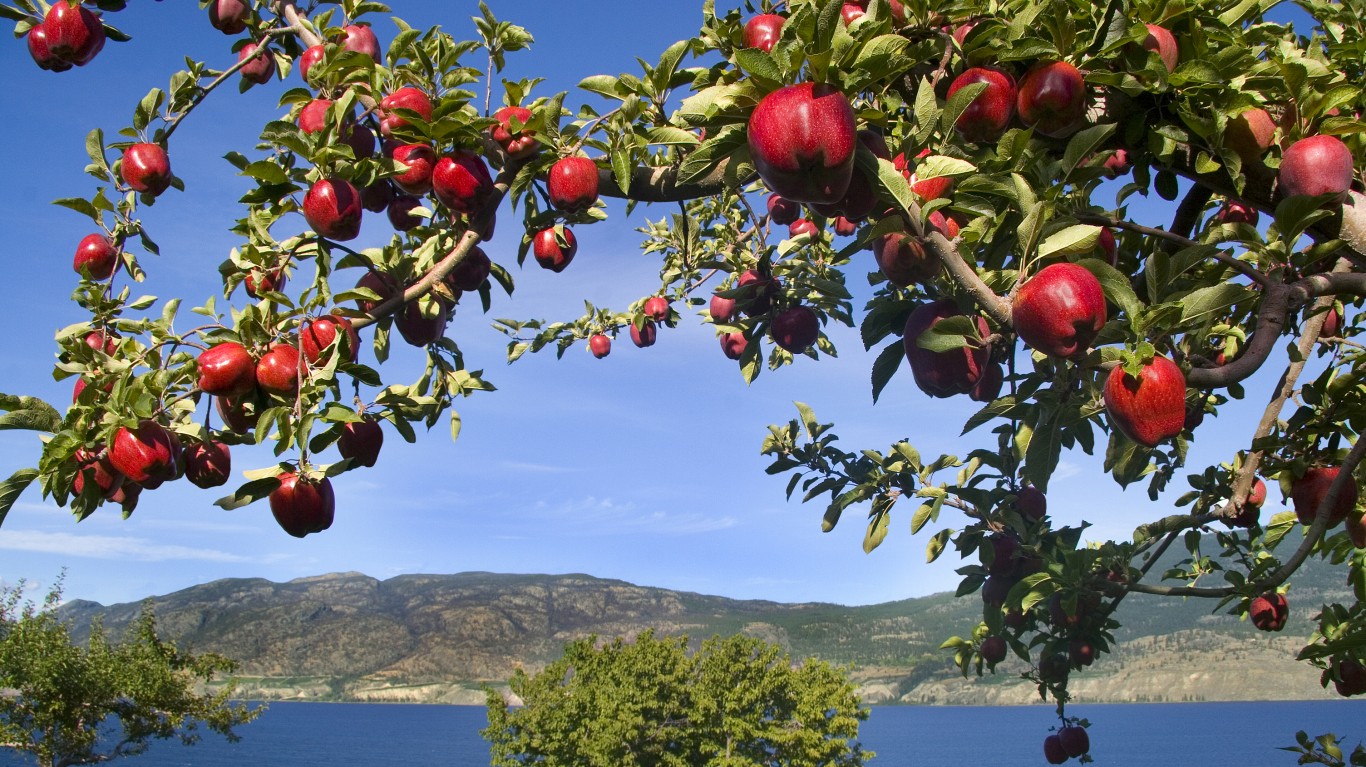
47. Washington: Apples
> Value of most important product: $2.4 billion
> Total crop production: $9.1 billion (the largest)
> Pct. of workforce in agriculture: 14.5% (17th largest)
> Other major crops: Potatoes, cattle, and hops

48. West Virginia: Chickens
> Value of most important product: $182.7 million
> Total crop production: $806.8 million (24th smallest)
> Pct. of workforce in agriculture: 2.7% (10th smallest)
> Other major crops: Cattle, corn, and apples
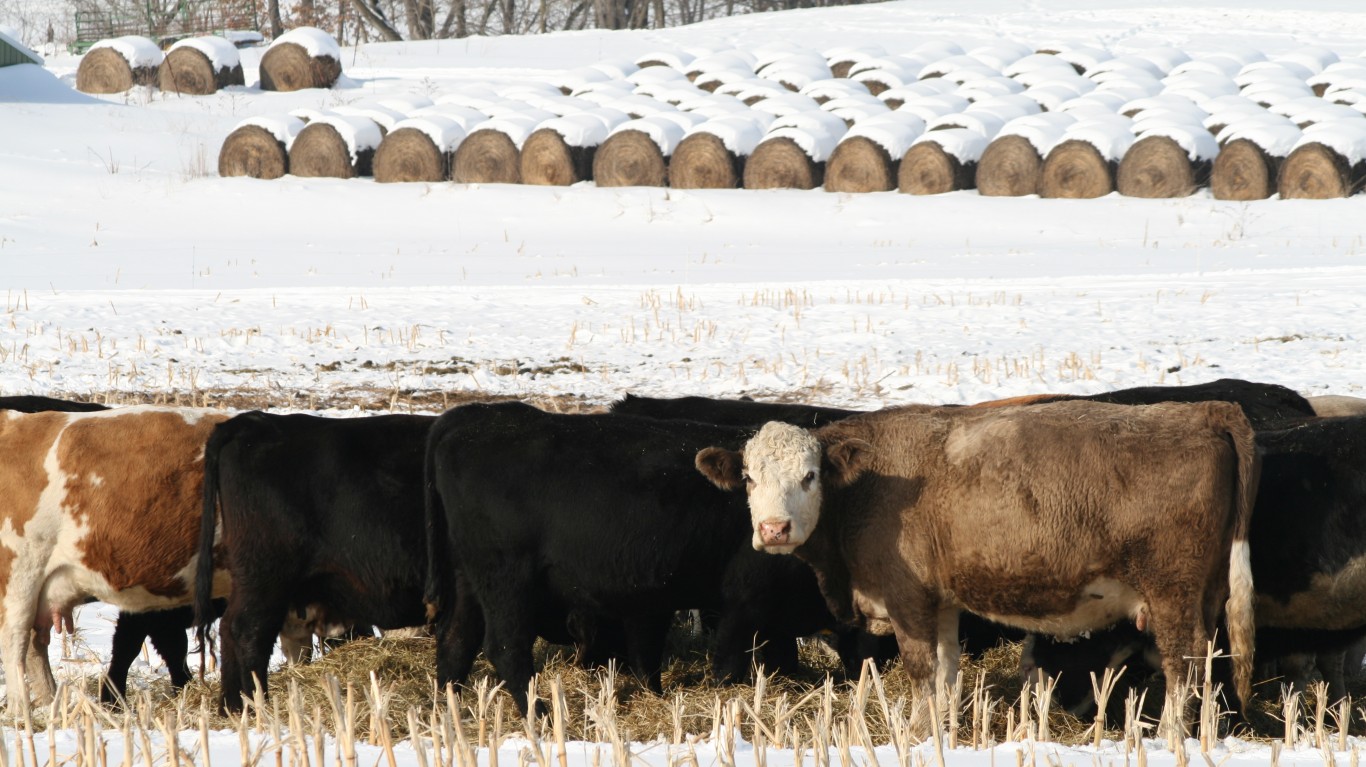
49. Wisconsin: Cattle
> Value of most important product: $1.7 billion
> Total crop production: $11.7 billion (20th largest)
> Pct. of workforce in agriculture: 4.7% (9th largest)
> Other major crops: Corn, soybeans, and potatoes
[in-text-ad-2]
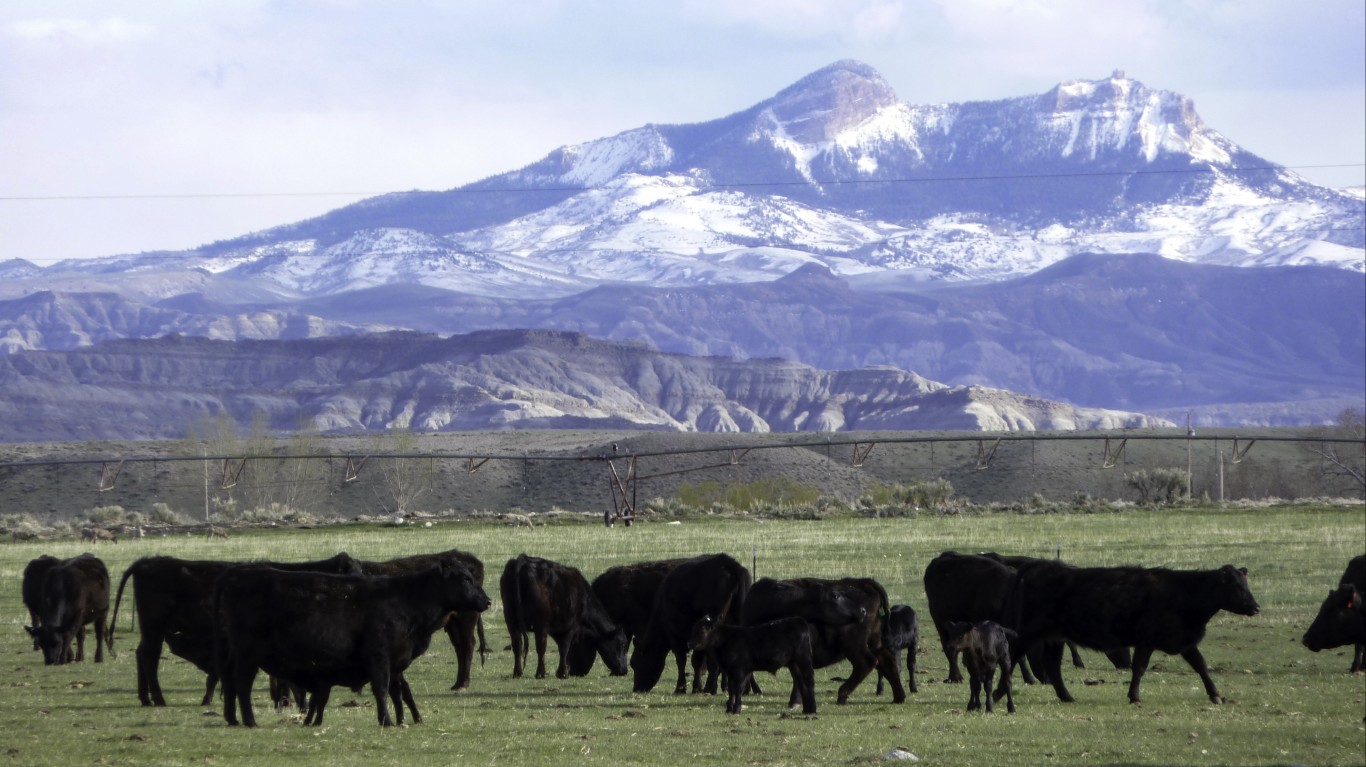
50. Wyoming: Cattle
> Value of most important product: $689.1 million
> Total crop production: $1.7 billion (11th largest)
> Pct. of workforce in agriculture: 6.3% (13th smallest)
> Other major crops: Corn, barley, and beans
Detailed Findings
In most states, the crop or livestock bringing in the most money is not unique to that state and is grown in large quantities throughout the country. In 30 states, for example, the most valuable agricultural product is either cattle or chickens.
Some states, however, have managed to cultivate as their main cash crop certain products not grown on a large scale in other parts of the country. Hawaii, for example, produced $53.9 million worth of macadamia nuts in 2017 — more than any other agricultural product in the state. The macadamia nut is native to Australia and was first introduced to Hawaii in 1882, where U.S. production remains concentrated today.
Other top crops unique to their state include Florida oranges, Massachusetts cranberries, New Jersey blueberries, Maine potatoes, and California grapes.
Methodology
To determine the most important agricultural product from each state, 24/7 Wall St. reviewed the total production value of approximately 170 agricultural commodities in 2017 using data from the United States Department of Agriculture’s National Agricultural Statistics Service. We considered livestock and plants and excluded non-food agricultural products, such as cotton, tobacco, and hay.
Data on the total value of all crops produced came from the USDA’s 2012 Census of Agriculture. Data on the size of the agricultural workforce in each state also came from the 2012 Census of Agriculture, and was adjusted for the size of the total workforce with data from the 2012 Economic Census. All data are for the most recent period available.
Start by taking a quick retirement quiz from SmartAsset that will match you with up to 3 financial advisors that serve your area and beyond in 5 minutes, or less.
Each advisor has been vetted by SmartAsset and is held to a fiduciary standard to act in your best interests.
Here’s how it works:
1. Answer SmartAsset advisor match quiz
2. Review your pre-screened matches at your leisure. Check out the advisors’ profiles.
3. Speak with advisors at no cost to you. Have an introductory call on the phone or introduction in person and choose whom to work with in the future
Get started right here.
Thank you for reading! Have some feedback for us?
Contact the 24/7 Wall St. editorial team.