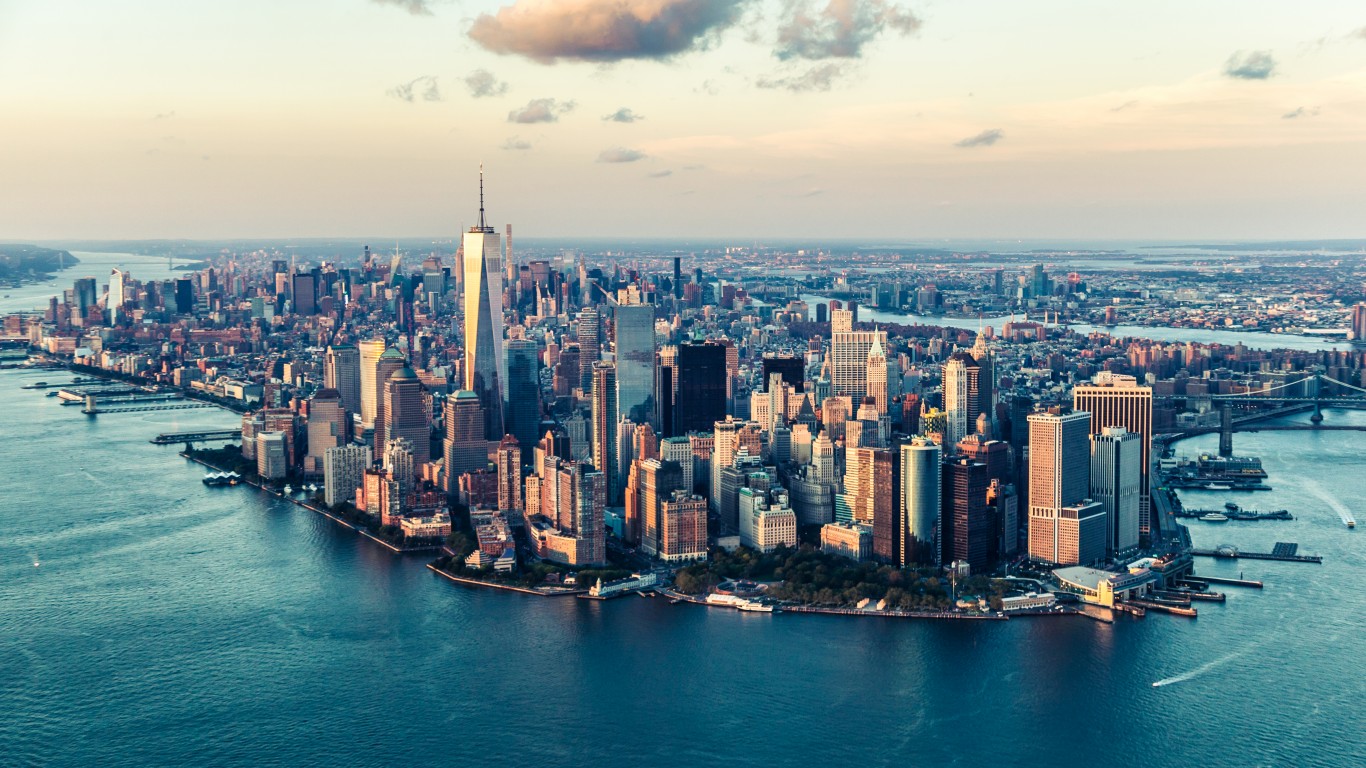
Living in a major metropolitan area has countless benefits. Cities are cultural hubs — they offer diverse and high-quality options for anything from food, health care, and education to music and art venues and much more. Major cities are hubs of employment, international travel, and shopping.
Of course, these many opportunities come at a price. Major American cities are often the most expensive places to live in the country. In New York City’s Manhattan borough, residents’ living expenses are about two and half times the average living expenditure nationwide.
Housing costs are the largest contributors to the higher costs of living in the most expensive major U.S. cities. In Manhattan, the typical home has a value of $870,000, and average monthly housing costs are over four times the average costs nationwide.
While it is true that the nation’s most highly populous cities tend to be more expensive — all but three of the over a dozen cities with at least 1 million people are more expensive on average than the U.S. average — this is not the case for all major cities. In fact, most of the roughly 20 cities with a population of between 500,000 and 1 million are less expensive than the United States as a whole. In some major cities, goods and services are considerably cheaper.
In Memphis, for example, the cost of living is just over 80% of the average cost of living nationwide. Housing expenses are, of course, a major contributors to the lower cost of living in these cities as well. In downtown Memphis, the typical home is worth less than $135,000, compared to a national median of $184,700.
To identify the cost of living in America’s major cities, 24/7 Wall St. reviewed the index created by The Council for Community and Economic Research of American cities. Based on counts from the U.S. Census Bureau’s 2017 population estimates, we listed the 50 most populous U.S. cities. We also retrieved the relative cost of housing and the average price of a half-gallon of milk from the C2ER. The median household income for each metro area came from the Census Bureau’s 2016 American Community Survey 5-year estimate.
| Urban area | Cost of living | Housing cost | 1/2 gallon milk | Median income |
|---|---|---|---|---|
| Albuquerque, NM | 4.1% lower than U.S. | 7.8% lower than U.S. | $1.80 | $49,711 |
| Atlanta, GA | 0.5% higher than U.S. | 1.4% higher than U.S. | $1.94 | $59,183 |
| Austin, TX | 1.5% lower than U.S. | 1.8% higher than U.S. | $1.67 | $66,093 |
| Baltimore, MD | 16.4% higher than U.S. | 46.6% higher than U.S. | $2.54 | $72,801 |
| Boston, MA | 47.4% higher than U.S. | 111.2% higher than U.S. | $1.93 | $77,809 |
| Charlotte, NC | 3.4% lower than U.S. | 13.4% lower than U.S. | $1.83 | $55,191 |
| Chicago, IL | 23.8% higher than U.S. | 58.8% higher than U.S. | $2.02 | $63,327 |
| Cleveland, OH | 0.6% lower than U.S. | 13.6% lower than U.S. | $1.87 | $51,001 |
| Colorado, Springs, CO | 2.2% lower than U.S. | 0.7% higher than U.S. | $1.66 | $60,335 |
| Columbus, OH | 9.2% lower than U.S. | 21.2% lower than U.S. | $1.45 | $57,440 |
| Dallas, TX | 4.3% higher than U.S. | 6.8% higher than U.S. | $2.25 | $61,330 |
| Denver, CO | 11.9% higher than U.S. | 36.3% higher than U.S. | $1.71 | $68,173 |
| Detroit, MI | 4.2% lower than U.S. | 6.3% lower than U.S. | $1.51 | $54,037 |
| El Paso, TX | 11.7% lower than U.S. | 20.7% lower than U.S. | $1.88 | $42,023 |
| Fort, Worth, TX | 1.2% lower than U.S. | 8.5% lower than U.S. | $1.61 | $61,330 |
| Houston, TX | 2.5% lower than U.S. | 2.4% higher than U.S. | $1.33 | $60,902 |
| Indianapolis, IN | 6.9% lower than U.S. | 19.8% lower than U.S. | $1.40 | $54,261 |
| Jacksonville, FL | 6.2% lower than U.S. | 10.5% lower than U.S. | $2.38 | $53,661 |
| Joliet-Will County, IL | 0.2% higher than U.S. | 2.5% higher than U.S. | $2.33 | $63,327 |
| Kansas City, MO-KS | 5.3% lower than U.S. | 15.2% lower than U.S. | $2.20 | $59,344 |
| Las Vegas, NV | 3.3% higher than U.S. | 10.8% higher than U.S. | $1.86 | $52,629 |
| Los Angeles-Long, Beach, CA | 48.2% higher than U.S. | 141.6% higher than U.S. | $2.14 | $62,216 |
| Louisville, KY | 7.4% lower than U.S. | 21.4% lower than U.S. | $1.71 | $52,437 |
| Memphis, TN | 18.6% lower than U.S. | 33.3% lower than U.S. | $1.82 | $48,545 |
| Miami-Dade, County FL | 15.3% higher than U.S. | 46.5% higher than U.S. | $2.61 | $50,064 |
| Milwaukee-Waukesha, WI | 3.7% lower than U.S. | 4.6% lower than U.S. | $1.77 | $55,625 |
| Minneapolis, MN | 5.6% higher than U.S. | 4.6% higher than U.S. | $2.38 | $70,915 |
| Nashville-Murfreesboro, TN | 1.4% lower than U.S. | 7.7% lower than U.S. | $1.79 | $56,152 |
| New Orleans, LA | 0.6% higher than U.S. | 13.9% higher than U.S. | $2.60 | $48,319 |
| Brooklyn, NY | 80.8% higher than U.S. | 225.7% higher than U.S. | $2.82 | $69,211 |
| Manhattan, NY | 142.4% higher than U.S. | 414.1% higher than U.S. | $3.04 | $69,211 |
| Queens, NY | 49.7% higher than U.S. | 127.7% higher than U.S. | $3.24 | $69,211 |
| Oakland, CA | 51.5% higher than U.S. | 121.6% higher than U.S. | $3.15 | $85,947 |
| Oklahoma City, OK | 14.7% lower than U.S. | 27% lower than U.S. | $1.99 | $52,825 |
| Omaha, NE | 6% lower than U.S. | 10.4% lower than U.S. | $1.68 | $59,803 |
| Orange County, CA | 50.5% higher than U.S. | 152.6% higher than U.S. | $2.13 | $62,216 |
| Philadelphia, PA | 14.8% higher than U.S. | 28.1% higher than U.S. | $2.06 | $63,952 |
| Phoenix, AZ | 3.2% lower than U.S. | 5.1% lower than U.S. | $1.46 | $55,227 |
| Portland, OR | 30.7% higher than U.S. | 81.5% higher than U.S. | $1.85 | $62,772 |
| Raleigh, NC | 6.2% lower than U.S. | 14.9% lower than U.S. | $1.71 | $65,834 |
| Sacramento, CA | 18.9% higher than U.S. | 37.9% higher than U.S. | $2.72 | $61,686 |
| San Antonio, TX | 11.7% lower than U.S. | 20.3% lower than U.S. | $1.78 | $54,638 |
| San Diego, CA | 46.3% higher than U.S. | 135.9% higher than U.S. | $2.13 | $66,529 |
| San Francisco, CA | 94.7% higher than U.S. | 263.4% higher than U.S. | $2.78 | $85,947 |
| Seattle, WA | 51.9% higher than U.S. | 107.5% higher than U.S. | $1.94 | $73,044 |
| Tucson, AZ | 6.1% lower than U.S. | 20.7% lower than U.S. | $1.48 | $46,764 |
| Tulsa, OK | 11.3% lower than U.S. | 34.6% lower than U.S. | $2.18 | $50,950 |
| Washington-Arlington-Alexandria, DC-VA | 58.9% higher than U.S. | 163.4% higher than U.S. | $2.43 | $93,804 |
| Wichita, KS | 8.3% lower than U.S. | 28.7% lower than U.S. | $1.37 | $52,068 |
| York County, PA | 3.3% lower than U.S. | 9% lower than U.S. | $1.98 | $59,853 |
The Average American Has No Idea How Much Money You Can Make Today (Sponsor)
The last few years made people forget how much banks and CD’s can pay. Meanwhile, interest rates have spiked and many can afford to pay you much more, but most are keeping yields low and hoping you won’t notice.
But there is good news. To win qualified customers, some accounts are paying almost 10x the national average! That’s an incredible way to keep your money safe and earn more at the same time. Our top pick for high yield savings accounts includes other benefits as well. You can earn up to 3.80% with a Checking & Savings Account today Sign up and get up to $300 with direct deposit. No account fees. FDIC Insured.
Click here to see how much more you could be earning on your savings today. It takes just a few minutes to open an account to make your money work for you.
Our top pick for high yield savings accounts includes other benefits as well. You can earn up to 4.00% with a Checking & Savings Account from Sofi. Sign up and get up to $300 with direct deposit. No account fees. FDIC Insured.
Thank you for reading! Have some feedback for us?
Contact the 24/7 Wall St. editorial team.


