Special Report
These Cities Will Lose the Most Jobs to Automation

Published:
Last Updated:

The steady pace of technological developments continues to change the outlook on work. Some developments lead to optimism and others to fear, as the future of labor — if nothing else — will be vastly different than it is today.
The proliferation of automated tasks over the last three decades — commonly referred to as the Digital Revolution — led to a slight increase in the number of jobs, not mass joblessness as was feared. Yet massive changes in the way work is done preceded that outcome. Entire industries that adopted automated processed such as the use of industrial robots and computing technologies, for example, shed massive numbers of workers. This trend is far from over.
At least 70% of tasks performed in approximately 25% of jobs in the United States (36 million) could soon be substituted by automated techniques, according to a new report by the Brookings Institution’s Metropolitan Policy Program. These 36 million jobs are the most vulnerable to automation. Almost all occupations will be automated to some degree.
The intensity of the effects will be highest in industries that require predictable tasks. According to Brookings, office administration, production, transportation, and food preparation occupations will be most vulnerable to automation.
The risk posed by automation to job security varies across regions, states, and cities. 24/7 Wall St. reviewed metropolitan area labor markets to find those that are most vulnerable to automation. We used data published this January in the Brookings Institution’s Metropolitan Policy Program.
Click here to see the cities at the greatest risk of automation.
Click here to see our detailed findings and full methodology.
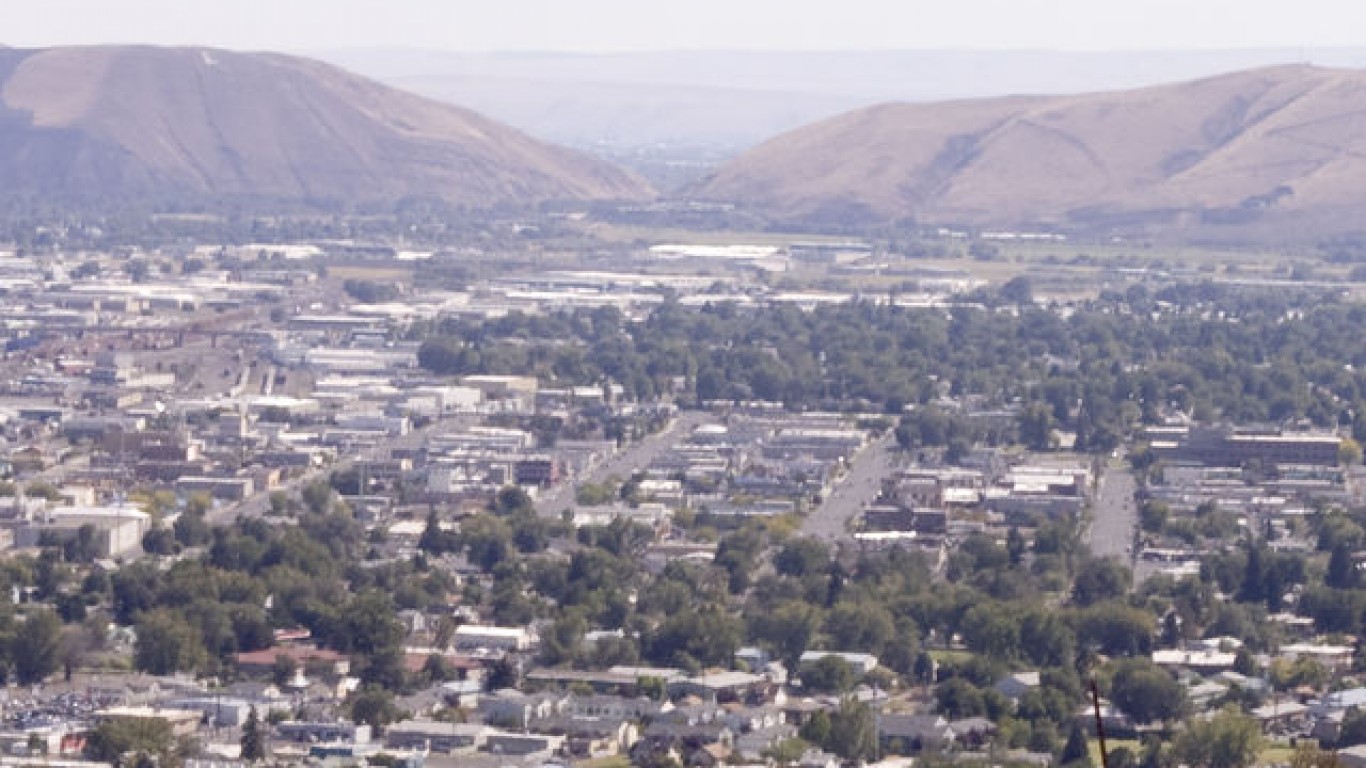
50. Yakima, WA
> Automatable share of work: 49.4% of tasks
> Percent of adults with at least a bachelor’s degree: 17.6%
> Civilians employed in manufacturing: 9.2%
> Population: 250,193
[in-text-ad]

49. Oshkosh-Neenah, WI
> Automatable share of work: 49.4% of tasks
> Percent of adults with at least a bachelor’s degree: 29.5%
> Civilians employed in manufacturing: 22.5%
> Population: 170,414

48. College Station-Bryan, TX
> Automatable share of work: 49.4% of tasks
> Percent of adults with at least a bachelor’s degree: 36.1%
> Civilians employed in manufacturing: 8.0%
> Population: 258,860
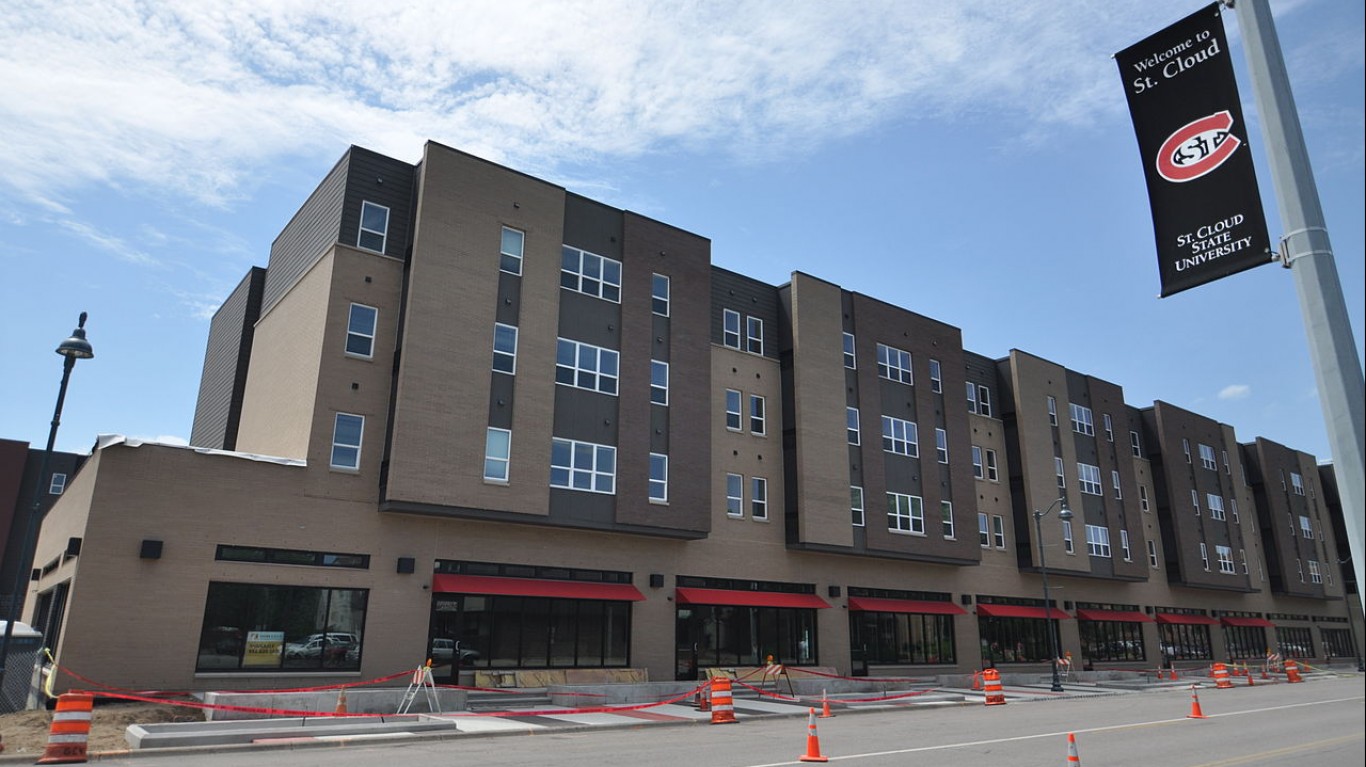
47. St. Cloud, MN
> Automatable share of work: 49.4% of tasks
> Percent of adults with at least a bachelor’s degree: 29.0%
> Civilians employed in manufacturing: 14.4%
> Population: 197,759
[in-text-ad-2]

46. Springfield, OH
> Automatable share of work: 49.4% of tasks
> Percent of adults with at least a bachelor’s degree: 20.1%
> Civilians employed in manufacturing: 16.0%
> Population: 134,557

45. Longview, TX
> Automatable share of work: 49.5% of tasks
> Percent of adults with at least a bachelor’s degree: 18.2%
> Civilians employed in manufacturing: 9.8%
> Population: 217,481
[in-text-ad]

44. Salisbury, MD-DE
> Automatable share of work: 49.5% of tasks
> Percent of adults with at least a bachelor’s degree: 27.8%
> Civilians employed in manufacturing: 7.6%
> Population: 405,853

43. Tuscaloosa, AL
> Automatable share of work: 49.5% of tasks
> Percent of adults with at least a bachelor’s degree: 29.4%
> Civilians employed in manufacturing: 13.1%
> Population: 242,279

42. Modesto, CA
> Automatable share of work: 49.6% of tasks
> Percent of adults with at least a bachelor’s degree: 17.5%
> Civilians employed in manufacturing: 12.3%
> Population: 547,899
[in-text-ad-2]
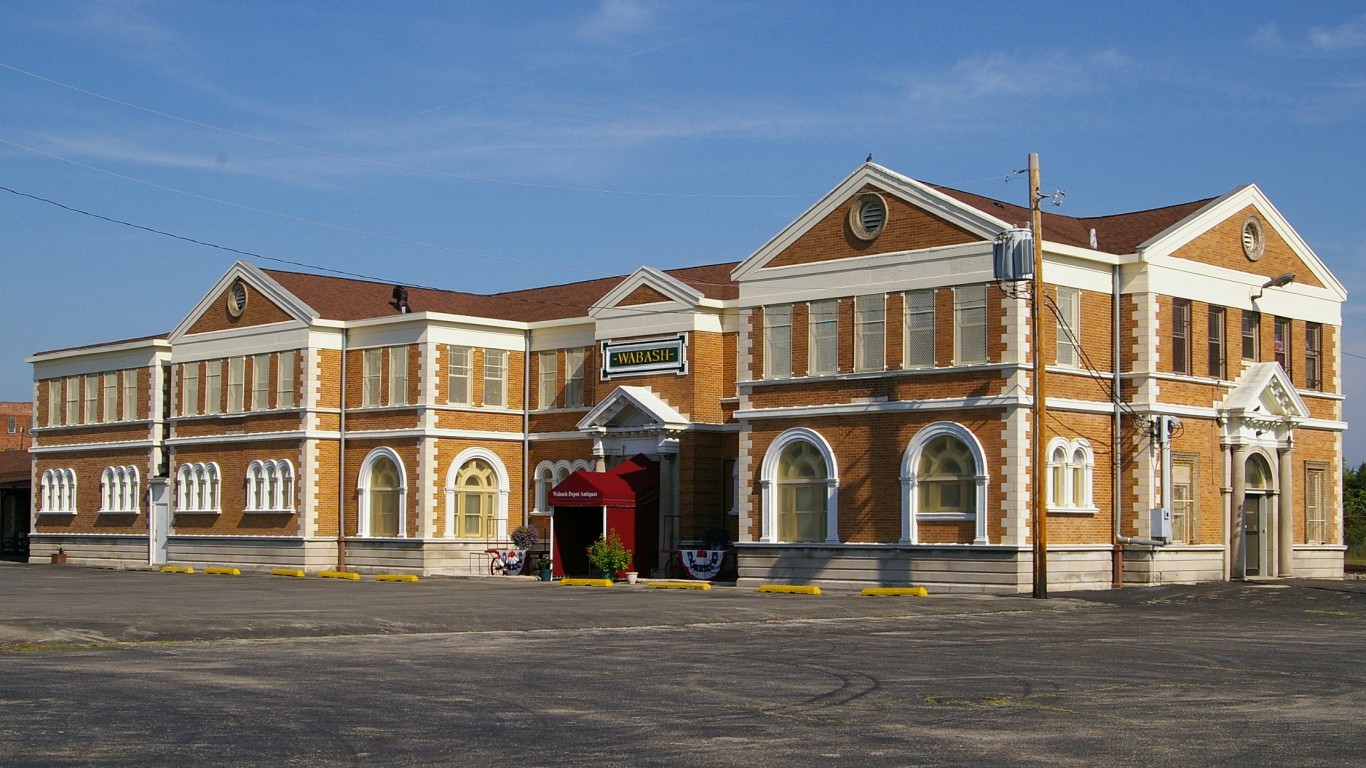
41. Decatur, IL
> Automatable share of work: 49.6% of tasks
> Percent of adults with at least a bachelor’s degree: 23.2%
> Civilians employed in manufacturing: 16.5%
> Population: 105,801

40. Longview, WA
> Automatable share of work: 49.7% of tasks
> Percent of adults with at least a bachelor’s degree: 17.3%
> Civilians employed in manufacturing: 16.5%
> Population: 106,910
[in-text-ad]

39. Canton-Massillon, OH
> Automatable share of work: 49.7% of tasks
> Percent of adults with at least a bachelor’s degree: 21.6%
> Civilians employed in manufacturing: 18.6%
> Population: 399,927
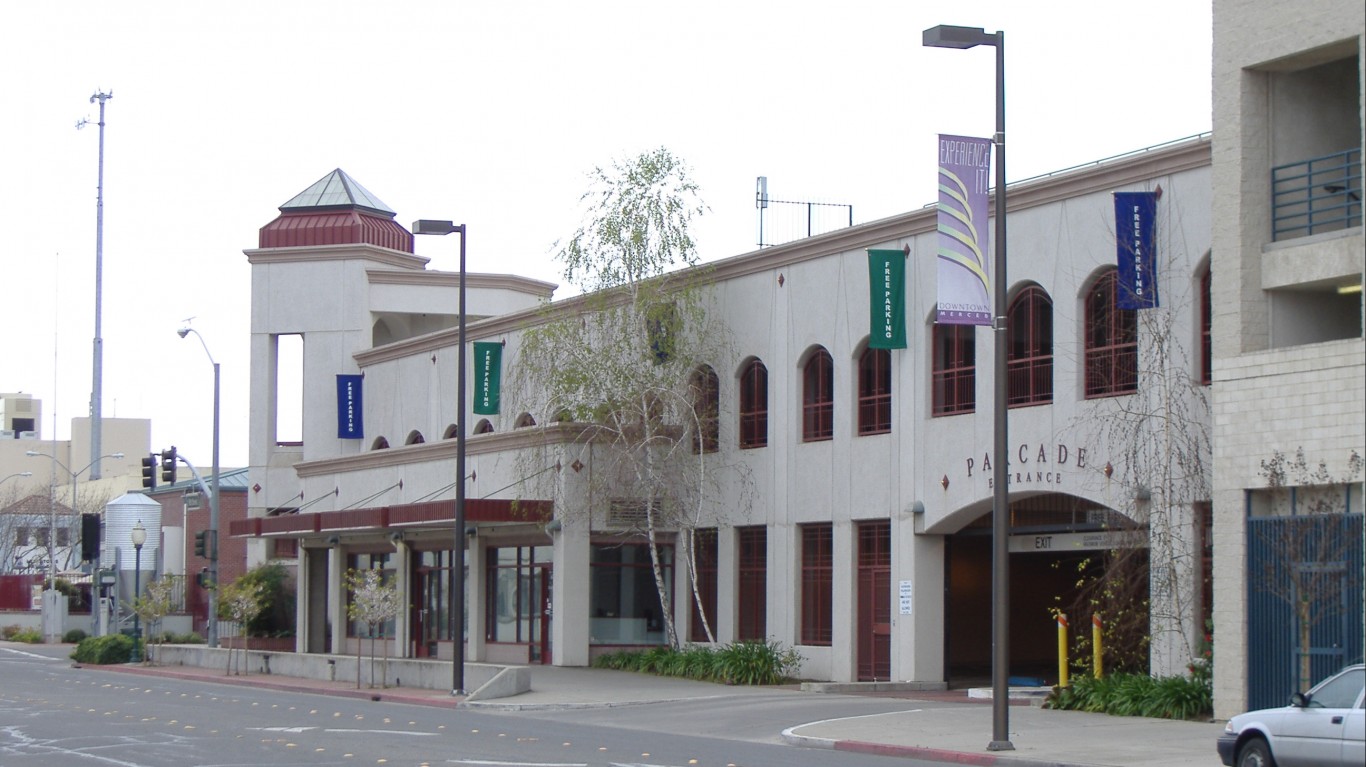
38. Merced, CA
> Automatable share of work: 49.7% of tasks
> Percent of adults with at least a bachelor’s degree: 13.4%
> Civilians employed in manufacturing: 11.0%
> Population: 272,673
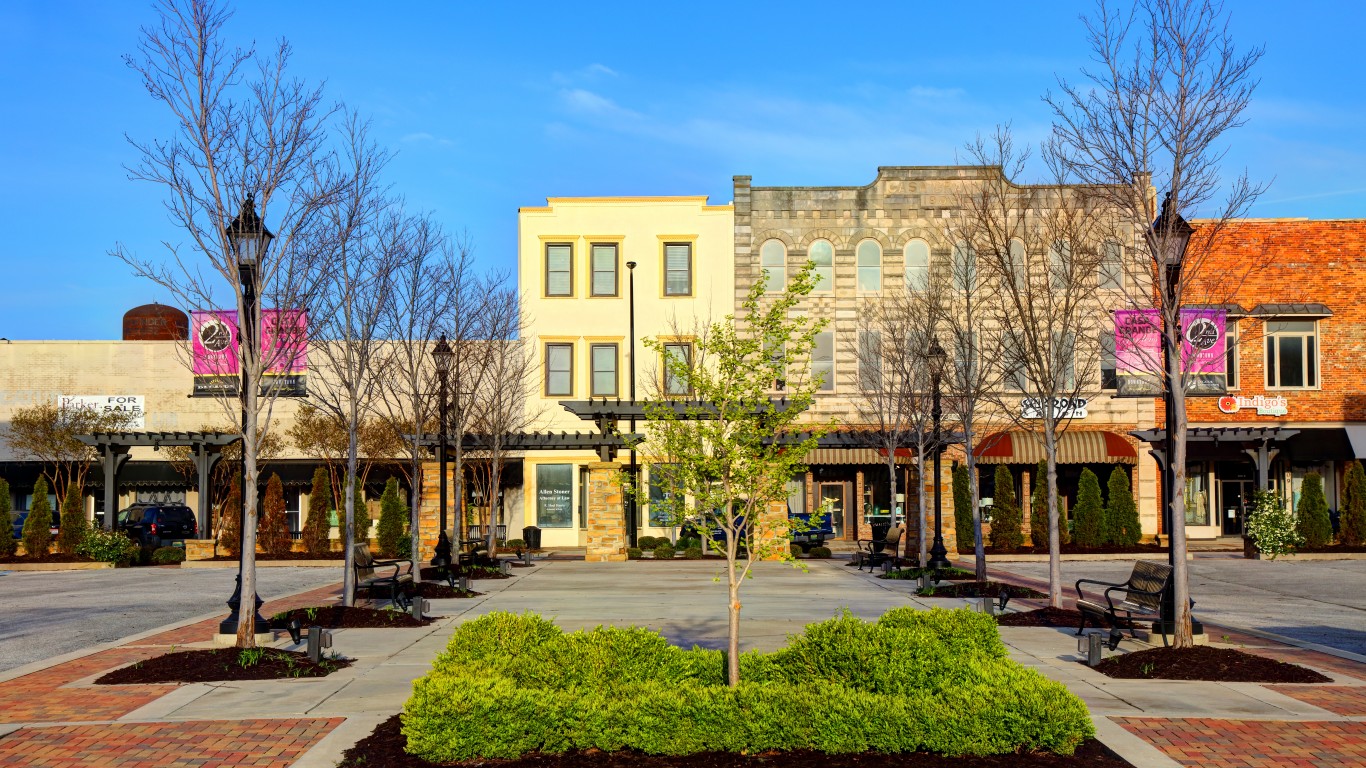
37. Decatur, AL
> Automatable share of work: 49.8% of tasks
> Percent of adults with at least a bachelor’s degree: 18.5%
> Civilians employed in manufacturing: 20.6%
> Population: 151,867
[in-text-ad-2]

36. Bowling Green, KY
> Automatable share of work: 49.8% of tasks
> Percent of adults with at least a bachelor’s degree: 23.9%
> Civilians employed in manufacturing: 20.4%
> Population: 178,474

35. Lewiston, ID-WA
> Automatable share of work: 49.9% of tasks
> Percent of adults with at least a bachelor’s degree: 23.8%
> Civilians employed in manufacturing: 14.1%
> Population: 62,921
[in-text-ad]

34. Danville, IL
> Automatable share of work: 50.0% of tasks
> Percent of adults with at least a bachelor’s degree: 16.8%
> Civilians employed in manufacturing: 13.9%
> Population: 77,909

33. Weirton-Steubenville, WV-OH
> Automatable share of work: 50.0% of tasks
> Percent of adults with at least a bachelor’s degree: 16.7%
> Civilians employed in manufacturing: 11.5%
> Population: 119,664

32. Anniston-Oxford-Jacksonville, AL
> Automatable share of work: 50.1% of tasks
> Percent of adults with at least a bachelor’s degree: 19.3%
> Civilians employed in manufacturing: 21.3%
> Population: 114,728
[in-text-ad-2]
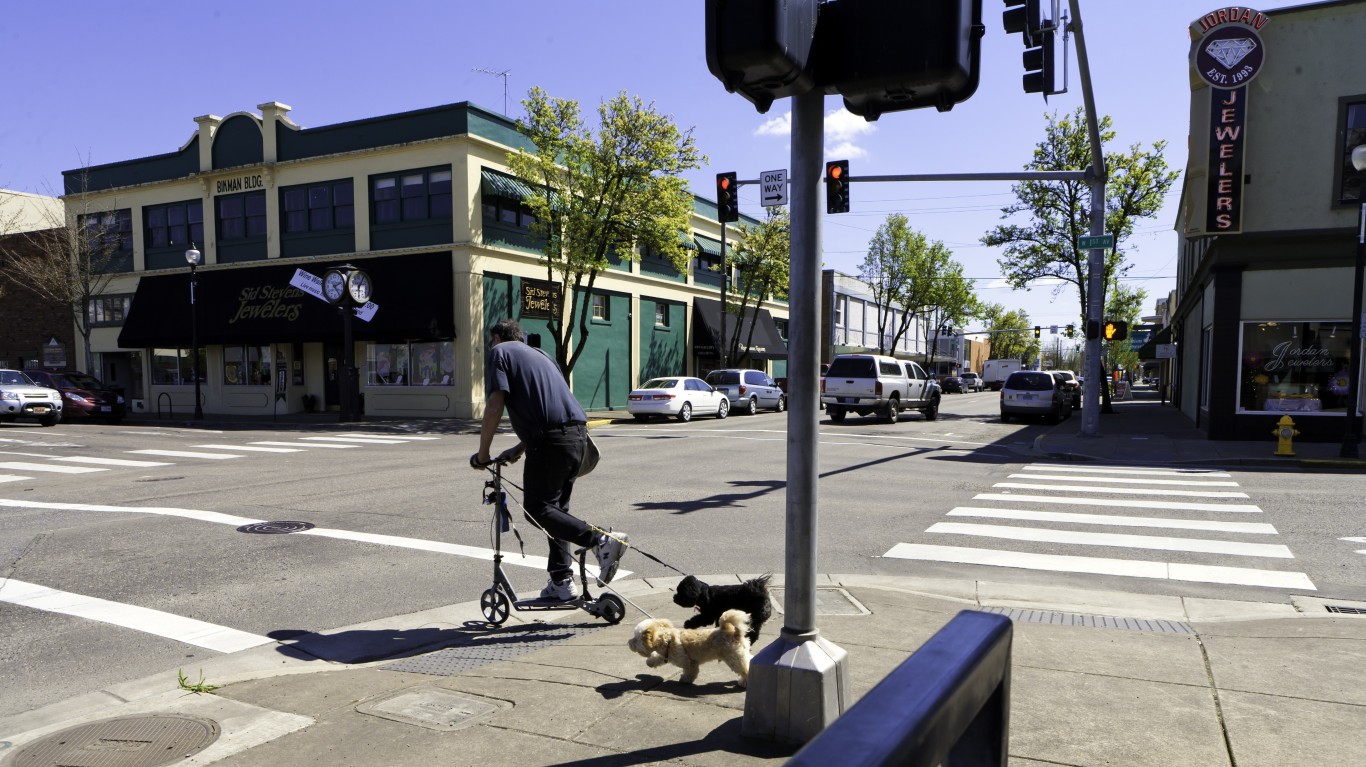
31. Albany, OR
> Automatable share of work: 50.1% of tasks
> Percent of adults with at least a bachelor’s degree: 17.3%
> Civilians employed in manufacturing: 16.1%
> Population: 125,047

30. Lafayette-West Lafayette, IN
> Automatable share of work: 50.1% of tasks
> Percent of adults with at least a bachelor’s degree: 36.6%
> Civilians employed in manufacturing: 16.9%
> Population: 218,769
[in-text-ad]

29. Greeley, CO
> Automatable share of work: 50.1% of tasks
> Percent of adults with at least a bachelor’s degree: 27.5%
> Civilians employed in manufacturing: 9.6%
> Population: 304,633

28. Lebanon, PA
> Automatable share of work: 50.1% of tasks
> Percent of adults with at least a bachelor’s degree: 22.2%
> Civilians employed in manufacturing: 14.8%
> Population: 139,754

27. Cleveland, TN
> Automatable share of work: 50.1% of tasks
> Percent of adults with at least a bachelor’s degree: 20.5%
> Civilians employed in manufacturing: 21.2%
> Population: 123,935
[in-text-ad-2]

26. Wausau, WI
> Automatable share of work: 50.1% of tasks
> Percent of adults with at least a bachelor’s degree: 25.8%
> Civilians employed in manufacturing: 20.7%
> Population: 135,732

25. Gainesville, GA
> Automatable share of work: 50.2% of tasks
> Percent of adults with at least a bachelor’s degree: 26.3%
> Civilians employed in manufacturing: 17.6%
> Population: 199,335
[in-text-ad]

24. Columbus, IN
> Automatable share of work: 50.3% of tasks
> Percent of adults with at least a bachelor’s degree: 35.1%
> Civilians employed in manufacturing: 36.4%
> Population: 82,040

23. Mansfield, OH
> Automatable share of work: 50.4% of tasks
> Percent of adults with at least a bachelor’s degree: 18.8%
> Civilians employed in manufacturing: 20.7%
> Population: 120,589

22. Auburn-Opelika, AL
> Automatable share of work: 50.5% of tasks
> Percent of adults with at least a bachelor’s degree: 33.4%
> Civilians employed in manufacturing: 14.2%
> Population: 161,604
[in-text-ad-2]

21. Terre Haute, IN
> Automatable share of work: 50.6% of tasks
> Percent of adults with at least a bachelor’s degree: 19.3%
> Civilians employed in manufacturing: 16.3%
> Population: 165,798

20. Sheboygan, WI
> Automatable share of work: 50.6% of tasks
> Percent of adults with at least a bachelor’s degree: 25.2%
> Civilians employed in manufacturing: 31.0%
> Population: 115,344
[in-text-ad]

19. Muskegon, MI
> Automatable share of work: 50.7% of tasks
> Percent of adults with at least a bachelor’s degree: 19.4%
> Civilians employed in manufacturing: 28.5%
> Population: 173,693
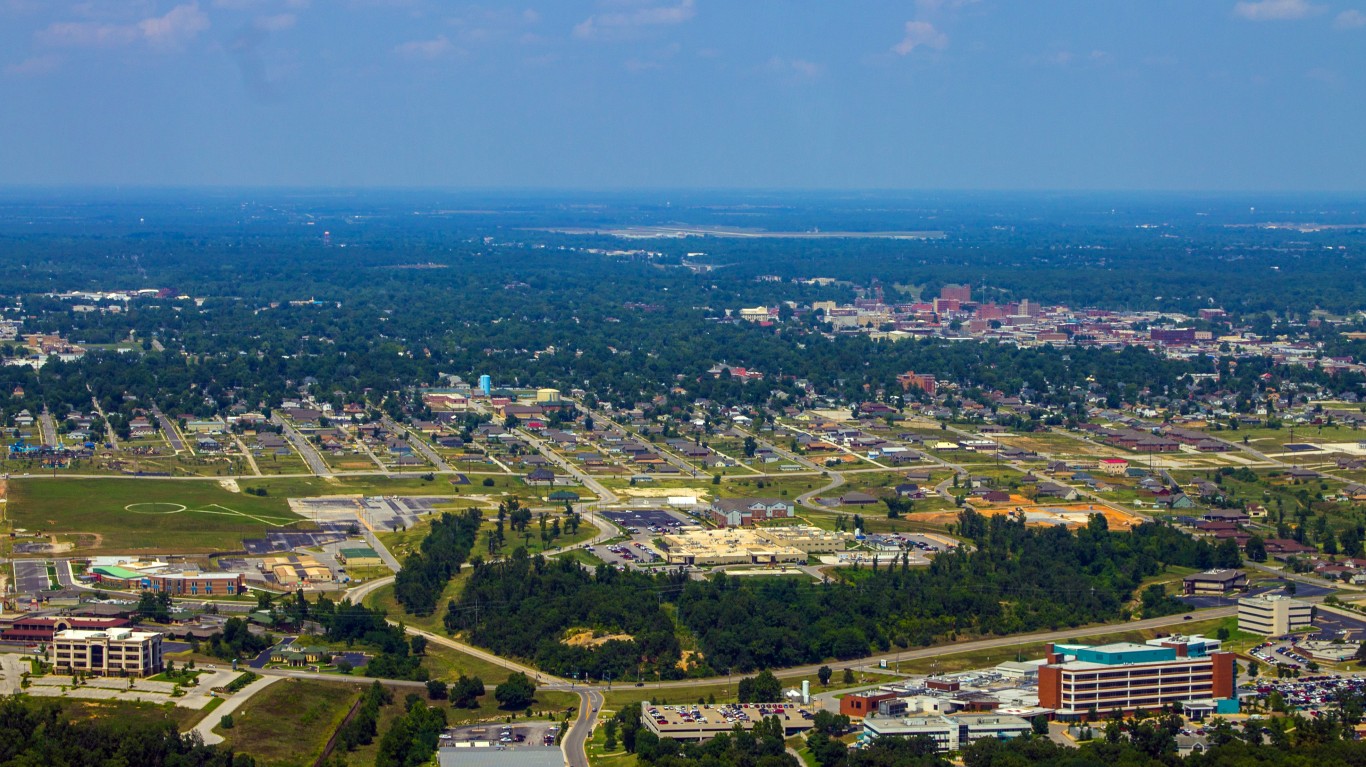
18. Joplin, MO
> Automatable share of work: 50.7% of tasks
> Percent of adults with at least a bachelor’s degree: 22.7%
> Civilians employed in manufacturing: 19.3%
> Population: 178,507
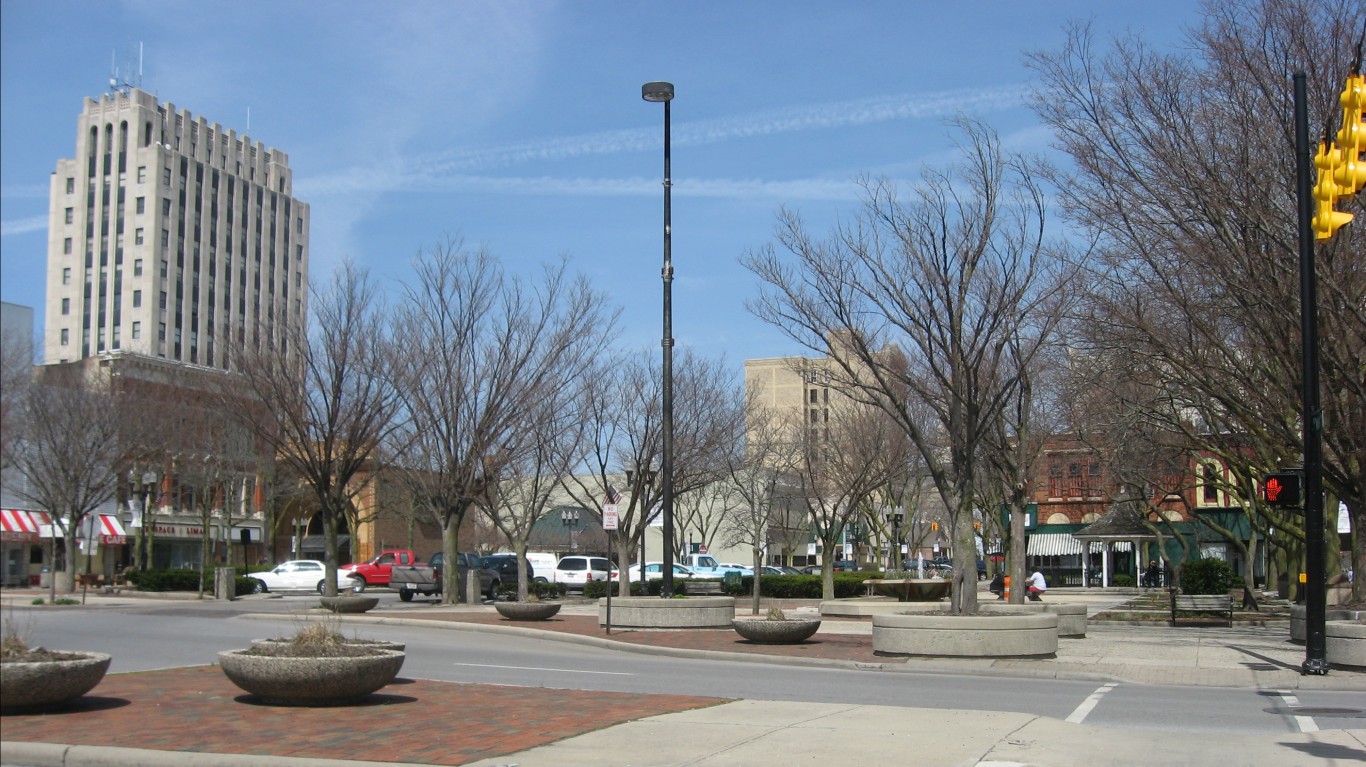
17. Lima, OH
> Automatable share of work: 50.8% of tasks
> Percent of adults with at least a bachelor’s degree: 19.7%
> Civilians employed in manufacturing: 17.6%
> Population: 103,198
[in-text-ad-2]

16. St. Joseph, MO-KS
> Automatable share of work: 50.9% of tasks
> Percent of adults with at least a bachelor’s degree: 18.8%
> Civilians employed in manufacturing: 19.6%
> Population: 127,092
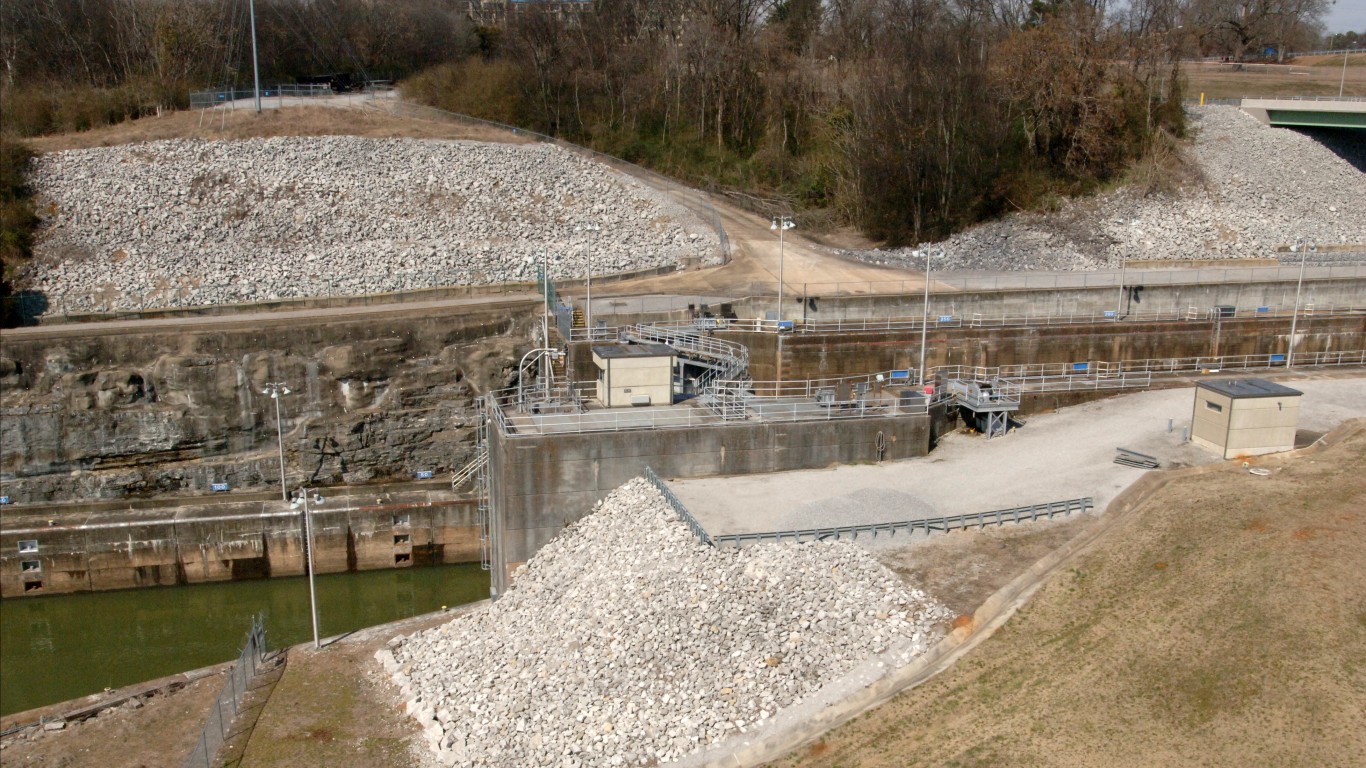
15. Florence-Muscle Shoals, AL
> Automatable share of work: 50.9% of tasks
> Percent of adults with at least a bachelor’s degree: 22.2%
> Civilians employed in manufacturing: 15.0%
> Population: 147,038
[in-text-ad]

14. Odessa, TX
> Automatable share of work: 50.9% of tasks
> Percent of adults with at least a bachelor’s degree: 13.9%
> Civilians employed in manufacturing: 5.4%
> Population: 157,087

13. Michigan City-La Porte, IN
> Automatable share of work: 51.0% of tasks
> Percent of adults with at least a bachelor’s degree: 16.9%
> Civilians employed in manufacturing: 21.6%
> Population: 110,029

12. Morristown, TN
> Automatable share of work: 51.3% of tasks
> Percent of adults with at least a bachelor’s degree: 14.9%
> Civilians employed in manufacturing: 21.9%
> Population: 118,081
[in-text-ad-2]
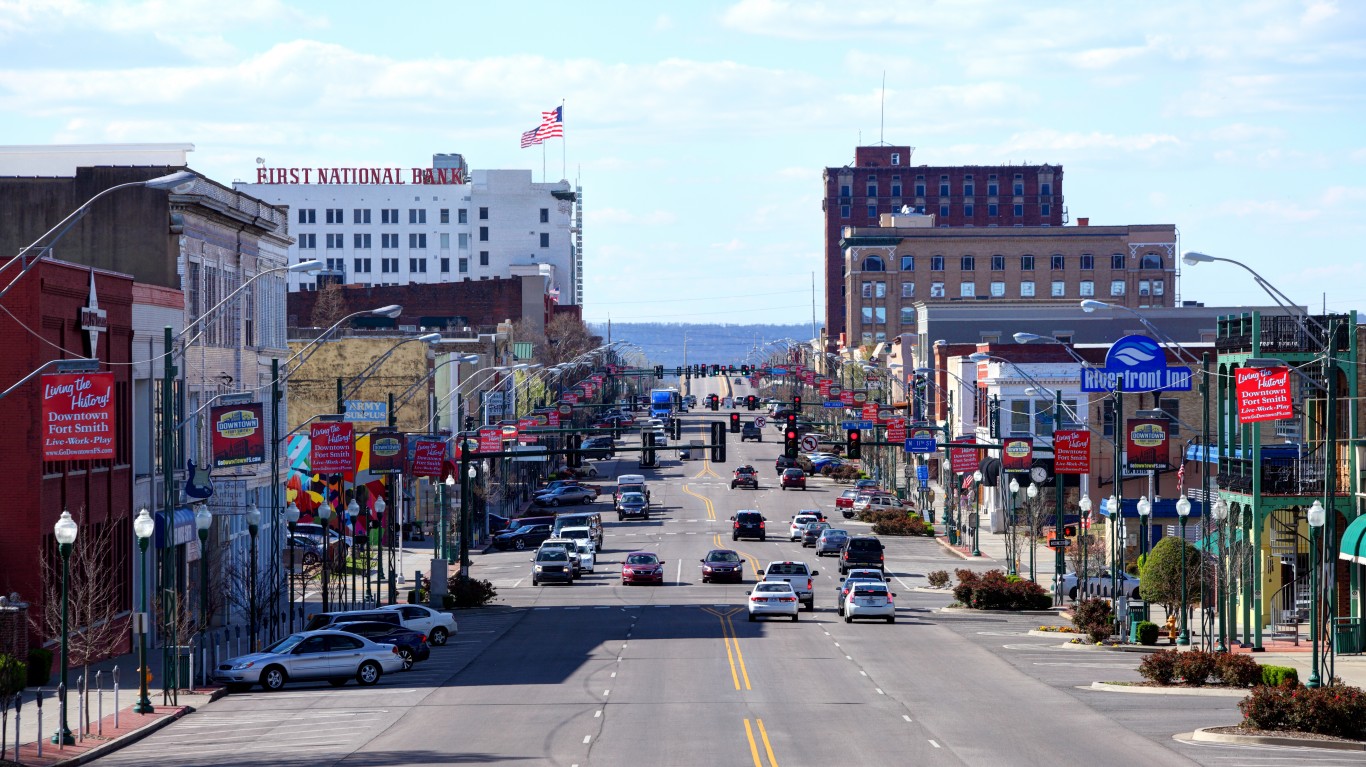
11. Fort Smith, AR-OK
> Automatable share of work: 51.5% of tasks
> Percent of adults with at least a bachelor’s degree: 18.1%
> Civilians employed in manufacturing: 16.0%
> Population: 282,086

10. Gadsden, AL
> Automatable share of work: 51.5% of tasks
> Percent of adults with at least a bachelor’s degree: 19.3%
> Civilians employed in manufacturing: 17.4%
> Population: 102,755
[in-text-ad]

9. Sioux City, IA-NE-SD
> Automatable share of work: 51.6% of tasks
> Percent of adults with at least a bachelor’s degree: 22.1%
> Civilians employed in manufacturing: 21.2%
> Population: 169,131

8. Gettysburg, PA
> Automatable share of work: 51.6% of tasks
> Percent of adults with at least a bachelor’s degree: 22.9%
> Civilians employed in manufacturing: 15.1%
> Population: 102,336

7. Harrisonburg, VA
> Automatable share of work: 52.0% of tasks
> Percent of adults with at least a bachelor’s degree: 29.0%
> Civilians employed in manufacturing: 15.3%
> Population: 134,442
[in-text-ad-2]

6. Burlington, NC
> Automatable share of work: 52.2% of tasks
> Percent of adults with at least a bachelor’s degree: 23.4%
> Civilians employed in manufacturing: 18.6%
> Population: 162,391

5. Grand Island, NE
> Automatable share of work: 52.4% of tasks
> Percent of adults with at least a bachelor’s degree: 23.0%
> Civilians employed in manufacturing: 17.3%
> Population: 85,936
[in-text-ad]

4. Hickory-Lenoir-Morganton, NC
> Automatable share of work: 52.6% of tasks
> Percent of adults with at least a bachelor’s degree: 17.9%
> Civilians employed in manufacturing: 27.2%
> Population: 366,534

3. Elkhart-Goshen, IN
> Automatable share of work: 54.6% of tasks
> Percent of adults with at least a bachelor’s degree: 20.2%
> Civilians employed in manufacturing: 37.5%
> Population: 205,032

2. Kokomo, IN
> Automatable share of work: 54.7% of tasks
> Percent of adults with at least a bachelor’s degree: 20.4%
> Civilians employed in manufacturing: 28.1%
> Population: 82,363
[in-text-ad-2]

1. Dalton, GA
> Automatable share of work: 56.0% of tasks
> Percent of adults with at least a bachelor’s degree: 13.5%
> Civilians employed in manufacturing: 42.0%
> Population: 144,440
Detailed Findings
While no labor market will be spared the effects of automation in the coming decades, manufacturing and agricultural industries are considerably more vulnerable than others. In turn, local economies with long histories and ongoing specialization in these industries will be most vulnerable to changes brought on by automation.
Production, transportation, and construction-installation occupations are more heavily concentrated in areas that have above average projected automation exposure. In 44 of the 50 metro areas on this list, the percentage of workers employed in the manufacturing sector, for example, exceeds the national average share of 10.1%.
Based on the potential of being automated, relatively safe jobs include health care, personal services, and education occupations. No metro area on this list consists of above-average shares of professional, scientific, and management sector jobs.
Methodology
To identify the metro job markets at the greatest risk of automation, 24/7 Wall St. reviewed data published this January in the Brookings Institution’s Metropolitan Policy Program. The percentage of adults with at least a bachelor’s degree, the percentage of civilians employed in manufacturing jobs, and the population of each metropolitan area came from the U.S. Census Bureau’s 2017 American Community Survey.
Retirement planning doesn’t have to feel overwhelming. The key is finding expert guidance—and SmartAsset’s simple quiz makes it easier than ever for you to connect with a vetted financial advisor.
Here’s how it works:
Why wait? Start building the retirement you’ve always dreamed of. Click here to get started today!
Thank you for reading! Have some feedback for us?
Contact the 24/7 Wall St. editorial team.