Deciding on the right city to live in will always require some compromise. A city like New York may have a booming job market, but it is also one of the most expensive places in the country. Alternatively, while a dollar may go a long way in Houston, residents of the the south Texas city are also nearly three times more likely to be a victim of a violent crime than the typical American.
While there is no such thing as the perfect city, the United States is full of places with few, if any, strengths. Poor socioeconomic conditions tell a similar story of urban blight in dozens of cities across the country. 24/7 Wall St. created an index of over two dozen measures to identify the worst cities to live in. These cities tend to have high crime rates, widespread poverty, weak job markets, and little in the way of entertainment options or cultural attractions.
Conditions like these tend to be more common in areas with lower educational attainment. In every city on this list, the share of adults with a four-year college degree falls short of the 30.9% national bachelor’s degree attainment rate. In 19 of these cities, fewer than one in every 10 adults have a bachelor’s degree.
Though the cities on this list span every region of the country, they are overwhelmingly concentrated in the South and the West. Only a dozen of the 50 cities on this list are in the Midwest or Northeast.
Click here to see the worst cities to live in.
Click here to read our methodology.
50. Beverly Hills, Florida
> Population: 9,144
> Poverty rate: 32.9% (top 10%)
> 2017 violent crimes per 100,000 people: N/A
> Median home value: $63,400 (bottom 10%)
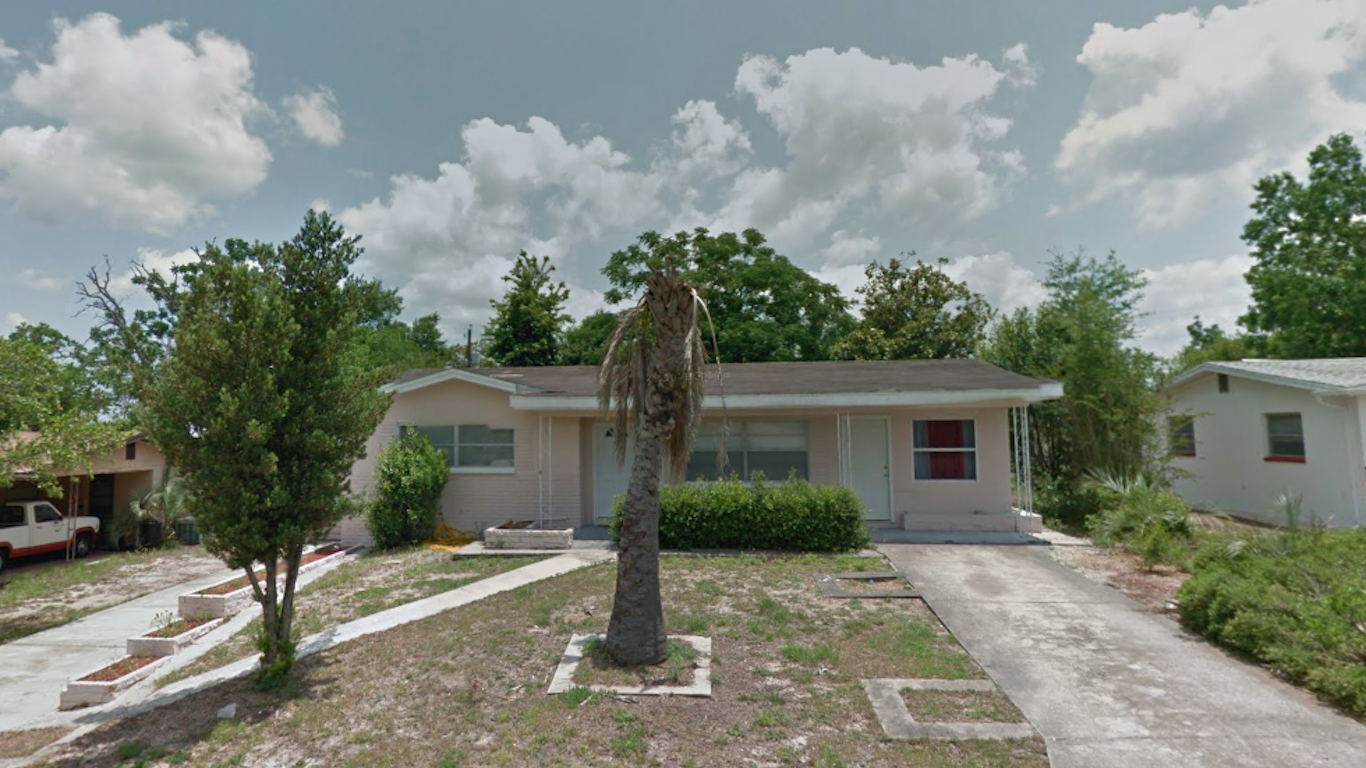
Beverly Hills is one of the poorest cities in Florida. The typical household earns just $26,525 a year, less than half the $57,652 the typical American household makes. The low incomes are reflected in the city’s real estate values, as the typical home in Beverly Hills is worth just $63,400.
Low property values are also likely a product of the relatively few entertainment and cultural attractions in the city. The city has a far lower concentration of bars, restaurants, theatres, and museums than is typical nationwide.
[in-text-ad]
49. Bridgeport, Connecticut
> Population: 147,586
> Poverty rate: 20.8% (top 25%)
> 2017 violent crimes per 100,000 people: 900 (top 10%)
> Median home value: $170,300
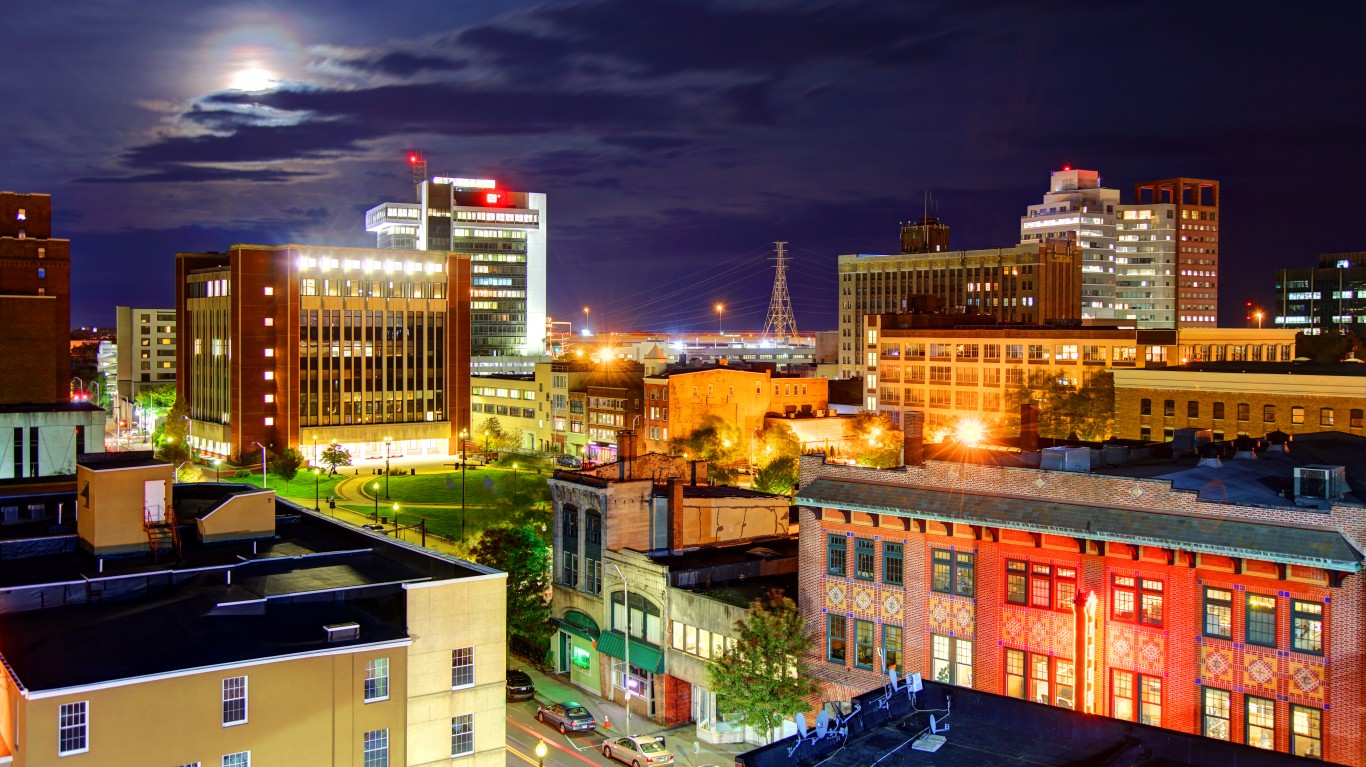
Bridgeport is the only city in Connecticut — and the broader New England region — to rank among the worst U.S. cities to live in. A relatively poor city, the typical household in Bridgeport earns just $44,841 a year, and more than one in every five city residents live below the poverty line. Those on the low end of the income spectrum in Bridgeport are strained further by the city’s high cost of living. Goods and services in Bridgeport are 30.8% more expensive than the average nationwide.
The area’s low incomes are partially attributable to a weak job market. According to Census estimates, an average of 9.3% of workers have been unemployed over the last five years.
48. Orange Cove, California
> Population: 9,567
> Poverty rate: 45.9% (top 10%)
> 2017 violent crimes per 100,000 people: 600 (top 25%)
> Median home value: $114,300 (bottom 25%)
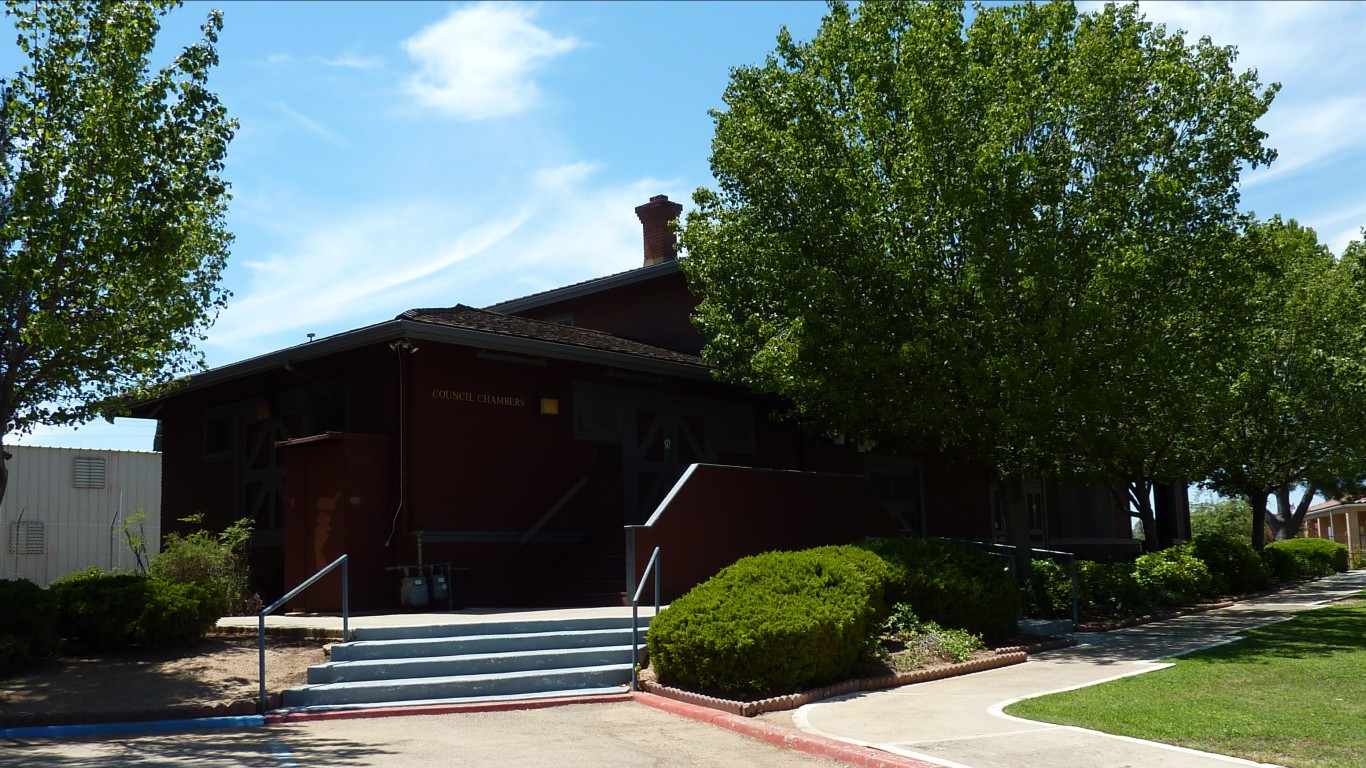
Orange Cove is one of the poorest cities in the country. Nearly 46% of the population lives below the poverty line, and about half of all households earn less than $26,000 a year. Low incomes and financial hardship are partially the product of a weak job market. The city’s five-year average unemployment rate of 7.8% is well above the comparable national rate of 4.1%.
For residents of Orange Cove with disposable income, local entertainment options are limited. The area’s concentration of places like bars, restaurants, theatres, and museums is far lower than the average nationwide.

47. Arvin, California
> Population: 20,826
> Poverty rate: 27.5% (top 10%)
> 2017 violent crimes per 100,000 people: 1,071 (top 10%)
> Median home value: $132,300
Arvin is one of three California cities in the Bakersfield metro area to rank among the worst places to live. With 1,071 violent crimes for every 100,000 residents, Arvin is the most dangerous city in the broader Bakersfield metro area. Crime is often more common in poorer areas, and more than one in every four Arvin residents live below the poverty line.
Like most other California cities on this list, Arvin does not have much to offer in the way of cultural or entertainment options. There are far fewer restaurants, bars, recreation centers, museums, and theatres per capita in Arvin than is typical nationwide.
[in-text-ad-2]
46. Asbury Park, New Jersey
> Population: 15,830
> Poverty rate: 30.4% (top 10%)
> 2017 violent crimes per 100,000 people: 1,361 (top 10%)
> Median home value: $335,500 (top 25%)
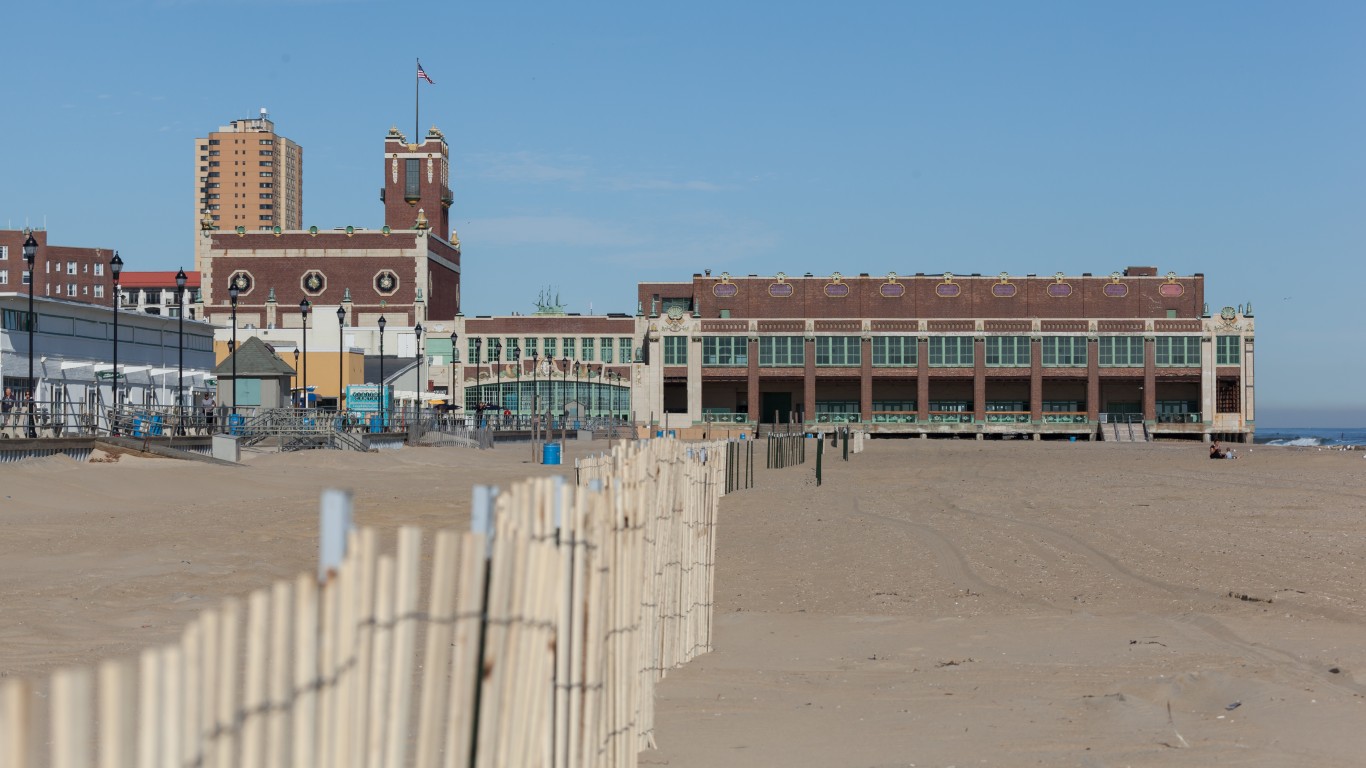
Asbury Park is a relatively poor city along the New Jersey coast. The typical household in the city earns just $39,324 a year, about $18,000 less than the typical American household. Low income residents are strained further by the area’s high cost of living. Asbury Park is located within the broader New York City metro area, one of the most expensive regions of the country, and goods and services in the city are 22.4% more expensive than average.
The city’s low incomes and a high cost of living likely contribute to widespread food insecurity in Asbury Park. Additionally, more than one in every three city residents have limited access to a grocery story or large supermarket.
45. Bellmead, Texas
> Population: 10,315
> Poverty rate: 26.6% (top 10%)
> 2017 violent crimes per 100,000 people: 2,305 (top 10%)
> Median home value: $70,000 (bottom 10%)
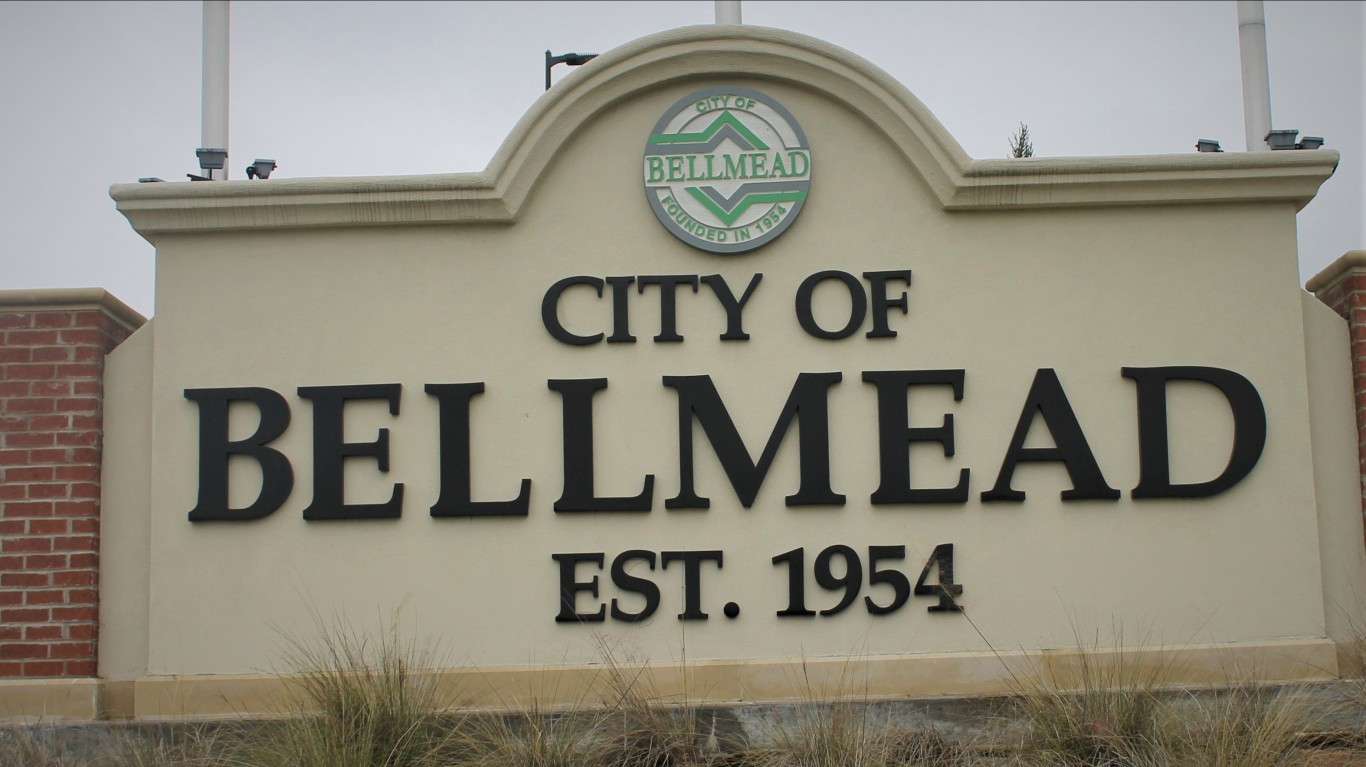
Bellmead is a small city in the Waco, Texas, metro area in between Dallas and Austin. The city has some of the highest crime rates anywhere in the country. There were 2,305 violent crimes for every 100,000 residents in 2017, six times the national violent crime rate. Additionally, there were 6,509 property crimes for every 100,000 people in Bellmead, more than double the national property crime rate.
The area’s high crime may be suppressing property values. The typical home in Bellmead is worth just $70,000 — far less than the national median home value of $193,500.
[in-text-ad]
44. Desert Hot Springs, California
> Population: 28,298
> Poverty rate: 36.8% (top 10%)
> 2017 violent crimes per 100,000 people: 1,017 (top 10%)
> Median home value: $154,600
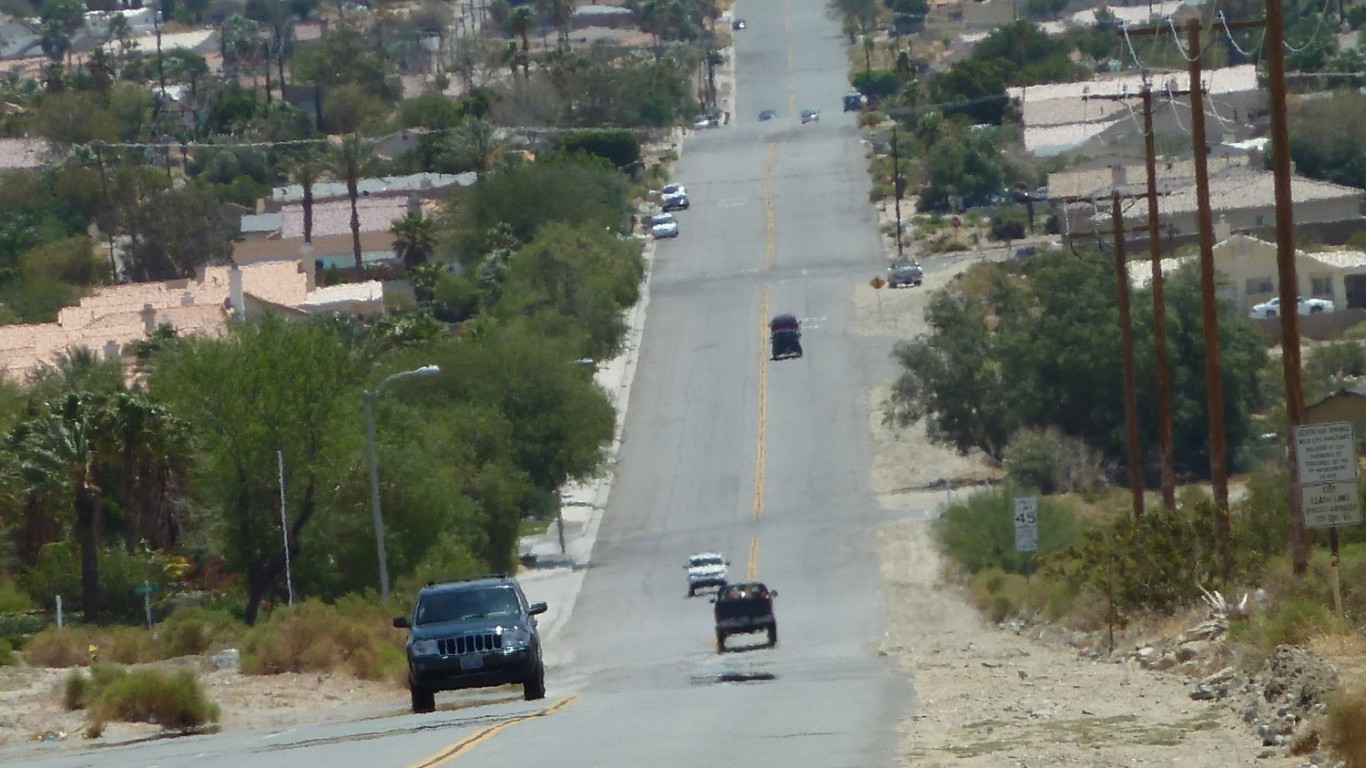
Desert Hot Springs is one of two cities within the San Bernardino metro area to rank among the worst cities to live. Like other communities in the metro area, Desert Hot Springs is dangerous. There were 1,017 violent crimes in the city in for every 100,000 people in 2017 — more than at least 90% of other American cities for which data was available.
The typical household in Desert Hot Springs earns $34,251 a year, well below the national median of $57,652. Low incomes in poorer areas tend to be somewhat offset by a low cost of living, but not Desert Hot Springs. Goods and services are 3.5% more expensive there than average nationwide.
43. Ecorse, Michigan
> Population: 9,321
> Poverty rate: 36.8% (top 10%)
> 2017 violent crimes per 100,000 people: 1,533 (top 10%)
> Median home value: $37,900 (bottom 10%)
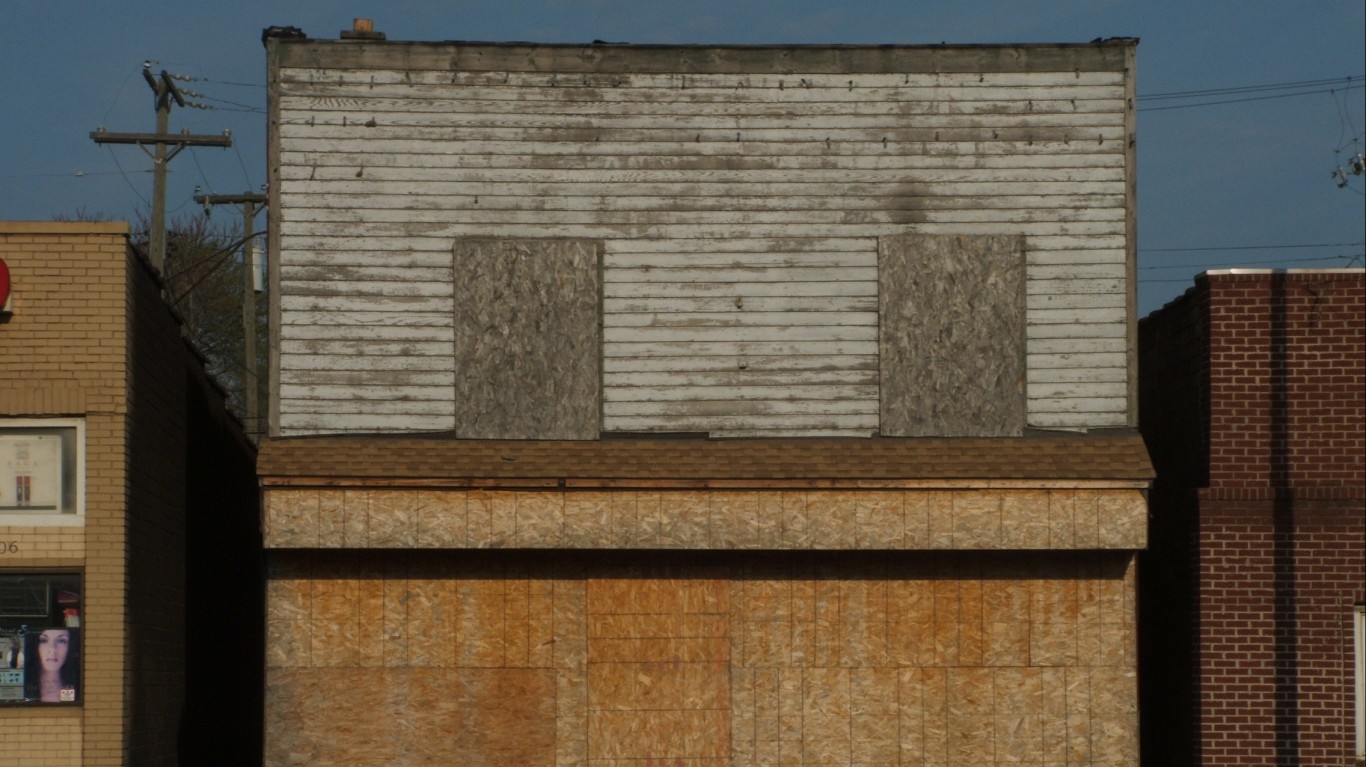
Ecorse is one of three cities in the Detroit metro area to rank among the worst places to live. One of the poorest cities in the country, Ecorse’s poverty rate of 36.8% is more than double the national poverty rate of 14.6%. For area residents that have disposable income, local entertainment options are limited. Ecorse has a far smaller concentration of places like bars and restaurants than the U.S. as a whole.
Property values are typically a reflection of what area residents can afford, and in Ecorse, half of all homes are worth less than $38,000. For context, the typical American home is worth $193,500.
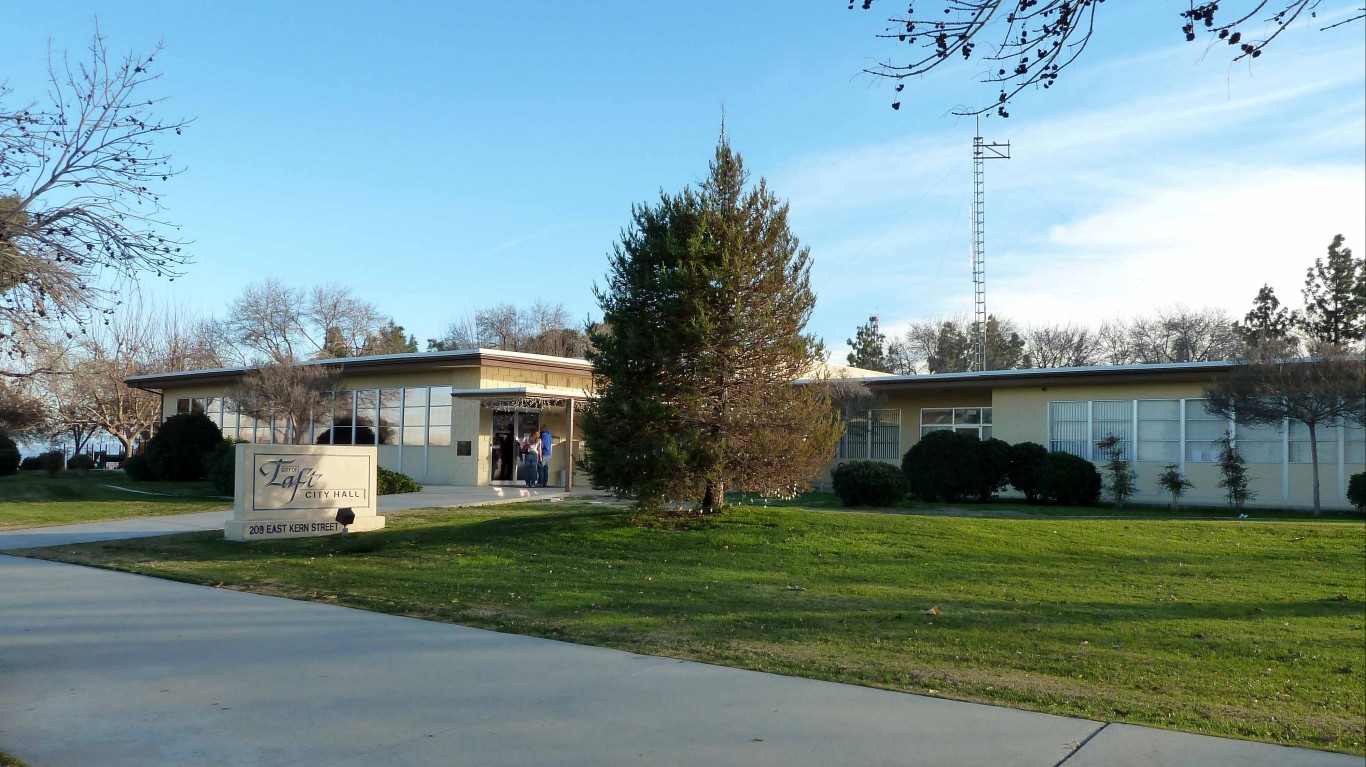
42. Taft, California
> Population: 9,224
> Poverty rate: 24.1% (top 25%)
> 2017 violent crimes per 100,000 people: 884 (top 10%)
> Median home value: $150,100
The typical home in California is worth $443,400. While the state has some of the most expensive real estate markets in the country, Taft is not one of them. The median home value in Taft is just $150,100 — well below the median home value nationwide of $193,500. The area’s high violent crime rate may be suppressing property values. There were 884 violent crimes for every 100,000 people in Taft in 2017, more than double the national violent crime rate of 383 per 100,000 people.
Many who live in Taft are financially insecure. Nearly one in every four residents live in poverty, one of the higher poverty rates of any U.S. city.
[in-text-ad-2]
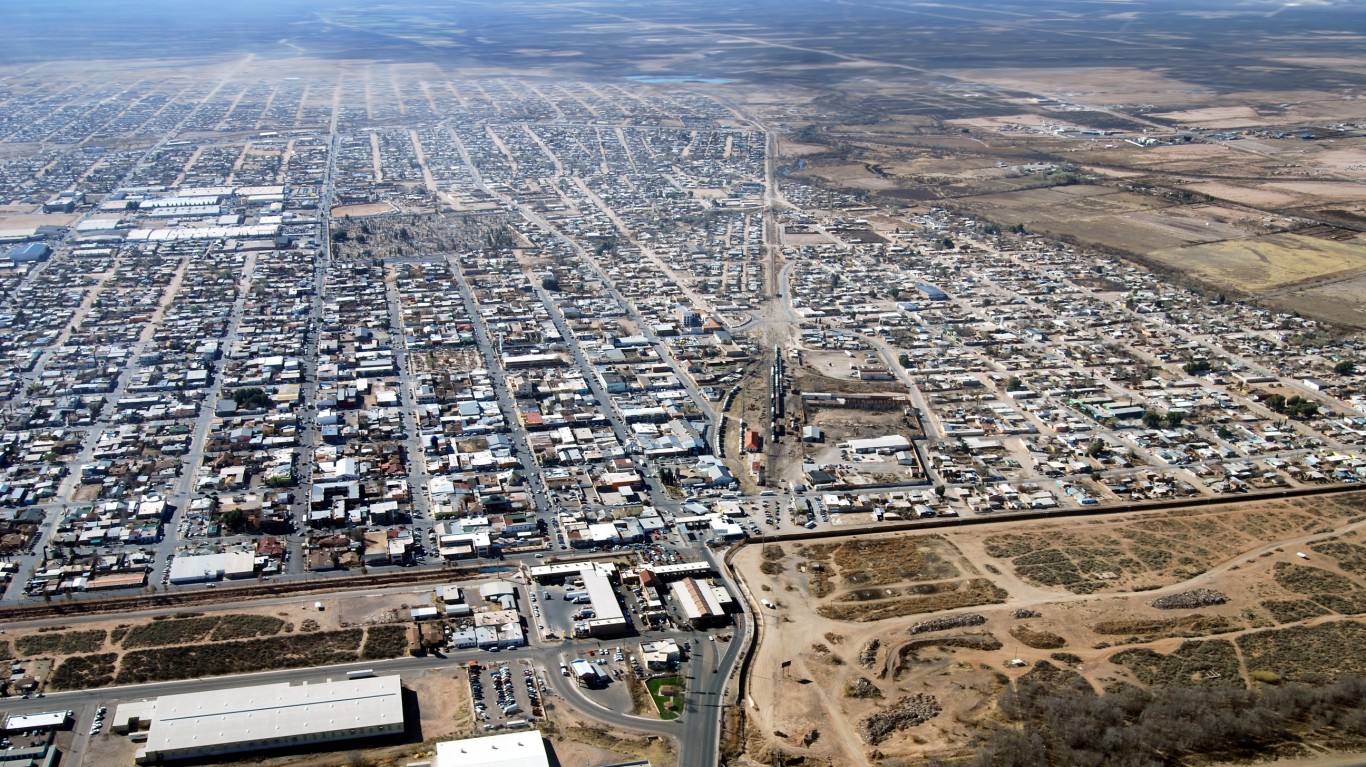
41. Douglas, Arizona
> Population: 16,576
> Poverty rate: 31.9% (top 10%)
> 2017 violent crimes per 100,000 people: 249
> Median home value: $88,200 (bottom 10%)
Douglas, a small city in southern Arizona along the Mexican border is the only city in the state to rank among the worst places to live. A relatively poor city, half of all area households earn less than $31,000 a year, and nearly 32% of the city’s population lives below the poverty line. While Douglas has a relatively low violent crime rate, property crimes like larceny, burglary, and motor vehicle theft are far more common in Douglas than the U.S. as a whole.
In recent years, jobs in the city have been disappearing. Employment in Douglas declined by 37.5% between 2012 and 2017. Over the same period, the number of people living in Douglas fell by 4.4%.
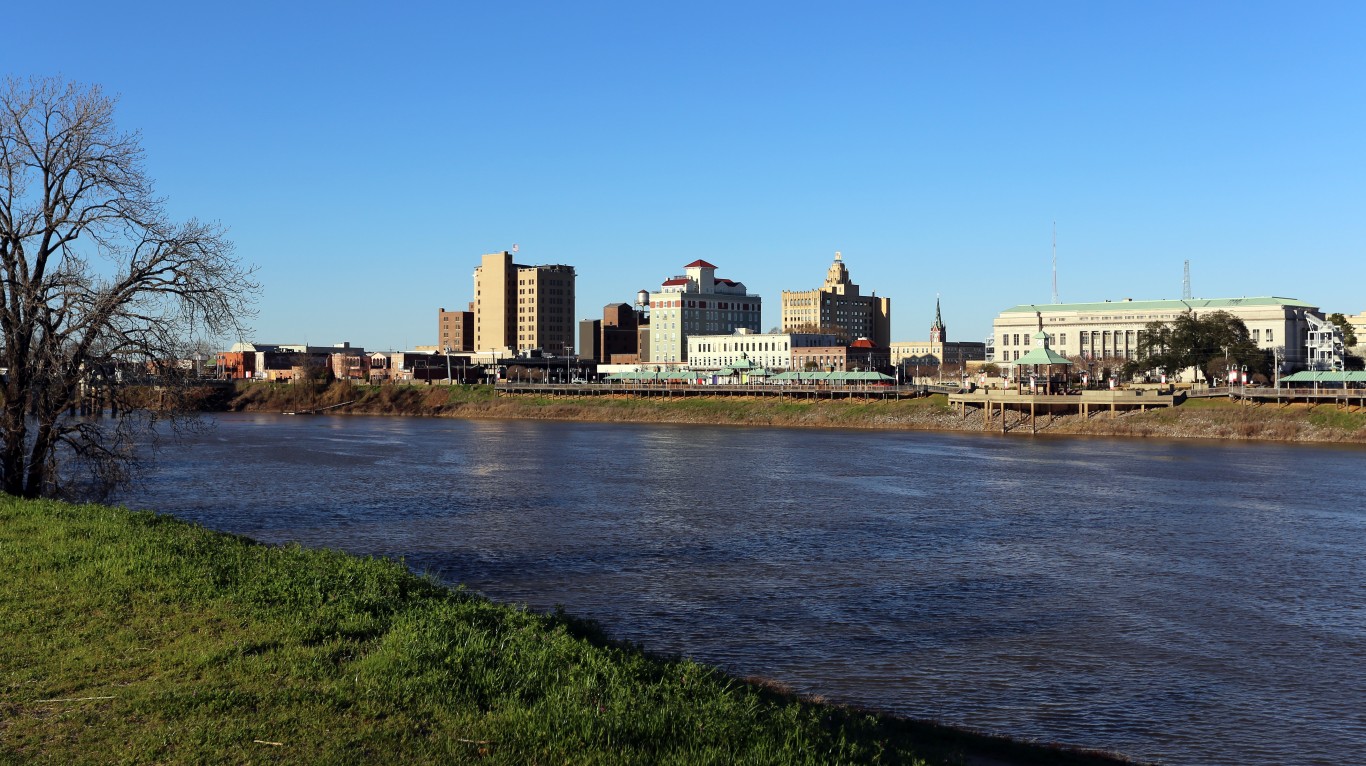
40. Monroe, Louisiana
> Population: 48,938
> Poverty rate: 34.8% (top 10%)
> 2017 violent crimes per 100,000 people: 2,225 (top 10%)
> Median home value: $143,200
Monroe’s high poverty rate is one of the main reasons the Louisiana city ranks among the worst U.S. cities. Over one-third of Monroe residents live in poverty, more than double the national poverty rate of 14.6%.
Monroe also has one of the highest crime rates in the country. For every 100,000 residents, there were 2,225 violent crimes reported in 2017. Only five other cities have a higher violent crime rate. Nationwide, the violent crime rate is 383 incidents per 100,000 people. Property crime is also common in Monroe. The city’s property crime rate of 8,232 crimes reported per 100,000 residents is more than triple the U.S. property crime rate.
[in-text-ad]
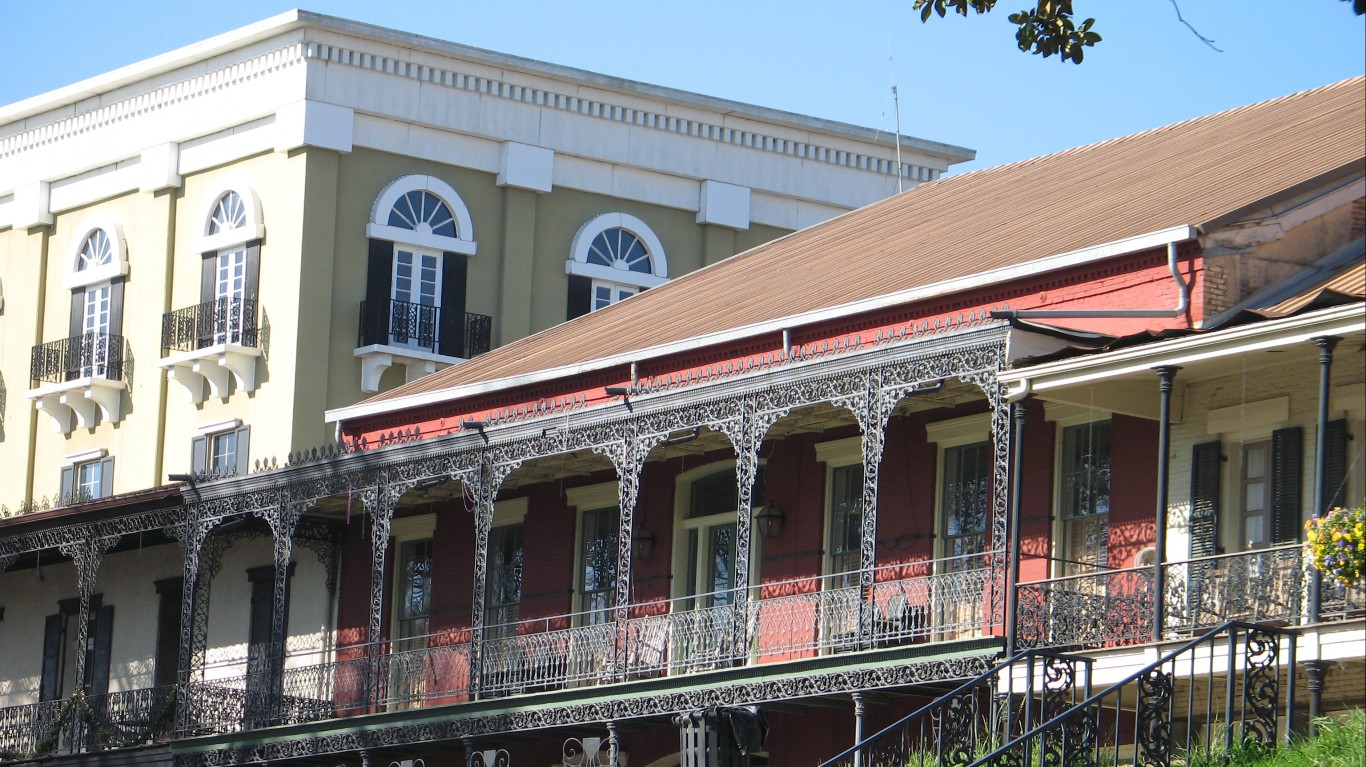
39. Natchitoches, Louisiana
> Population: 18,176
> Poverty rate: 44.7% (top 10%)
> 2017 violent crimes per 100,000 people: 1,187 (top 10%)
> Median home value: $150,800
Established in 1714, Natchitoches, Louisiana, is the oldest settlement in the entire 827,000 square mile area acquired in the Louisiana Purchase. Today, few U.S. cities are shedding jobs faster than Natchitoches. The number of people working in the city declined by 28.8% over the last five years. Over the same period, total employment nationwide climbed by 6.1%.
The increasingly limited job opportunities do not bode well for improved economic prosperity in the area going forward. Currently, 44.7% of Natchitoches residents live below the poverty line, nearly the highest poverty rate in the state and more than triple the 14.6% national poverty rate.
38. Yazoo City, Mississippi
> Population: 11,189
> Poverty rate: 49.0% (top 10%)
> 2017 violent crimes per 100,000 people: N/A
> Median home value: $72,700 (bottom 10%)
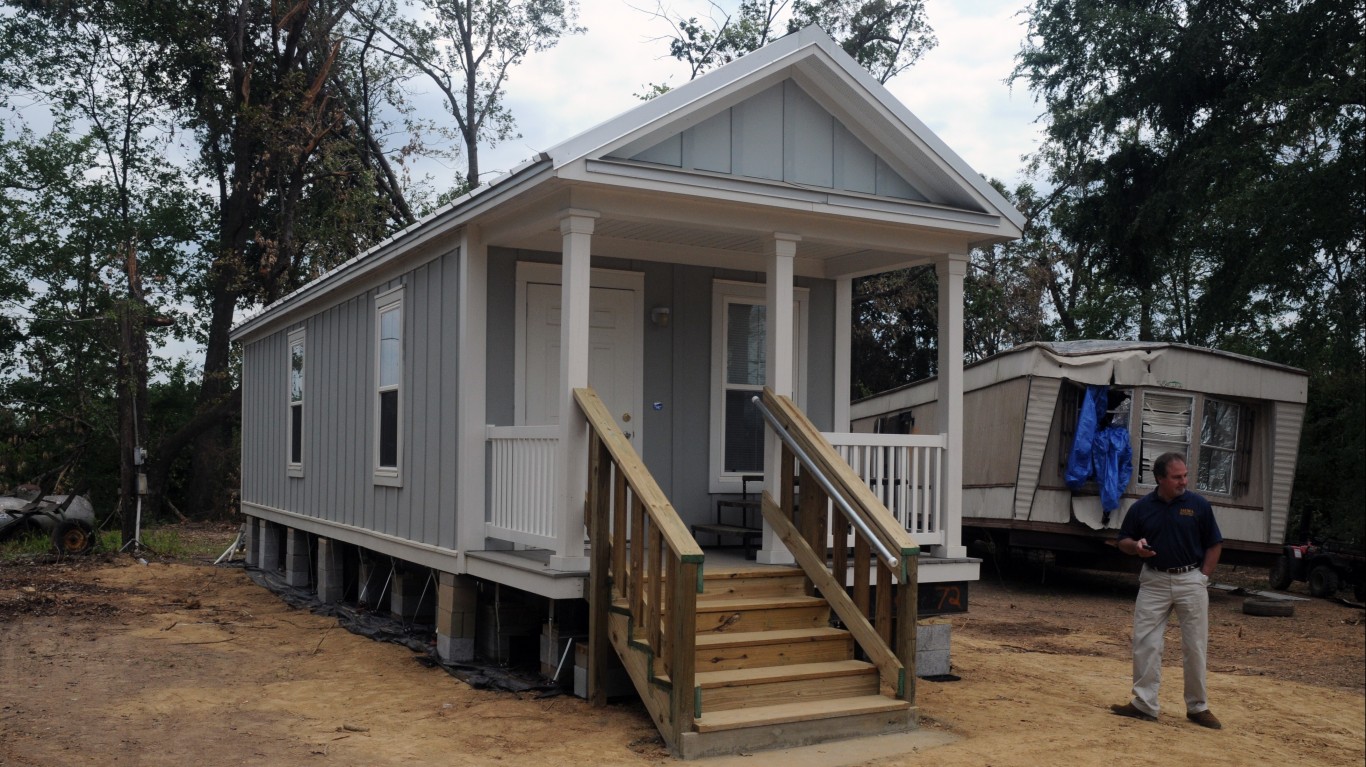
Yazoo City, Mississippi, is one of the poorest cities in the United States. At least half of all households earn less $21,000 annually, and 49.0% of the population lives below the poverty line, more than triple the national poverty rate of 14.6%.
The widespread financial instability is partially attributable to the area’s weak job market. According to the U.S. Census Bureau, 11.8% of workers in Yazoo City have been unemployed over the last five years, more than double the comparable national unemployment rate of 4.1%. Unlike the majority of U.S. cities, Yazoo has been shedding jobs in recent years. The overall number of people employed in the city declined by 14.1% between 2012 and 2017.
37. Newburgh, New York
> Population: 28,444
> Poverty rate: 31.2% (top 10%)
> 2017 violent crimes per 100,000 people: 1,236 (top 10%)
> Median home value: $170,900
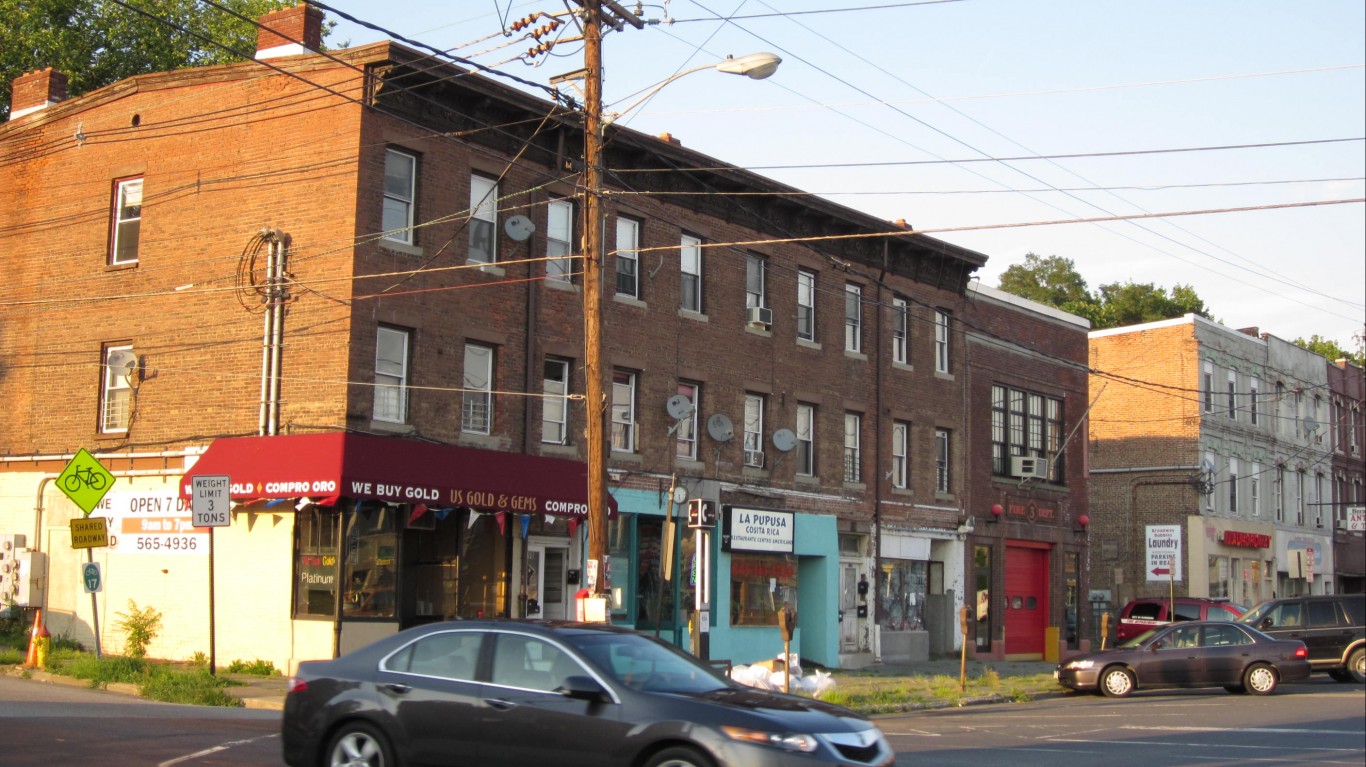
Newburgh is the only city in New York and one of only a few in the northeastern United States to rank among the worst cities to live. The city earned this distinction in part because of its high violent crime rate of 1,236 reported incidents per 100,000 people — more than three times the U.S. violent crime rate.
Newburgh residents also face difficult economic conditions. The city’s median household income of $36,922 a year is more than $20,000 lower than the U.S. median. This relatively low income is made more challenging by the fact that Newburgh’s cost of living is about 18% higher than it is on average nationwide. Like many of the other cities on this list, Newburgh’s population is shrinking. In the past five years, the number of people living in Newburgh dropped by 1.5%.
[in-text-ad-2]
36. Belle Glade, Florida
> Population: 19,175
> Poverty rate: 39.1% (top 10%)
> 2017 violent crimes per 100,000 people: 1,234 (top 10%)
> Median home value: $111,400 (bottom 25%)
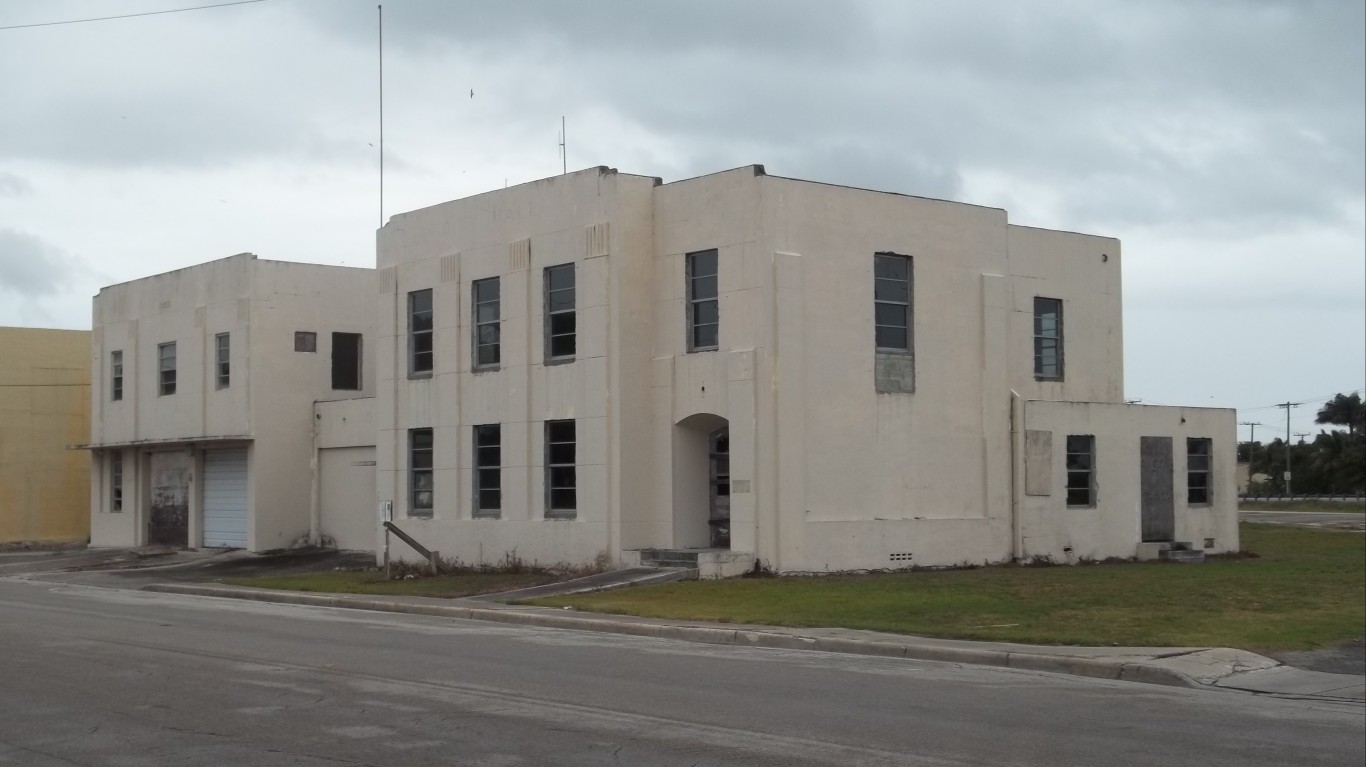
At least half of all households in Belle Glade, Florida, earn less than $26,000 a year. Those low-income residents face further financial strain because of the area’s high cost of living. Goods and services in the southern Florida city are about 6% more expensive than they are nationwide, on average. Housing is particularly expensive. The typical home in the area is worth $111,400, 4.3 times the area’s median income. Nationwide, the typical home is worth just 3.4 times the median income.
The low median income in Belle Glade is partially attributable to a lack of jobs. Over the last five years, an average of 8.5% of workers in the area were unemployed according to Census estimates, more than double the comparable national unemployment rate of 4.1%.
35. Arab, Alabama
> Population: 8,200
> Poverty rate: 17.6%
> 2017 violent crimes per 100,000 people: 549 (top 25%)
> Median home value: $143,800
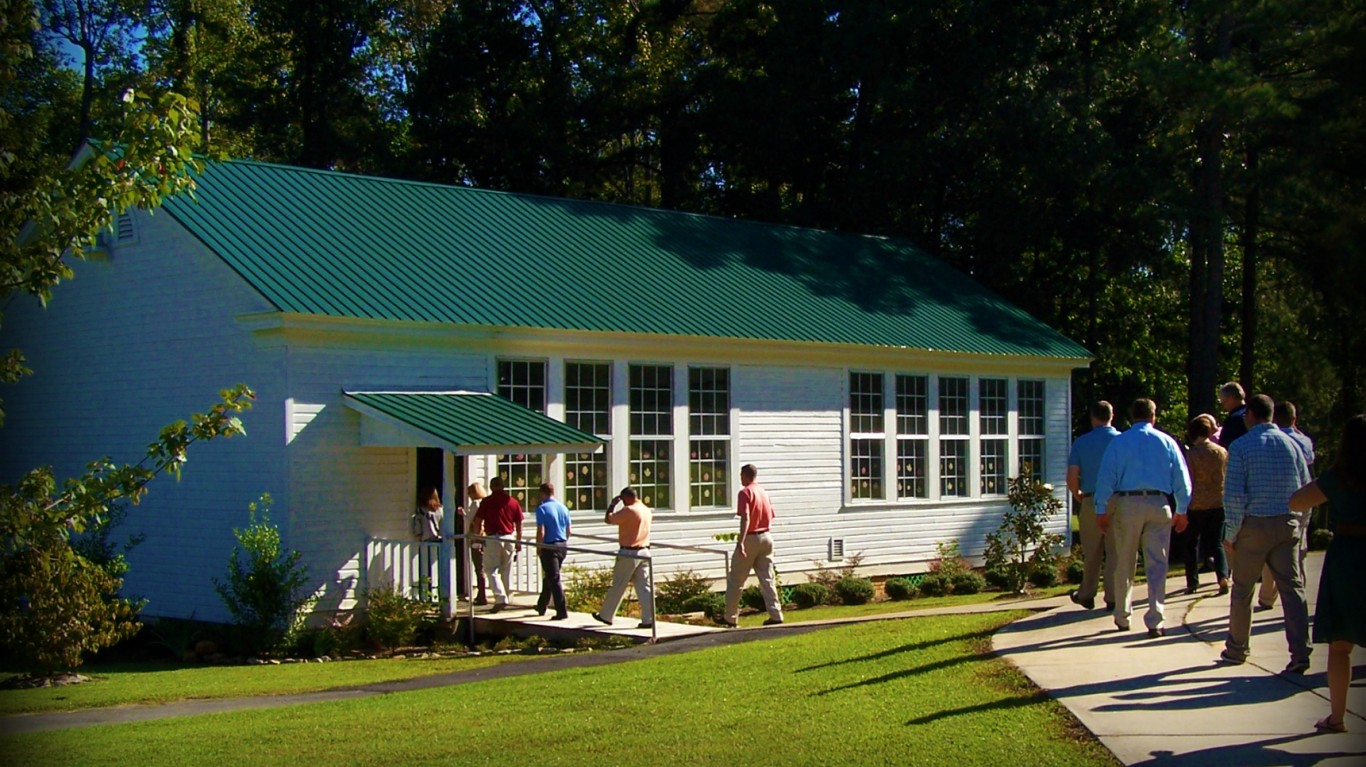
Few U.S. cities are shedding jobs faster than the northern Alabama city of Arab. In the last five years, the number of people working in the city declined by 9.8%, even as employment across the U.S. as a whole climbed by 6.1%.
Crime is also a problem in Arab. There were 6,217 property crimes — which include burglary, larceny, and motor vehicle theft — for every 100,000 people in Arab, more than double the 2,362 per 100,000 property crime rate nationwide.
[in-text-ad]
34. Fairfield, Alabama
> Population: 10,850
> Poverty rate: 25.5% (top 25%)
> 2017 violent crimes per 100,000 people: 1,905 (top 10%)
> Median home value: $96,100 (bottom 25%)
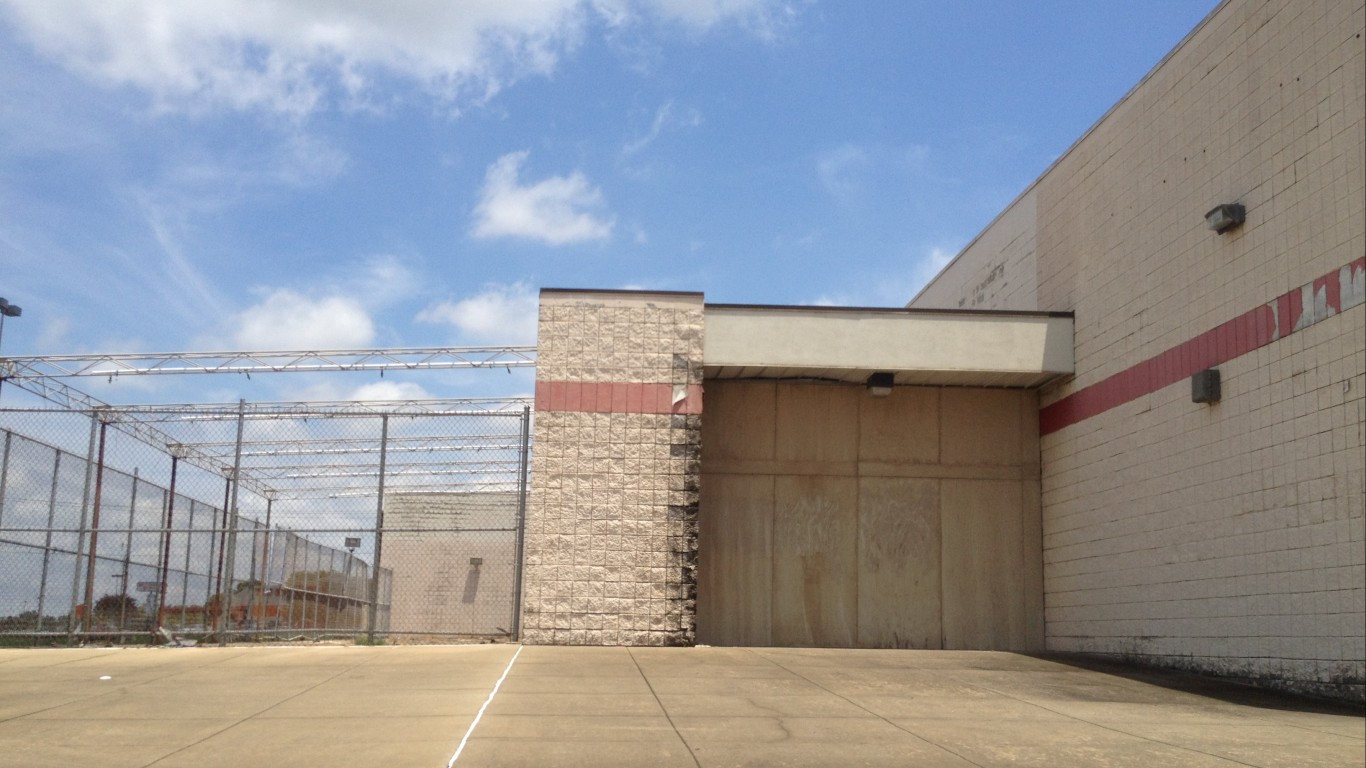
The typical home in Fairfield, Alabama, is worth just $96,100 — less than half the median home price nationwide. Real estate markets are often a reflection of what residents can afford, and many in Fairfield are struggling financially. The median annual household income is just over $36,000, and more than a quarter of residents live below the poverty line.
Fairfield’s job market lags behind that of most other U.S. cities. The city’s five-year unemployment rate is 7.0% compared to 4.1% nationwide. Over the past five years, employment growth in the city has been slower than average.

33. Helena-West Helena, Arkansas
> Population: 11,210
> Poverty rate: 42.5% (top 10%)
> 2017 violent crimes per 100,000 people: 1,112 (top 10%)
> Median home value: $75,400 (bottom 10%)
Helena-West Helena is the poorest city in one of the poorest states in the country. The typical household earns just $21,667 a year, less than half the median annual household income across Arkansas of $43,813 — which itself is nearly $14,000 less than the national median of $57,652.
Lower income areas often report higher levels of crime, and Helena-West Helena is no exception. There were 1,112 violent crimes for every 100,000 city residents in 2017, more than in over 90% of all U.S. cities for which data is available. The area’s high crime and low paying jobs may be driving residents out as over the last five years, Helena-West Helena’s population declined by 8.3%.
32. Fort Valley, Georgia
> Population: 8,790
> Poverty rate: 38.3% (top 10%)
> 2017 violent crimes per 100,000 people: 1,016 (top 10%)
> Median home value: $76,400 (bottom 10%)
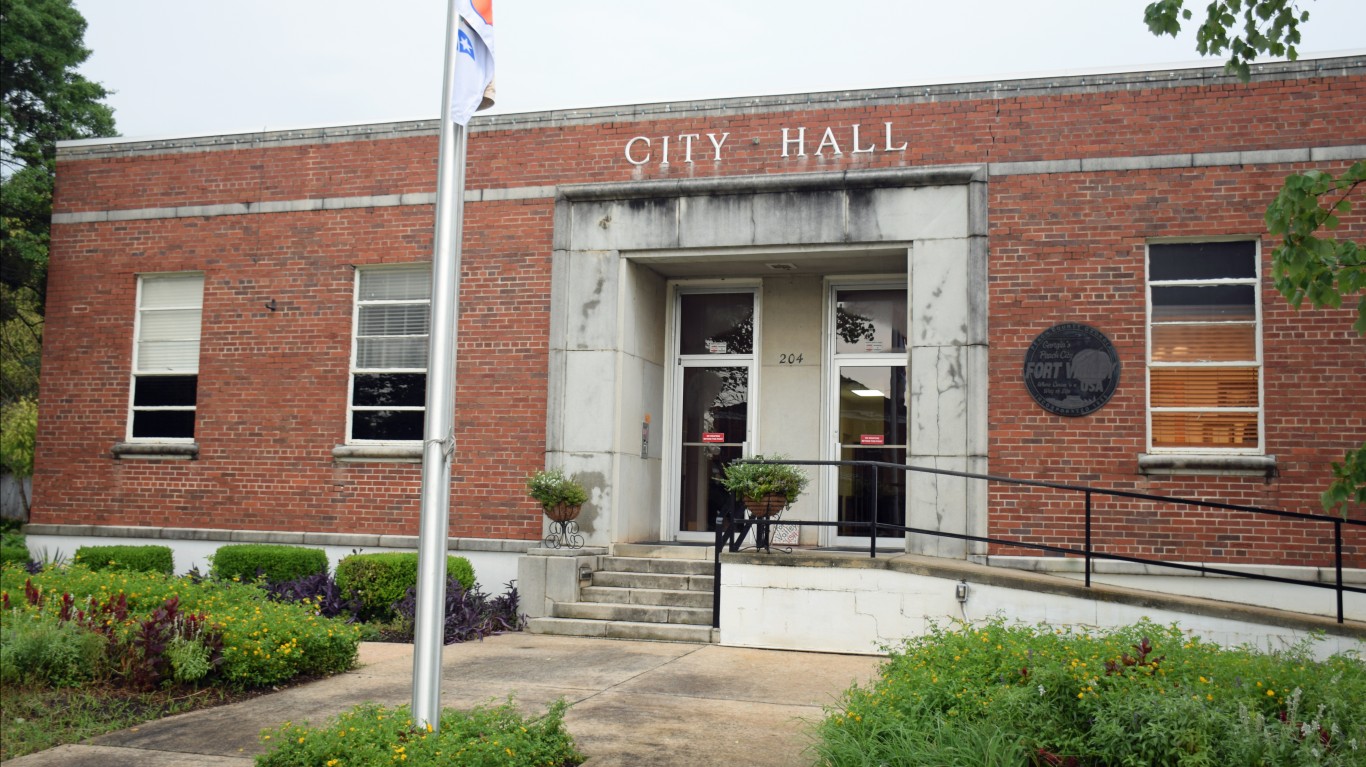
Fort Valley is one of the poorest cities in Georgia and the United States. The city’s 38.3% poverty rate is more than double both the state and national poverty rates of 16.9% and 14.6%, respectively. Widespread financial hardship is due in large part to a weak job market. According to Census estimates, 9.5% of the city’s workers were unemployed over the last five years, more than double the comparable national unemployment rate of 4.1%. Jobs have also become more scarce in Fort Valley in recent years. The number of people working in the city fell by a staggering 21.9% in the last half decade.
[in-text-ad-2]
31. Immokalee, Florida
> Population: 25,686
> Poverty rate: 43.4% (top 10%)
> 2017 violent crimes per 100,000 people: N/A
> Median home value: $99,700 (bottom 25%)
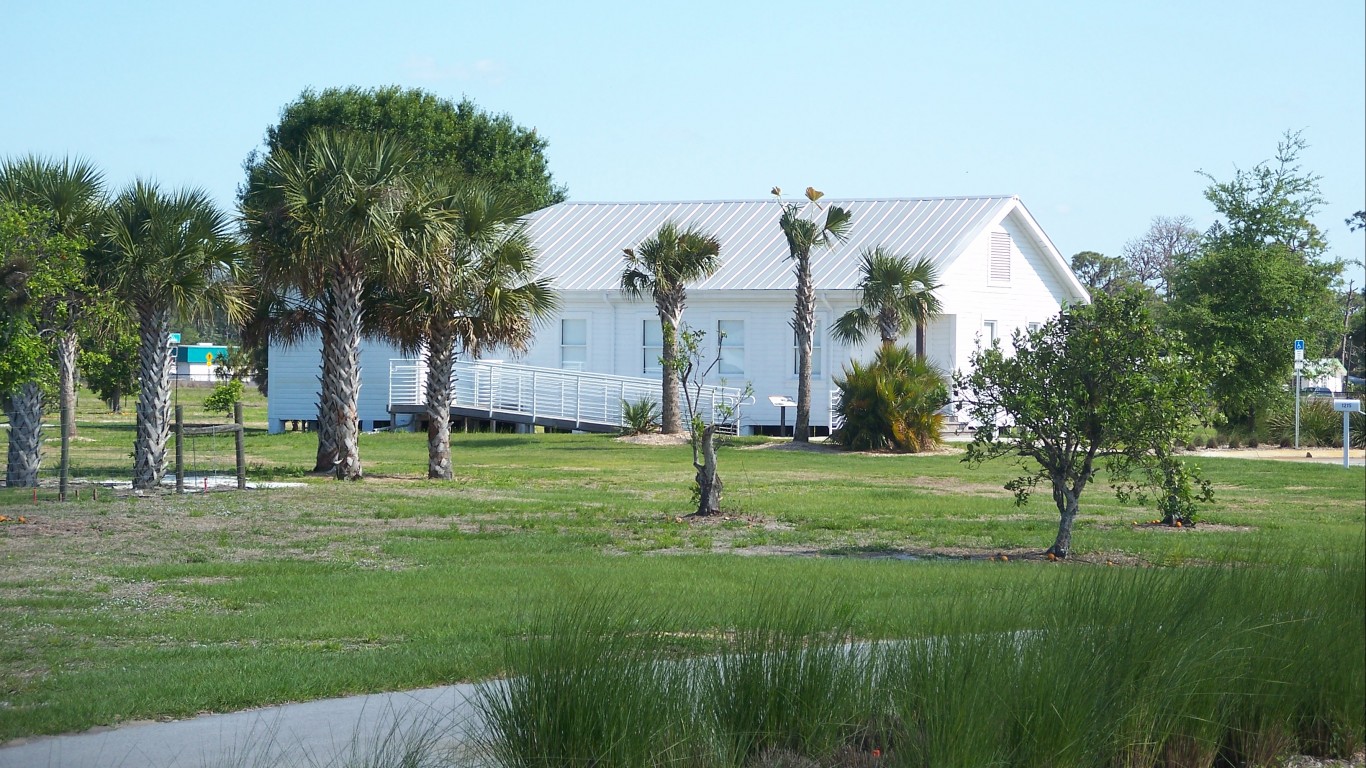
The typical household in Immokalee, Florida, earns just $29,308 a year. The city’s low incomes are in stark contrast to much of the broader metro area. In nearby Naples, half of all households earn over $90,500 a year.
Low-income households in the area are strained further by the city’s high cost of living. Goods and services are 8.5% more expensive in Immokalee than they are on average nationwide. Food insecurity is also a problem in Immokalee. Nearly 32% of Immokalee residents have low access to a grocery store or supermarket, well above the 22% national food insecurity rate.
30. Corcoran, California
> Population: 22,650
> Poverty rate: 35.6% (top 10%)
> 2017 violent crimes per 100,000 people: 349
> Median home value: $122,700 (bottom 25%)
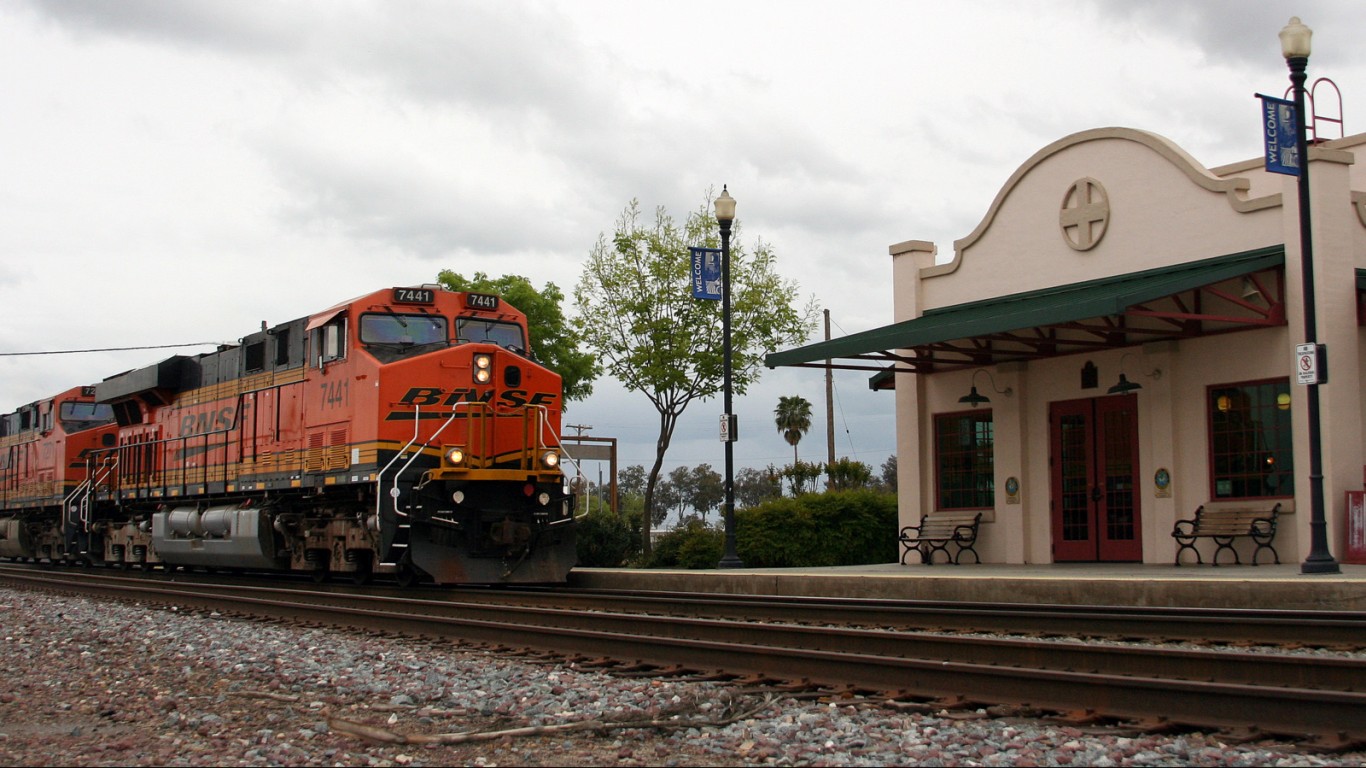
Corcoran, California ranks among the worst cities to live in largely because of widespread financial hardship. The city’s 35.6% poverty rate is among the highest in the state and more than double the 14.6% national poverty rate. For those in the city with disposable income, there are not many local entertainment options. The number of venues like bars, restaurants, theaters, museums, and recreation centers per person is far lower in Corcoran than is typical nationwide.
As is true in many cities on this list, Corcoran’s population is shrinking. The number of people living in the city fell by 7.3% over the last five years.
[in-text-ad]

29. Trenton, New Jersey
> Population: 84,867
> Poverty rate: 27.3% (top 10%)
> 2017 violent crimes per 100,000 people: 1,286 (top 10%)
> Median home value: $95,900 (bottom 25%)
Employment in Trenton, New Jersey, has been largely stagnant over the past five years. The number of people in the city with jobs has increased by just 0.4% in that time period compared to 6.1% employment growth nationwide. The city’s five-year unemployment rate is also relatively high at 7.8% — nearly double the comparable U.S. rate.
This lack of employment opportunities likely contributes to Trenton’s relatively low median annual household income of $35,524 — more than $22,000 below the U.S. median. A dollar does not go nearly as far in Trenton as it would in the typical American city. The city’s cost of living is more than 17% higher than the average U.S. cost of living.
28. East Point, Georgia
> Population: 35,380
> Poverty rate: 24.8% (top 25%)
> 2017 violent crimes per 100,000 people: 1,307 (top 10%)
> Median home value: $96,900 (bottom 25%)
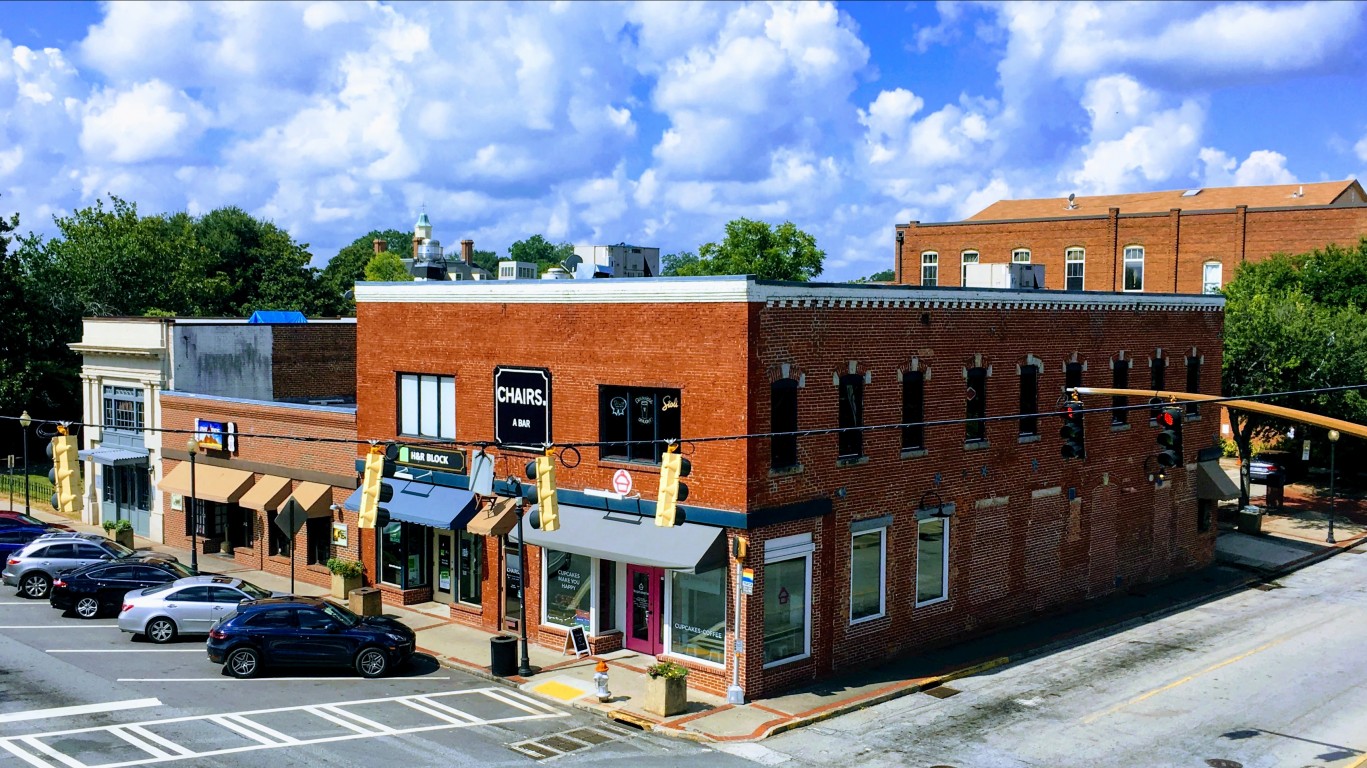
East Point is a small city in the Atlanta metro area. Like some other smaller cities around Atlanta, East Point is one of the most dangerous cities in the country. There were 1,307 violent crimes for every 100,000 city residents in 2017, a higher crime rate than in over 90% of all U.S. cities.
Unsafe streets may be depressing property values in the area. Half of all homes in East Point are worth less than $97,000. Across Georgia as a whole, most homes are worth more over $158,000.
27. Albany, Georgia
> Population: 74,892
> Poverty rate: 33.2% (top 10%)
> 2017 violent crimes per 100,000 people: 1,130 (top 10%)
> Median home value: $101,000 (bottom 25%)
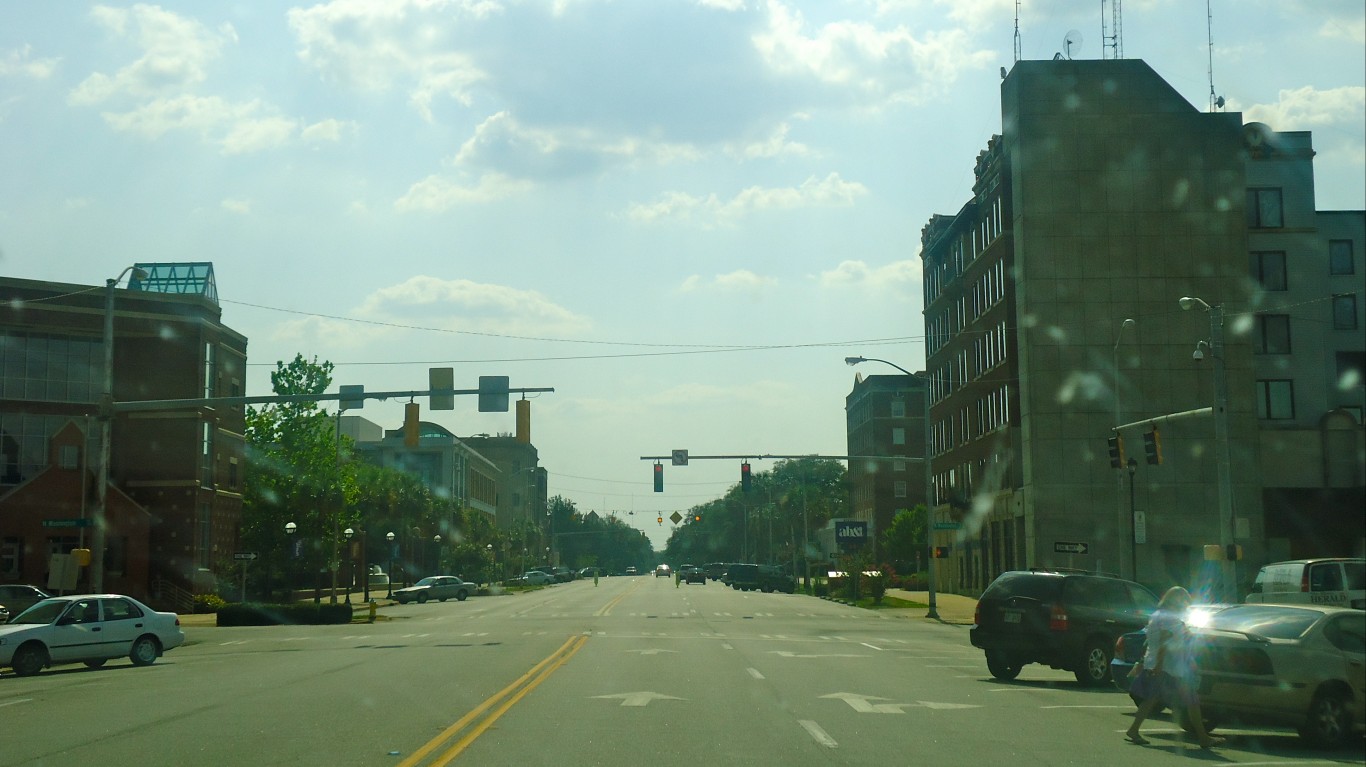
Albany, Georgia, residents are more likely than most Americans to face financial hardship. Nearly a third of the city’s population lives below the poverty line, one of the highest poverty rates in the country. The city’s median household income of $31,843 a year is well below the U.S. median of $57,652.
There are likely many factors that contribute to low incomes in the area, though one of the most significant is employment. Across the United States, employment increased by 6.1% from 2012 to 2017. In the same time period, employment in Albany fell by 4.0%. Albany also has a five-year unemployment rate of 9.7%, more than double the 4.1% U.S. unemployment rate during that same time.
[in-text-ad-2]
26. College Park, Georgia
> Population: 14,360
> Poverty rate: 35.1% (top 10%)
> 2017 violent crimes per 100,000 people: 1,467 (top 10%)
> Median home value: $154,700
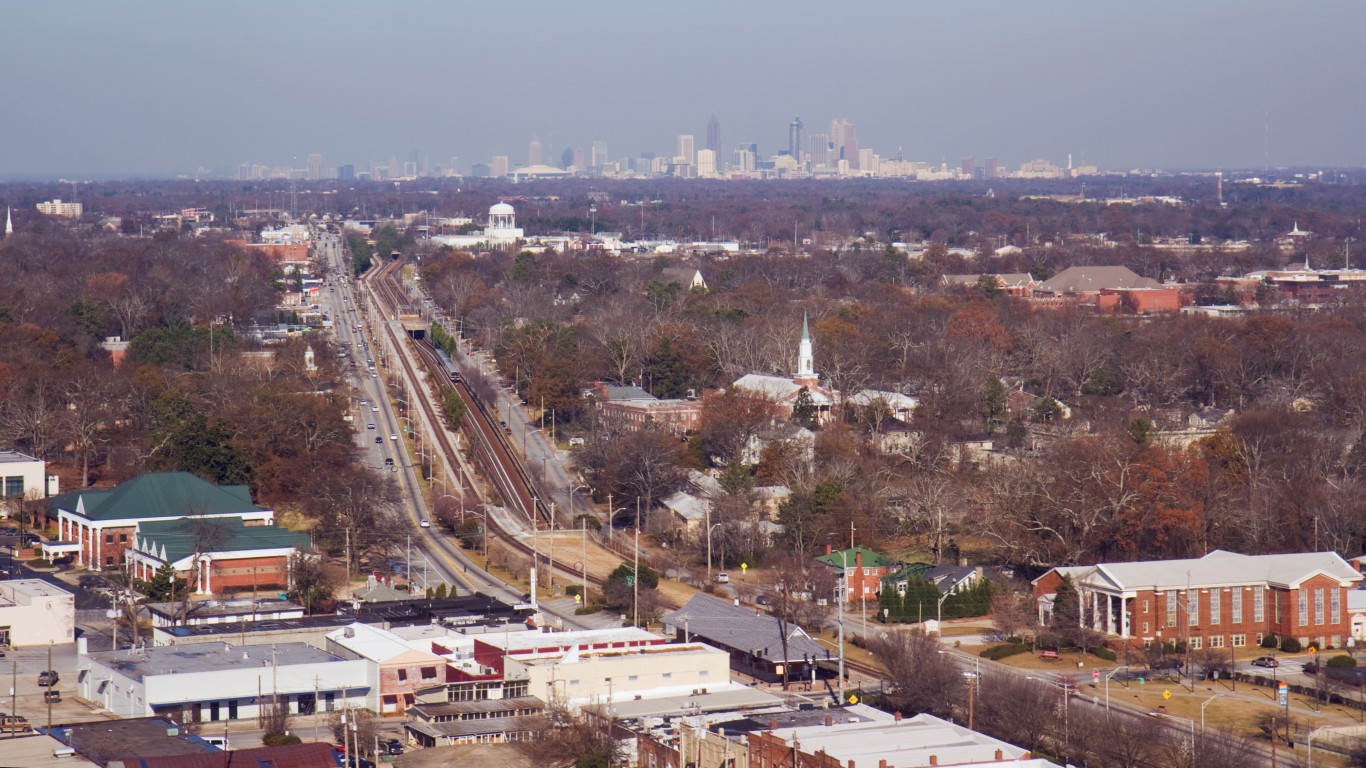
A poor city in just south of Atlanta, College Park’s poverty rate of 35.1% is higher than the poverty rate in over 90% of American cities. Areas with high poverty tend to struggle with crime, and crime is also an issue in College Park. The city’s violent crime rate of 1,467 reported incidents per 100,000 residents is nearly four times higher than the overall U.S. violent crime rate.
Though this factor was not included in the index, College Park may be an undesirable place to live because of its proximity close to Hartsfield-Jackson Atlanta International Airport — the busiest in the world. Those who live near an airport are subjected to loud noise, excessive levels of pollution, and traffic from travelers.
25. Nanakuli, Hawaii
> Population: 11,757
> Poverty rate: 16.2%
> 2017 violent crimes per 100,000 people: N/A
> Median home value: $310,300 (top 25%)
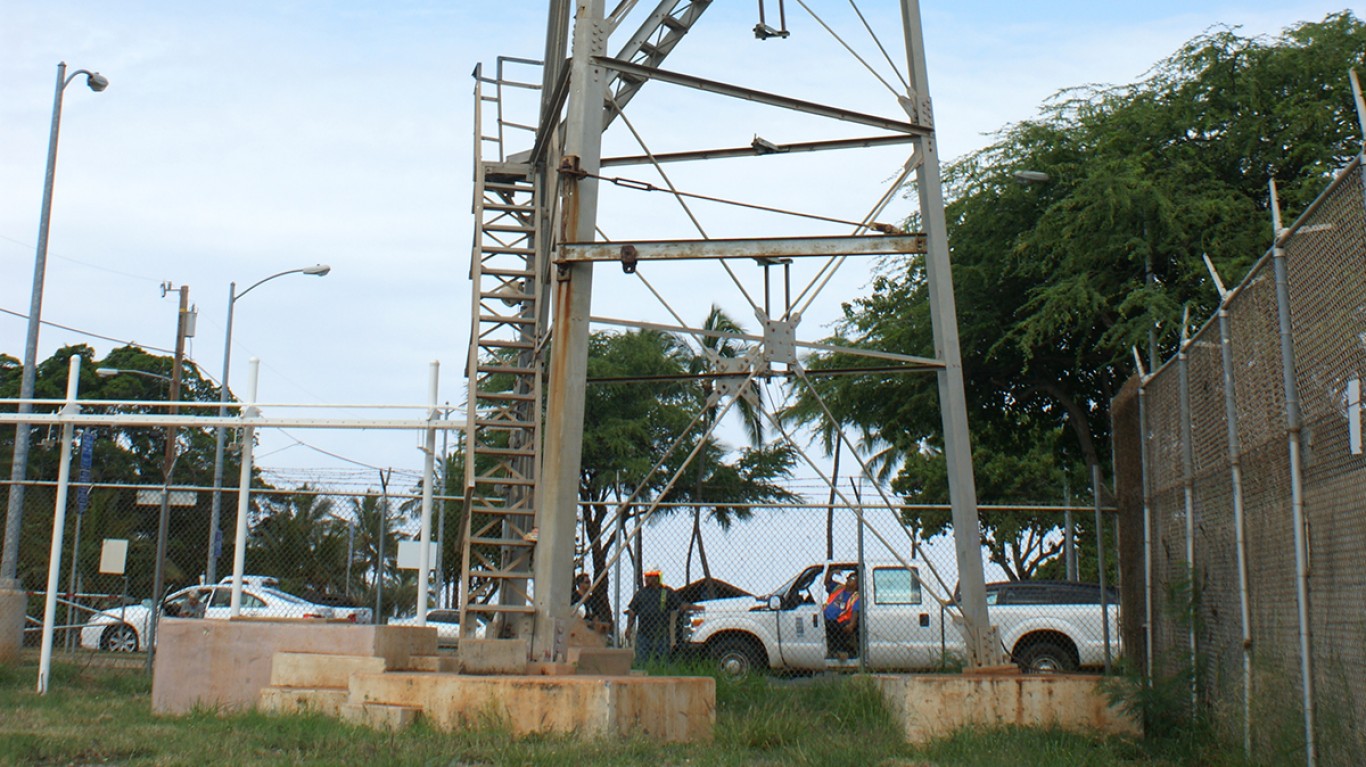
Even though Nanakuli, Hawaii, has a relatively high median annual household income at $65,101, residents typically do not have as much purchasing power as the average American. This is because the cost of living in the city is 61% higher than the average cost of living across the nation. Adjusted for cost of living, the median income in Nanakuli is only about $40,000.
A high cost of living is especially burdensome for people who are out of work. Nanakuli has an 8.3% five-year unemployment rate, more than double the comparable U.S. rate.
[in-text-ad]

24. Robstown, Texas
> Population: 11,546
> Poverty rate: 35.1% (top 10%)
> 2017 violent crimes per 100,000 people: 894 (top 10%)
> Median home value: $54,300 (bottom 10%)
Robstown is a small city in southern Texas, just west of Corpus Christi. The city has struggled with a high jobless rate for years. The Census estimates that an average of 8.1% of the area’s labor force has been unemployed over the last five years, well above the comparable 4.1% national unemployment rate. Indeed, jobs appear to be disappearing in the city. Overall employment dipped in Robstown by 6.6% between 2012 and 2017, even as U.S. employment rose by 6.1%.
Likely due in part to the weak job market, Robstown is losing residents. Even though Texas ranks as one of the fastest growing states, Robstown’s population shrunk by 0.2% in the last five years.

23. Maili, Hawaii
> Population: 10,190
> Poverty rate: 20.2% (top 25%)
> 2017 violent crimes per 100,000 people: N/A
> Median home value: $436,200 (top 25%)
Maili, Hawaii, ranks among the worst cities to live largely because of its high cost of living — which does not align with what many residents can comfortably afford. Goods and services in the area are 61.4% more expensive than they are nationwide, on average. Though the typical area household earns $71,806 per year, incomes are actually far lower than average after accounting for cost of living. The cost of living is especially straining for the larger than typical 20.2% share of residents living in poverty.
Housing is particularly expensive in the city. The typical area home is worth $436,200 — or about 6.1 times the median household income. Nationwide, the typical home is worth $193,500, or just 3.4 times higher than the $57,652 median income.
22. Bogalusa, Louisiana
> Population: 11,852
> Poverty rate: 36.3% (top 10%)
> 2017 violent crimes per 100,000 people: 1,298 (top 10%)
> Median home value: $68,800 (bottom 10%)
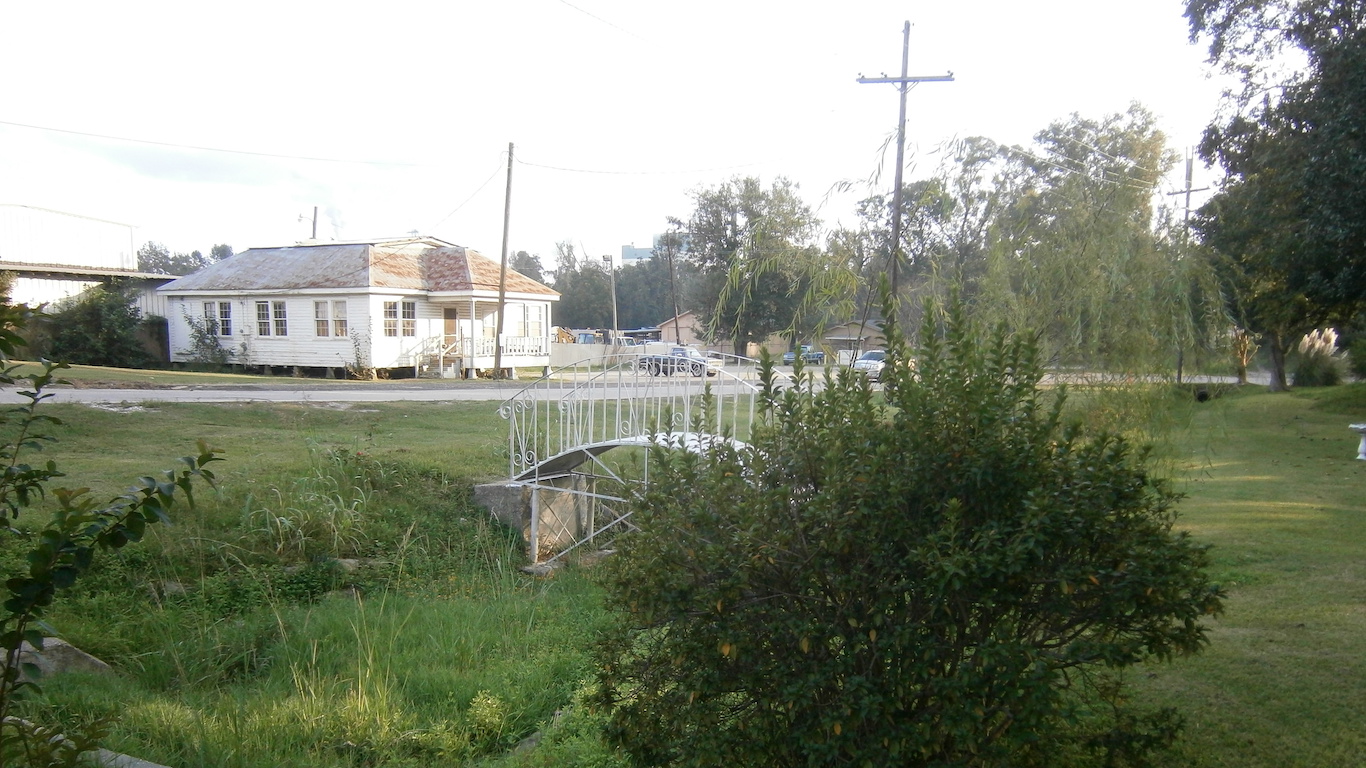
Of the more than 4,700 cities considered for this list, fewer than 100 have a median home value lower than in Bogalusa, Louisiana. Most homes in the city cost less than $70,000. For comparison, the typical home in the U.S. is worth $193,500. Very few residents are equipped to pay for an expensive home, as the city’s median annual household income is just $24,600.
Bogalusa has a five-year unemployment rate of 9.4%, well above the U.S. unemployment rate over that time. Despite these economic difficulties, there are signs of improvement in the city. Employment growth in the city over the past five years has exceeded 10%, outpacing the U.S. employment growth rate of 6.1%.
[in-text-ad-2]
21. Firebaugh, California
> Population: 8,275
> Poverty rate: 30.0% (top 10%)
> 2017 violent crimes per 100,000 people: 320
> Median home value: $150,700
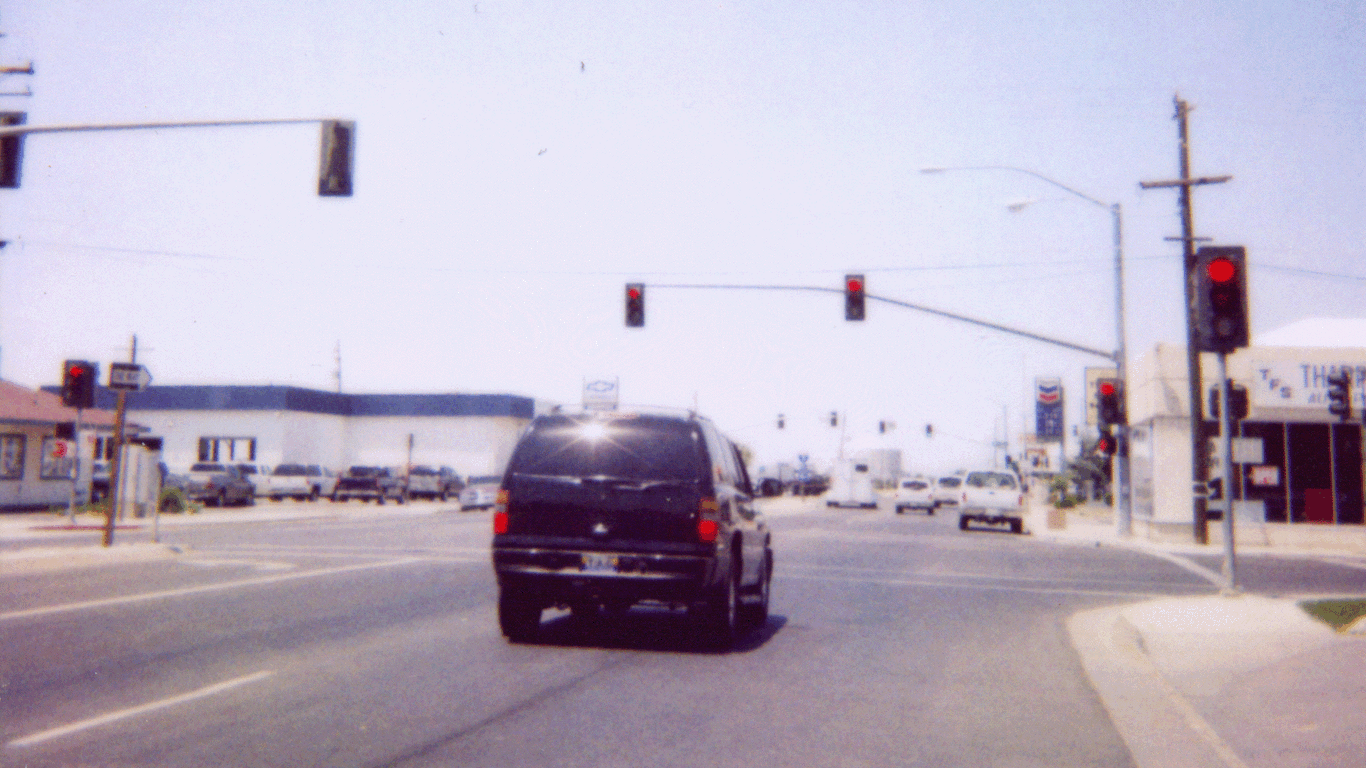
Areas with lower levels of education tend to have lower of incomes and higher poverty rates. This holds true in the case of Firebaugh, California. Just 6.3% of Firebaugh adults have a bachelor’s degree, compared to 30.9% of U.S. adults. Three in 10 city residents live in poverty, more than double the U.S. poverty rate. At least half of all city households earn less than $42,000 per year.
The five-year unemployment rate in Firebaugh of 11% is more than double the U.S. unemployment rate over that time. The area’s job market appears to be improving however. Total employment increased by 15% over the last five years, far outpacing the comparable 6.1% employment growth nationwide.
20. Benton Harbor, Michigan
> Population: 9,944
> Poverty rate: 48.0% (top 10%)
> 2017 violent crimes per 100,000 people: 2,202 (top 10%)
> Median home value: $56,200 (bottom 10%)
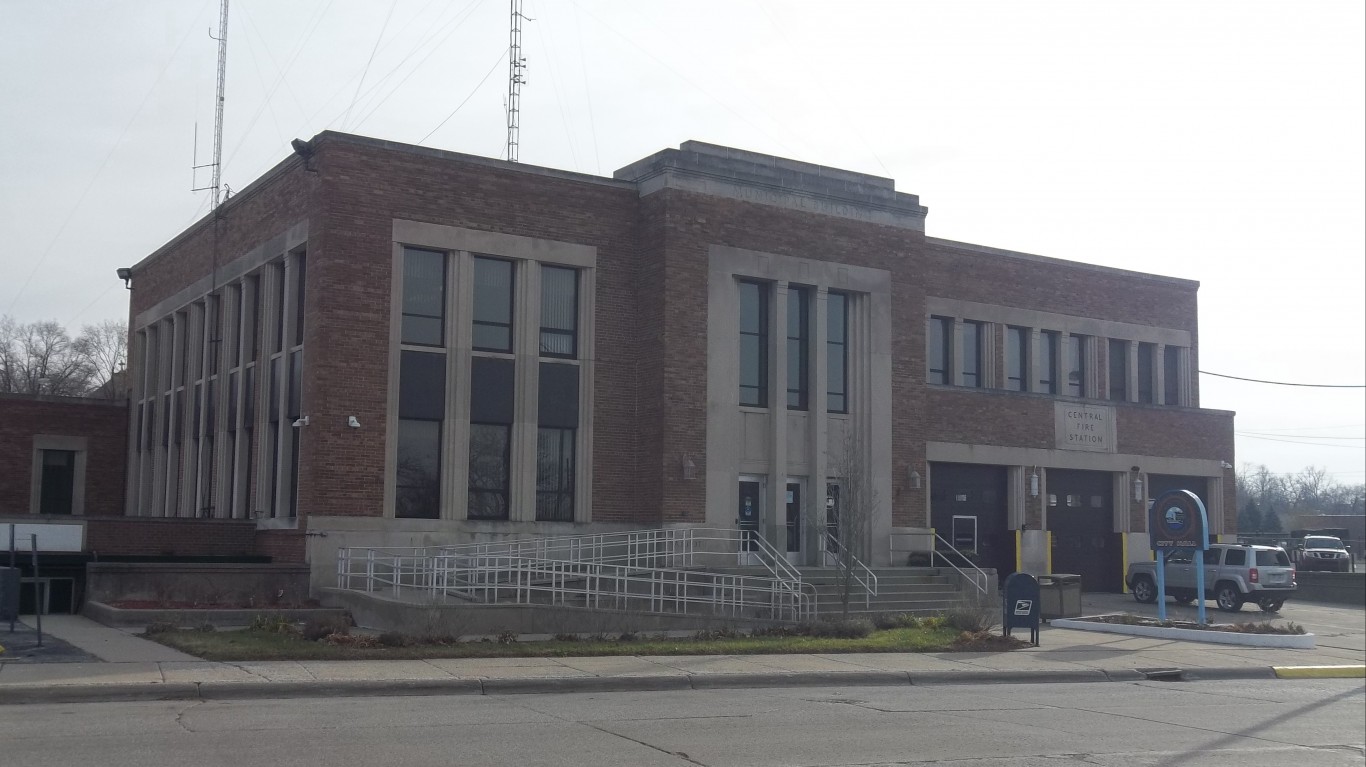
Benton Harbor is a small city in western Michigan. With over 2,200 violent crimes for every 100,000 residents in 2017, it ranks as the most dangerous city in the state and one of the most dangerous in the country. For reference, there were 383 violent crimes for every 100,000 people nationwide the same year.
Unsafe streets can drive current residents away and make a city less appealing to potential residents. In the last five years, Benton Harbor’s population declined by 1.7%, even as the U.S. population grew by 3.8%.
[in-text-ad]
19. Muskegon Heights, Michigan
> Population: 10,743
> Poverty rate: 39.3% (top 10%)
> 2017 violent crimes per 100,000 people: 1,808 (top 10%)
> Median home value: $42,900 (bottom 10%)
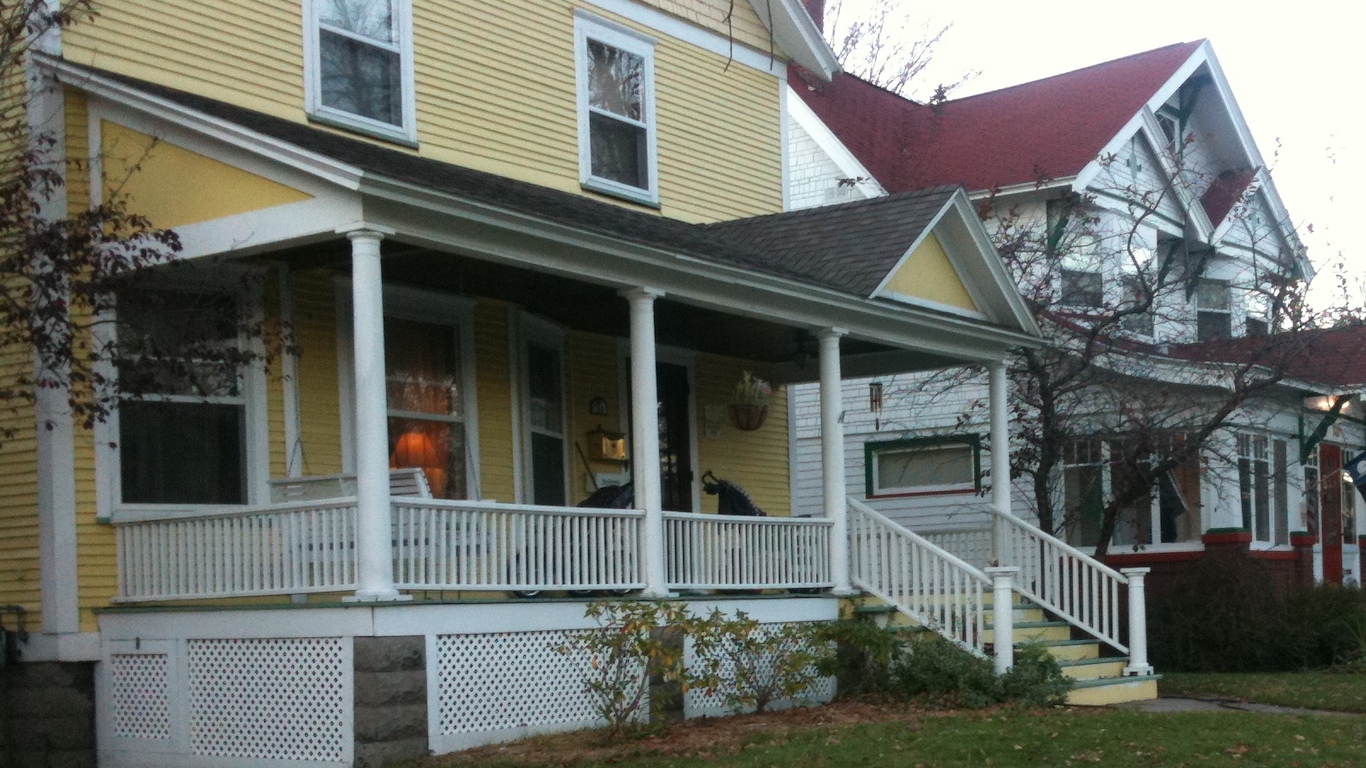
For both individuals and broad populations, incomes tend to rise with educational attainment. In Muskegon Heights, Michigan, just 5.8% of adults have a bachelor’s degree or higher, one of the smallest bachelor’s degree attainment rates of any U.S. city. Incomes in the area are similarly low. The typical household in the city earns just $25,411 a year, less than half the median across the U.S. as a whole of $57,652.
Muskegon also struggles with crime. There were over 6,000 property crimes reported in the city for every 100,000 people in 2017, the most of any city in Michigan. Additionally, the city’s violent crime rate of 1,808 incidents per 100,000 people is higher than over 90% of all U.S. cities.

18. Detroit, Michigan
> Population: 679,865
> Poverty rate: 37.9% (top 10%)
> 2017 violent crimes per 100,000 people: 2,057 (top 10%)
> Median home value: $42,800 (bottom 10%)
Home to nearly 700,000 residents, Detroit is by far the largest city to rank among the worst places to live. The quintessential Rust Belt city, Detroit is now a shadow of its former self, declining in population from a mid-century peak of 1.8 million. Though the broader metro area’s iconic manufacturing sector has staged a comeback in recent years, unemployment in Detroit remains high. The Census estimates that an average of 10.6% of the city’s labor force was unemployed over the last five years, more than double the comparable 4.1% national rate.
Struggling economically, Detroit is also dangerous. It is one of only 11 cities nationwide where there were over 2,000 violent crimes reported for every 100,000 people in 2017.

17. Adelanto, California
> Population: 32,867
> Poverty rate: 38.5% (top 10%)
> 2017 violent crimes per 100,000 people: 706 (top 25%)
> Median home value: $151,600
In Adelanto, California, 38.5% of residents live in poverty, one of the 50 highest poverty rates among more than 4,700 cities considered for this list. Higher poverty rates are often associated with lower educational attainment rates. Just 5.2% of adults Adelanto residents hold a bachelor’s degree, one of the smallest shares of any U.S. city and well below the 30.9% share of American adults.
Adelanto residents also face an average daily commute of more than 41 minutes one way, about 15 minutes longer than the average American’s trip to work. This additional travel time adds up to nearly 2.5 hours in the course of a single week. Lengthy commutes can lead to considerable stress and detract from overall quality of life.
[in-text-ad-2]
16. Hammond, Louisiana
> Population: 20,325
> Poverty rate: 34.1% (top 10%)
> 2017 violent crimes per 100,000 people: 1,487 (top 10%)
> Median home value: $149,400
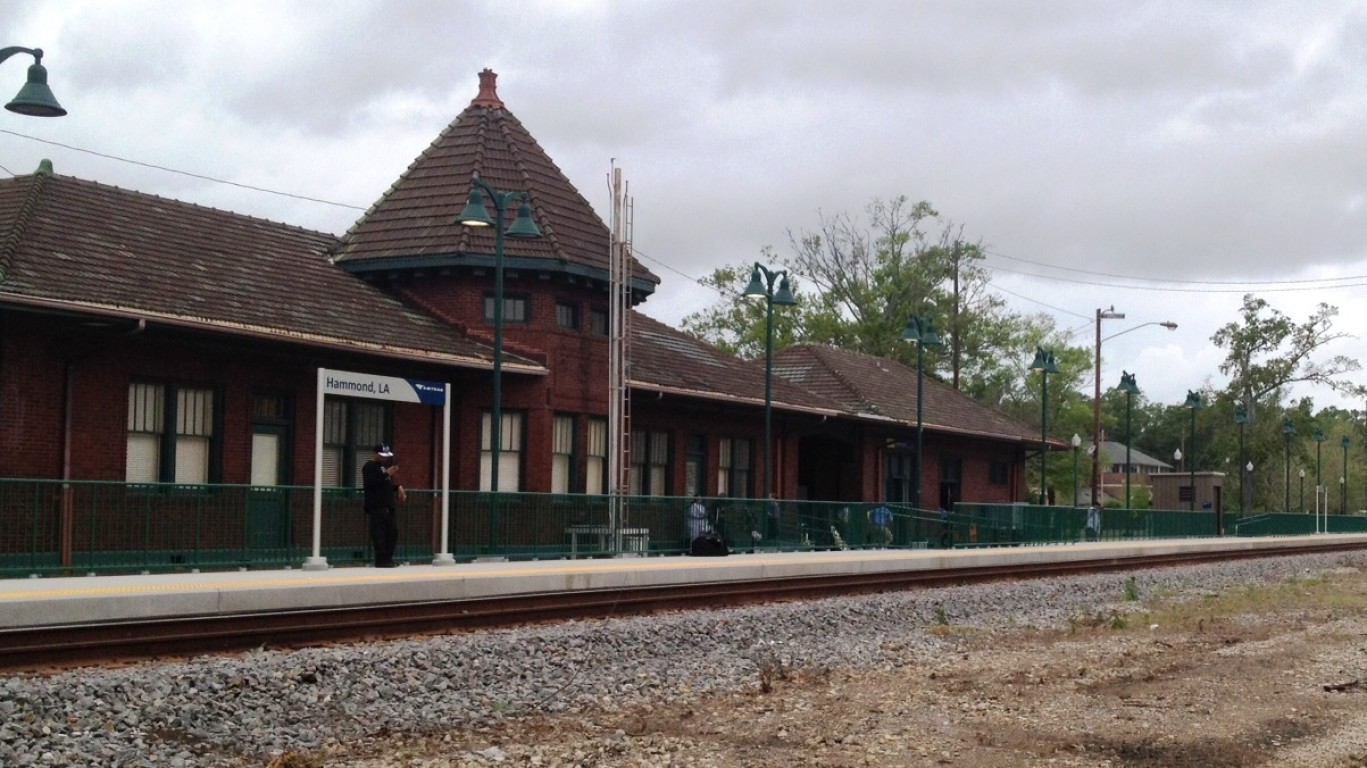
Hammond, Louisiana, is one of the poorest cities in the country. More than one in every three residents live below the poverty line, and the typical area household earns just $37,059 a year. Hammond also has a high food insecurity rate. An estimated 41.1% of the population have low access to supermarkets or grocery stores, nearly double the 22.4% comparable national share.
Crime is a serious problem in Hammond. There were nearly 9,700 property crimes reported in the city for every 100,000 people in 2017, the most of any city in Louisiana. Additionally, the city’s violent crime rate of 1,487 incidents per 100,000 people is higher than in over 90% of all U.S. cities.
15. Union City, Georgia
> Population: 20,793
> Poverty rate: 20.7% (top 25%)
> 2017 violent crimes per 100,000 people: 1,224 (top 10%)
> Median home value: $81,900 (bottom 10%)
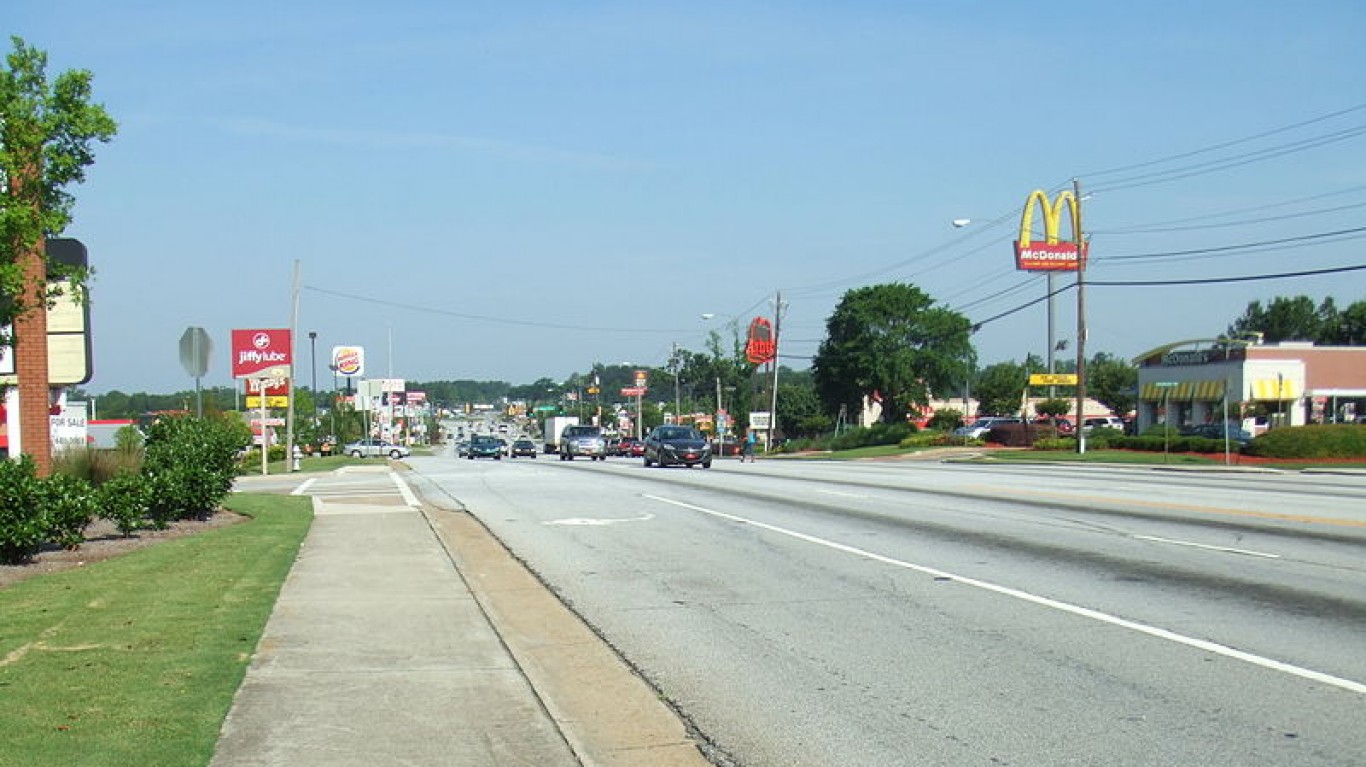
Though the population of Union City, Georgia, increased by 7.4% in the past five years, the number of people employed in the city dropped by 1.2%. The city’s unemployment rate has been relatively high over the last five years at an average of 7.4%. The weak job market likely contributes to the city’s relatively low median household income of $35,627 a year.
Union City ranks as one of the worst cities to live in also because of crime issues. Its violent crime rate of 1,224 incidents per 100,000 residents is more than three times as high as the U.S. rate. The city’s property crime rate is also more than four times higher than the U.S. rate at 10,940 reported incidents per 100,000 residents.
[in-text-ad]
14. East St. Louis, Illinois
> Population: 26,678
> Poverty rate: 43.1% (top 10%)
> 2017 violent crimes per 100,000 people: 2,752 (top 10%)
> Median home value: $55,000 (bottom 10%)
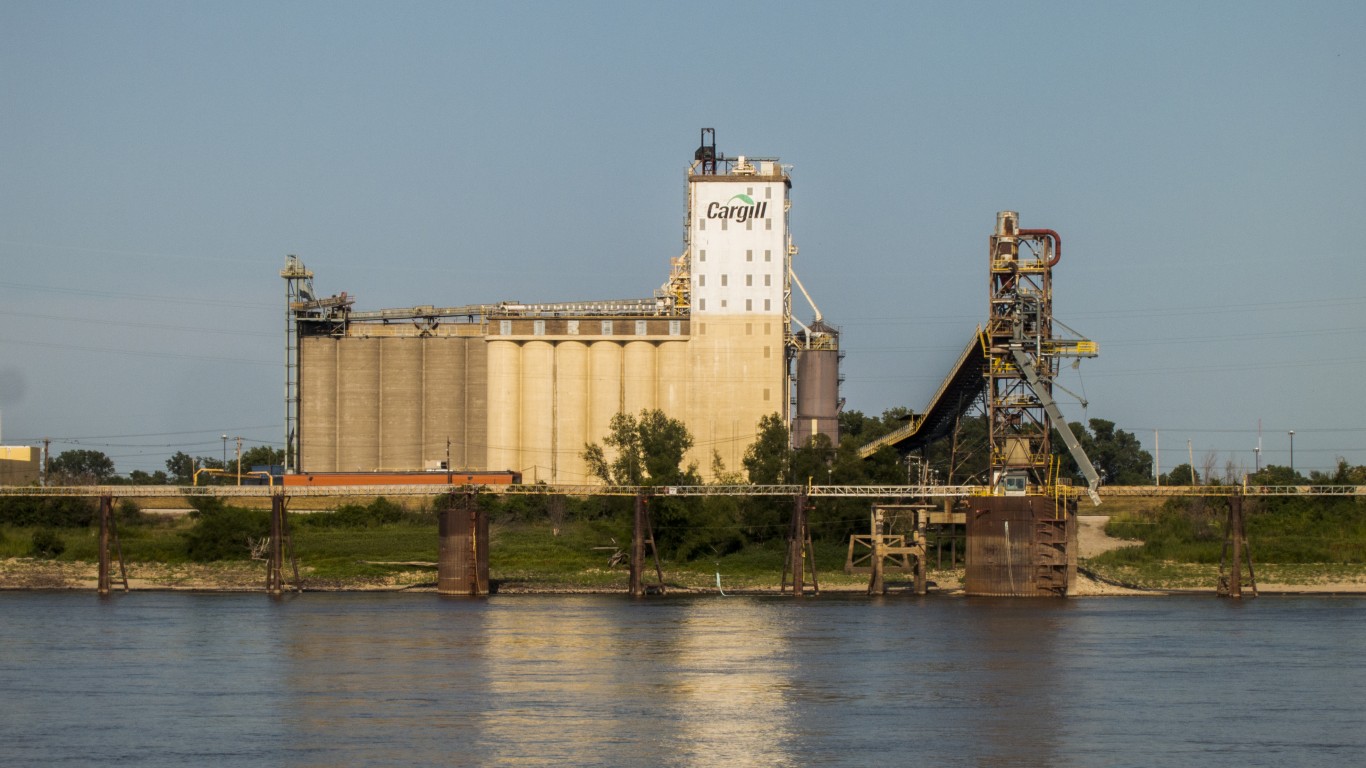
East St. Louis is the most dangerous city in the most dangerous metro area in the United States. Across the broader St. Louis metro area, there were 2,082 violent crimes for every 100,000 residents in 2017 — more than five times the national violent crime rate of 383 incidents per 100,000 people. In East St. Louis, there were 2,752 violent crimes per 100,000 residents, more than seven times the national rate.
High crime areas are often poor, and many in East St. Louis face serious financial hardship. The city’s 43.1% poverty rate is among the highest of any U.S. city. Unsafe streets and widespread poverty may be driving some out of the city. In the last five years, East St. Louis’s population declined by 1.6%, even as the U.S. grew by 3.8%.
13. Bridgeton, New Jersey
> Population: 24,948
> Poverty rate: 32.3% (top 10%)
> 2017 violent crimes per 100,000 people: 1,091 (top 10%)
> Median home value: $103,400 (bottom 25%)
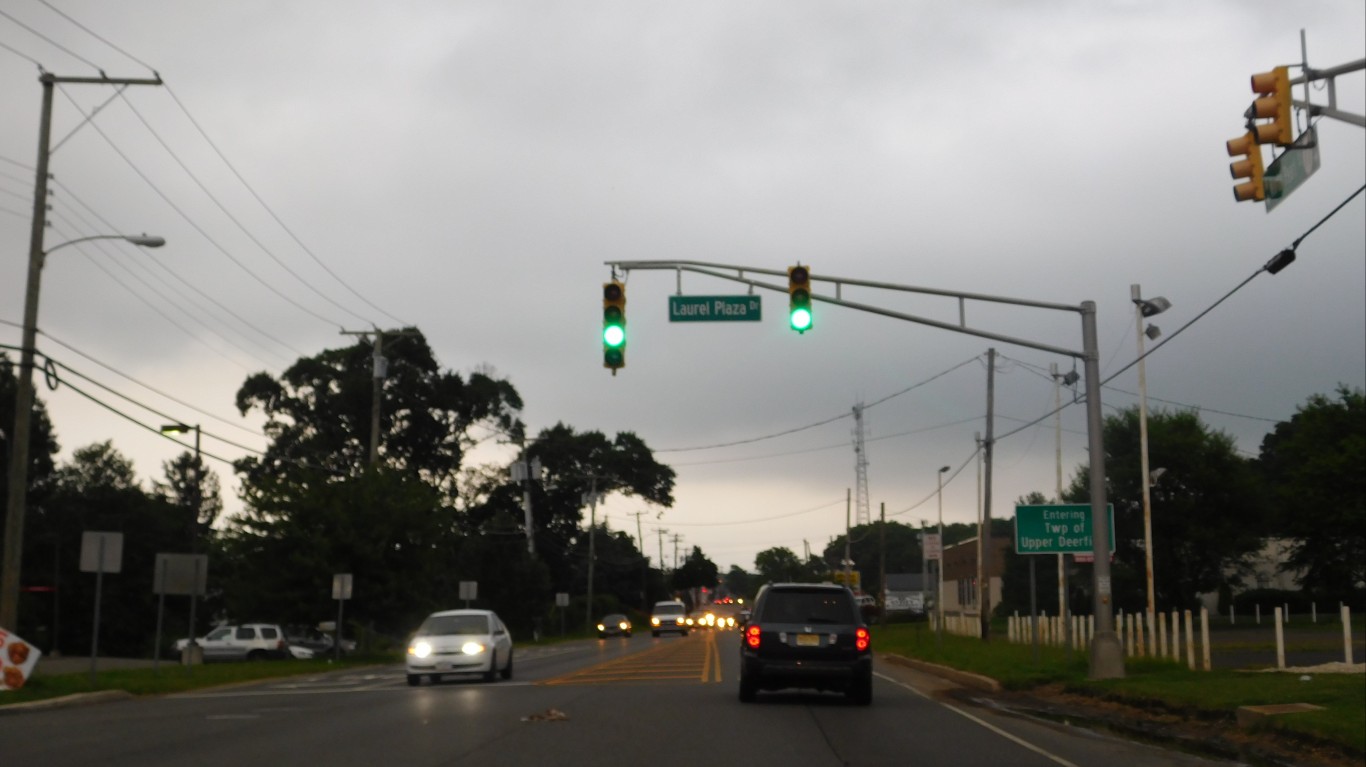
Bridgeton, a small city in southern New Jersey, is the worst city to live in in the state and one of the worst in the country. The typical household earns just $34,135 a year, less than half the median annual household income of $76,475 across the state as a whole. Lower-income residents are further burdened by the city’s high cost of living. Goods and services are 9.3% more expensive in Bridgeton than they are nationwide, on average.
Like many cities on this list, Bridgeton is losing residents. Over the last five years, the city’s population declined by 1.2%, even as the U.S. population grew by 3.8%.

12. Prichard, Alabama
> Population: 22,063
> Poverty rate: 35.1% (top 10%)
> 2017 violent crimes per 100,000 people: 1,826 (top 10%)
> Median home value: $67,400 (bottom 10%)
Over the past five years, the number of jobs in Prichard, Alabama has decreased by nearly 17%, one of the highest rates of job losses anywhere in the country. Over the same period, employment climbed 6.1% nationwide.
Prichard, near Mobile in southern Alabama, has a median annual household income of $25,818 — less than half of the U.S. median. Prichard, like many other low income areas on this list, is losing residents. In the last five years, Prichard’s population dropped by 3.4%.
[in-text-ad-2]
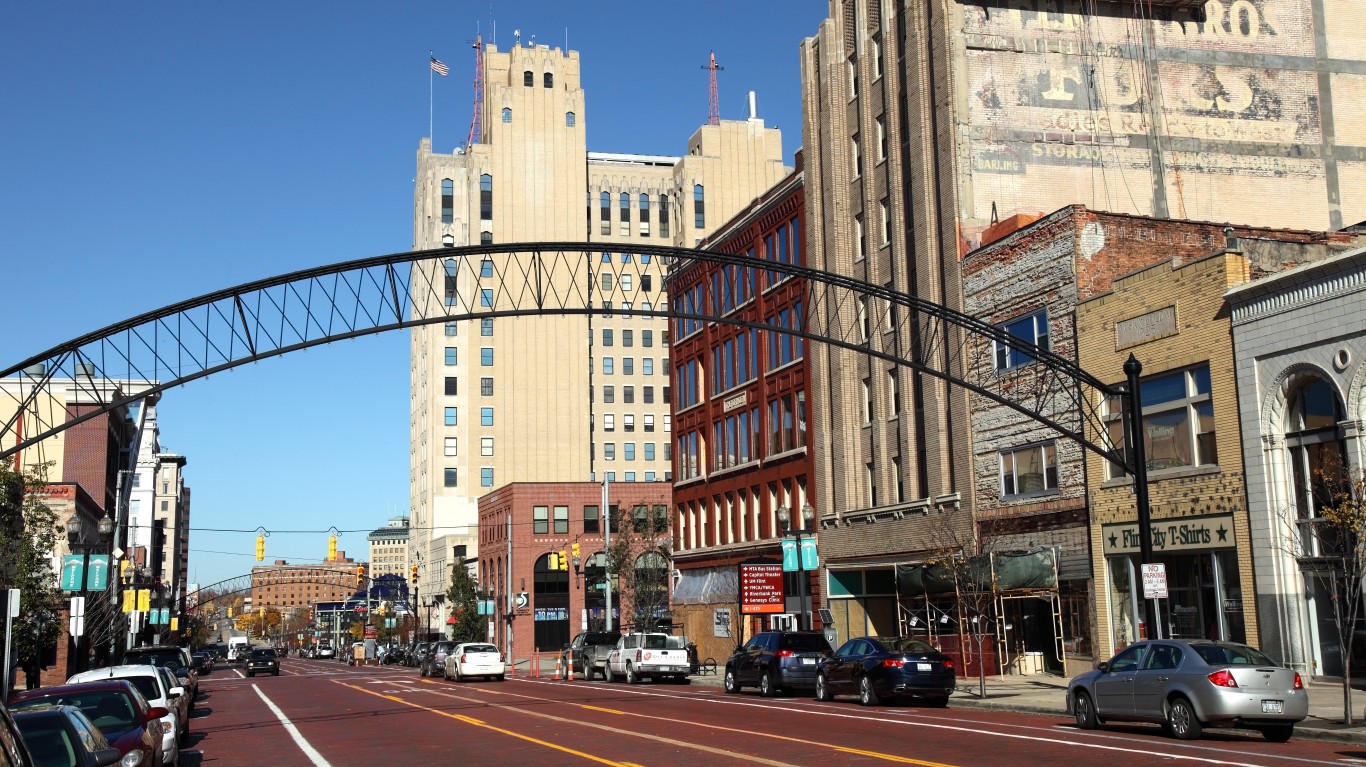
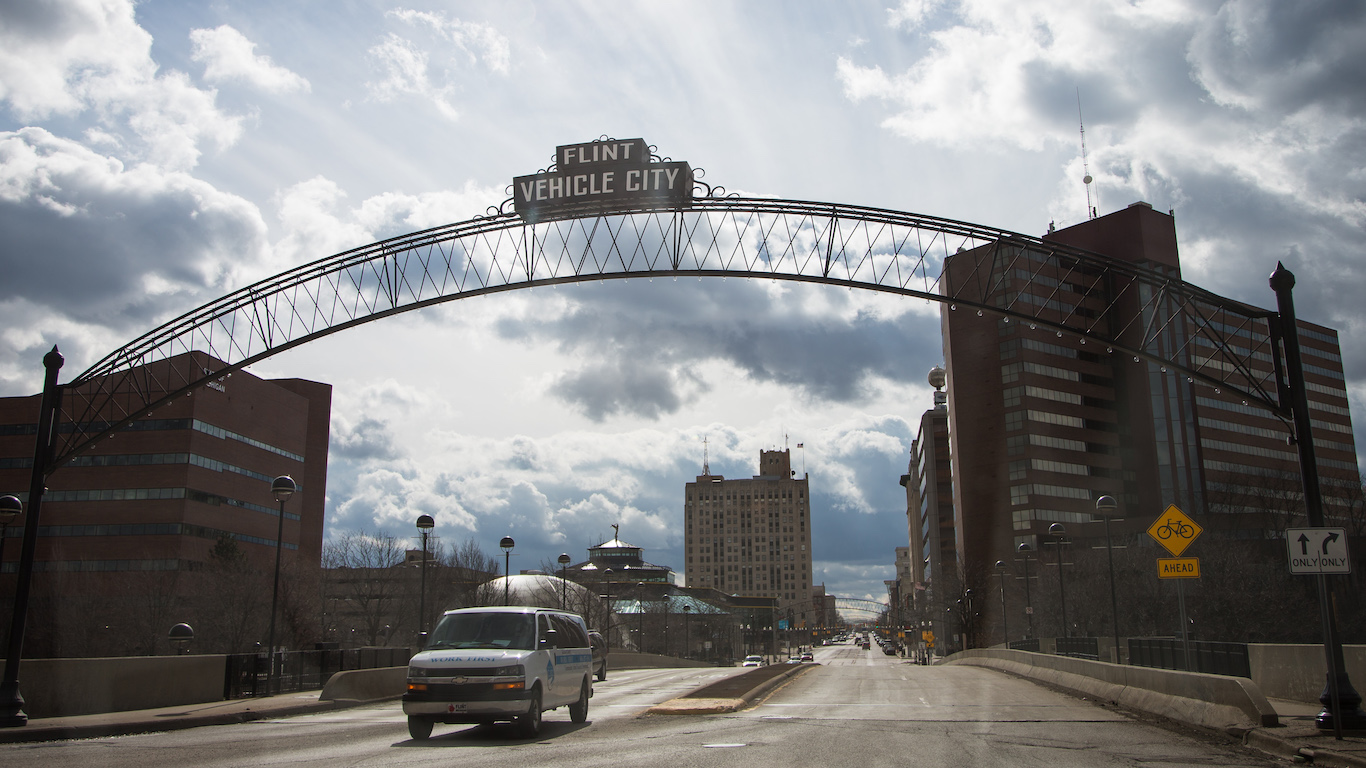
11. Flint, Michigan
> Population: 97,810
> Poverty rate: 41.2% (top 10%)
> 2017 violent crimes per 100,000 people: 1,945 (top 10%)
> Median home value: $28,200 (bottom 10%)
Flint, Michigan, is one of the poorest and most dangerous cities in the United States. About half of all households in Flint earn less than $26,330 a year, and 41.2% of the population lives below the poverty line. Poor areas often report higher crime levels than more affluent places, and in Flint, there were 1,945 violent crimes for every 100,000 people in 2017, more than in over 90% of all U.S. cities.
Flint has made national news in recent years after it was discovered that the city water supply was contaminated with lead. The contamination crisis has driven people out of the city and depressed real estate values. In the last five years, Flint’s population fell by 5.3%. Additionally, the typical home is worth just $28,200, a fraction of the typical American home value of $193,500.
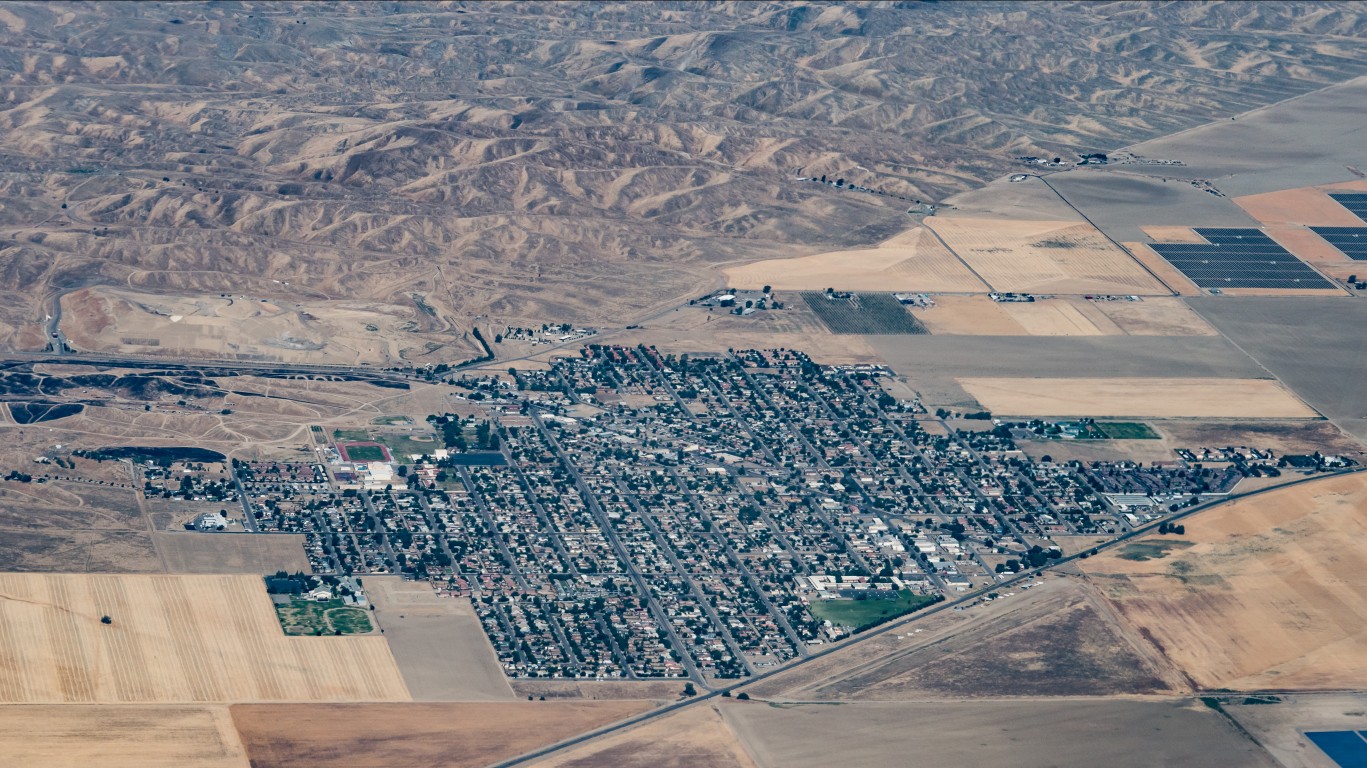
10. Avenal, California
> Population: 13,119
> Poverty rate: 36.3% (top 10%)
> 2017 violent crimes per 100,000 people: 548 (top 25%)
> Median home value: $129,900
Avenal, California ranks as one of the 10 worst cities to live in part because it is losing jobs at a much faster rate than almost anywhere else in the country. From 2012 to 2017, employment dropped by more than 23% in the California city. This is at least partially explained by the fact that, in the same time period, the city’s population dropped by 14.5%.
Real estate in California is typically much more expensive than the average nationwide, as most homes cost more than $440,000 compared to the median of $193,500 nationwide. Yet in Avenal, the typical home is worth less than $130,000, a reflection of low incomes in the area. More than one in every three Avenal residents live below the poverty line.
[in-text-ad]
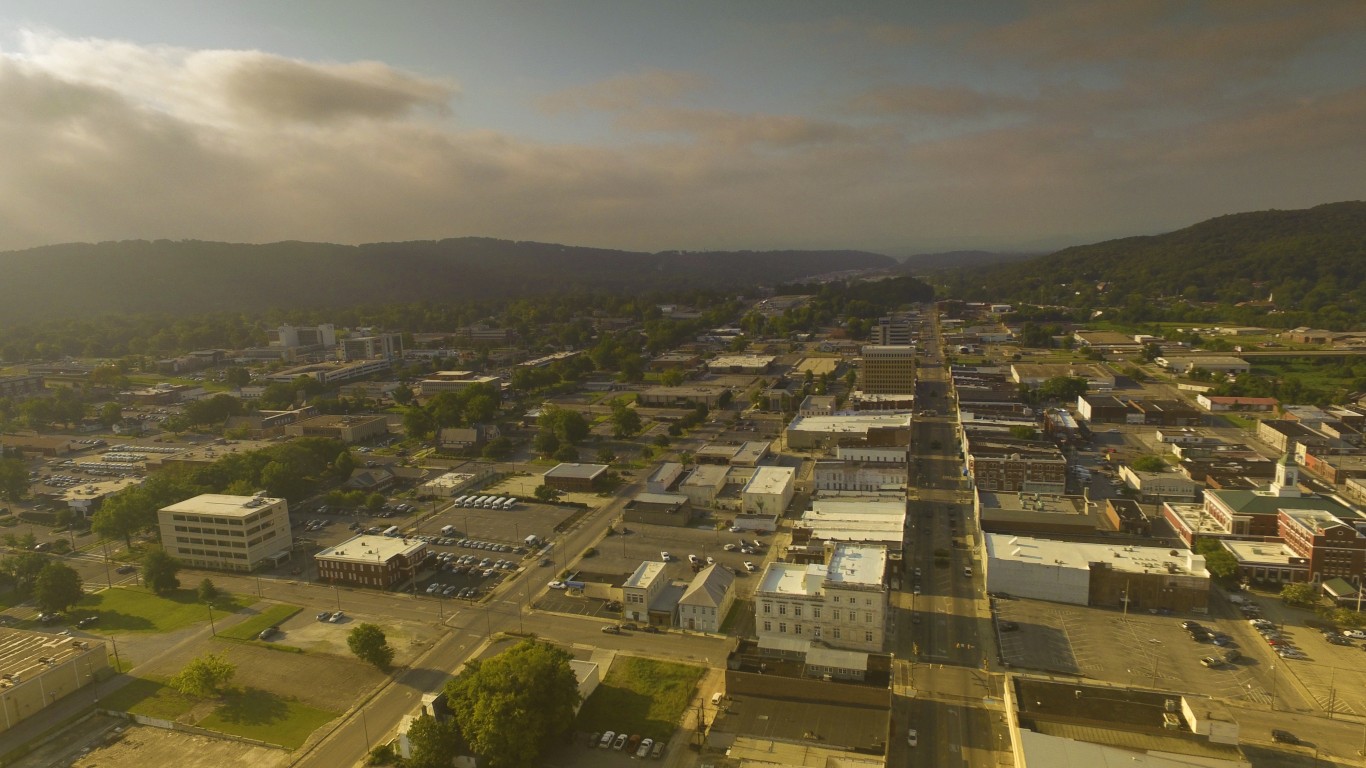
9. Anniston, Alabama
> Population: 22,097
> Poverty rate: 29.5% (top 10%)
> 2017 violent crimes per 100,000 people: 3,434 (top 10%)
> Median home value: $95,700 (bottom 25%)
Like many cities on this list, Anniston, Alabama, is losing residents. In the last five years, Anniston’s population declined by 4.2%. Over the same period, the number of people working in the city fell by a staggering 10.9%.
The city’s population decline may be attributable to low incomes and a high violent crime rate. The typical household in Anniston earns just $32,070 a year. Additionally, there were 3,434 violent crimes for every 100,000 people in Anniston in 2017, the most of any city in the country.

8. Waianae, Hawaii
> Population: 13,636
> Poverty rate: 27.0% (top 10%)
> 2017 violent crimes per 100,000 people: N/A
> Median home value: $339,500 (top 25%)
Waianae, Hawaii, is one of the few cities on this list with a higher median income than the U.S. as a whole. The typical household in the city earns $60,282 a year, or $2,630 more than the typical American household. Bigger paychecks are not nearly enough to cover the high cost of living in Waianae, however. Goods and services in the area are 61.4% more expensive than they are on average nationwide.
The high cost of living imposes an especially heavy burden on the relatively large share of Waianae residents living below the poverty line. Of the city’s 13,636 residents, 27% live in poverty, a higher poverty rate than in over 90% of U.S. cities.

7. Bastrop, Louisiana
> Population: 10,643
> Poverty rate: 43.5% (top 10%)
> 2017 violent crimes per 100,000 people: 1,511 (top 10%)
> Median home value: $73,000 (bottom 10%)
In Bastrop, Louisiana, there were 1,511 violent crimes reported for every 100,000 residents in 2017. That means violent crimes occurred there nearly four times as frequently as they did in America as a whole.
Crime is often more common in poorer areas, and Bastrop has one of the highest poverty rates of any U.S. city. Some 43.5% of residents live below the poverty line — nearly three times higher than the U.S. poverty rate. Like many other cities that rank among the worst places to live, Bastrop is losing a significant portion of its residents. In the past five years, the city’s population fell by 6.2%.
[in-text-ad-2]

6. Bessemer, Alabama
> Population: 26,697
> Poverty rate: 29.7% (top 10%)
> 2017 violent crimes per 100,000 people: 2,986 (top 10%)
> Median home value: $84,000 (bottom 10%)
With 2,986 violent crimes reported per 100,000 residents a year, Bessemer, Alabama, has the second highest violent crime rate in the nation, trailing only Anniston, Alabama. Bessemer also has the sixth highest property crime rate with nearly 9,800 reported property crimes per 100,000 residents.
In addition to high crime, residents face a number of economic challenges. Nearly 30% of residents live in poverty, and more than one in three residents have low access to grocery store or super markets. The typical Bessemer home earns less than $32,000 a year, well below the U.S. median annual household income of $57,652.
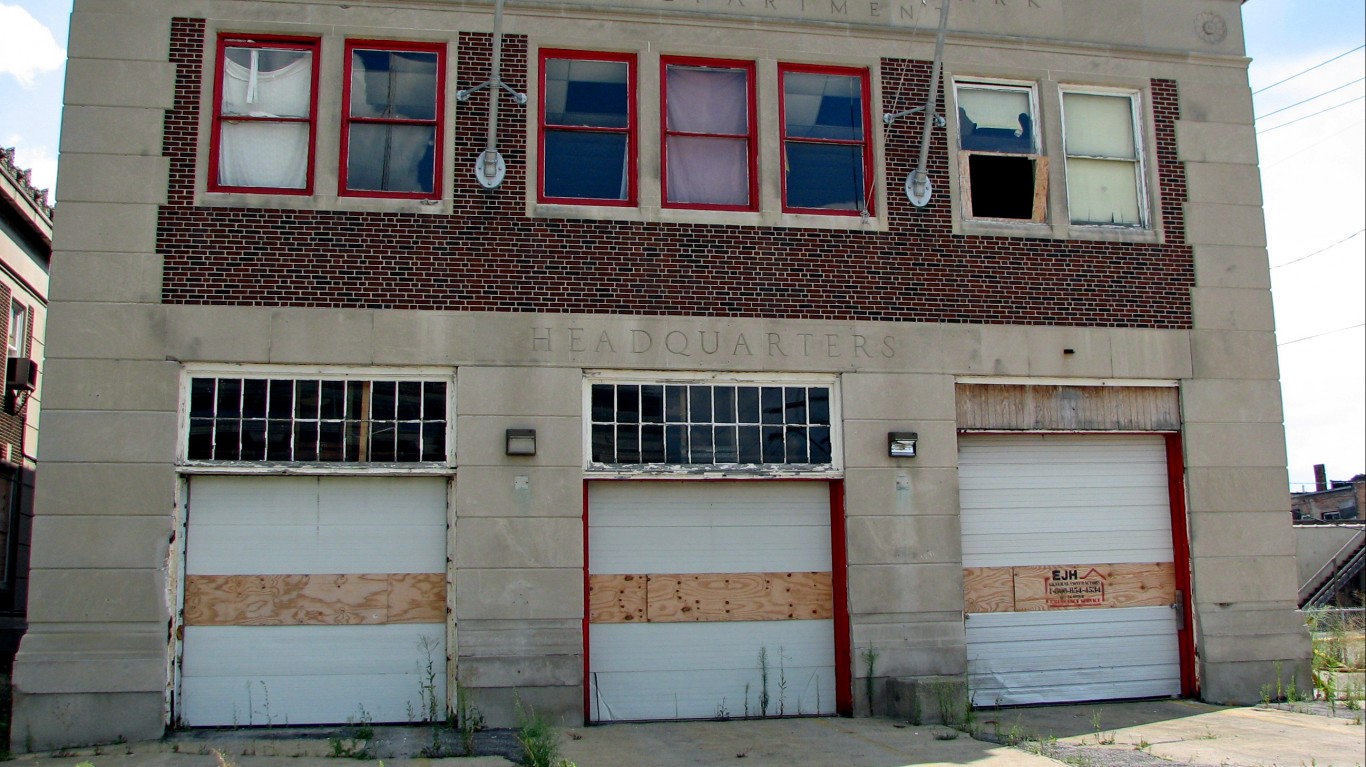
5. Highland Park, Michigan
> Population: 10,955
> Poverty rate: 49.0% (top 10%)
> 2017 violent crimes per 100,000 people: 1,701 (top 10%)
> Median home value: $33,500 (bottom 10%)
Highland Park, Michigan, ranks as the fifth worst city to live in the country in part because it is the poorest American city by a wide margin. Highland Park’s median annual household income is $15,699, nearly $42,000 lower than the U.S. median. It is the only city in the nation in which most households earn less than $20,000 a year.
In Highland Park, which is within the Detroit metro area, 49% of residents live below the poverty line — one of the highest poverty rates nationwide. The city’s five-year average unemployment rate of 13.2% is well above the comparable U.S. rate of 4.1%. The economic situation in Highland Park has worsened in recent years. From 2012 to 2017, employment has dropped more than 15%.
[in-text-ad]

4. Makaha, Hawaii
> Population: 8,832
> Poverty rate: 30.1% (top 10%)
> 2017 violent crimes per 100,000 people: N/A
> Median home value: $407,200 (top 25%)
Makaha is the worst city to live in in Hawaii and among the five worst in the country. Like other cities in the state, Makaha ranks poorly largely because of its high cost of living and low affordability. Goods and services are 61.4% more expensive in the city than they are on average nationwide. Housing is particularly unaffordable. The typical home in Makaha is worth nearly $564,000 — about eight times the median annual household income in the city of $51,833. Meanwhile, the typical American home is worth $193,500 — just 3.4 times the median income of $57,652.
Makaha is also struggling with a high jobless rate. The Census estimates that an average of 9.7% of the city’s labor force has been out of work over the last five years, more than double the comparable national unemployment rate of 4.1%.
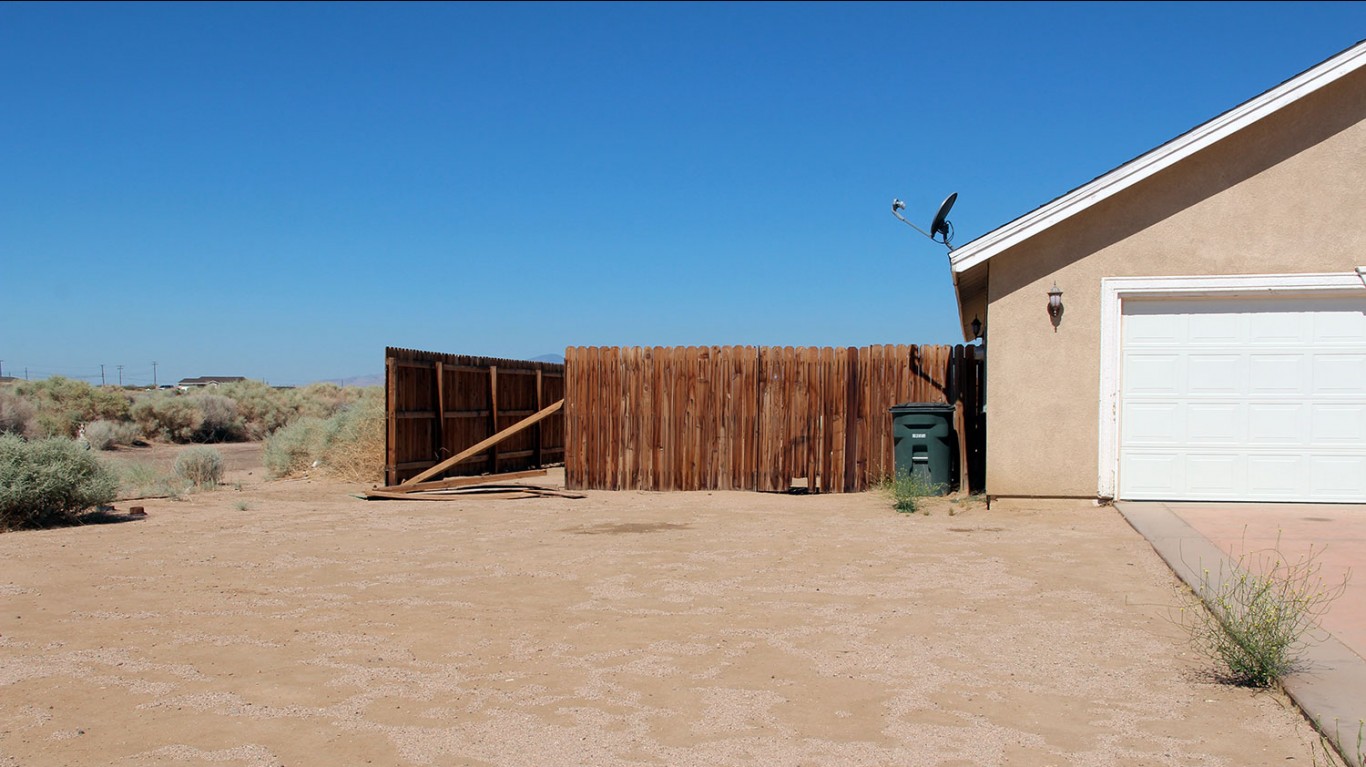
3. California City, California
> Population: 13,495
> Poverty rate: 29.9% (top 10%)
> 2017 violent crimes per 100,000 people: 640 (top 25%)
> Median home value: $102,000 (bottom 25%)
California City, California, residents are some of the most likely to be unemployed. Over the past five years, the average unemployment rate in city was 10.7%, according to Census estimates. Over the same period, employment in the city fell by 11.3%. This lack of jobs likely contributes to the city’s 29.9% poverty rate, which is more than double that of the U.S. as a whole.
Home values in California are some of the highest in the nation, with a $443,400 median value statewide. Yet, in California city, the median home value is just $102,000 — a reflection of lower incomes in the area. At least half of all households earn less than $46,000 a year.
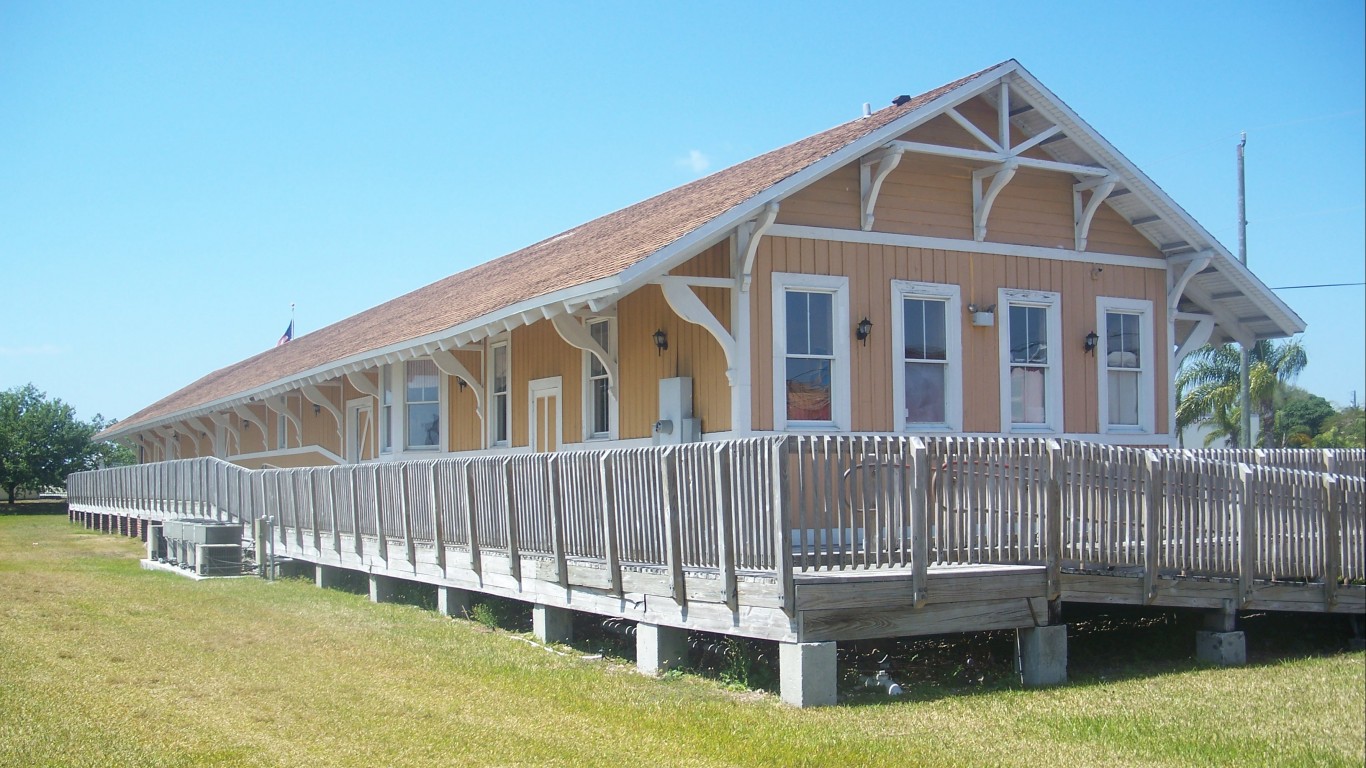
2. Florida City, Florida
> Population: 12,149
> Poverty rate: 41.2% (top 10%)
> 2017 violent crimes per 100,000 people: 2,276 (top 10%)
> Median home value: $110,800 (bottom 25%)
Florida City is the most dangerous city in the state. There were 2,276 violent crimes reported for every 100,000 residents in 2017 — nearly six times higher than the national violent crime rate. The city, located about 35 miles south of Miami, also has a high property crime rate. Property crimes include burglary, larceny, and motor vehicle theft, and there were 7,925 reported incidents of these crimes for every 100,000 residents in 2017, more than triple the national property crime rate.
High crime areas are often lower income, and the share of people living below the poverty line in Florida City is staggering. Florida City’s 41.2% poverty rate is higher than in over 90% of all other U.S. cities.
[in-text-ad-2]
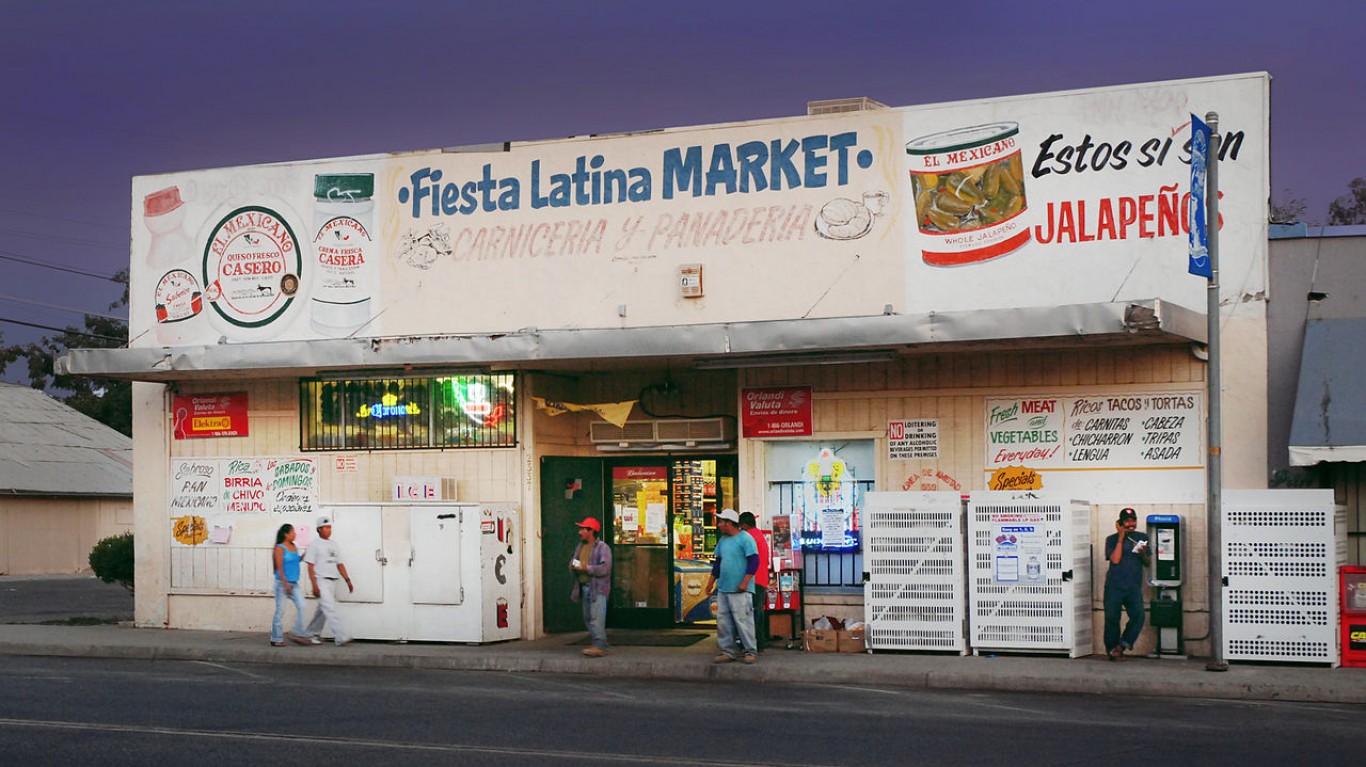
1. Mendota, California
> Population: 11,396
> Poverty rate: 49.5% (top 10%)
> 2017 violent crimes per 100,000 people: 646 (top 25%)
> Median home value: $139,000
For both individuals and broad populations, incomes tend to rise with educational attainment. In Mendota, California, just 1.8% of adults have a bachelor’s degree, the smallest share of any U.S. city. The city also has one of the poorest populations in the country. Half of all households earn less than $27,500 a year, and 49.5% of the population lives below the poverty line.
The widespread financial insecurity is partially attributable to a lack of jobs. The Census estimates that an average of 15.4% of the city’s labor force were unemployed in the last five years, the highest unemployment rate of any U.S. city and more than triple the comparable 4.1% national rate.
Methodology
To identify the best cities to live in, 24/7 Wall St. created a weighted index of 25 measures that fall into one of four categories: affordability, economy, quality of life, and community.
In the affordability category, the ratio of the median home value to the median income was given full weight. Cities where the median home value is closer to the median household income were rewarded. Cost of living, as determined by the average cost of goods and services in an area relative to average prices across the nation as a whole, was given a full weight. Property taxes are largely levied at the local level, and cities where residents pay more property taxes as a percentage of their home value were penalized. Property taxes were given a one-quarter weighting.
In the economy category, the unemployment rate was also given a full weight. We used five-year average unemployment due to lack of comparable annual data at local levels. Five-year employment growth and the share of the total working-age population with a job were each given a half weight, favoring areas with greater employment and growing jobs opportunities.
In the quality of life category, the poverty rate was given a full weight, penalizing cities where poverty is more common. The share of the population that struggles to put food on the table due to distance from a grocery store, known as the food insecurity rate, was given full weight. A city’s mortality rate, calculated as the number of people who died while in hospital care per hospital by city, was also given full weight. In cases where city-level data was not available, mortality rates were imputed from county level data.
The drug overdose mortality rate was given a one-quarter weighting, as was the hospital readmission rate, or the share of those released from the hospital who were readmitted within 30 days. Distance from the center of the city to the nearest hospital was given full weight.
The number of hospitalizations that would have been prevented by regularly scheduled doctor visits for every 1,000 Medicare enrollees — known as the preventable hospitalization rate — was given half weighting.
Measures used in the community category included the average travel time to work, which was given full weight. The violent crime rate — the total number of rapes, robberies, murders, and aggravated assaults adjusted per 100,000 residents per year— was given full weight. So, too, was the property crime rate, which is the total number of burglaries, larcenies, motor vehicle thefts, and incidents of arson per 100,000 residents per year.
The share of commuters either walking, cycling, or taking public transit to work was given half weight. The total number of restaurants, bars, museums, theater companies, movie theaters, libraries, and parks per capita were each given a one-quarter weighting.
To avoid geographic clustering, we only took the top-ranking city in a given county. Our list includes cities, towns, villages, boroughs, and Census designated places. We did not include places with fewer than 8,000 residents in our analysis.
Median household income, median home value, average travel time to work, poverty rate, population, employment-to-population ratio, median property taxes paid, and average unemployment rate are all five-year estimates from the U.S. Census Bureau’s American Community Survey and are for 2017. Overall cost of living is for 2014 and comes from data analysis and aggregation company ATTOM Data Solutions.
The population-adjusted number of entertainment and cultural venues like restaurants and museums comes from the Census Bureau’s County Business Patterns data set, and is for 2016.
Violent and property crime rates are from the FBI’s 2017 Uniform Crime Report. Drug overdose mortality rates are from the Centers for Disease Control and Prevention and are for the years 2014 to 2016. Mortality rates and hospital readmission rates are from the Centers for Medicare and Medicaid Services and are as of June 2015. Preventable hospitalizations are from the latest release from County Health Rankings & Roadmaps, a Robert Wood Johnson Foundation and University of Wisconsin Population Health Institute joint program.
Get Ready To Retire (Sponsored)
Start by taking a quick retirement quiz from SmartAsset that will match you with up to 3 financial advisors that serve your area and beyond in 5 minutes, or less.
Each advisor has been vetted by SmartAsset and is held to a fiduciary standard to act in your best interests.
Here’s how it works:
1. Answer SmartAsset advisor match quiz
2. Review your pre-screened matches at your leisure. Check out the advisors’ profiles.
3. Speak with advisors at no cost to you. Have an introductory call on the phone or introduction in person and choose whom to work with in the future
Get started right here.
Thank you for reading! Have some feedback for us?
Contact the 24/7 Wall St. editorial team.
 24/7 Wall St.
 24/7 Wall St.
 24/7 Wall St.


