
Married people live longer, are healthier, and are less likely to be depressed, according to several studies. A major reason is social support: husbands and wives are likely to encourage each other to engage in healthier behaviors and and provide emotional and practical support when needed.
At the same time, the independence of single life is for many people highly desirable. And not all people are desperately trying to get married. In fact, tying the knot is in decline. Marriage rates among young adults are falling. About 36% of adults under 65 today have never been married, compared to 26% in 1990, according to the Institute for Family Studies.
And while it’s true that divorce rates nowadays are also declining, people who walk down the aisle stay married for shorter periods of time because they get married later in life.
As of 2017, the latest year for which data is available, nearly half of Americans over the age of 15, or about 130 million, were single, according to the U.S. Census Bureau.
24/7 Wall St. reviewed the proportion of the adult population who is single in all U.S. metro areas, the concentration of restaurants and bars, and income levels to determine the best cities for singles. More than half of the adult population in 20 of the 25 cities on the following list is single. Most of the cities offer more than the national average number or places for social interaction per capita. And in half of the cities, the annual personal income exceeds the national average.
Click here to see America’s best cities for singles.

25. Columbia, Missouri
> Single population: 55.3%
> Total 15+ population: 144,538
> Annual personal income: $46,252
> Cost of living: 8.6% less than the national average
[in-text-ad]
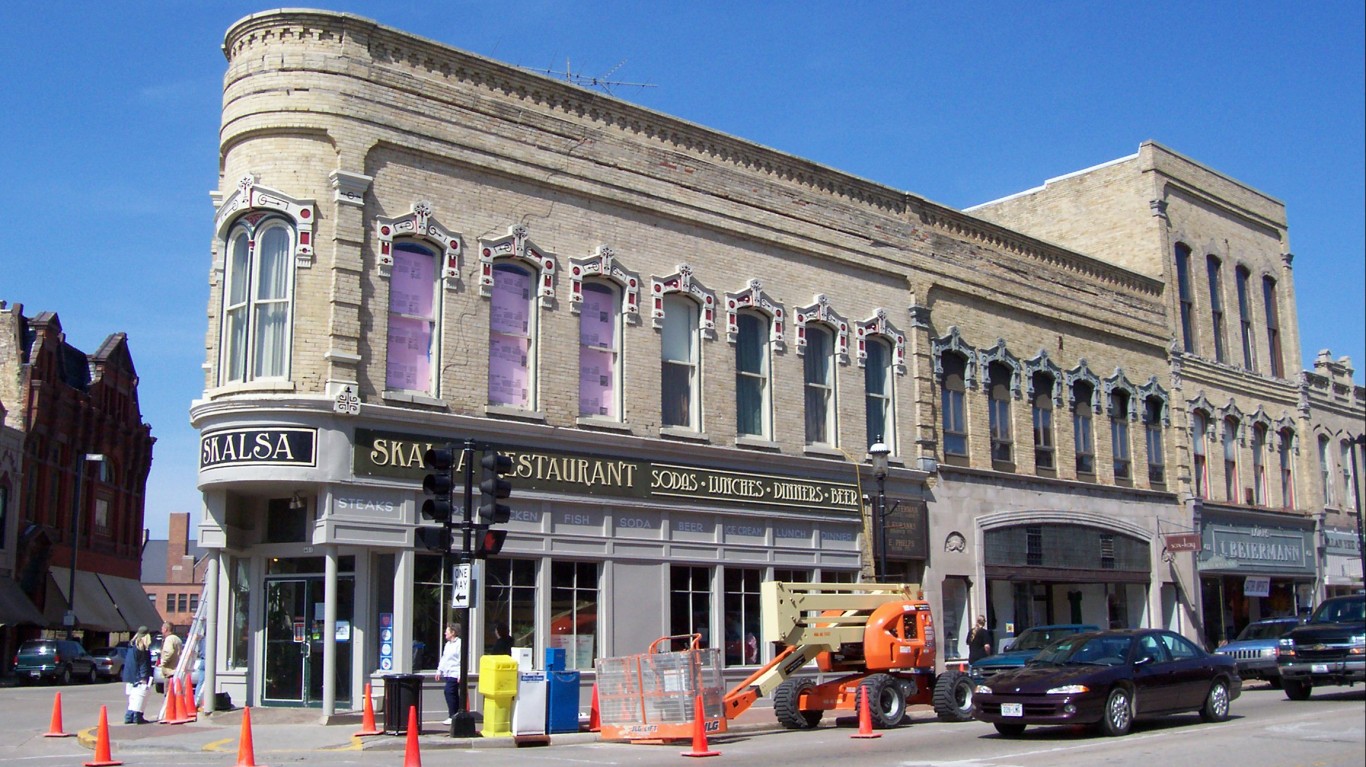
24. Oshkosh-Neenah, Wisconsin
> Single population: 50.8%
> Total 15+ population: 140,198
> Annual personal income: $47,212
> Cost of living: 8.9% less than the national average

23. Missoula, Montana
> Single population: 53.6%
> Total 15+ population: 95,761
> Annual personal income: $45,400
> Cost of living: 4.2% less than the national average

22. State College, Pennsylvania
> Single population: 57.6%
> Total 15+ population: 140,441
> Annual personal income: $39,649
> Cost of living: 2.8% greater than the national average
[in-text-ad-2]

21. New Orleans-Metairie, Louisiana
> Single population: 56.1%
> Total 15+ population: 1,024,243
> Annual personal income: $48,618
> Cost of living: 4.8% less than the national average

20. Gainesville, Florida
> Single population: 60.7%
> Total 15+ population: 235,118
> Annual personal income: $41,271
> Cost of living: 5.7% less than the national average
[in-text-ad]

19. Champaign-Urbana, Illinois
> Single population: 56.6%
> Total 15+ population: 199,480
> Annual personal income: $45,510
> Cost of living: 6.3% less than the national average
 24/7 Wall St.
18. Carson City, Nevada
> Single population: 53.6%
> Total 15+ population: 45,014
> Annual personal income: $45,650
> Cost of living: 4.4% less than the national average

17. Boston-Cambridge-Newton, Massachusetts, New Hampshire
> Single population: 50.9%
> Total 15+ population: 3,974,482
> Annual personal income: $61,917
> Cost of living: 11.1% greater than the national average
[in-text-ad-2]

16. Barnstable Town, Massachusetts
> Single population: 45.4%
> Total 15+ population: 186,928
> Annual personal income: $62,732
> Cost of living: 3.9% greater than the national average

15. Ann Arbor, Michigan
> Single population: 55.4%
> Total 15+ population: 304,186
> Annual personal income: $51,508
> Cost of living: 1.8% greater than the national average
[in-text-ad]

14. Morgantown, West Virginia
> Single population: 57.5%
> Total 15+ population: 117,710
> Annual personal income: $41,225
> Cost of living: 8.5% less than the national average
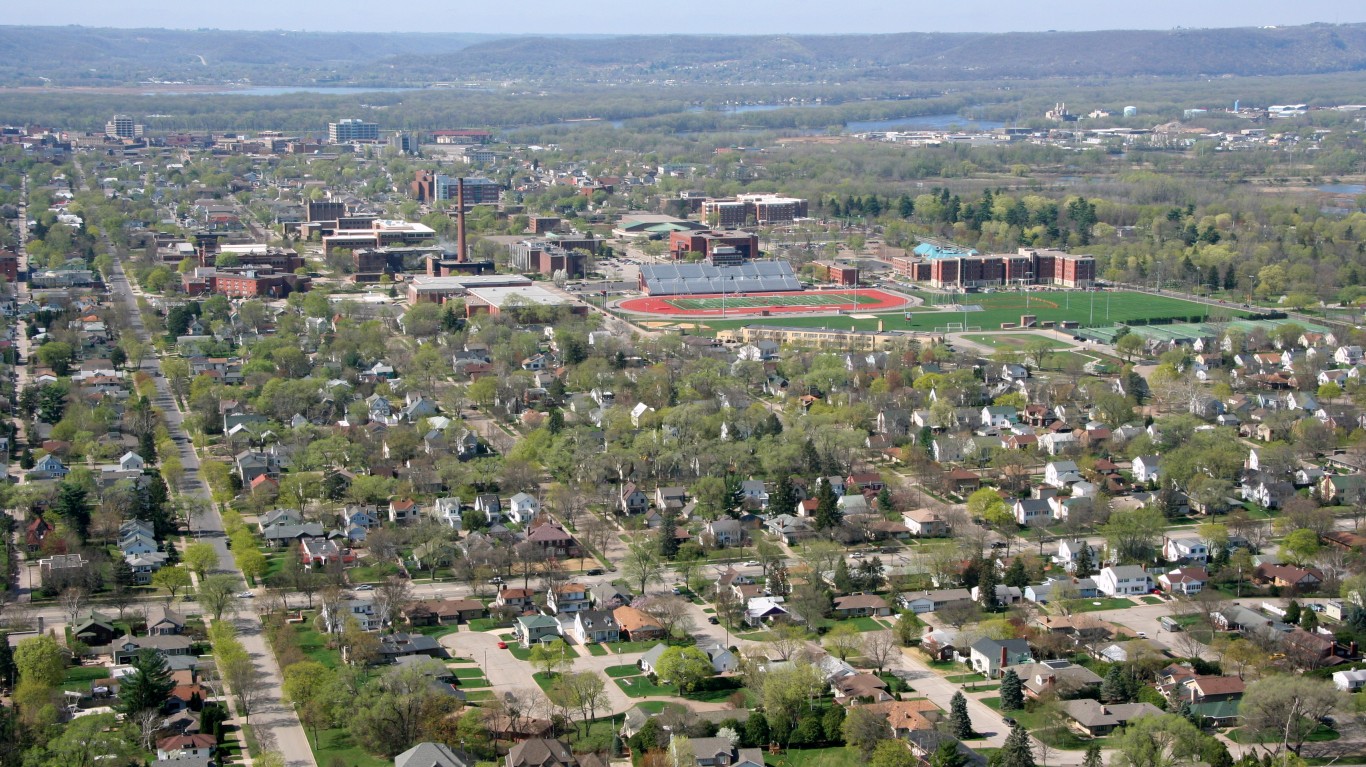
13. La Crosse-Onalaska, Wisconsin, Minnesota
> Single population: 50.4%
> Total 15+ population: 113,199
> Annual personal income: $47,898
> Cost of living: 6.9% less than the national average
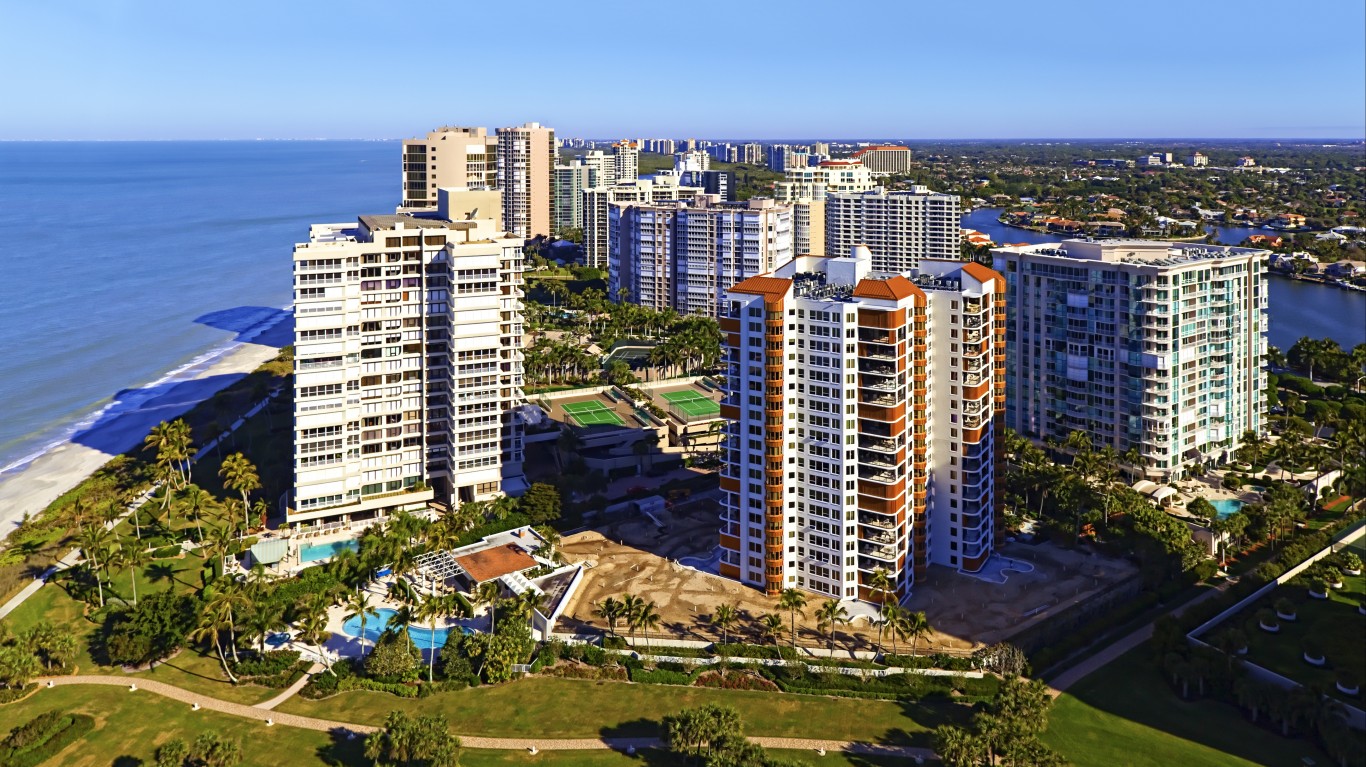
12. Naples-Immokalee-Marco Island, Florida
> Single population: 42.7%
> Total 15+ population: 303,964
> Annual personal income: $81,999
> Cost of living: 0.9% greater than the national average
[in-text-ad-2]

11. San Francisco-Oakland-Hayward, California
> Single population: 50.1%
> Total 15+ population: 3,857,163
> Annual personal income: $66,920
> Cost of living: 24.7% greater than the national average
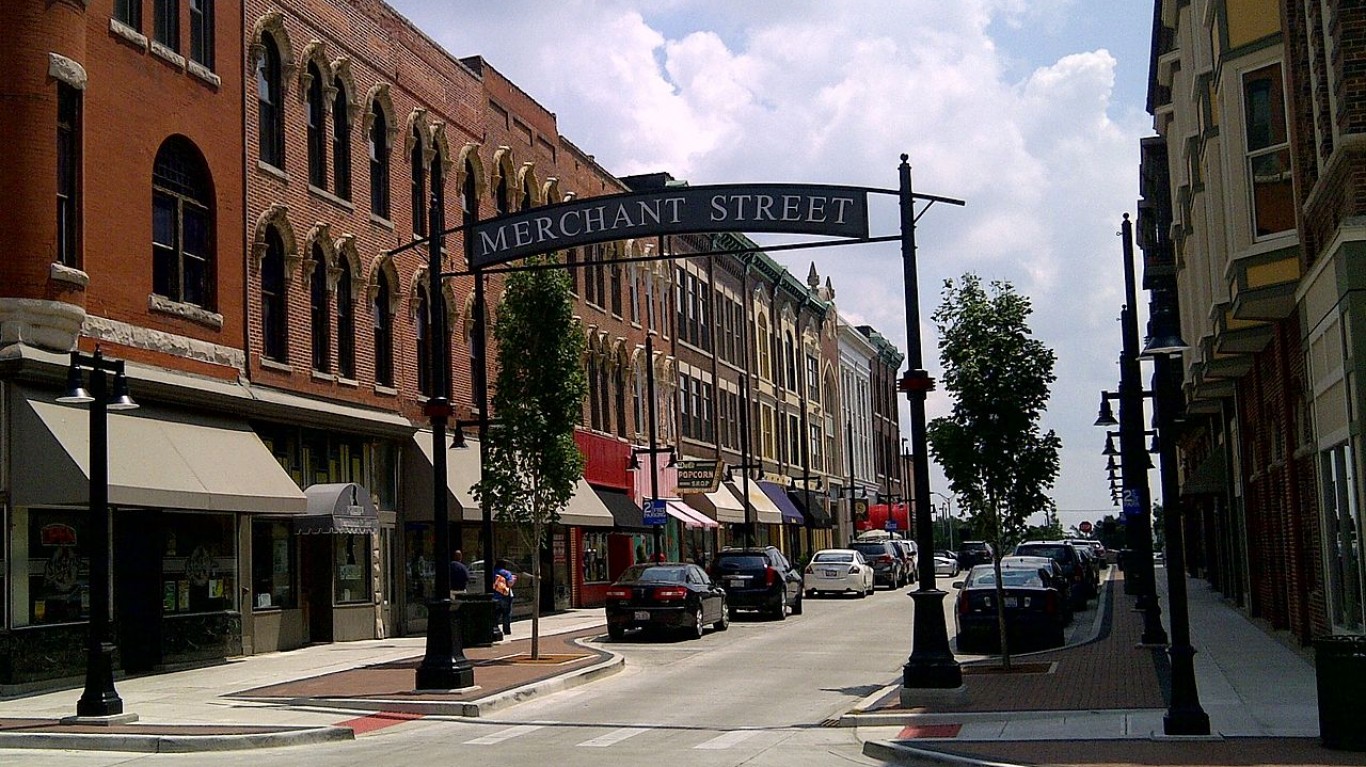
10. Decatur, Illinois
> Single population: 51.1%
> Total 15+ population: 87,584
> Annual personal income: $50,727
> Cost of living: 13.9% less than the national average
[in-text-ad]

9. Ames, Iowa
> Single population: 58.6%
> Total 15+ population: 82,297
> Annual personal income: $41,189
> Cost of living: 8.4% less than the national average
 24/7 Wall St.
8. Flagstaff, Arizona
> Single population: 59.3%
> Total 15+ population: 114,041
> Annual personal income: $43,633
> Cost of living: 2.0% less than the national average

7. Casper, Wyoming
> Single population: 48.2%
> Total 15+ population: 64,509
> Annual personal income: $64,169
> Cost of living: 2.4% less than the national average
[in-text-ad-2]

6. Sebastian-Vero Beach, Florida
> Single population: 46.3%
> Total 15+ population: 127,348
> Annual personal income: $74,988
> Cost of living: 8.4% less than the national average

5. Lawrence, Kansas
> Single population: 59.1%
> Total 15+ population: 99,142
> Annual personal income: $41,897
> Cost of living: 7.3% less than the national average
[in-text-ad]

4. Boulder, Colorado
> Single population: 52.1%
> Total 15+ population: 264,762
> Annual personal income: $57,756
> Cost of living: 8.9% greater than the national average

3. Ithaca, New York
> Single population: 61.1%
> Total 15+ population: 91,517
> Annual personal income: $36,716
> Cost of living: 6.4% greater than the national average

2. Pittsfield, Massachusetts
> Single population: 53.2%
> Total 15+ population: 109,746
> Annual personal income: $52,685
> Cost of living: 3.8% less than the national average
[in-text-ad-2]

1. Bridgeport-Stamford-Norwalk, Connecticut
> Single population: 47.6%
> Total 15+ population: 768,497
> Annual personal income: $85,718
> Cost of living: 20.1% greater than the national average
Take Charge of Your Retirement In Just A Few Minutes (Sponsor)
Retirement planning doesn’t have to feel overwhelming. The key is finding expert guidance—and SmartAsset’s simple quiz makes it easier than ever for you to connect with a vetted financial advisor.
Here’s how it works:
- Answer a Few Simple Questions. Tell us a bit about your goals and preferences—it only takes a few minutes!
- Get Matched with Vetted Advisors Our smart tool matches you with up to three pre-screened, vetted advisors who serve your area and are held to a fiduciary standard to act in your best interests. Click here to begin
- Choose Your Fit Review their profiles, schedule an introductory call (or meet in person), and select the advisor who feel is right for you.
Why wait? Start building the retirement you’ve always dreamed of. Click here to get started today!
Thank you for reading! Have some feedback for us?
Contact the 24/7 Wall St. editorial team.
Latest from 24/7


Our expert who first called NVIDIA in 2009 is predicting 2025 will see a historic AI breakthrough.
You can follow him investing $500,000 of his own money on our top AI stocks for free.