Special Report
Fastest Shrinking Local Economies in Every State

Published:
Last Updated:

Over the nearly 10 years since the end of the Great Recession, economic news has been largely positive. Economic growth is heavily influenced by job growth, and the U.S. economy has added jobs for the last 100 consecutive months. The unemployment rate, too, has declined to levels not seen since the 1960s.
A rising tide does not necessarily raise all ships, however. While nationwide economic growth should come as welcome news to every American, many are not benefitting at the local level. In every state, there are counties that have reported slower economic growth or even shrinking GDPs.
24/7 Wall St. reviewed GDP growth from 2012 to 2015 by county and county equivalents to identify the fastest shrinking local economy in every state. Massachusetts and Hawaii are the only states in which no county reported falling GDP over that period — but even in those states, there are counties that reported slower growth than the comparable 7.3% national three-year increase. Meanwhile, states like North Dakota and Nebraska have counties that reported a more than 50% GDP decline.
Economic growth is most commonly driven by increased worker productivity or a growing population — or some combination of the two. In many of the counties on this list, a shrinking population undermined GDP growth as the majority of these counties had smaller populations in 2015 than they did in 2012.
A shrinking local economy can have real implications for area residents. In 18 of the counties on this list, median household income fell between 2012 and 2015.
Methodology
To identify the fastest shrinking local economy in every state, 24/7 Wall St. calculated the change in real GDP from 2012 to 2015 with data from the Bureau of Economic Analysis. We used Bureau of Labor Statistics employment data for the same period to identify the fastest shrinking industry in each county. Annual unemployment rates also came from the BLS. Population data, including that used to calculate population changes, are five-year estimates from the U.S. Census Bureau’s American Community Survey.
Click here to see the fastest shrinking local economies in every state.
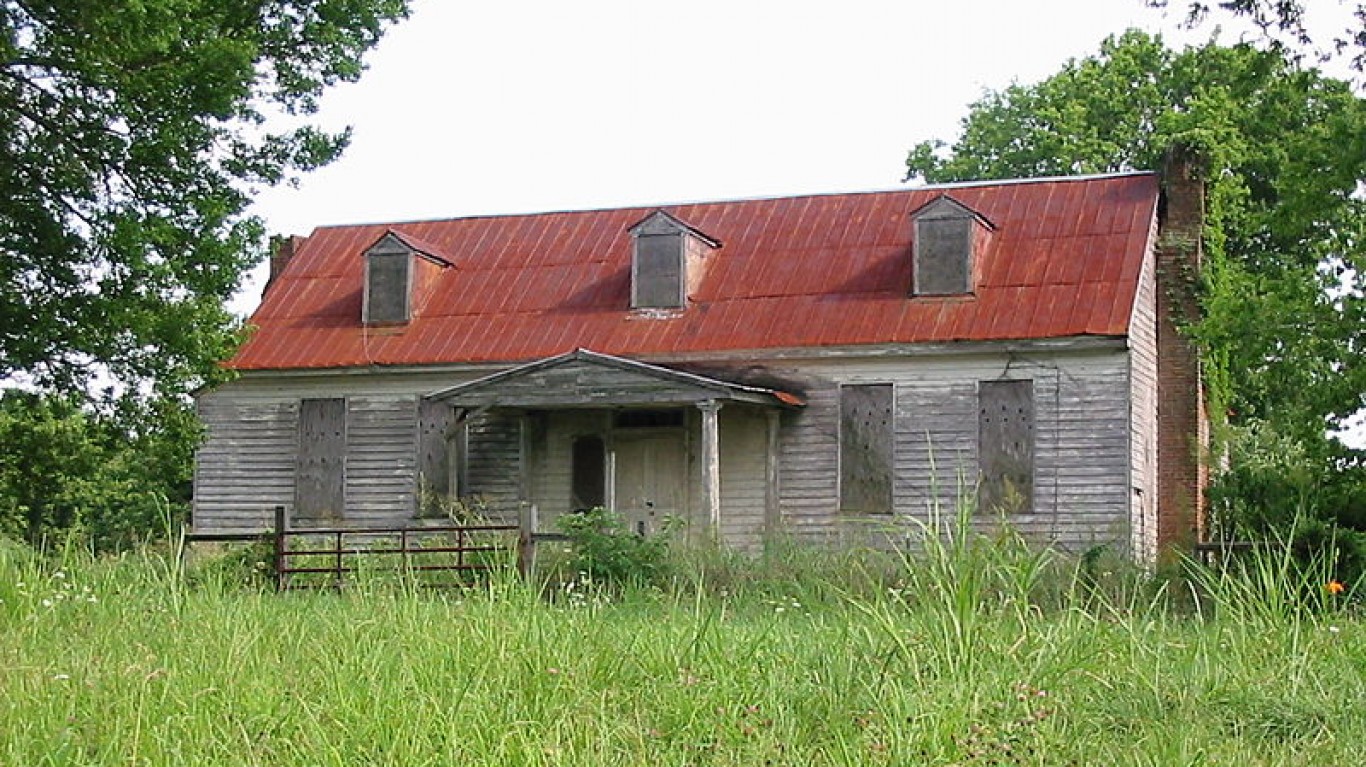
1. Alabama: Lawrence County
> GDP change 2012-2015: -34.5% (county) +1.2% (state)
> 2015 county GDP: $477.1 million (0.3% of state GDP)
> Fastest shrinking industry: Construction (1.7% employment decline)
> 2017 unemployment: 4.9% (county) 4.4% (state)
> Population: 33,288 (0.7% of state)
[in-text-ad]

2. Alaska: Yukon-Koyukuk Census Area
> GDP change 2012-2015: -29.5% (census area) -7.1% (state)
> 2015 county GDP: $223.0 million (0.4% of state GDP)
> Fastest shrinking industry: Professional, scientific, and management, and administrative and waste management services (1.3% employment decline)
> 2017 unemployment: 18.3% (census area) 7.2% (state)
> Population: 5,453 (0.7% of state)
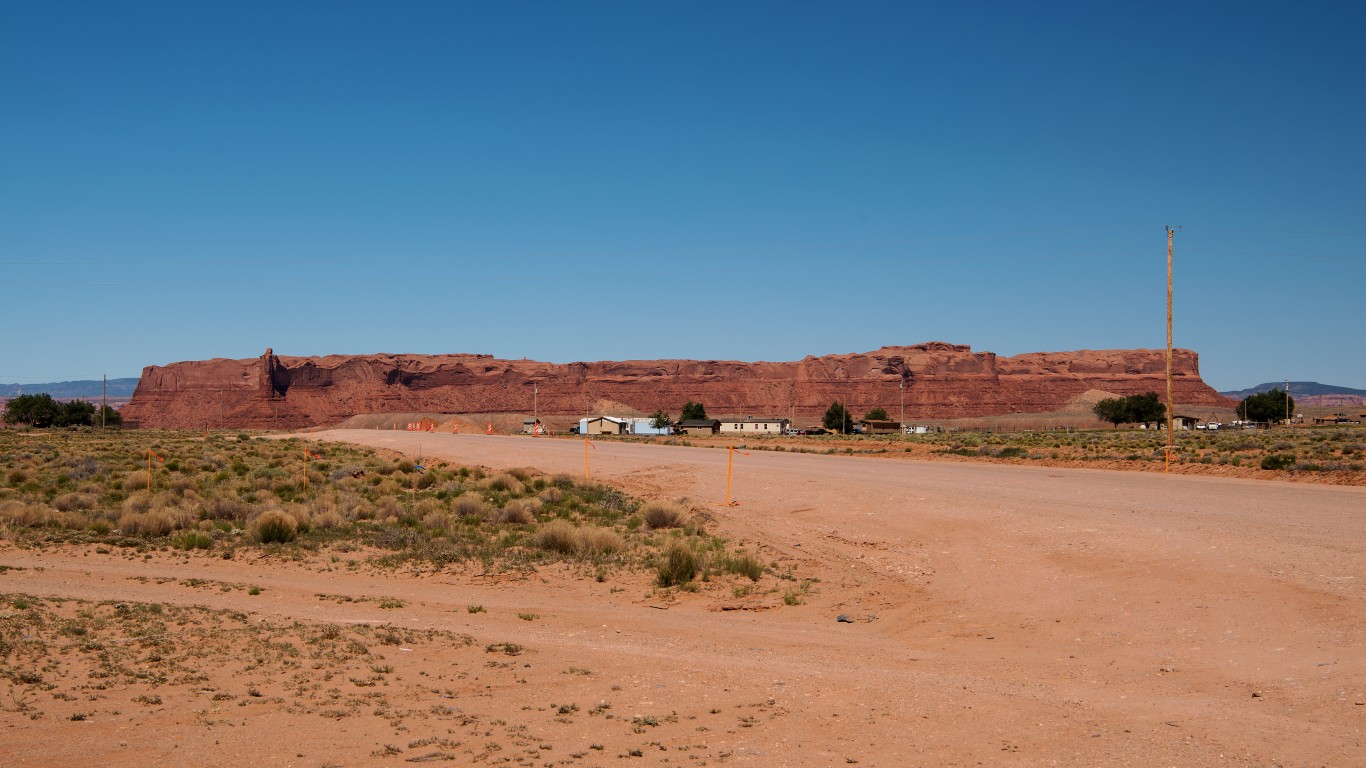
3. Arizona: Apache County
> GDP change 2012-2015: -18.2% (county) +4.2% (state)
> 2015 county GDP: $2.1 billion (0.7% of state GDP)
> Fastest shrinking industry: Construction (2.2% employment decline)
> 2017 unemployment: 10.4% (county) 4.9% (state)
> Population: 71,602 (1.1% of state)

4. Arkansas: Little River County
> GDP change 2012-2015: -31.6% (county) +4.0% (state)
> 2015 county GDP: $341.1 million (0.3% of state GDP)
> Fastest shrinking industry: Other services, except public administration (3.4% employment decline)
> 2017 unemployment: 4.8% (county) 3.7% (state)
> Population: 12,494 (0.4% of state)
[in-text-ad-2]

5. California: Trinity County
> GDP change 2012-2015: -11.4% (county) +13.1% (state)
> 2015 county GDP: $242.0 million (0.0% of state GDP)
> Fastest shrinking industry: Retail trade (4.2% employment decline)
> 2017 unemployment: 6.0% (county) 4.8% (state)
> Population: 13,037 (0.0% of state)

6. Colorado: San Juan County
> GDP change 2012-2015: -40.5% (county) +12.5% (state)
> 2015 county GDP: $21.5 million (0.0% of state GDP)
> Fastest shrinking industry: Arts, entertainment, and recreation, and accommodation and food services (12.8% employment decline)
> 2017 unemployment: 2.2% (county) 2.8% (state)
> Population: 569 (0.0% of state)
[in-text-ad]

7. Connecticut: Litchfield County
> GDP change 2012-2015: -7.6% (county) -0.7% (state)
> 2015 county GDP: $6.2 billion (2.6% of state GDP)
> Fastest shrinking industry: Retail trade (0.8% employment decline)
> 2017 unemployment: 4.3% (county) 4.7% (state)
> Population: 184,454 (5.1% of state)
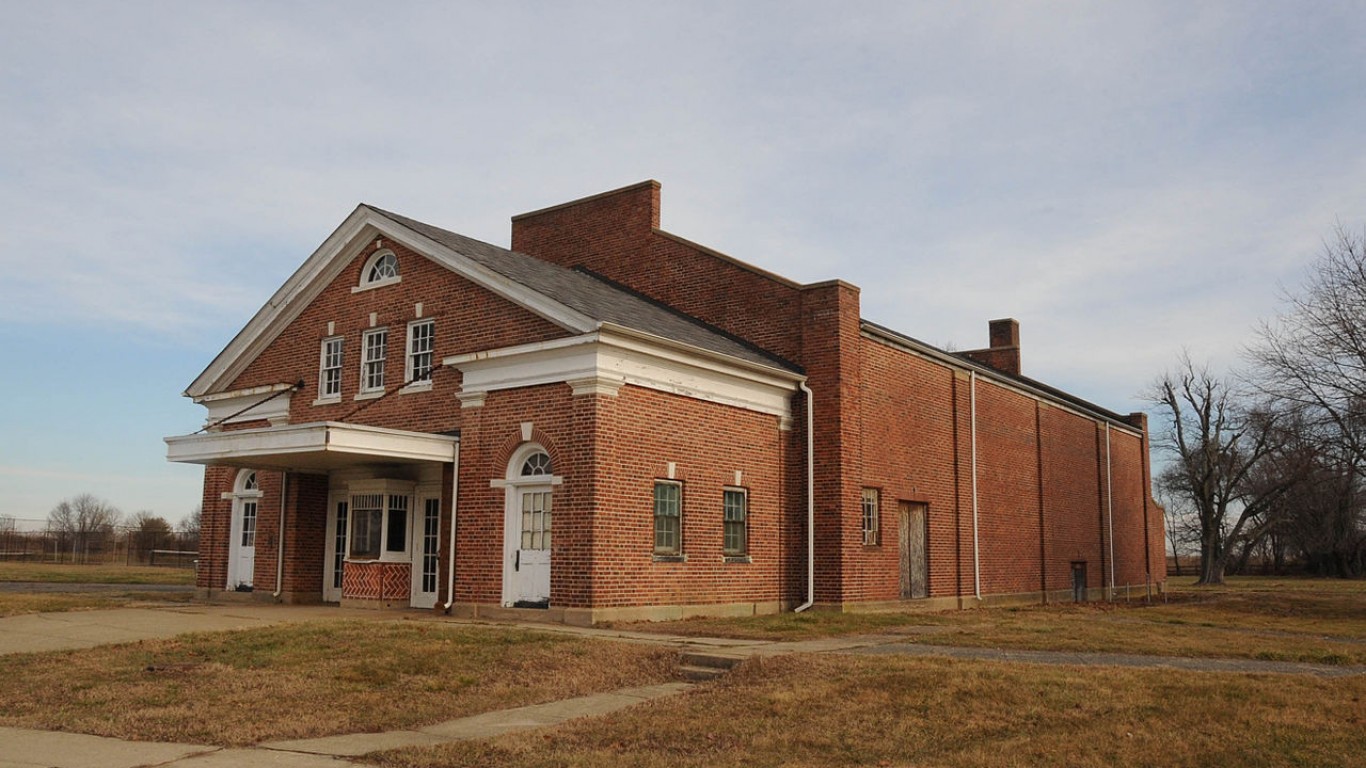
8. Delaware: New Castle County
> GDP change 2012-2015: -1.8% (county) +5.9% (state)
> 2015 county GDP: $45.6 billion (69.4% of state GDP)
> Fastest shrinking industry: Manufacturing (0.8% employment decline)
> 2017 unemployment: 4.5% (county) 4.6% (state)
> Population: 555,036 (58.8% of state)
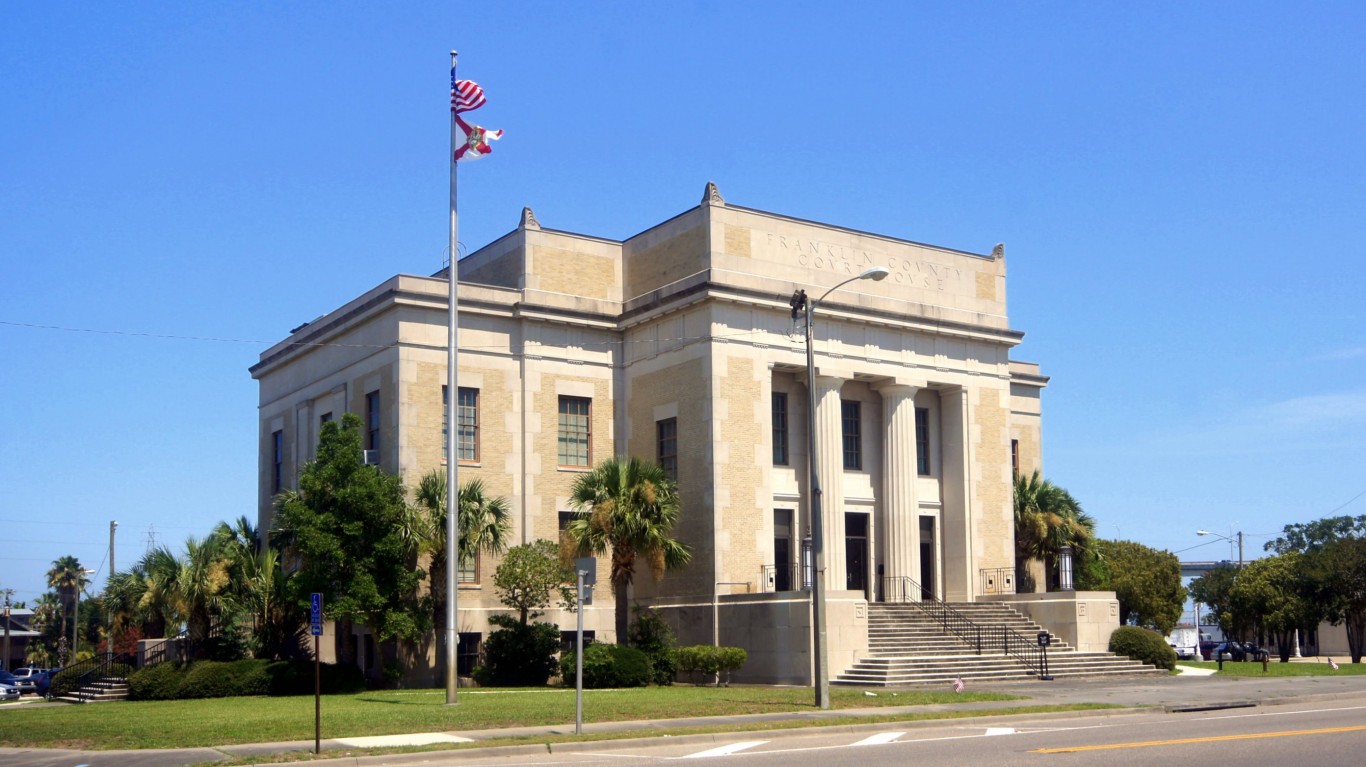
9. Florida: Franklin County
> GDP change 2012-2015: -20.3% (county) +8.8% (state)
> 2015 county GDP: $297.9 million (0.0% of state GDP)
> Fastest shrinking industry: Construction (5.3% employment decline)
> 2017 unemployment: 3.6% (county) 4.2% (state)
> Population: 11,675 (0.1% of state)
[in-text-ad-2]

10. Georgia: Baker County
> GDP change 2012-2015: -27.7% (county) +8.0% (state)
> 2015 county GDP: $70.3 million (0.0% of state GDP)
> Fastest shrinking industry: Retail trade (4.4% employment decline)
> 2017 unemployment: 6.3% (county) 4.7% (state)
> Population: 3,251 (0.0% of state)

11. Hawaii: Hawaii County
> GDP change 2012-2015: +3.5% (county) +4.7% (state)
> 2015 county GDP: $6.8 billion (8.8% of state GDP)
> Fastest shrinking industry: Arts, entertainment, and recreation, and accommodation and food services (1.8% employment decline)
> 2017 unemployment: 2.8% (county) 2.4% (state)
> Population: 196,325 (13.8% of state)
[in-text-ad]

12. Idaho: Butte County
> GDP change 2012-2015: -22.7% (county) +9.3% (state)
> 2015 county GDP: $750.8 million (1.2% of state GDP)
> Fastest shrinking industry: Educational services, and health care and social assistance (5.3% employment decline)
> 2017 unemployment: 3.0% (county) 3.2% (state)
> Population: 2,613 (0.2% of state)

13. Illinois: Pope County
> GDP change 2012-2015: -24.6% (county) +2.8% (state)
> 2015 county GDP: $49.3 million (0.0% of state GDP)
> Fastest shrinking industry: Construction (8.5% employment decline)
> 2017 unemployment: 6.2% (county) 5.0% (state)
> Population: 4,360 (0.0% of state)

14. Indiana: Ohio County
> GDP change 2012-2015: -34.8% (county) +4.2% (state)
> 2015 county GDP: $75.6 million (0.0% of state GDP)
> Fastest shrinking industry: Transportation and warehousing, and utilities (6.3% employment decline)
> 2017 unemployment: 3.6% (county) 3.5% (state)
> Population: 5,911 (0.1% of state)
[in-text-ad-2]

15. Iowa: Louisa County
> GDP change 2012-2015: -22.7% (county) +6.9% (state)
> 2015 county GDP: $433.7 million (0.3% of state GDP)
> Fastest shrinking industry: Transportation and warehousing, and utilities (1.6% employment decline)
> 2017 unemployment: 3.3% (county) 3.1% (state)
> Population: 11,238 (0.4% of state)

16. Kansas: Marshall County
> GDP change 2012-2015: -23.1% (county) +3.2% (state)
> 2015 county GDP: $476.6 million (0.3% of state GDP)
> Fastest shrinking industry: Retail trade (1.8% employment decline)
> 2017 unemployment: 2.8% (county) 3.6% (state)
> Population: 9,859 (0.3% of state)
[in-text-ad]
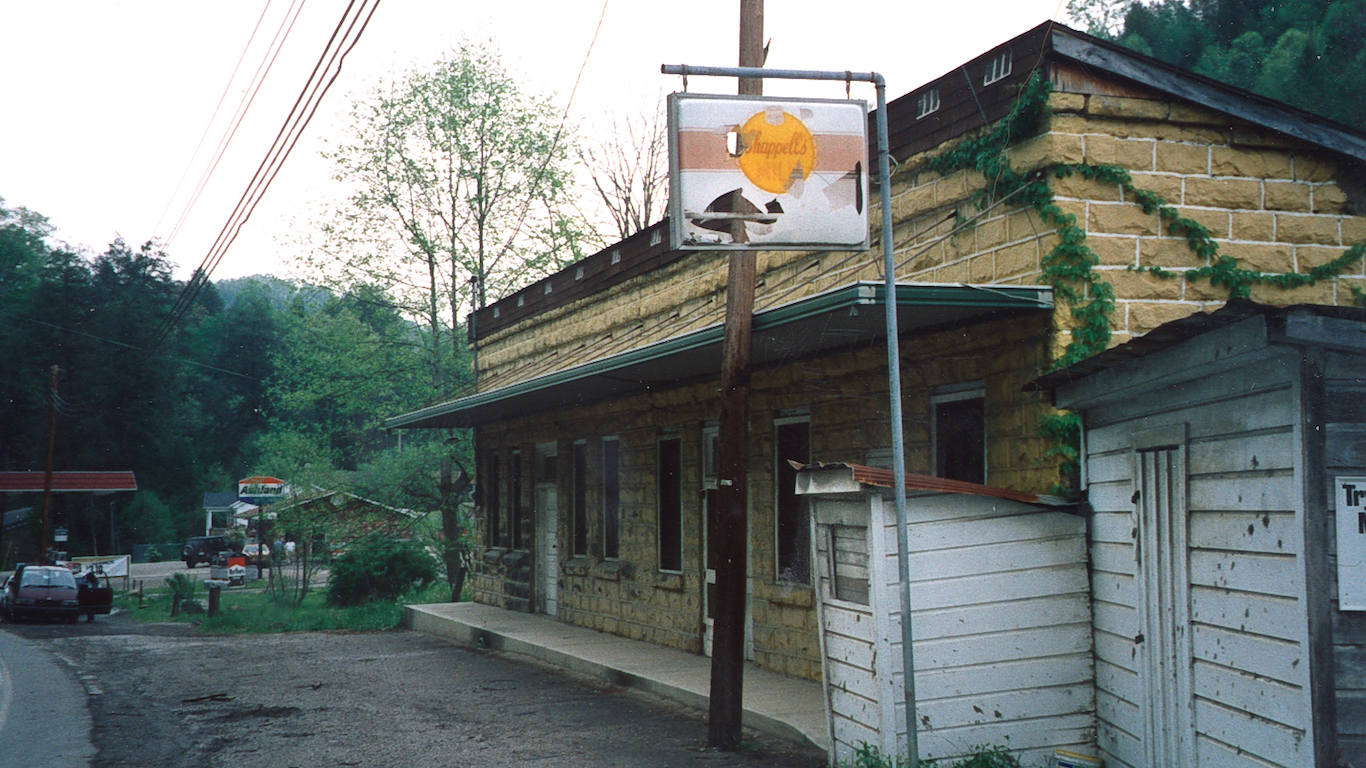
17. Kentucky: Leslie County
> GDP change 2012-2015: -35.4% (county) +2.4% (state)
> 2015 county GDP: $133.1 million (0.1% of state GDP)
> Fastest shrinking industry: Agriculture, forestry, fishing and hunting, and mining (9.0% employment decline)
> 2017 unemployment: 10.1% (county) 4.9% (state)
> Population: 10,648 (0.2% of state)

18. Louisiana: Red River Parish
> GDP change 2012-2015: -29.6% (parish) -0.9% (state)
> 2015 county GDP: $243.0 million (0.1% of state GDP)
> Fastest shrinking industry: Educational services, and health care and social assistance (3.5% employment decline)
> 2017 unemployment: 5.2% (parish) 5.1% (state)
> Population: 8,723 (0.2% of state)

19. Maine: Franklin County
> GDP change 2012-2015: -7.0% (county) +1.4% (state)
> 2015 county GDP: $884.4 million (1.6% of state GDP)
> Fastest shrinking industry: Professional, scientific, and management, and administrative and waste management services (1.0% employment decline)
> 2017 unemployment: 4.0% (county) 3.3% (state)
> Population: 30,177 (2.3% of state)
[in-text-ad-2]

20. Maryland: Baltimore County
> GDP change 2012-2015: -8.9% (county) +2.9% (state)
> 2015 county GDP: $46.2 billion (13.4% of state GDP)
> Fastest shrinking industry: Manufacturing (0.6% employment decline)
> 2017 unemployment: 4.3% (county) 4.1% (state)
> Population: 828,637 (13.8% of state)

21. Massachusetts: Hampshire County
> GDP change 2012-2015: +1.4% (county) +5.8% (state)
> 2015 county GDP: $5.7 billion (1.2% of state GDP)
> Fastest shrinking industry: Manufacturing (1.3% employment decline)
> 2017 unemployment: 3.4% (county) 3.7% (state)
> Population: 161,197 (2.4% of state)
[in-text-ad]

22. Michigan: Ionia County
> GDP change 2012-2015: -18.0% (county) +5.1% (state)
> 2015 county GDP: $1.3 billion (0.3% of state GDP)
> Fastest shrinking industry: Finance and insurance, and real estate and rental and leasing (1.2% employment decline)
> 2017 unemployment: 4.0% (county) 4.6% (state)
> Population: 64,147 (0.6% of state)

23. Minnesota: Kandiyohi County
> GDP change 2012-2015: -16.5% (county) +5.7% (state)
> 2015 county GDP: $2.0 billion (0.6% of state GDP)
> Fastest shrinking industry: Manufacturing (1.1% employment decline)
> 2017 unemployment: 3.3% (county) 3.5% (state)
> Population: 42,577 (0.8% of state)

24. Mississippi: Neshoba County
> GDP change 2012-2015: -18.0% (county) +0.1% (state)
> 2015 county GDP: $776.0 million (0.8% of state GDP)
> Fastest shrinking industry: Construction (1.0% employment decline)
> 2017 unemployment: 5.1% (county) 5.1% (state)
> Population: 29,437 (1.0% of state)
[in-text-ad-2]

25. Missouri: Linn County
> GDP change 2012-2015: -20.8% (county) +2.6% (state)
> 2015 county GDP: $339.4 million (0.1% of state GDP)
> Fastest shrinking industry: Wholesale trade (2.2% employment decline)
> 2017 unemployment: 5.9% (county) 3.8% (state)
> Population: 12,248 (0.2% of state)

26. Montana: Silver Bow County
> GDP change 2012-2015: -26.4% (county) +6.3% (state)
> 2015 county GDP: $2.1 billion (4.8% of state GDP)
> Fastest shrinking industry: Arts, entertainment, and recreation, and accommodation and food services (1.9% employment decline)
> 2017 unemployment: 4.2% (county) 4.0% (state)
> Population: 34,514 (3.4% of state)
[in-text-ad]

27. Nebraska: Wheeler County
> GDP change 2012-2015: -60.6% (county) +7.4% (state)
> 2015 county GDP: $37.2 million (0.0% of state GDP)
> Fastest shrinking industry: Agriculture, forestry, fishing and hunting, and mining (21.2% employment decline)
> 2017 unemployment: 2.3% (county) 2.9% (state)
> Population: 846 (0.0% of state)

28. Nevada: Eureka County
> GDP change 2012-2015: -38.5% (county) +5.6% (state)
> 2015 county GDP: $1.2 billion (0.9% of state GDP)
> Fastest shrinking industry: Educational services, and health care and social assistance (6.7% employment decline)
> 2017 unemployment: 3.1% (county) 5.0% (state)
> Population: 1,728 (0.1% of state)

29. New Hampshire: Carroll County
> GDP change 2012-2015: -5.3% (county) +5.2% (state)
> 2015 county GDP: $1.7 billion (2.4% of state GDP)
> Fastest shrinking industry: Retail trade (2.7% employment decline)
> 2017 unemployment: 2.6% (county) 2.7% (state)
> Population: 47,524 (3.6% of state)
[in-text-ad-2]
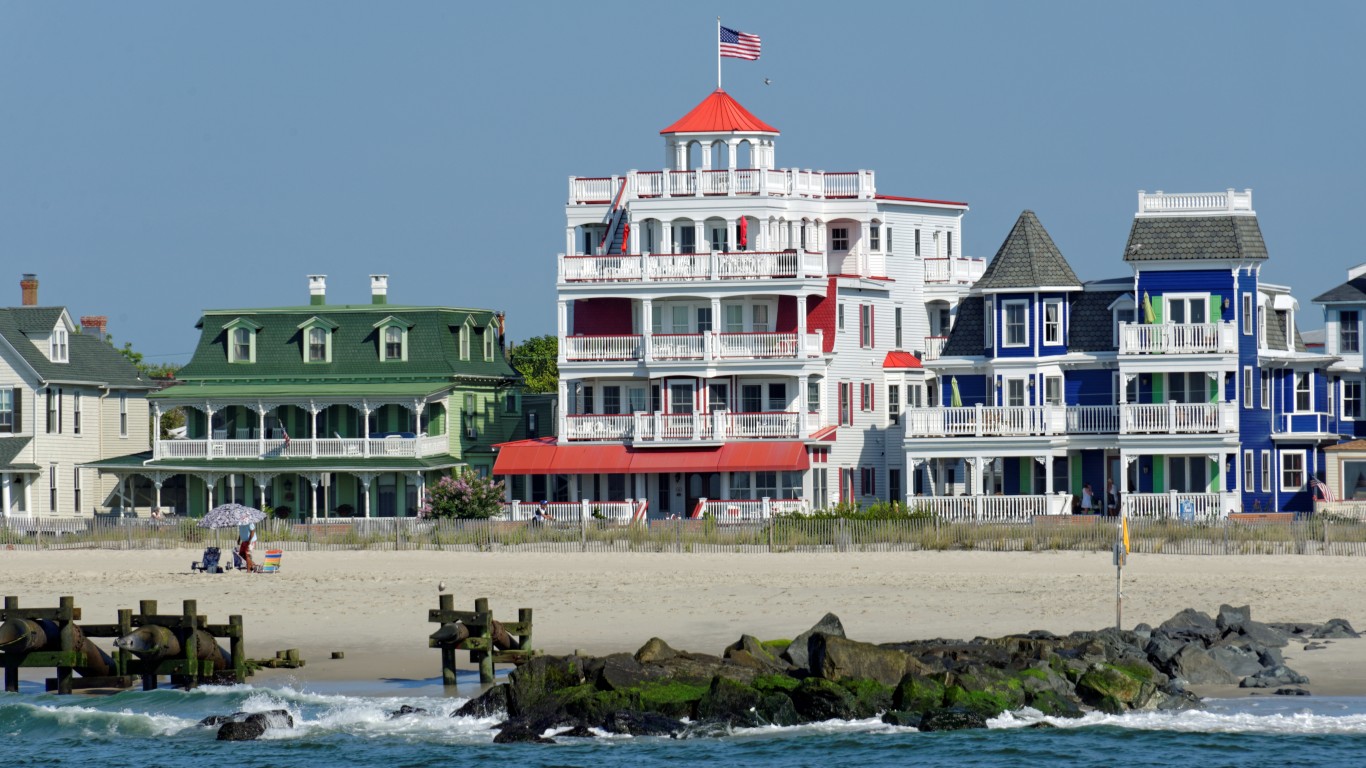
30. New Jersey: Cape May County
> GDP change 2012-2015: -6.8% (county) +2.7% (state)
> 2015 county GDP: $4.4 billion (0.8% of state GDP)
> Fastest shrinking industry: Construction (1.2% employment decline)
> 2017 unemployment: 9.1% (county) 4.6% (state)
> Population: 94,549 (1.1% of state)

31. New Mexico: Taos County
> GDP change 2012-2015: -12.6% (county) +3.7% (state)
> 2015 county GDP: $767.6 million (0.8% of state GDP)
> Fastest shrinking industry: Educational services, and health care and social assistance (1.2% employment decline)
> 2017 unemployment: 7.9% (county) 6.2% (state)
> Population: 32,809 (1.6% of state)
[in-text-ad]

32. New York: Greene County
> GDP change 2012-2015: -11.3% (county) +3.6% (state)
> 2015 county GDP: $1.8 billion (0.1% of state GDP)
> Fastest shrinking industry: Construction (1.6% employment decline)
> 2017 unemployment: 5.3% (county) 4.7% (state)
> Population: 47,791 (0.2% of state)

33. North Carolina: Person County
> GDP change 2012-2015: -24.0% (county) +6.4% (state)
> 2015 county GDP: $1.4 billion (0.3% of state GDP)
> Fastest shrinking industry: Manufacturing (2.1% employment decline)
> 2017 unemployment: 4.7% (county) 4.6% (state)
> Population: 39,240 (0.4% of state)

34. North Dakota: Slope County
> GDP change 2012-2015: -53.0% (county) +6.3% (state)
> 2015 county GDP: $36.7 million (0.1% of state GDP)
> Fastest shrinking industry: Finance and insurance, and real estate and rental and leasing (7.5% employment decline)
> 2017 unemployment: 1.9% (county) 2.6% (state)
> Population: 674 (0.1% of state)
[in-text-ad-2]

35. Ohio: Logan County
> GDP change 2012-2015: -13.2% (county) +6.7% (state)
> 2015 county GDP: $1.7 billion (0.3% of state GDP)
> Fastest shrinking industry: Educational services, and health care and social assistance (1.8% employment decline)
> 2017 unemployment: 4.1% (county) 5.0% (state)
> Population: 45,323 (0.4% of state)

36. Oklahoma: Beaver County
> GDP change 2012-2015: -14.8% (county) +12.3% (state)
> 2015 county GDP: $230.9 million (0.1% of state GDP)
> Fastest shrinking industry: Professional, scientific, and management, and administrative and waste management services (2.0% employment decline)
> 2017 unemployment: 2.6% (county) 4.3% (state)
> Population: 5,445 (0.1% of state)
[in-text-ad]
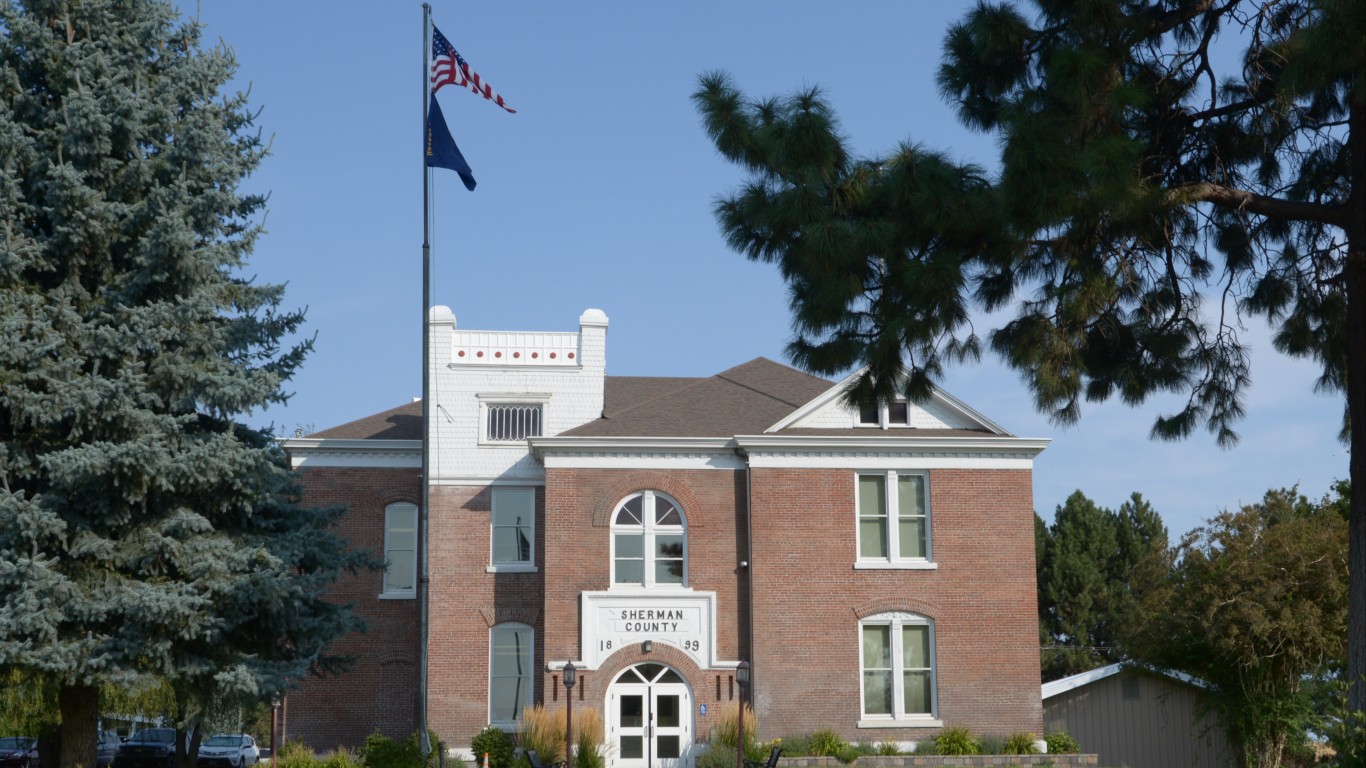
37. Oregon: Sherman County
> GDP change 2012-2015: -21.8% (county) +9.7% (state)
> 2015 county GDP: $484.3 million (0.3% of state GDP)
> Fastest shrinking industry: Transportation and warehousing, and utilities (4.1% employment decline)
> 2017 unemployment: 4.8% (county) 4.1% (state)
> Population: 1,635 (0.0% of state)

38. Pennsylvania: Carbon County
> GDP change 2012-2015: -7.9% (county) +5.7% (state)
> 2015 county GDP: $1.6 billion (0.2% of state GDP)
> Fastest shrinking industry: Retail trade (1.7% employment decline)
> 2017 unemployment: 5.6% (county) 4.9% (state)
> Population: 63,987 (0.5% of state)
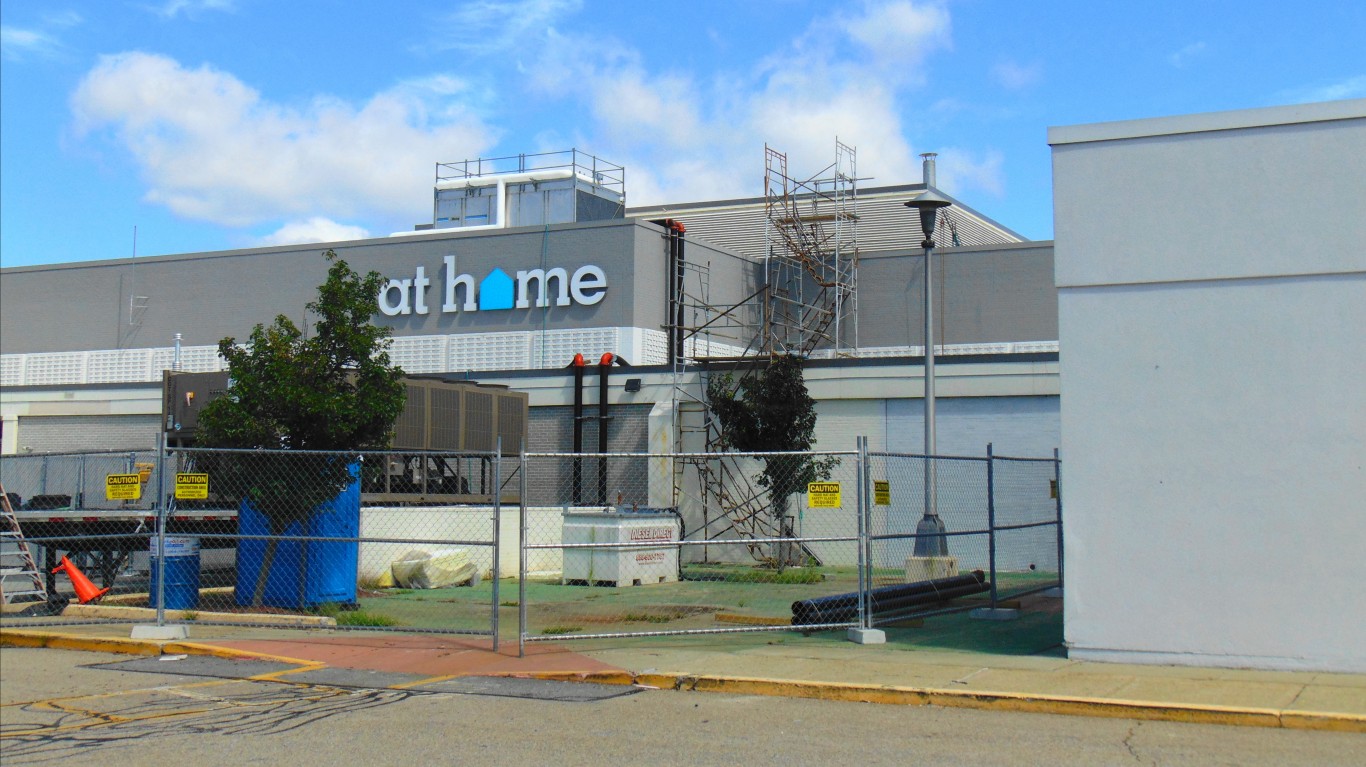
39. Rhode Island: Kent County
> GDP change 2012-2015: -10.6% (county) +2.7% (state)
> 2015 county GDP: $8.7 billion (16.5% of state GDP)
> Fastest shrinking industry: Finance and insurance, and real estate and rental and leasing (1.0% employment decline)
> 2017 unemployment: 4.1% (county) 4.5% (state)
> Population: 164,012 (15.5% of state)
[in-text-ad-2]

40. South Carolina: Marion County
> GDP change 2012-2015: -9.2% (county) +7.9% (state)
> 2015 county GDP: $403.0 million (0.2% of state GDP)
> Fastest shrinking industry: Finance and insurance, and real estate and rental and leasing (4.7% employment decline)
> 2017 unemployment: 7.4% (county) 4.3% (state)
> Population: 31,765 (0.6% of state)
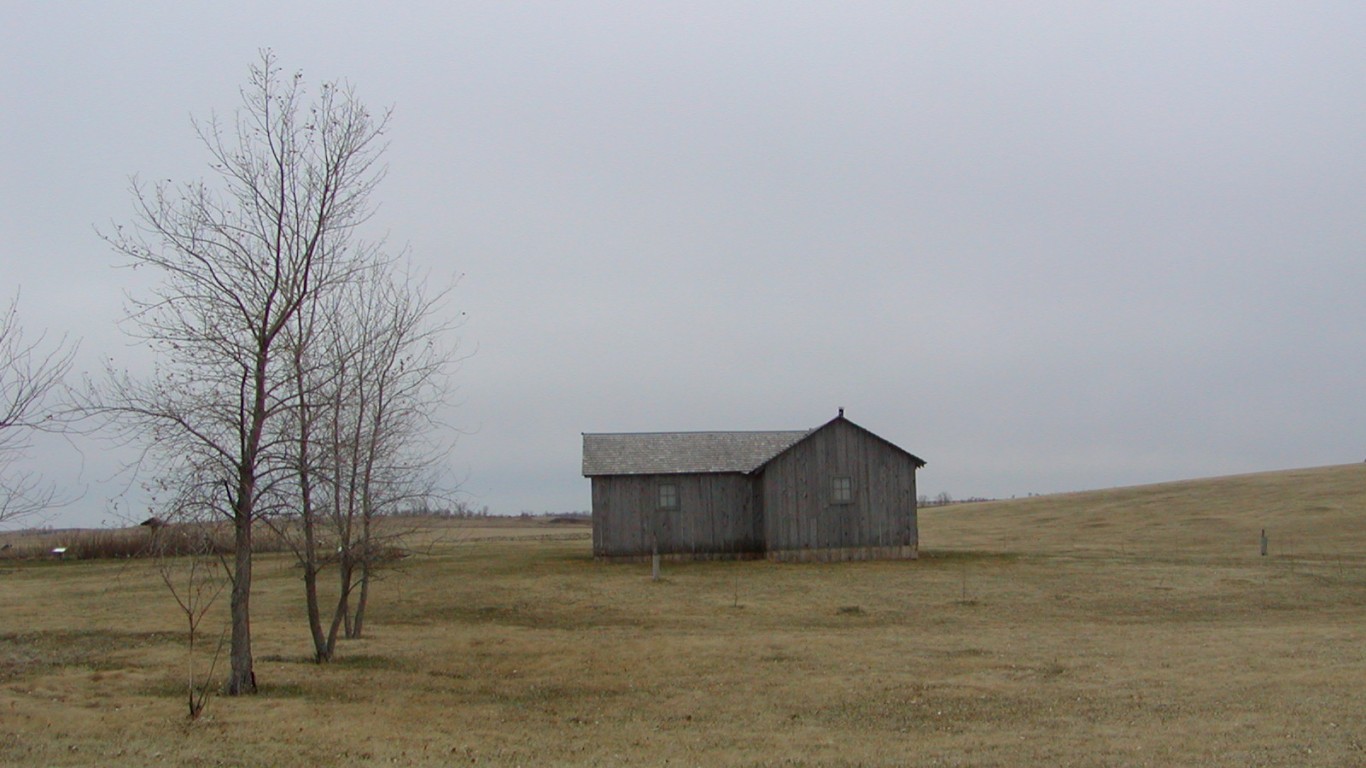
41. South Dakota: Kingsbury County
> GDP change 2012-2015: -12.3% (county) +4.4% (state)
> 2015 county GDP: $226.7 million (0.5% of state GDP)
> Fastest shrinking industry: Construction (1.0% employment decline)
> 2017 unemployment: 3.2% (county) 3.3% (state)
> Population: 5,000 (0.6% of state)
[in-text-ad]

42. Tennessee: Stewart County
> GDP change 2012-2015: -19.0% (county) +6.0% (state)
> 2015 county GDP: $563.6 million (0.2% of state GDP)
> Fastest shrinking industry: Educational services, and health care and social assistance (3.0% employment decline)
> 2017 unemployment: 5.3% (county) 3.7% (state)
> Population: 13,248 (0.2% of state)

43. Texas: Goliad County
> GDP change 2012-2015: -31.9% (county) +12.7% (state)
> 2015 county GDP: $279.7 million (0.0% of state GDP)
> Fastest shrinking industry: Other services, except public administration (2.8% employment decline)
> 2017 unemployment: 4.9% (county) 4.3% (state)
> Population: 7,510 (0.0% of state)

44. Utah: Kane County
> GDP change 2012-2015: -12.3% (county) +9.8% (state)
> 2015 county GDP: $256.3 million (0.2% of state GDP)
> Fastest shrinking industry: Arts, entertainment, and recreation, and accommodation and food services (4.4% employment decline)
> 2017 unemployment: 3.4% (county) 3.2% (state)
> Population: 7,246 (0.2% of state)
[in-text-ad-2]

45. Vermont: Windham County
> GDP change 2012-2015: -14.6% (county) -0.4% (state)
> 2015 county GDP: $2.1 billion (7.5% of state GDP)
> Fastest shrinking industry: Wholesale trade (0.6% employment decline)
> 2017 unemployment: 3.1% (county) 3.0% (state)
> Population: 43,332 (6.9% of state)

46. Virginia: Surry County
> GDP change 2012-2015: -25.3% (county) +2.1% (state)
> 2015 county GDP: $1.1 billion (0.2% of state GDP)
> Fastest shrinking industry: Transportation and warehousing, and utilities (2.3% employment decline)
> 2017 unemployment: 4.5% (county) 3.8% (state)
> Population: 6,670 (0.1% of state)
[in-text-ad]

47. Washington: Garfield County
> GDP change 2012-2015: -4.9% (county) +10.5% (state)
> 2015 county GDP: $99.0 million (0.0% of state GDP)
> Fastest shrinking industry: Professional, scientific, and management, and administrative and waste management services (4.3% employment decline)
> 2017 unemployment: 5.5% (county) 4.8% (state)
> Population: 2,226 (0.0% of state)

48. West Virginia: Clay County
> GDP change 2012-2015: -45.4% (county) +0.2% (state)
> 2015 county GDP: $96.2 million (0.1% of state GDP)
> Fastest shrinking industry: Manufacturing (4.5% employment decline)
> 2017 unemployment: 8.6% (county) 5.2% (state)
> Population: 8,901 (0.5% of state)
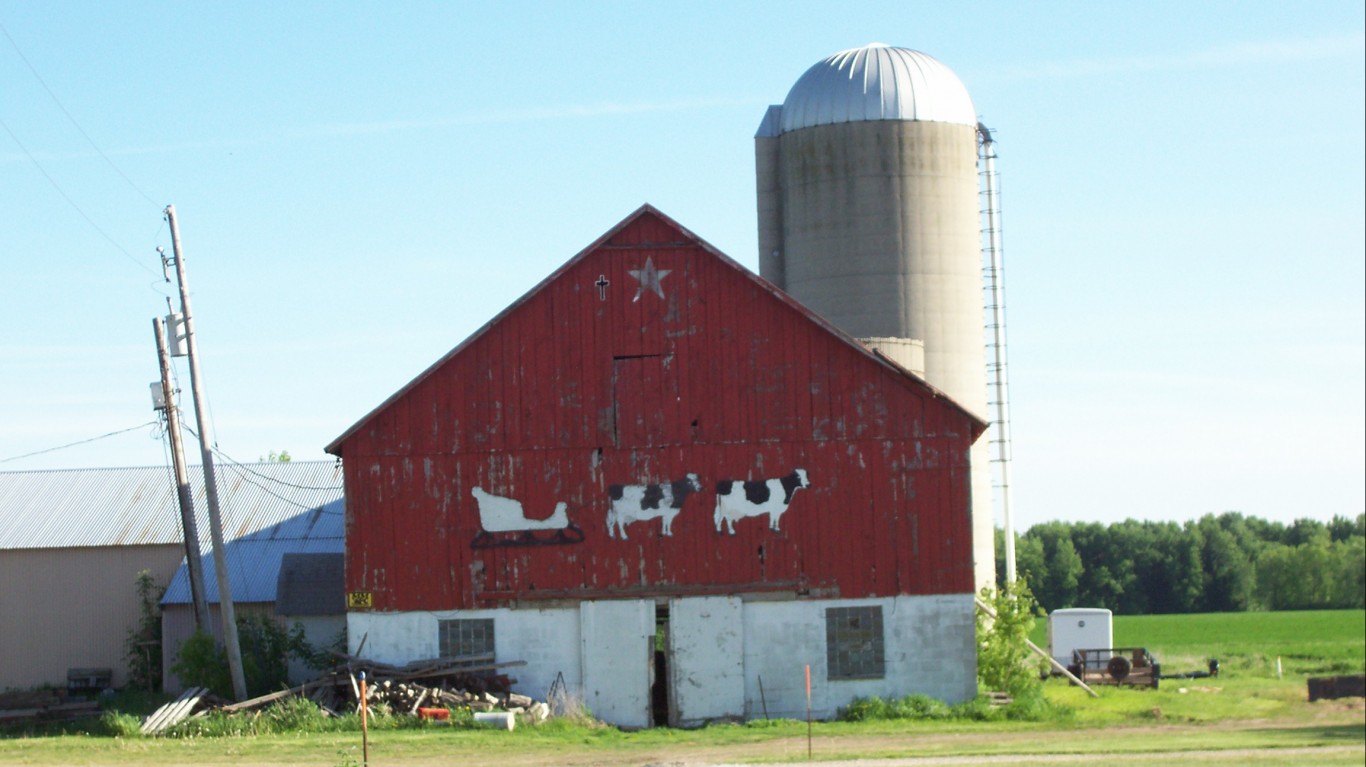
49. Wisconsin: Kewaunee County
> GDP change 2012-2015: -37.0% (county) +4.0% (state)
> 2015 county GDP: $557.1 million (0.2% of state GDP)
> Fastest shrinking industry: Arts, entertainment, and recreation, and accommodation and food services (1.5% employment decline)
> 2017 unemployment: 3.1% (county) 3.3% (state)
> Population: 20,378 (0.4% of state)
[in-text-ad-2]

50. Wyoming: Natrona County
> GDP change 2012-2015: -7.6% (county) +3.0% (state)
> 2015 county GDP: $5.7 billion (14.5% of state GDP)
> Fastest shrinking industry: Transportation and warehousing, and utilities (1.7% employment decline)
> 2017 unemployment: 5.3% (county) 4.2% (state)
> Population: 81,023 (13.9% of state)
Are You Ahead, or Behind on Retirement? (sponsor)
If you’re one of the over 4 Million Americans set to retire this year, you may want to pay attention. Many people have worked their whole lives preparing to retire without ever knowing the answer to the most important question: are you ahead, or behind on your retirement goals?
Don’t make the same mistake. It’s an easy question to answer. A quick conversation with a financial advisor can help you unpack your savings, spending, and goals for your money. With SmartAsset’s free tool, you can connect with vetted financial advisors in minutes.
Why wait? Click here to get started today!
Thank you for reading! Have some feedback for us?
Contact the 24/7 Wall St. editorial team.