Special Report
Best and Worst States for Business

Published:
Last Updated:

Amazon’s search for a home for its second headquarters, or HQ2, had 238 cities across the United States and Canada competing for the planned $5 billion construction project and 50,000 high-paying jobs. The 14 month-long evaluation process ended in November 2018 with a decision to split HQ2 between Arlington County, Virginia, and Queens, New York. These locations were chosen for their transportation infrastructure, access to talent, high quality of life, and billions of dollars in tax incentives.
Competition for Amazon’s HQ2 demonstrates just how important a healthy business environment can be to any economy — and some states are better equipped to help businesses succeed than others.
24/7 Wall St. created an index of 46 measures across eight categories including innovation, business costs, and regulation to identify the best and worst states for business. Much like the cities Amazon chose, the best states for business tend to be those with well-educated populations, a high quality of life, healthy economies, reliable infrastructure, and pro-business laws and policies.
Business interests, however, do not always align with other important considerations. For example, states with anti-union laws give companies more power, but workers’ wages can suffer as a result. Additionally, corporate tax breaks may spur job growth, but individual taxpayers are often left to pick up the tab.
Striking the right balance between being pro-business and working for the welfare of all residents is not easy, and missing the mark can have consequences. Outrage in New York over the $3 billion in tax breaks Amazon was projected to receive from the city and state led the company to scrap plans for its Queens HQ2 earlier this month.
Click here to see the best and worst states for business.
Click here to read our methodology.

1. Massachusetts
> 1-yr. real GDP change: +2.6% (9th best)
> Avg. earnings: $73,246 (2nd highest)
> Adults with a bachelor’s degree: 43.4% (the highest)
> 2018 venture capital deals: 9.6 per 100,000 people (the most)
Access to a skilled labor force can be the difference between success and failure for any business, and in Massachusetts, 43.4% of adults have a bachelor’s degree or higher, the largest share of any state.
[in-text-ad]

2. Colorado
> 1-yr. real GDP change: +2.7% (8th best)
> Avg. earnings: $59,087 (15th highest)
> Adults with a bachelor’s degree: 41.2% (2nd highest)
> 2018 venture capital deals: 5.0 per 100,000 people (4th most)
A growing population can drive up consumer spending, lead to economic growth, and boost local businesses — and Colorado is one of the fastest growing states in the country. The number of people age 15-55 living in Colorado is projected to grow by 10.5% between 2020 and 2030, more than double the comparable growth nationwide.

3. Utah
> 1-yr. real GDP change: +2.5% (12th best)
> Avg. earnings: $50,655 (15th lowest)
> Adults with a bachelor’s degree: 34.6% (12th highest)
> 2018 venture capital deals: 3.4 per 100,000 people (8th most)
Population growth often means economic growth and a larger talent pool for businesses to hire from, and Utah is growing rapidly. The number of working-age adults in the state is projected to grow by 15.1% between 2020 and 2030, more than triple the 4.6% projected national population growth.
4. North Dakota
> 1-yr. real GDP change: -0.5% (3rd worst)
> Avg. earnings: $53,013 (22nd lowest)
> Adults with a bachelor’s degree: 30.7% (25th lowest)
> 2018 venture capital deals: 0.9 per 100,000 people (14th fewest)
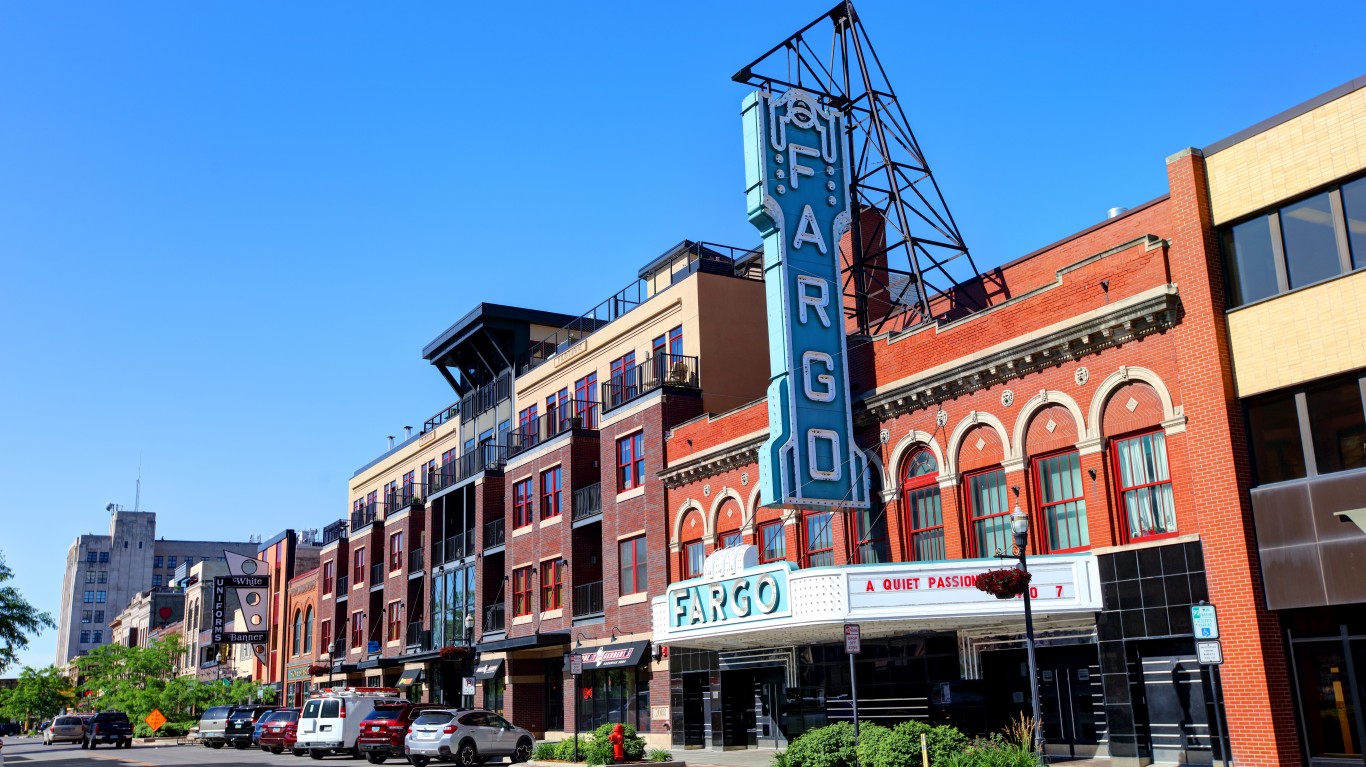
Population growth can drive economic growth and be a boon for business. Between 2020 and 2030, North Dakota’s population is projected to grow by 28.1%, more than any other state.
[in-text-ad-2]
5. Idaho
> 1-yr. real GDP change: +2.4% (14th best)
> Avg. earnings: $47,218 (4th lowest)
> Adults with a bachelor’s degree: 26.8% (10th lowest)
> 2018 venture capital deals: 1.5 per 100,000 people (20th most)
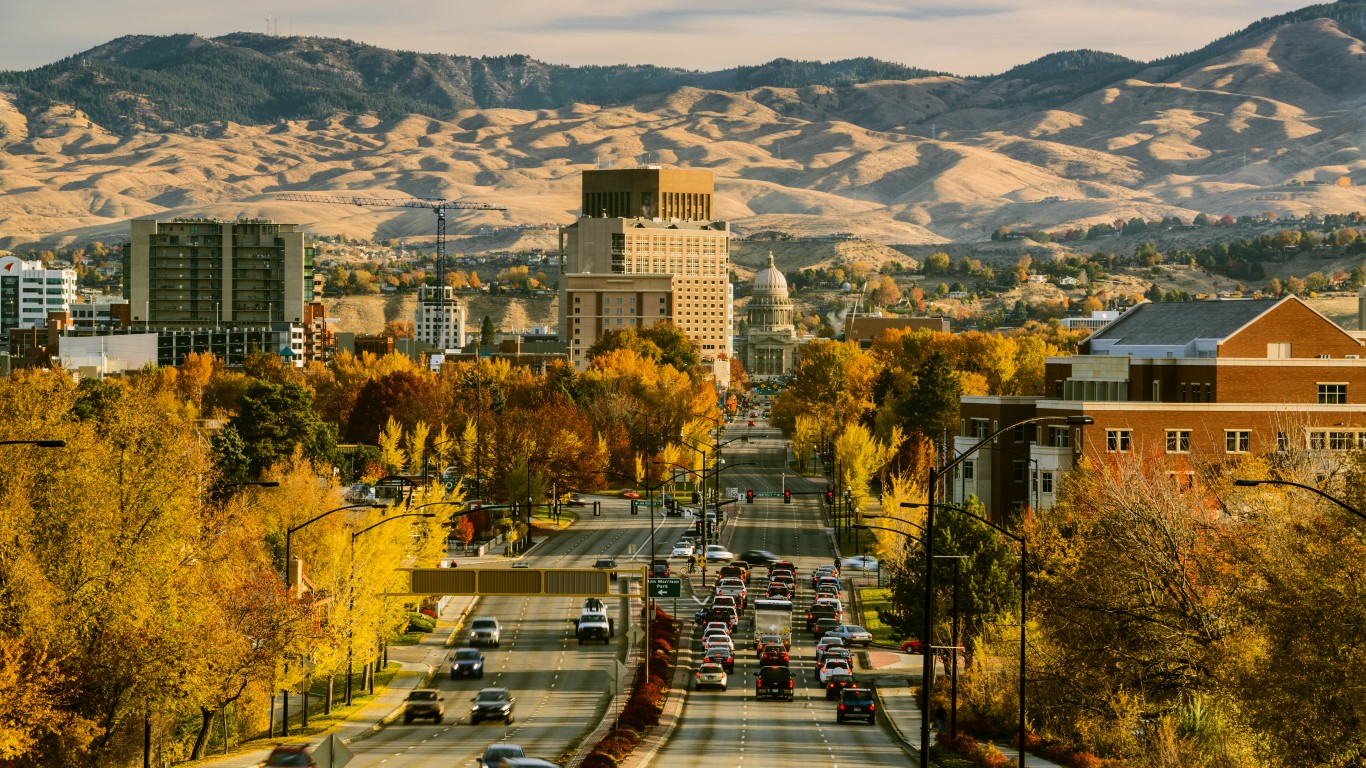
Businesses in Idaho benefit from a favorable regulatory climate. A right to work state, just 4.7% of workers in the state are unionized, nearly the smallest share in the country. Low union membership helps employers in the state save on payroll expenses.

6. Washington
> 1-yr. real GDP change: +4.7% (the best)
> Avg. earnings: $68,695 (6th highest)
> Adults with a bachelor’s degree: 35.5% (11th highest)
> 2018 venture capital deals: 4.9 per 100,000 people (6th most)
With large companies like Microsoft and Amazon headquartered in the state, Washington is one of the nation’s technology hubs. As many as 8.9% of jobs are in STEM fields — science technology, engineering, and math — one of the highest proportions of any state.
[in-text-ad]

7. Texas
> 1-yr. real GDP change: +1.3% (20th worst)
> Avg. earnings: $58,916 (16th highest)
> Adults with a bachelor’s degree: 29.6% (22nd lowest)
> 2018 venture capital deals: 1.5 per 100,000 people (21st most)
Texas is home to companies like Texas Instruments, ExxonMobil, and AT&T. Corporations in the Lone Star State were granted 9,934 patents in 2015, the second most of any state, trailing only California.

8. New Hampshire
> 1-yr. real GDP change: +2.5% (11th best)
> Avg. earnings: $60,206 (13th highest)
> Adults with a bachelor’s degree: 36.9% (8th highest)
> 2018 venture capital deals: 2.4 per 100,000 people (11th most)
Businesses in New Hampshire benefit from relatively low operating costs. For example, the state has a relatively business friendly tax climate, and the average commercial electricity bill is just $504 a month, about $150 less than the national average.

9. Florida
> 1-yr. real GDP change: +2.2% (16th best)
> Avg. earnings: $50,043 (12th lowest)
> Adults with a bachelor’s degree: 29.7% (23rd lowest)
> 2018 venture capital deals: 1.1 per 100,000 people (20th fewest)
Florida is a right to work state, meaning union membership cannot be a precondition to employment. This helps keep payroll costs for employers in the state low. The average annual earnings per job in Florida is only $50,000, about $10,600 lower than the national average.
[in-text-ad-2]

10. California
> 1-yr. real GDP change: +3.0% (6th best)
> Avg. earnings: $71,967 (4th highest)
> Adults with a bachelor’s degree: 33.6% (16th highest)
> 2018 venture capital deals: 7.7 per 100,000 people (2nd most)
California is a hotbed of innovation. Businesses in the state drew in $77.3 billion in venture capital funding in 2018 alone — the most of any state and more than quadruple the funding reported in New York, the state with the second most VC funding last year. There were also 7.7 VC deals for every 100,000 people in the state in 2018, the second most of any state.

11. South Dakota
> 1-yr. real GDP change: +0.0% (5th worst)
> Avg. earnings: $47,876 (5th lowest)
> Adults with a bachelor’s degree: 28.1% (16th lowest)
> 2018 venture capital deals: 0.3 per 100,000 people (5th fewest)
South Dakota ranks as one of the better U.S. states for business largely because it is a relatively inexpensive place to operate a company. The state has one of the most business friendly tax structures in the country on top of an already low overall cost of living.
[in-text-ad]

12. Vermont
> 1-yr. real GDP change: +1.3% (21st worst)
> Avg. earnings: $49,458 (11th lowest)
> Adults with a bachelor’s degree: 38.3% (7th highest)
> 2018 venture capital deals: 3.8 per 100,000 people (7th most)
Businesses in Vermont benefit from reliable infrastructure. The typical commute in the state takes less time than the average nationwide to commute to work, and roadway congestion cost commercial trucking just $196.6 million in Vermont in 2017, less than all but three other states.

13. Minnesota
> 1-yr. real GDP change: +1.6% (23rd worst)
> Avg. earnings: $59,768 (14th highest)
> Adults with a bachelor’s degree: 36.1% (9th highest)
> 2018 venture capital deals: 2.2 per 100,000 people (14th most)
Minnesota ranks as the best state for business in the Midwest. One reason is the labor force. A high school education is a prerequisite for employment in most jobs, and 93.1% of adults in Minnesota have finished high school, the largest share of state.
14. Wyoming
> 1-yr. real GDP change: +1.4% (22nd worst)
> Avg. earnings: $52,773 (21st lowest)
> Adults with a bachelor’s degree: 27.6% (13th lowest)
> 2018 venture capital deals: 0.9 per 100,000 people (12th fewest)
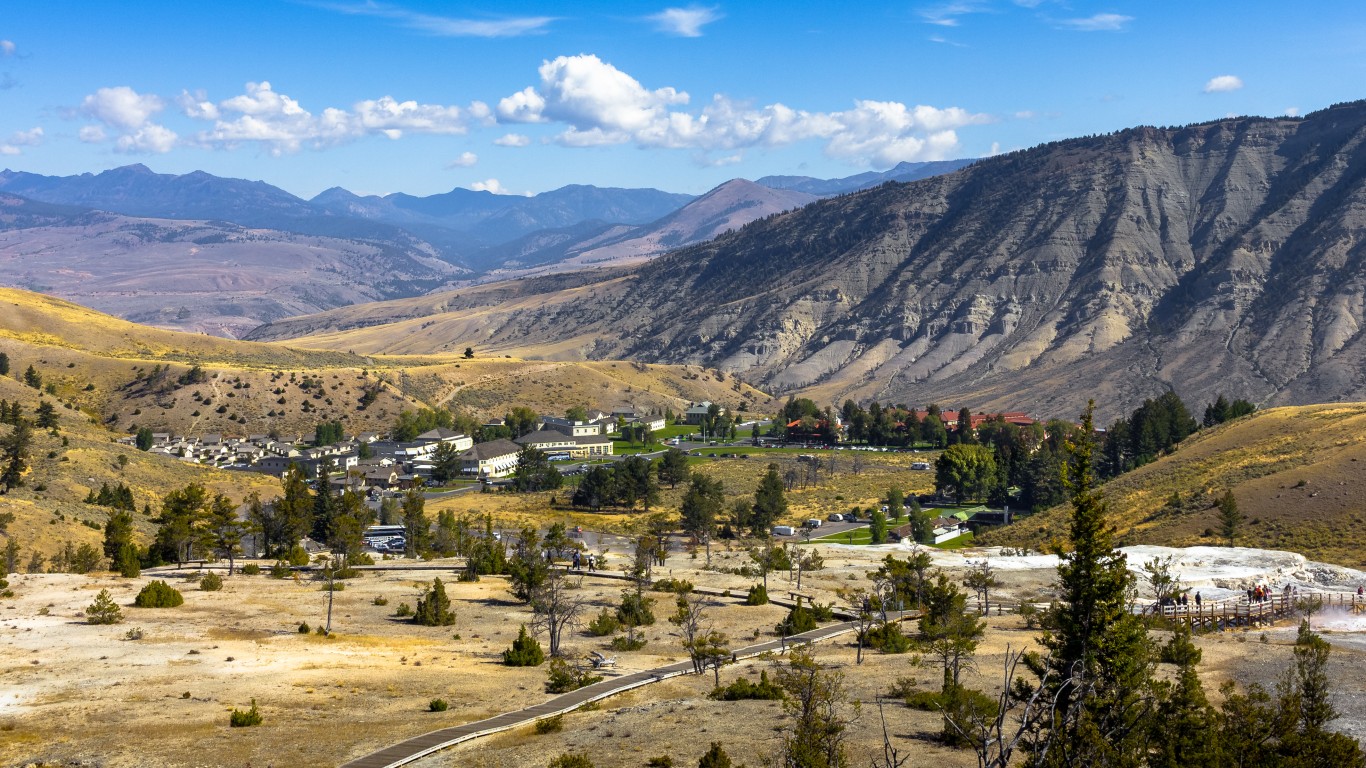
Wyoming has one of the best business climates in the country largely because it has relatively few regulations that can burden businesses. Wyoming ranks among the top 10 in the Mercatus Regulatory Freedom Index and the Institute for Legal Reform’s Lawsuit Climate score. It also has the most pro-business tax structure in the country, according to the Tax Foundation.
[in-text-ad-2]
15. North Carolina
> 1-yr. real GDP change: +2.4% (13th best)
> Avg. earnings: $53,844 (23rd lowest)
> Adults with a bachelor’s degree: 31.3% (24th highest)
> 2018 venture capital deals: 1.8 per 100,000 people (17th most)
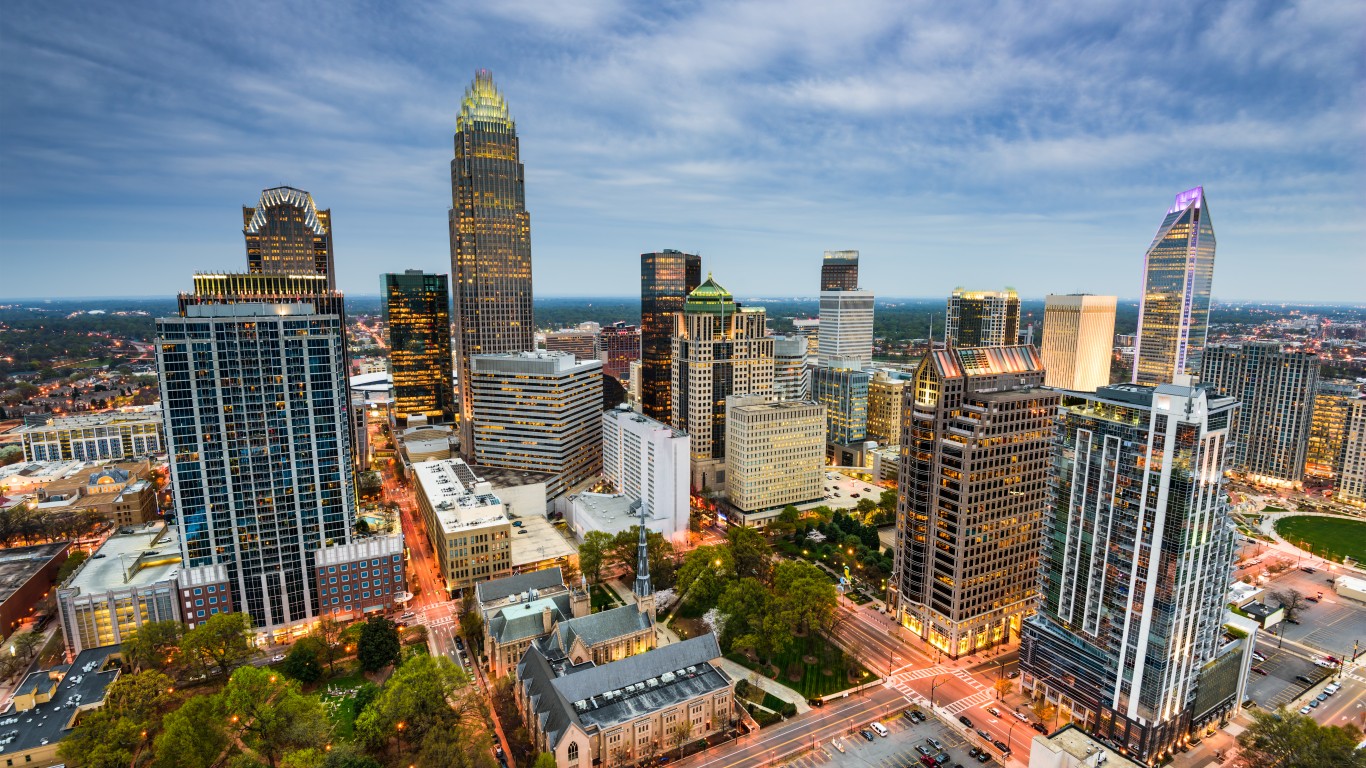
North Carolina has a business friendly tax code relative to most other states, as well as anti-union policies. A right-to-work state, just 2.7% of workers in the state are unionized, meaning employers are less restricted by decisions related to pay and benefits for their workers.

16. Virginia
> 1-yr. real GDP change: +1.8% (22nd best)
> Avg. earnings: $62,117 (11th highest)
> Adults with a bachelor’s degree: 38.7% (5th highest)
> 2018 venture capital deals: 1.7 per 100,000 people (19th most)
Virginia has one of the best educated adults populations of any state, a boon for the larger than typical share of employers in the state offering jobs in STEM fields. Of adults in the state 25 and over, 16.7% have a graduate or professional degree, the fourth largest share among states.
[in-text-ad]

17. Nevada
> 1-yr. real GDP change: +3.8% (2nd best)
> Avg. earnings: $51,785 (17th lowest)
> Adults with a bachelor’s degree: 24.9% (6th lowest)
> 2018 venture capital deals: 1.3 per 100,000 people (25th fewest)
Economic growth is often a sign businesses are doing well, and Nevada has one of the fastest growing economies in the country. The state’s GDP climbed by 3.8% in 2017, more than every state except for Washington.

18. Maryland
> 1-yr. real GDP change: +2.2% (18th best)
> Avg. earnings: $67,936 (7th highest)
> Adults with a bachelor’s degree: 39.7% (3rd highest)
> 2018 venture capital deals: 2.3 per 100,000 people (12th most)
With a nearly 40% bachelor’s degree attainment rate, Maryland is one of the best states for business partially because it has a large pool of educated workers for businesses to choose from. Maryland has the highest proportion of jobs in STEM fields of any state, at 9.2%.

19. Arizona
> 1-yr. real GDP change: +3.1% (5th best)
> Avg. earnings: $54,193 (24th lowest)
> Adults with a bachelor’s degree: 29.4% (21st lowest)
> 2018 venture capital deals: 1.3 per 100,000 people (25th most)
Arizona has some of the most favorable economic conditions of any state. Its 3.1% GDP growth in 2017 is one of the highest among states, there were nearly 127,000 small business loans issued in the state in 2015, more than in most other states. However, Arizona is hurt by the fact that some business costs, such as average energy bills, are among the highest of any state.
[in-text-ad-2]

20. Montana
> 1-yr. real GDP change: +0.3% (12th worst)
> Avg. earnings: $44,470 (2nd lowest)
> Adults with a bachelor’s degree: 32.3% (19th highest)
> 2018 venture capital deals: 1.1 per 100,000 people (22nd fewest)
The average commercial electricity bill in Montana is just $391 per month, the lowest of any state. Despite the low overhead, Montana is not home to many innovative, new businesses. Montana-based companies drew in just $44.6 million in venture capital funding in 2018, less than in the majority of states.

21. Georgia
> 1-yr. real GDP change: +3.1% (4th best)
> Avg. earnings: $55,838 (23rd highest)
> Adults with a bachelor’s degree: 30.9% (25th highest)
> 2018 venture capital deals: 1.2 per 100,000 people (23rd fewest)
Businesses generally benefit from economic growth, and Georgia’s economy grew by 3.1% in 2017, more than all but three other states. Some employers in the state may have difficulty filling high-skilled positions, however, as just 11.9% of adults in the state have a graduate or professional degree.
[in-text-ad]

22. Iowa
> 1-yr. real GDP change: +0.3% (11th worst)
> Avg. earnings: $50,512 (14th lowest)
> Adults with a bachelor’s degree: 28.9% (18th lowest)
> 2018 venture capital deals: 1.1 per 100,000 people (18th fewest)
Businesses in Iowa benefit from the state’s low cost of living and reliable infrastructure. Conditions in the state, however, are not ideal for employers requiring high skilled labor as less than one in 10 adults have a masters or professional degree, compared to 12.3% of adults nationwide.

23. Oregon
> 1-yr. real GDP change: +3.6% (3rd best)
> Avg. earnings: $57,502 (19th highest)
> Adults with a bachelor’s degree: 33.7% (14th highest)
> 2018 venture capital deals: 2.4 per 100,000 people (10th most)
Oregon’s economy has grown at a much faster rate than almost all other states in recent years. The state’s GDP grew 3.6% in 2017, and over the last five years it grew by 19.0% — both the third highest growth rates among states. However, Oregon is not a right-to-work state and has a higher union membership rate than most states, which can drive up payroll costs for businesses.
24. Connecticut
> 1-yr. real GDP change: -1.1% (the worst)
> Avg. earnings: $72,728 (3rd highest)
> Adults with a bachelor’s degree: 38.7% (5th highest)
> 2018 venture capital deals: 2.5 per 100,000 people (9th most)
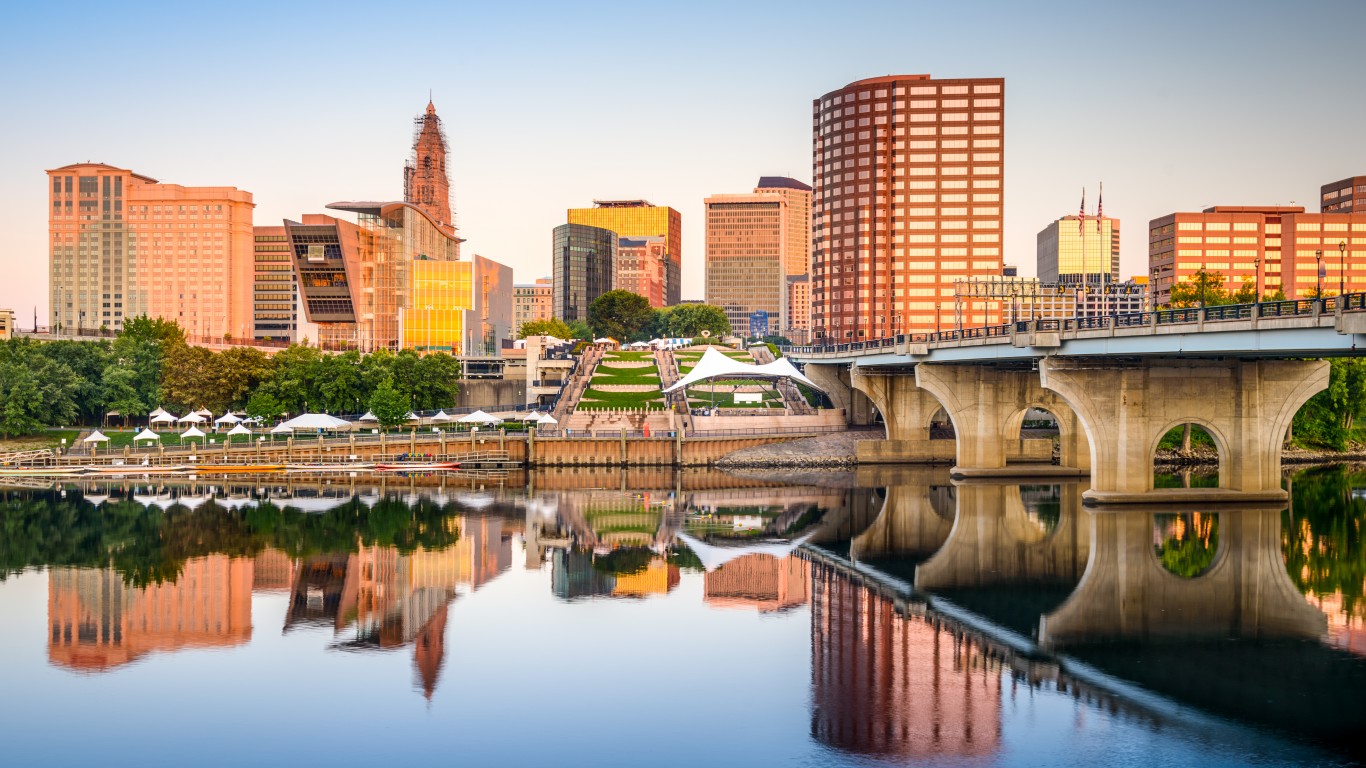
The cost of doing business is high in Connecticut. The state has an unfavorable business tax climate relative to most other states, and the average monthly commercial electricity bill is well above the national average. However, employers in the state aso have access to a relatively skilled labor force, as 17.3% of adults in the state have a graduate or professional degree, the third largest share of any state.
[in-text-ad-2]
25. Nebraska
> 1-yr. real GDP change: +0.9% (17th worst)
> Avg. earnings: $54,765 (25th highest)
> Adults with a bachelor’s degree: 31.7% (21st highest)
> 2018 venture capital deals: 1.0 per 100,000 people (17th fewest)
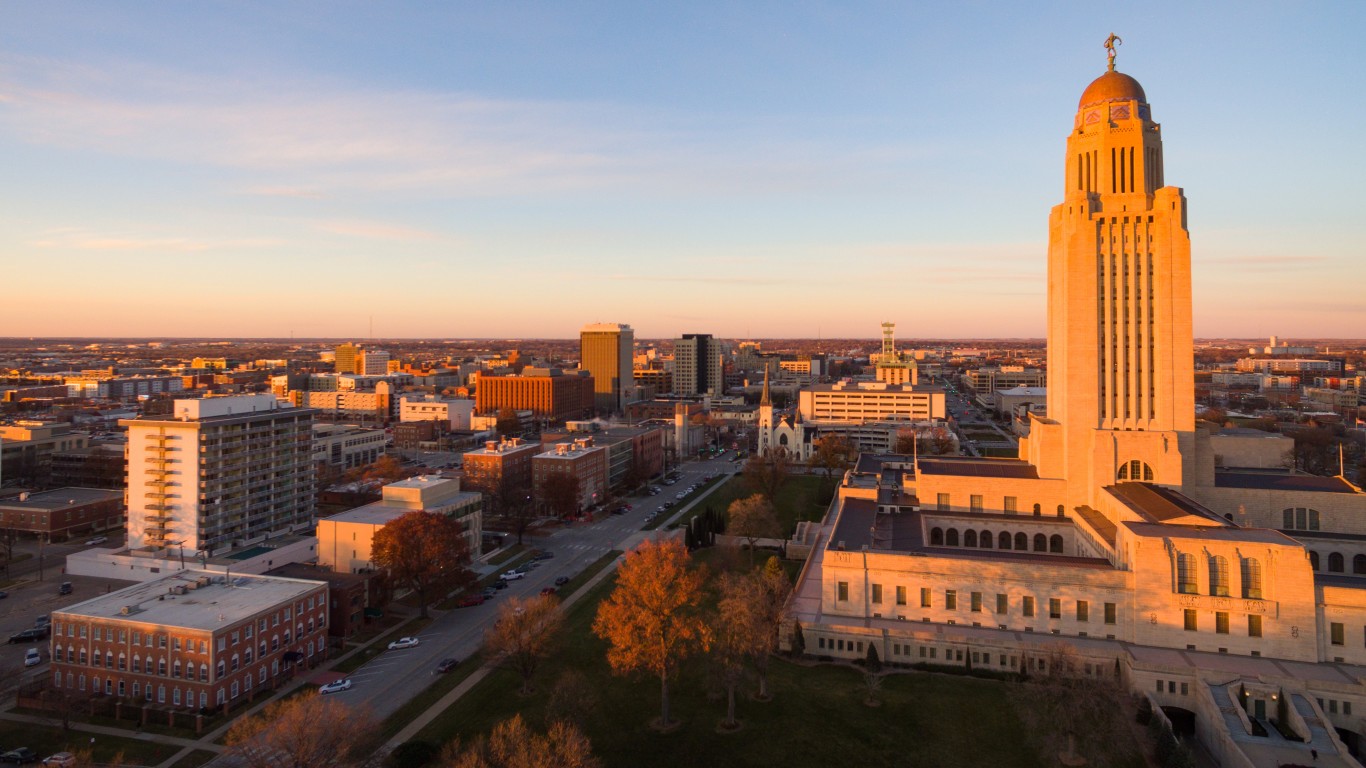
Though Nebraska’s unemployment rate is shrinking and its GDP is growing, the state is lagging behind most other states in these crucial economic measures. Nebraska also has relatively few venture capital investments coming into the state. Its business climate, however, is buoyed by the state’s relatively low cost of living and cost of operations.

26. Kansas
> 1-yr. real GDP change: +0.2% (9th worst)
> Avg. earnings: $52,466 (18th lowest)
> Adults with a bachelor’s degree: 33.7% (14th highest)
> 2018 venture capital deals: 0.7 per 100,000 people (9th fewest)
Economic growth can benefit to all businesses in an area, and in 2017, Kansas’s GDP grew by just 0.2%, a slower growth than all but eight other states.
[in-text-ad]

27. Michigan
> 1-yr. real GDP change: +2.2% (15th best)
> Avg. earnings: $56,264 (21st highest)
> Adults with a bachelor’s degree: 29.1% (20th lowest)
> 2018 venture capital deals: 1.1 per 100,000 people (19th fewest)
Michigan’s GDP grew by 2.2% in 2017, in line with national economic growth. The state’s GDP growth will not likely keep pace with the U.S. for long, however. Population growth can drive economic growth, and between 2020 and 2030, Michigan’s population is projected to decline by 1.1%.

28. Delaware
> 1-yr. real GDP change: +0.1% (8th worst)
> Avg. earnings: $60,803 (12th highest)
> Adults with a bachelor’s degree: 31.5% (22nd highest)
> 2018 venture capital deals: 5.0 per 100,000 people (5th most)
Businesses in Delaware have done a better job of attracting venture capital investments than almost every other state. There were five VC investments per every 100,000 people in the state in 2018, trailing only four other states, including heavyweights like California and New York. Still Delaware’s economy grew by a sluggish 0.1% in 2017. The U.S. reported 2.2% GDP growth the same year.

29. New York
> 1-yr. real GDP change: +1.9% (20th best)
> Avg. earnings: $77,084 (the highest)
> Adults with a bachelor’s degree: 36.0% (10th highest)
> 2018 venture capital deals: 5.3 per 100,000 people (3rd most)
Businesses in New York state drew $14.3 billion in venture capital funding in 2018, the second most of any state. There were also 5.3 VC deals for every 100,000 people in the state the same year, the third most of any state. However, employers have higher average payroll costs in New York than any other state.
[in-text-ad-2]

30. Tennessee
> 1-yr. real GDP change: +2.8% (7th best)
> Avg. earnings: $56,469 (20th highest)
> Adults with a bachelor’s degree: 27.3% (12th lowest)
> 2018 venture capital deals: 1.2 per 100,000 people (24th fewest)
Overall, Tennessee’s economy is doing well, growing by 2.8% in 2017, one of the highest growth rates nationwide. Yet the state is not one of the best for business, in part because of a smaller than typical share of higher skill workers. Just 27.3% of adults in Tennessee have a bachelor’s degree, well below the 32.0% share of adults nationwide.

31. Alaska
> 1-yr. real GDP change: -0.5% (4th worst)
> Avg. earnings: $67,785 (8th highest)
> Adults with a bachelor’s degree: 28.8% (17th lowest)
> 2018 venture capital deals: 0.4 per 100,000 people (6th fewest)
Driven in part by high average earnings per job and average monthly utilities spending, the cost of doing business in Alaska is higher than in most states. The average commercial electricity bill in the state is $796 per month, compared to the national $655 average.
[in-text-ad]
32. South Carolina
> 1-yr. real GDP change: +2.6% (10th best)
> Avg. earnings: $50,067 (13th lowest)
> Adults with a bachelor’s degree: 28.0% (15th lowest)
> 2018 venture capital deals: 0.8 per 100,000 people (10th fewest)
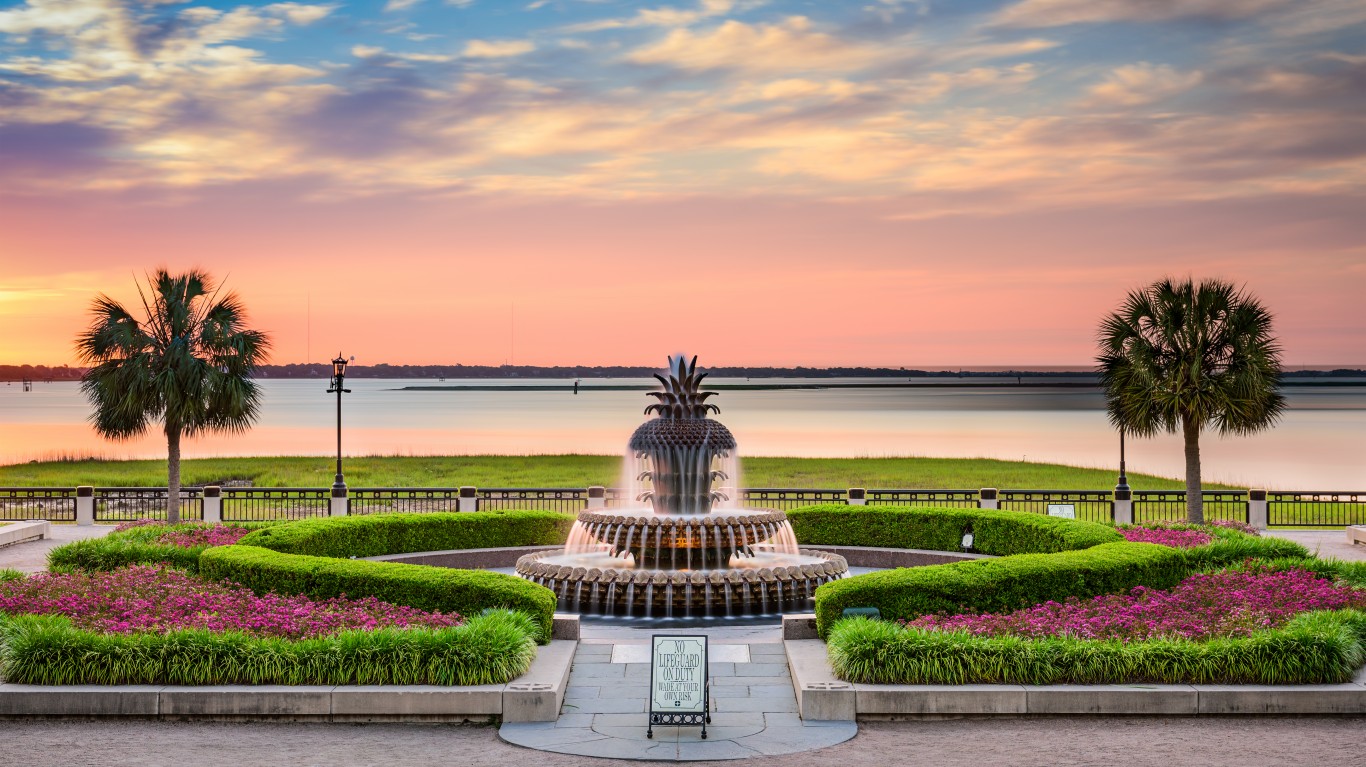
South Carolina’s 2.6% GDP growth rate in 2017 was the 10th highest of all states. Yet the state still ranks as one of the worst places in the United States for business, due in part to the relatively less educated workforce, which can make hiring skilled employees more difficult. Just 28.0% of adults in South Carolina have a bachelor’s degree or higher, well below the 32.0% national bachelor’s degree attainment rate.

33. Indiana
> 1-yr. real GDP change: +1.8% (23rd best)
> Avg. earnings: $54,906 (24th highest)
> Adults with a bachelor’s degree: 26.8% (10th lowest)
> 2018 venture capital deals: 1.4 per 100,000 people (22nd most)
Businesses needing to fill high skill positions may struggle to find employees more in Indiana than other states. Indiana is one of only 13 states where fewer than one in every 10 adults have a graduate or professional degree.
34. New Jersey
> 1-yr. real GDP change: +1.6% (24th worst)
> Avg. earnings: $69,651 (5th highest)
> Adults with a bachelor’s degree: 39.7% (3rd highest)
> 2018 venture capital deals: 1.0 per 100,000 people (16th fewest)
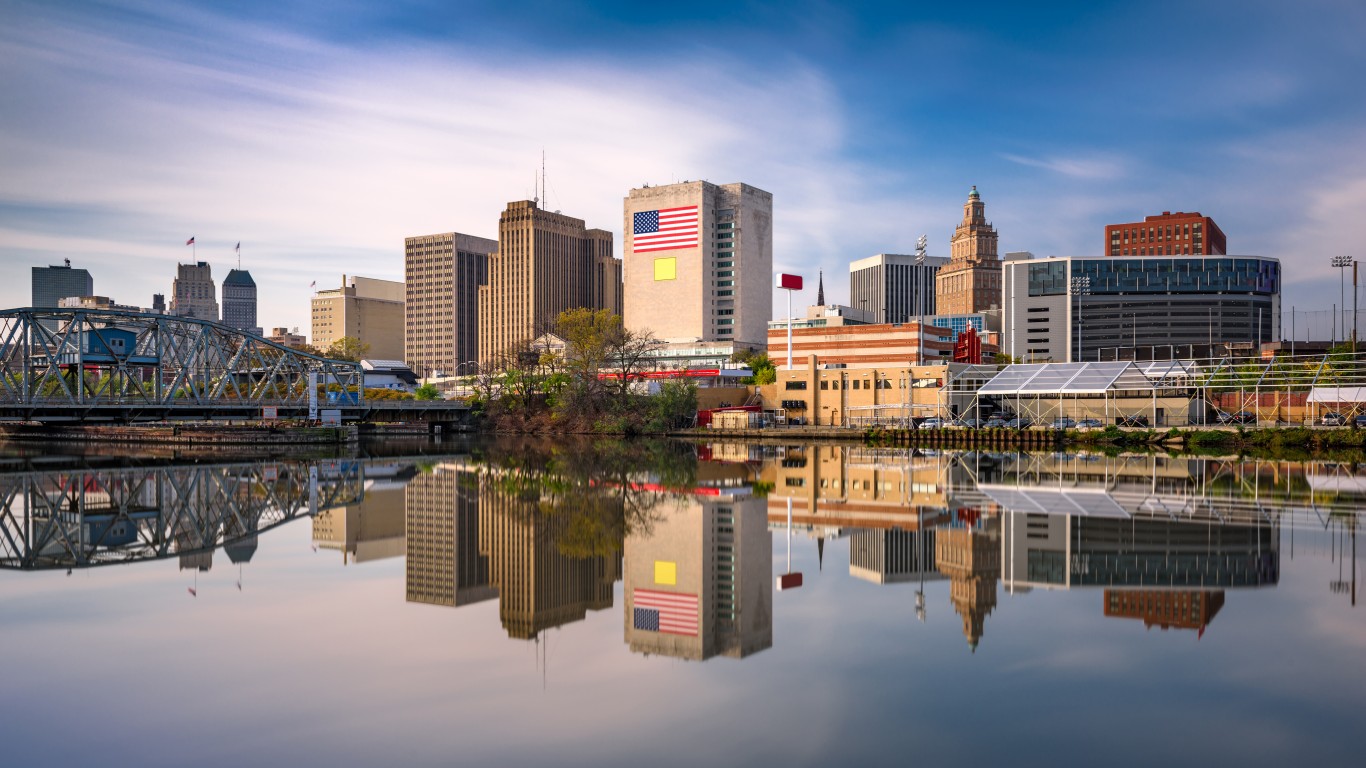
A near nation-leading cost of living is not the only factor driving up business expenses for employers in the Garden State. Infrastructure is also a problem. Roadway congestion cost commercial trucking in the state an estimated $3.4 billion in 2017, the fifth most of any state.
[in-text-ad-2]

35. Maine
> 1-yr. real GDP change: +1.9% (21st best)
> Avg. earnings: $48,622 (7th lowest)
> Adults with a bachelor’s degree: 32.1% (20th highest)
> 2018 venture capital deals: 1.8 per 100,000 people (18th most)
Maine is one of only a few Northeastern states to rank so poorly for its business environment. The state’s struggle to attract and retain workers is part of the problem. Between 2020 and 2030, the number of prime working-age Maine residents is projected to decline by 6.1%.
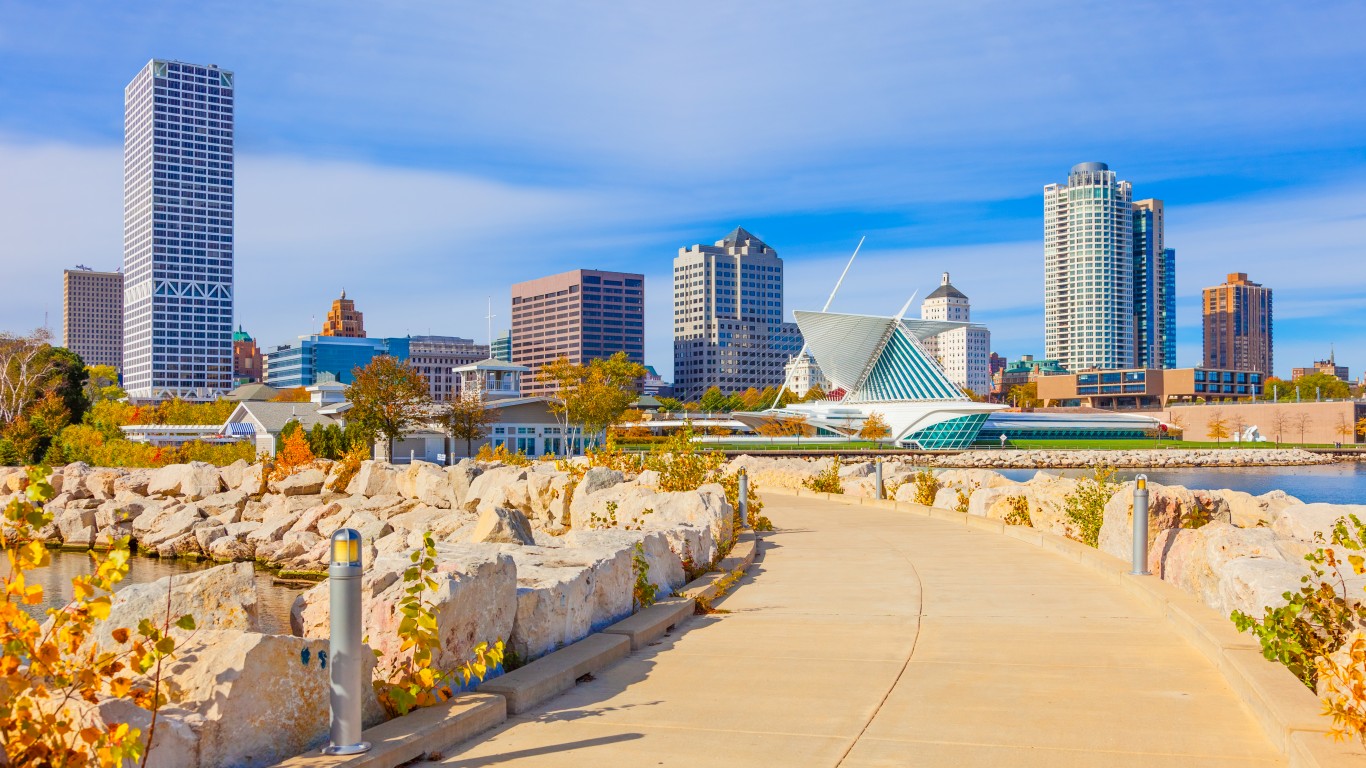
36. Wisconsin
> 1-yr. real GDP change: +1.3% (19th worst)
> Avg. earnings: $54,244 (25th lowest)
> Adults with a bachelor’s degree: 30.4% (24th lowest)
> 2018 venture capital deals: 1.3 per 100,000 people (23rd most)
Wisconsin’s tax code is less business-friendly than that of most other states, according to the Tax Foundation. Additionally, Wisconsin’s economy grew by just 1.3% in 2017, slower than most other states.
[in-text-ad]

37. Missouri
> 1-yr. real GDP change: +0.9% (16th worst)
> Avg. earnings: $52,550 (19th lowest)
> Adults with a bachelor’s degree: 29.1% (20th lowest)
> 2018 venture capital deals: 1.1 per 100,000 people (21st fewest)
Growing a business often requires hiring more employees, but new workers may be in short supply in Missouri in the coming years. Between 2020 and 2030, the state’s prime working-age population is projected to grow by just 0.9%, far slower than the comparable 4.6% national growth.

38. Arkansas
> 1-yr. real GDP change: +0.3% (10th worst)
> Avg. earnings: $46,286 (3rd lowest)
> Adults with a bachelor’s degree: 23.4% (3rd lowest)
> 2018 venture capital deals: 0.9 per 100,000 people (15th fewest)
As is the case in many of the worst states for business, Arkansas does not have a well educated population. Just 23.4% of Arkansas adults have a bachelor’s degree compared to 32.0% of adults nationwide.

39. Pennsylvania
> 1-yr. real GDP change: +2.2% (19th best)
> Avg. earnings: $62,276 (10th highest)
> Adults with a bachelor’s degree: 31.4% (23rd highest)
> 2018 venture capital deals: 2.1 per 100,000 people (15th most)
Business owners in Pennsylvania must contend with some of the highest operating costs of any state, largely due to high payroll costs. Partially because of the state’s higher than typical unionization rate, the average annual wage per job is $62,276 in Pennsylvania, more than in all but nine other states.
[in-text-ad-2]
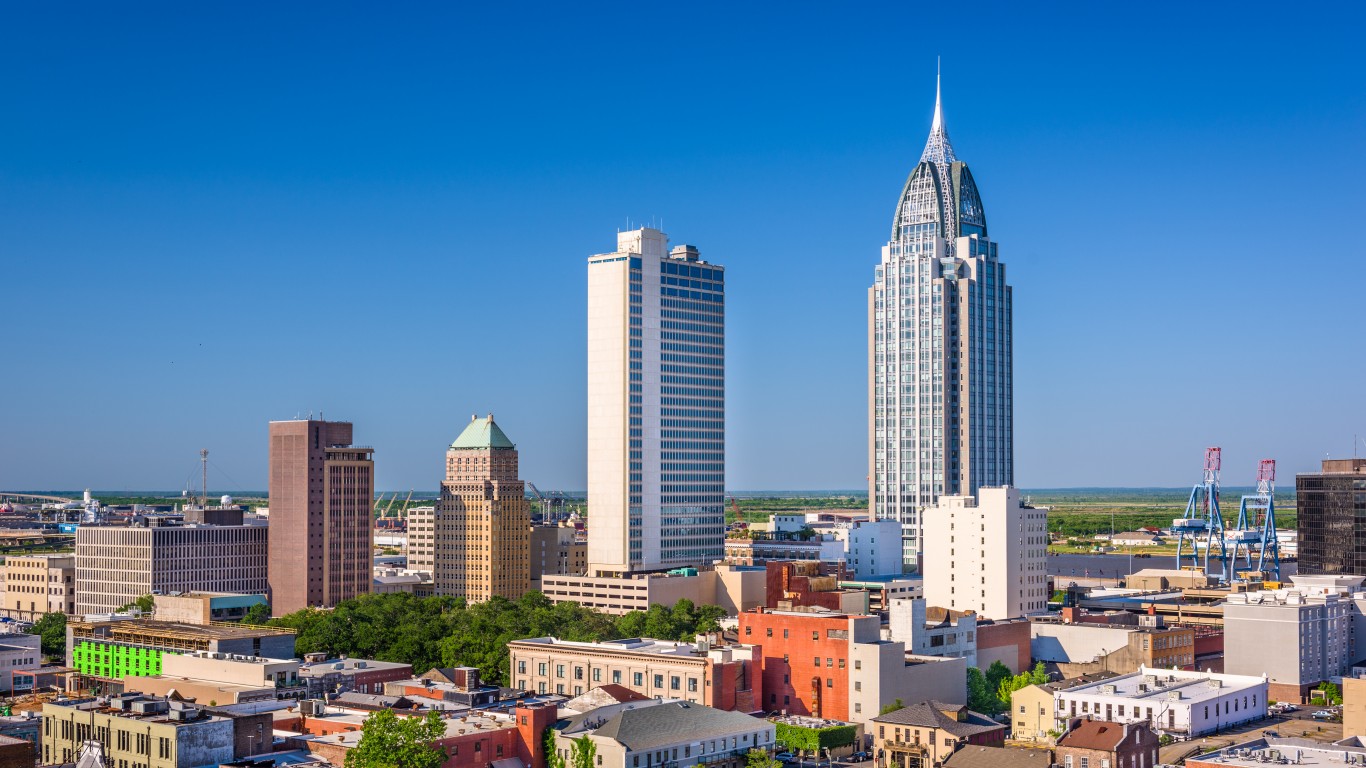
40. Alabama
> 1-yr. real GDP change: +1.6% (25th worst)
> Avg. earnings: $49,310 (9th lowest)
> Adults with a bachelor’s degree: 25.5% (8th lowest)
> 2018 venture capital deals: 0.5 per 100,000 people (8th fewest)
Venture capitalists have found relatively few worthy investments in Alabama. There were only 0.5 VC deals for every 100,000 state residents in 2018, less than one-sixth of the nationwide rate. Alabama also has one of the largest gender pay gaps in the nation. Women in the state make only about 73% of what men do on average.

41. Illinois
> 1-yr. real GDP change: +0.4% (13th worst)
> Avg. earnings: $64,071 (9th highest)
> Adults with a bachelor’s degree: 34.4% (13th highest)
> 2018 venture capital deals: 2.0 per 100,000 people (16th most)
Illinois’s GDP grew by just 0.4% in 2017, even as the U.S. economy expanded by 2.2%. Conditions in the state may not improve in the near future. Economic growth is often driven by population growth, and the number of working-age adults in the state is projected to decline by 3.9% between 2020 and 2030.
[in-text-ad]
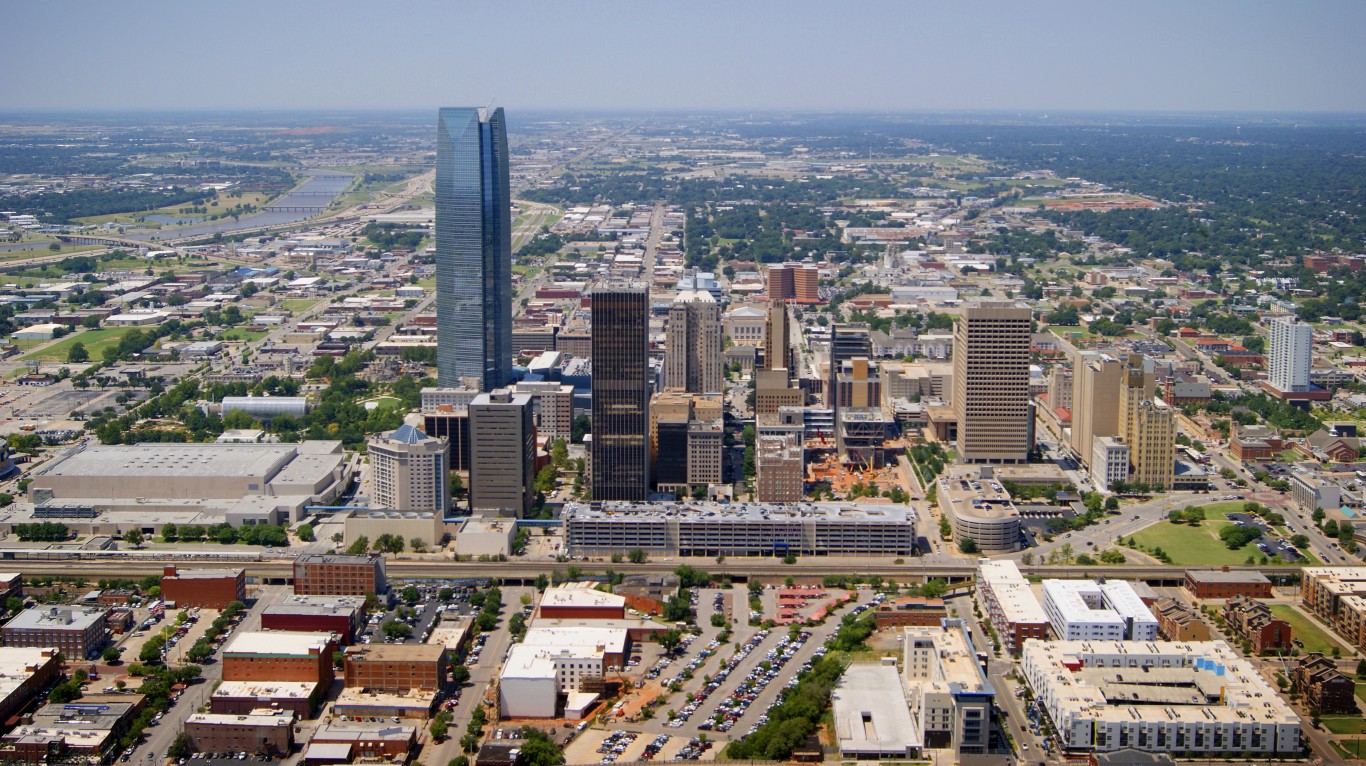
42. Oklahoma
> 1-yr. real GDP change: +0.7% (15th worst)
> Avg. earnings: $52,582 (20th lowest)
> Adults with a bachelor’s degree: 25.5% (8th lowest)
> 2018 venture capital deals: 0.3 per 100,000 people (4th fewest)
Oklahoma’s business climate may be hampered by low educational attainment rates. Just over a quarter of adults in Oklahoma hold at least a bachelor’s degree, one of the lowest proportions of any state. This may stifle growth of industries that required higher-skilled employees, and may help explain the state’s low venture capital investments.
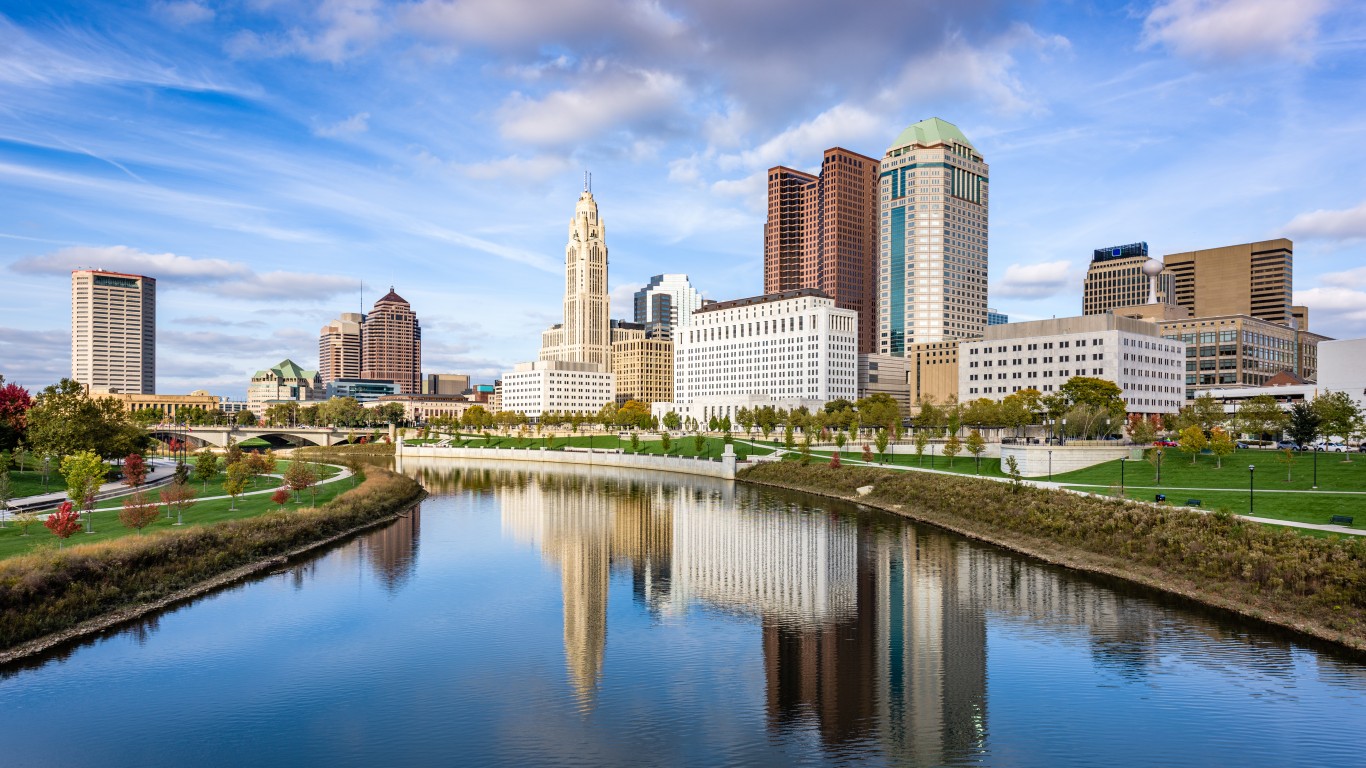
43. Ohio
> 1-yr. real GDP change: +1.6% (25th best)
> Avg. earnings: $55,843 (22nd highest)
> Adults with a bachelor’s degree: 28.0% (15th lowest)
> 2018 venture capital deals: 1.3 per 100,000 people (24th most)
A college education is often a prerequisite for employment, and in Ohio, just 28% of adults have a bachelor’s degree, a smaller share than in the majority of states.

44. Rhode Island
> 1-yr. real GDP change: +0.7% (14th worst)
> Avg. earnings: $57,954 (17th highest)
> Adults with a bachelor’s degree: 33.5% (17th highest)
> 2018 venture capital deals: 2.2 per 100,000 people (13th most)
Rhode Island is the only state in New England and the broader Northeastern United States to rank among the 10 worst states for business. Part of the reason is high unionization rates, which restricts the ability of employers to set wages and benefits. Rhode Island is not a right-to-work state, and 17.3% of the workforce is in a union, a larger share than in all but four other states.
[in-text-ad-2]
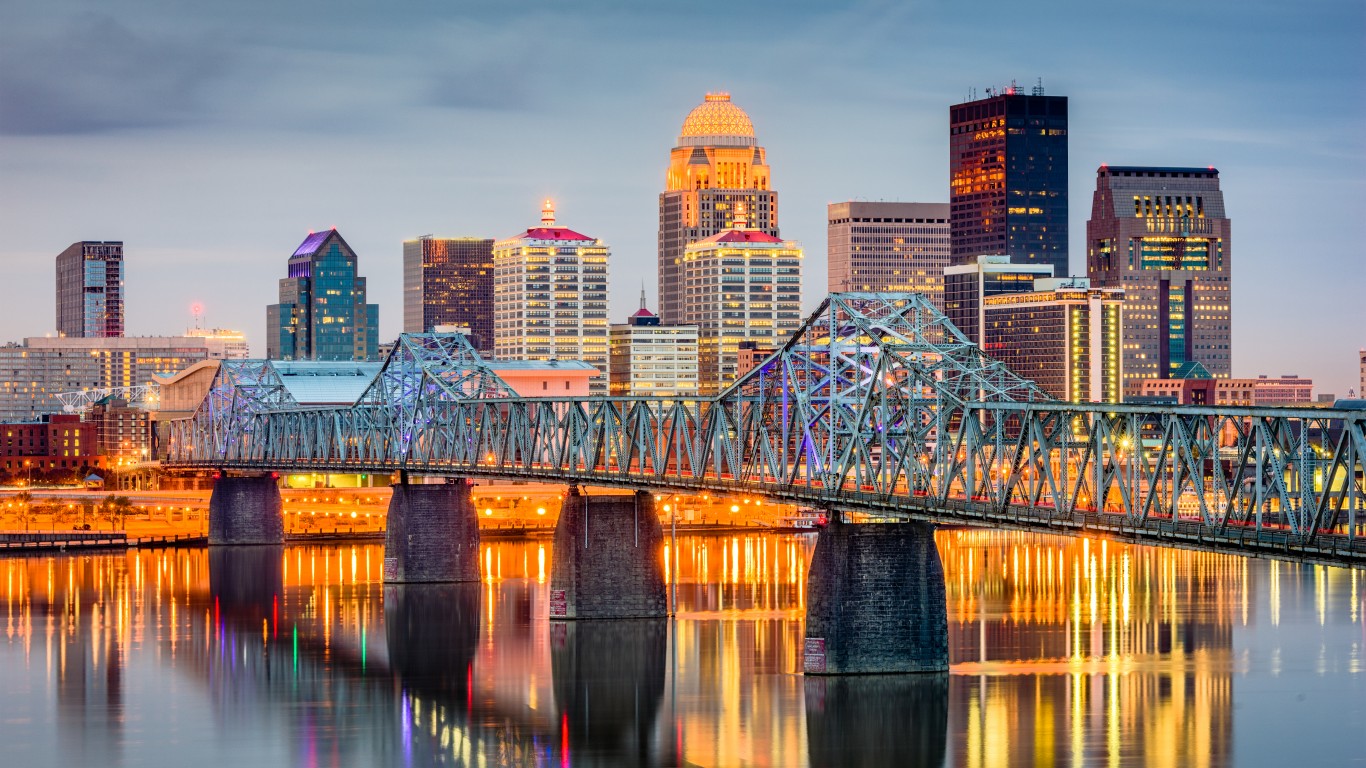
45. Kentucky
> 1-yr. real GDP change: +1.7% (24th best)
> Avg. earnings: $49,410 (10th lowest)
> Adults with a bachelor’s degree: 24.0% (5th lowest)
> 2018 venture capital deals: 0.9 per 100,000 people (11th fewest)
Kentucky’s residents are some of the least healthy in the country. This can become a major burden on employers if workers are forced to miss work because they need medical care. Kentucky also has a far higher than average 17.2% poverty rate, meaning fewer residents have disposable income to stimulate economic growth.

46. Mississippi
> 1-yr. real GDP change: +0.1% (6th worst)
> Avg. earnings: $42,488 (the lowest)
> Adults with a bachelor’s degree: 21.9% (2nd lowest)
> 2018 venture capital deals: 0.2 per 100,000 people (3rd fewest)
Despite having the lowest cost of living and one of the lowest costs of doing business, Mississippi is still one of the worst states for business. The state has one of the lowest shares of college-educated adults, so finding qualified employees for highly skilled jobs could be difficult for businesses. This problem will likely worsen as Mississippi’s working-age population is actually projected to shrink over the next decade.
[in-text-ad]

47. Hawaii
> 1-yr. real GDP change: +1.2% (18th worst)
> Avg. earnings: $57,803 (18th highest)
> Adults with a bachelor’s degree: 32.9% (18th highest)
> 2018 venture capital deals: 0.4 per 100,000 people (7th fewest)
Businesses in Hawaii face the highest energy bills of any state. The state also has the highest overall cost of living of in the country. Goods and services are 18.4% more expensive on average in Hawaii than they are nationwide.

48. West Virginia
> 1-yr. real GDP change: +2.2% (17th best)
> Avg. earnings: $48,220 (6th lowest)
> Adults with a bachelor’s degree: 20.2% (the lowest)
> 2018 venture capital deals: 0.1 per 100,000 people (the fewest)
With a U.S.-low college degree attainment rate of 20.2%, West Virginia has relatively few qualified candidates for highly-skilled jobs that pay well and could boost the state’s economy. This is likely the reason why the state has almost no venture capital investments.

49. New Mexico
> 1-yr. real GDP change: +0.1% (7th worst)
> Avg. earnings: $48,874 (8th lowest)
> Adults with a bachelor’s degree: 27.1% (11th lowest)
> 2018 venture capital deals: 0.9 per 100,000 people (13th fewest)
A high crime rate can stifle economic activity and New Mexico has one of the highest violent crime rates in the country. There were 783 incidents per 100,000 people — more than double the U.S. violent crime rate. New Mexico businesses also are subject to more burdensome regulations than those in most other states.
[in-text-ad-2]

50. Louisiana
> 1-yr. real GDP change: -0.8% (2nd worst)
> Avg. earnings: $51,131 (16th lowest)
> Adults with a bachelor’s degree: 23.8% (4th lowest)
> 2018 venture capital deals: 0.2 per 100,000 people (2nd fewest)
Among all 50 states, Louisiana is the worst place to do business. Louisiana is one of just four states in which GDP declined in 2017. Businesses may also have a hard time hiring top-talent as just 23.8% of adults in the state have a bachelor’s degree or higher, the fourth smallest share of any state. A lack of reliable infrastructure is also a problem, as traffic congestion cost commercial trucking more than $2.3 billion in 2017, more than in all but 10 other states.
Methodology
To determine the best and worst states for business, 24/7 Wall St. compiled 46 measures into eight categories: economic conditions, business costs, state infrastructure, the availability and skill level of the workforce, quality of life, regulations, technology and innovation, and cost of living. Each category aimed to capture essential elements that businesses consider when deciding where to locate and operate.
Each category consists of several measures. We created an index for each category using a geometric mean. We then used the geometric mean of each index score to calculate the overall scores.
Two categories — labor and human capital and technology and innovation — received double weight, and quality of life and cost of living were given half weights. Cost of business, infrastructure, economy, and regulation received full weight.
The business costs index contains business expenses that can vary between states. A state’s ranking in the Tax Foundation’s 2018 Tax Climate Index was included to capture the impact of state-level taxes on business. We also looked at 2017 commercial prices of electricity from the Energy Information Administration. From the Bureau of Economic Analysis, we included average compensation per job in 2017 as well as other forms of compensation, like retirement and insurance benefits as a percent of salaries and wages per job.
The cost of living index considers costs to both households and businesses. We included a housing affordability ratio, calculated using median annual homeownership costs as a percentage of median household income. Both measures are from the U.S. Census Bureau’s 2017 American Community Survey. Also included were regional price parity, a measure of the cost of living for 2016 from the BEA, and the average state and local tax burden as a percentage of per capita income from the Tax Foundation. Tax Foundation figures are for the 2012 fiscal year.
Economy is the broadest category and was designed to measure each state’s productivity, growth potential, and labor market. We included both one- and five-year growth rates — 2017 and 2012 through 2017 — in real GDP from the BEA, as well as changes in annual and average five-year unemployment rates from the Bureau of Labor Statistics. We also included data on the number of population-adjusted building permits issued in 2015 from the Department of Housing and Urban Development.
Because many businesses benefit from higher consumer spending, the economy index includes state poverty rates and the individual earnings gap between men and women, both from the 2017 ACS. We added the value of goods shipped from each state in 2018 as well as the growth of non-government establishments between 2015 and 2016 from the County Business Patterns. Both datasets are produced by the Census. The total number of small business loans one-million dollars or less comes from the Small Business Administration and is for the year 2015, the most recent data available. Finally, we created a composite rank of each state’s credit ratings from Standard & Poor’s and Moody’s Investor Service.
The infrastructure index captures the importance of transportation to businesses and employees. From the Federal Highway Administration we looked at the percentage of bridges deemed structurally deficient or functionally obsolete as of the end of 2017. Also from the FHWA, we used the percentage of rural and urban interstate miles in poor condition. Poor was defined as interstate roads with an International Roughness Index score greater than 170.
We also included the estimated costs to commercial trucking due to traffic congestion in 2017 from the American Transportation Research Institute. Lastly, we used workers’ average commute time in each state from the 2017 ACS.
The labor and human capital index offers a look at the quality of a state’s labor force. We included data on high school, bachelor’s, and graduate educational attainment rates from the 2017 ACS. We also looked at per-pupil education expenditures in each state for 2015 from Education Week. Finally, we incorporated our own population projections from 2020 through 2030, using both the growth in total population as well as the projected growth in the working-age population. Population projections were calculated using the cohort component method and used population data from the ACS and birth and survival rates from the Centers for Disease Control and Prevention.
The quality of life index was constructed to offer insight into why employees may decide to reside in particular areas. We included each state’s 2017 violent crime rate from the FBI, and the percentage of people without health insurance in 2017 from the ACS. We also used the United Health Foundation’s 2018 State Health ranking for All Health Outcomes. From the Department of Education, we incorporated the total number of post-secondary schools in each state. We also looked at the number of art, entertainment, and recreation establishments per 100,000 state residents in 2016 from the CBP.
The regulation index includes each state’s status as a right-to-work state as well as the share of non-agricultural workers who were union members as of 2018 from UnionStats. Additionally, the index includes parts of the Mercatus Center’s 2016 Regulatory Freedom Index and the Institute for Legal Reform’s 2015 Lawsuit Climate Index, an indication of how fair and reasonable a state’s legal system is perceived to be by businesses.
The technology and innovation index includes data on the average venture capital investment in businesses in each state as well as the frequency of venture capital deals. Both metrics are from the National Venture Capital Association and are for 2018. From the U.S. Patent and Trade Office, we included the number of patents issued to state residents in 2015. We used the Milken Institute’s 2016 State Technology and Science Index and the number of science, technology, engineering, and mathematics (STEM) jobs as a share of all jobs calculated from BLS occupation data.
Additionally, we considered the 2016 results of the U.S. Census Bureau’s American Survey of Entrepreneurs. The ASE is an annual survey of business owners, who report on the ease of doing business in their state based on measures such as tax policy, business conditions, access to qualified labor, and other regional factors.
The thought of burdening your family with a financial disaster is most Americans’ nightmare. However, recent studies show that over 100 million Americans still don’t have proper life insurance in the event they pass away.
Life insurance can bring peace of mind – ensuring your loved ones are safeguarded against unforeseen expenses and debts. With premiums often lower than expected and a variety of plans tailored to different life stages and health conditions, securing a policy is more accessible than ever.
A quick, no-obligation quote can provide valuable insight into what’s available and what might best suit your family’s needs. Life insurance is a simple step you can take today to help secure peace of mind for your loved ones tomorrow.
Click here to learn how to get a quote in just a few minutes.
Thank you for reading! Have some feedback for us?
Contact the 24/7 Wall St. editorial team.