From the frozen landscapes of Antarctica to the scorching deserts of Africa to the often drought-stricken regions of North America, areas that get little to no rainfall tend to have harsh environments.
To identify the driest places on Earth, 24/7 Wall St. reviewed average annual rainfall recorded by weather stations around the world and compiled by the Global Historical Climatology Network, a program of the National Centers for Environmental Information (NCEI).
We calculated the average annual rainfall from precipitation in the years 1997 through 2018. Weather stations that did not have at least five years of data available between 1997 and 2018 were not considered.
While many such hostile regions of the planet are barren of all life, many have been inhabited for millennia.
Most of these places are in Algeria, Egypt, and other countries along the southern coast of the Mediterranean. Six of the 50 driest places on Earth receive an average of less than 1 inch of rain each year.
Click here to see the driest places on Earth.
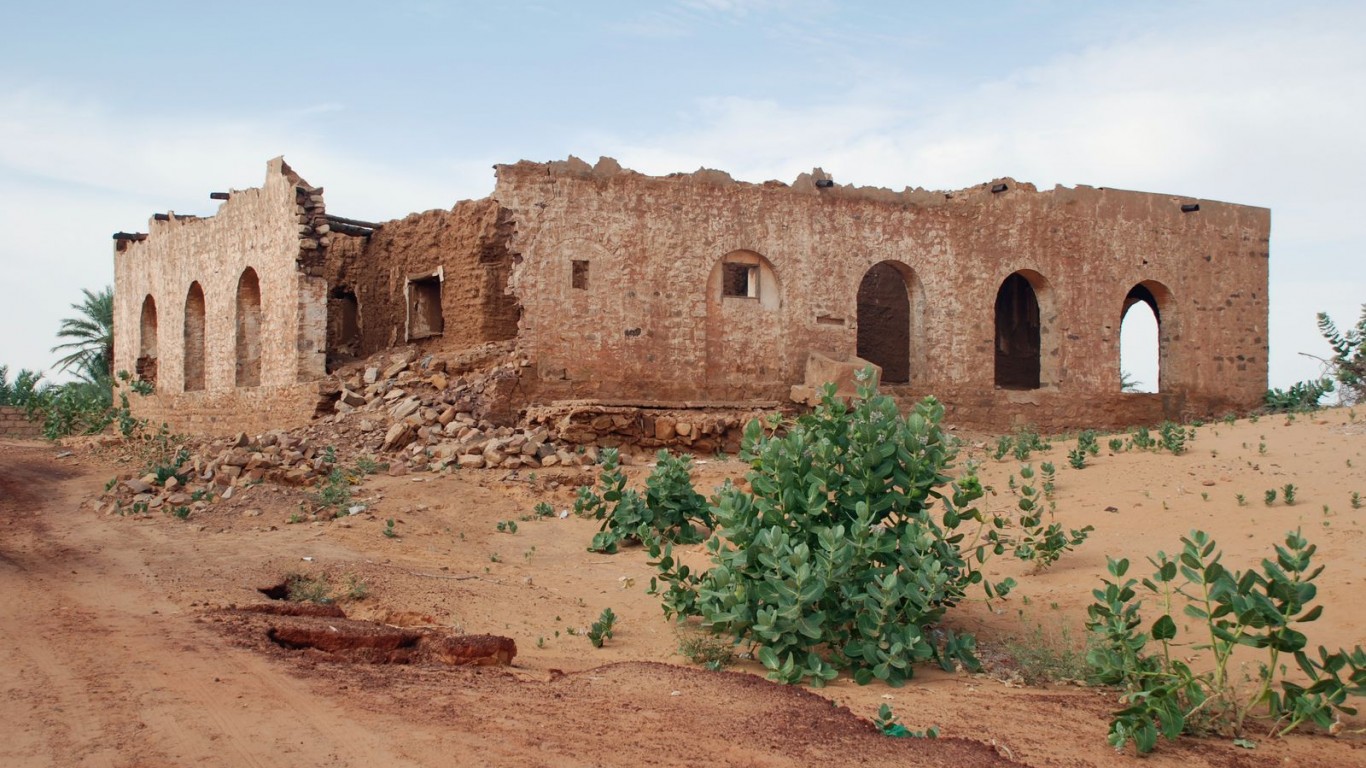
50. Tidjikja, Mauritania
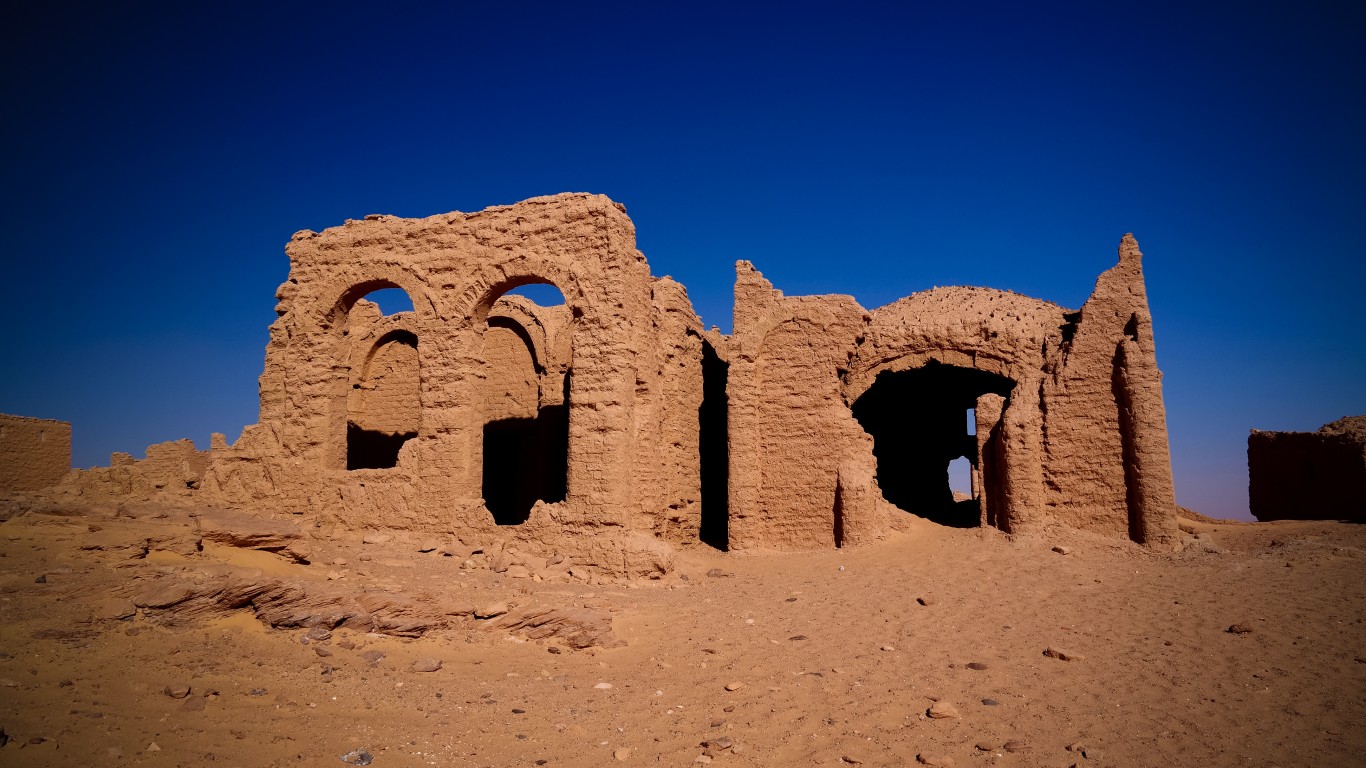
> Annual average precipitation (16 years of data): 1.2 inches
> Driest year in database: 2010, 4.6 inches
> Driest month on average: August, 2.3 inches
[in-text-ad]
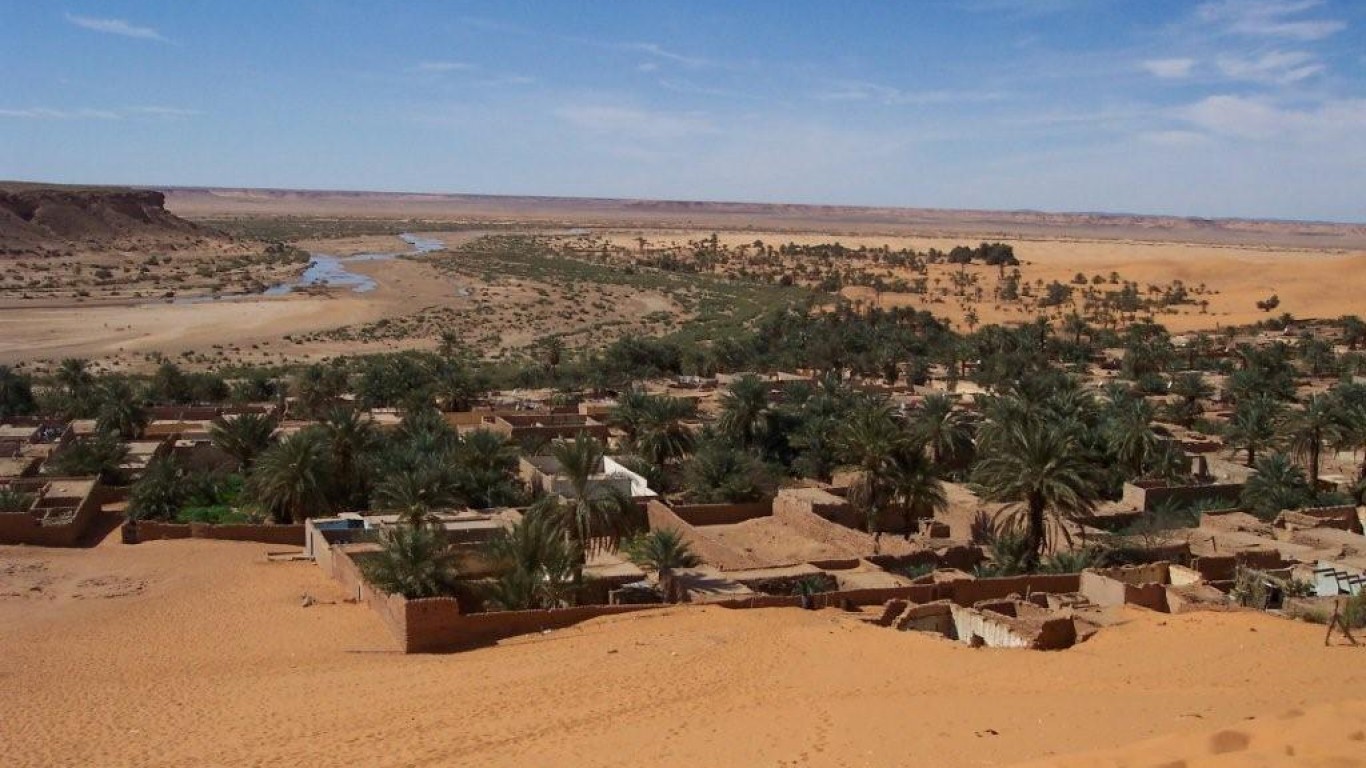
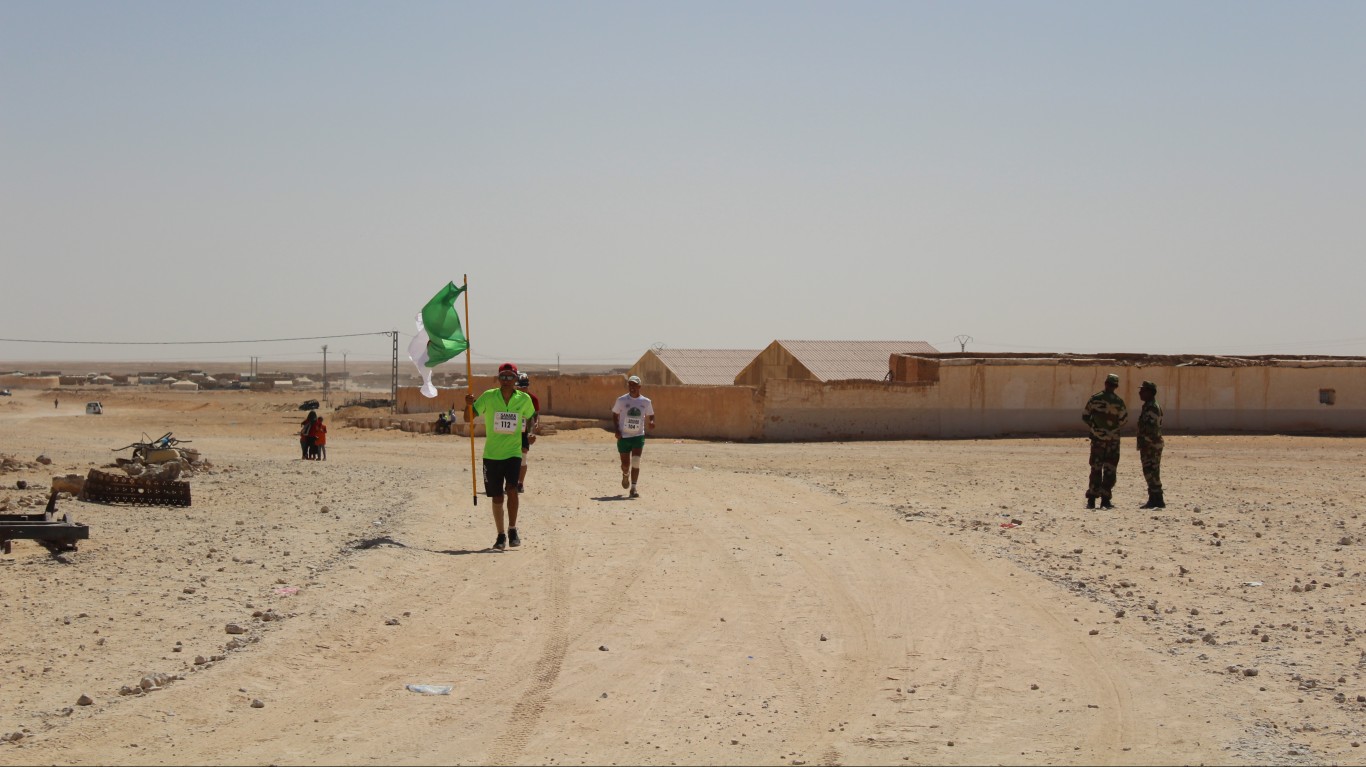
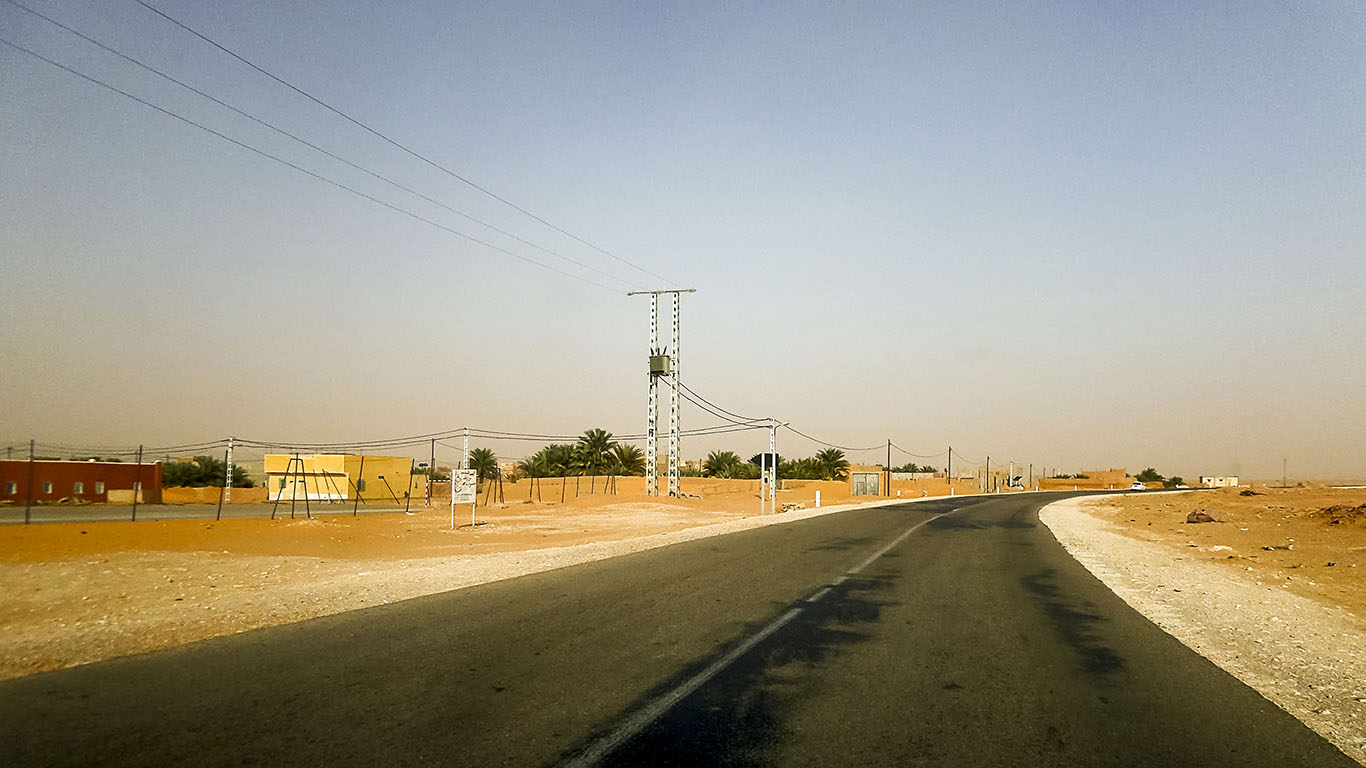
49. Béni Abbès, Algeria
> Annual average precipitation (22 years of data): 1.2 inches
> Driest year in database: 2009, 4.1 inches
> Driest month on average: October, 0.4 inches
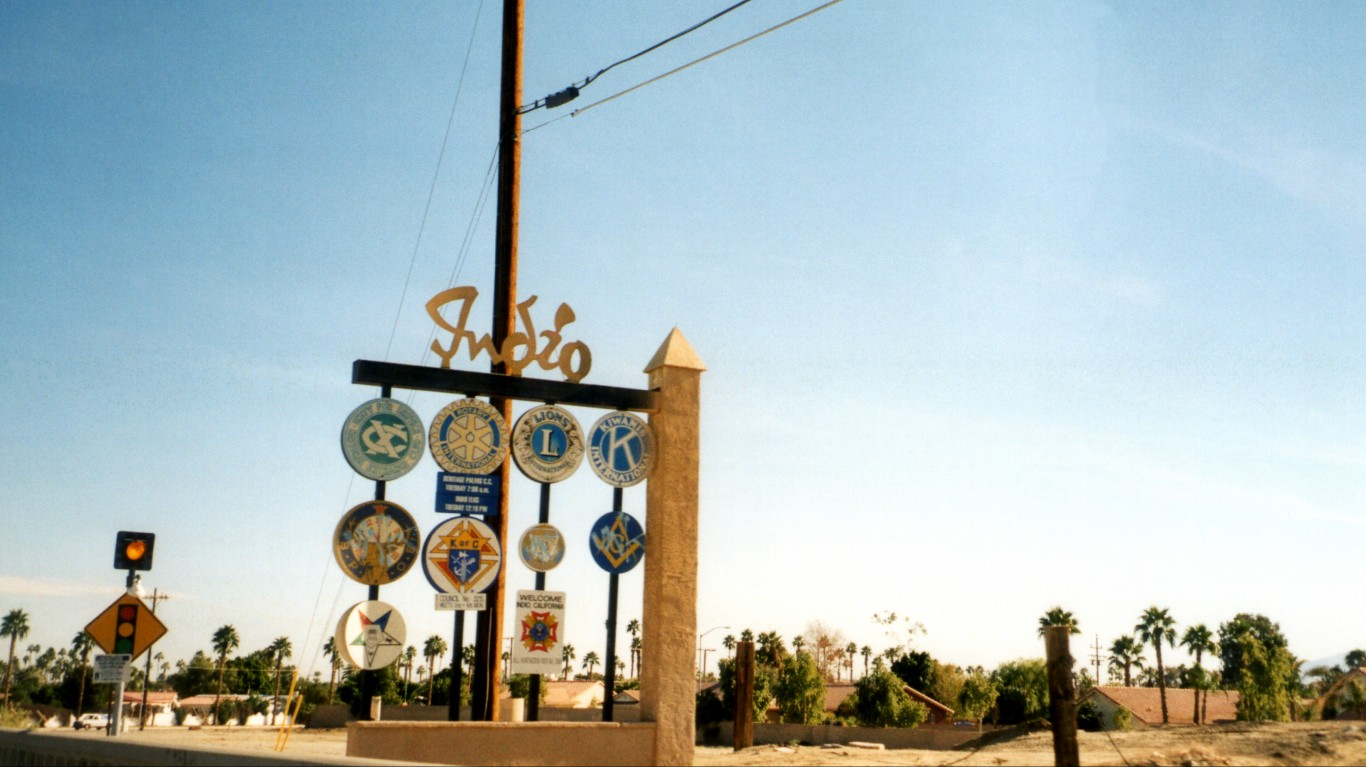
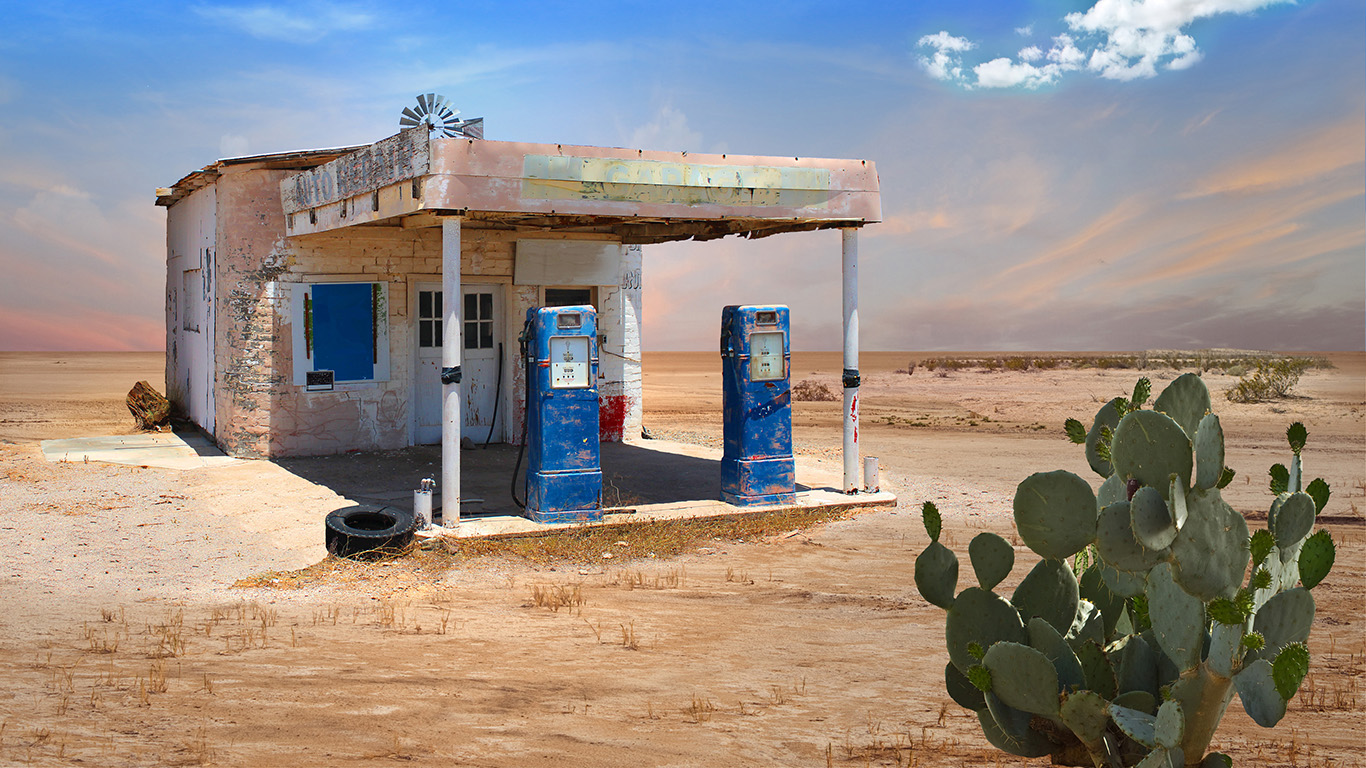
48. Indio, CA, United States Of America
> Annual average precipitation (10 years of data): 1.2 inches
> Driest year in database: 2004, 2.9 inches
> Driest month on average: December, 0.3 inches

47. Pay Menar, Afghanistan
> Annual average precipitation (5 years of data): 1.1 inches
> Driest year in database: 2016, 1.7 inches
> Driest month on average: December, 0.8 inches
[in-text-ad-2]
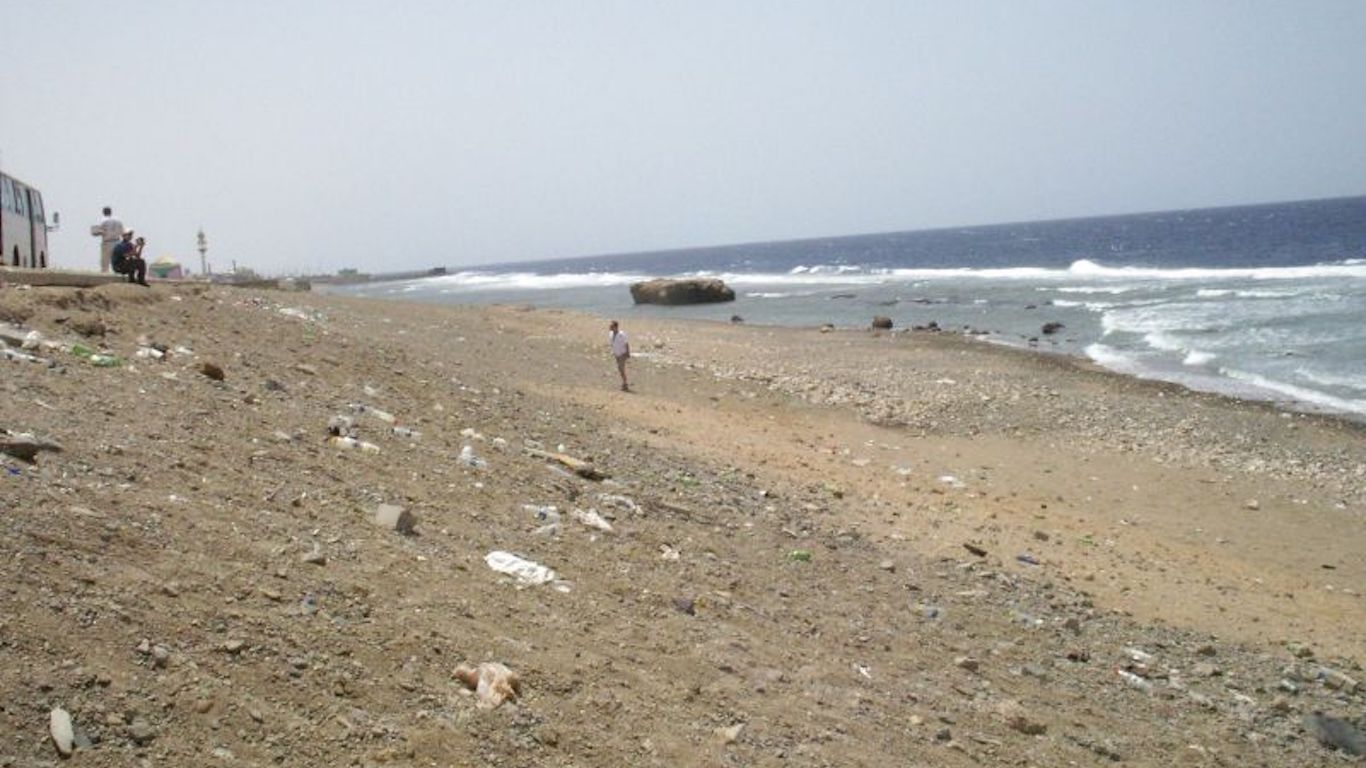
46. Al Wajh, Saudi Arabia
> Annual average precipitation (22 years of data): 1.1 inches
> Driest year in database: 2013, 3.3 inches
> Driest month on average: January, 0.4 inches

45. Fallon, NV, United States Of America
> Annual average precipitation (6 years of data): 1.0 inches
> Driest year in database: 1997, 4.5 inches
> Driest month on average: June, 1.2 inches
[in-text-ad]

44. Wake Island, United States Of America
> Annual average precipitation (11 years of data): 1.0 inches
> Driest year in database: 1997, 6.2 inches
> Driest month on average: May, 0.6 inches

43. Ruoqiang, China
> Annual average precipitation (22 years of data): 0.9 inches
> Driest year in database: 2003, 2.2 inches
> Driest month on average: June, 0.4 inches
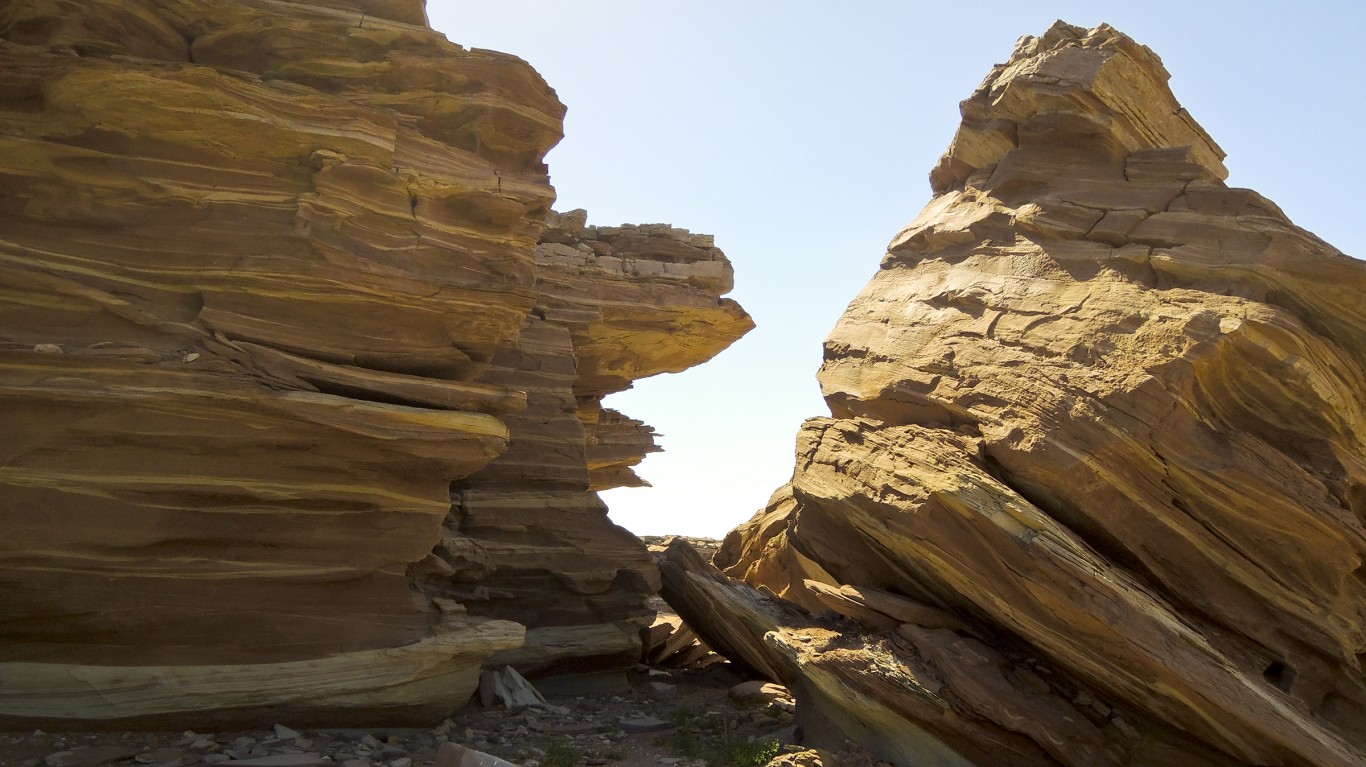
42. Tinduf, Algeria
> Annual average precipitation (8 years of data): 0.9 inches
> Driest year in database: 2003, 3.2 inches
> Driest month on average: October, 1.5 inches
[in-text-ad-2]
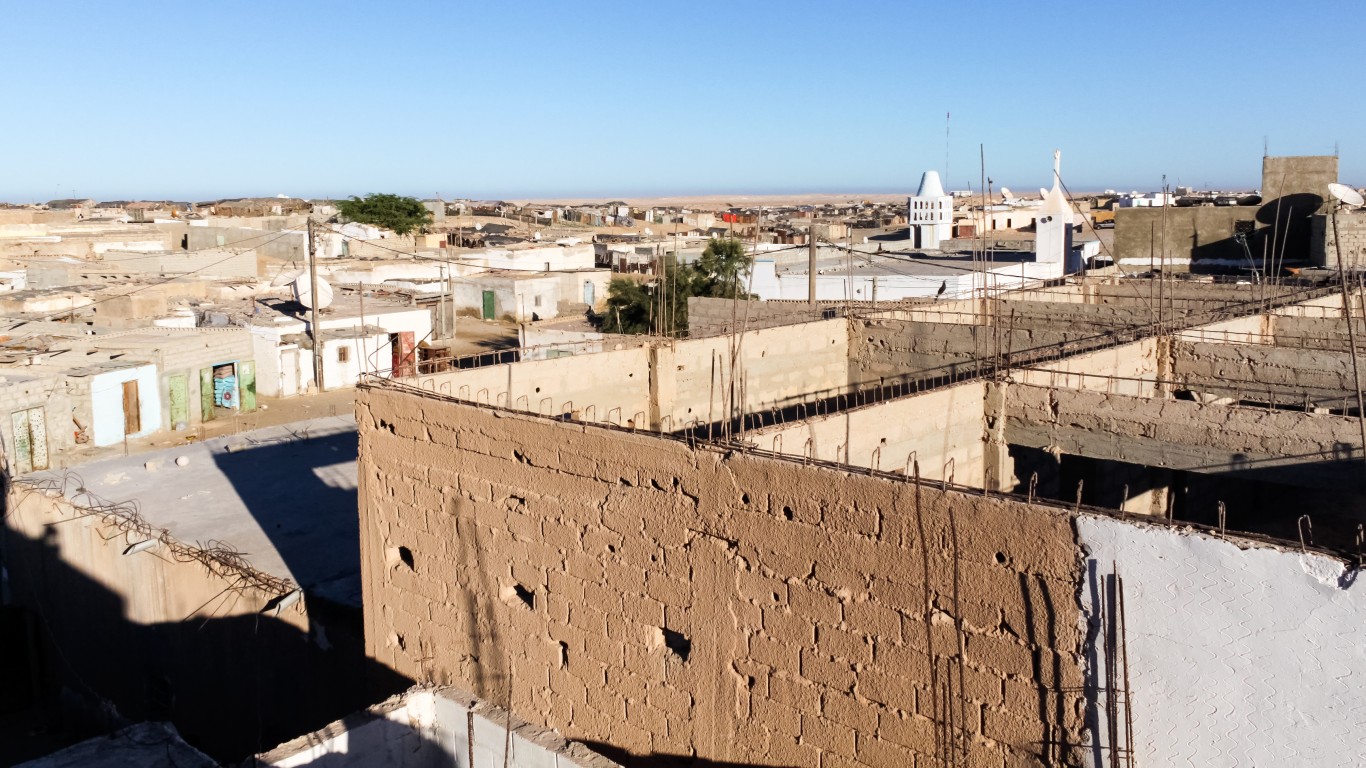
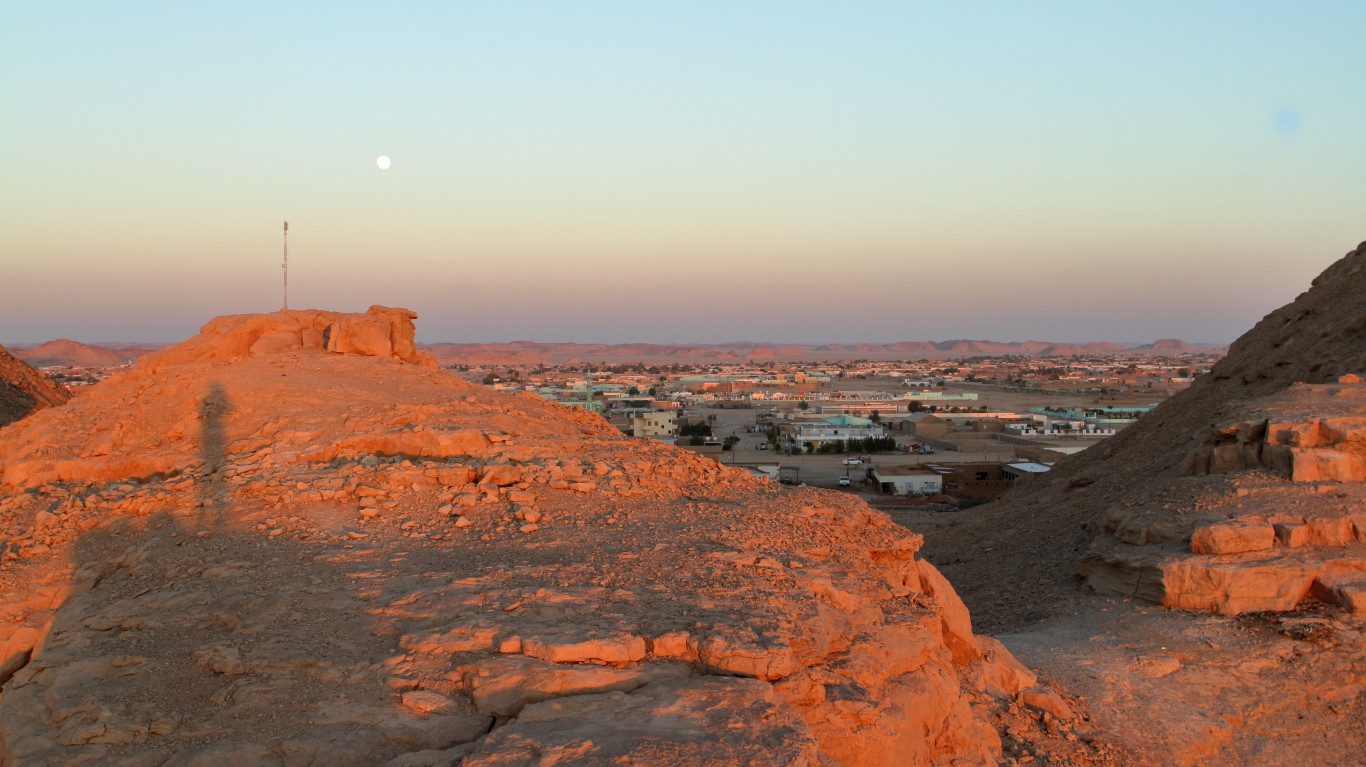
41. Atar, Mauritania
> Annual average precipitation (9 years of data): 0.9 inches
> Driest year in database: 2008, 2.1 inches
> Driest month on average: September, 1.3 inches
40. Tabuk, Saudi Arabia
> Annual average precipitation (22 years of data): 0.9 inches
> Driest year in database: 2015, 2.2 inches
> Driest month on average: January, 0.4 inches
[in-text-ad]

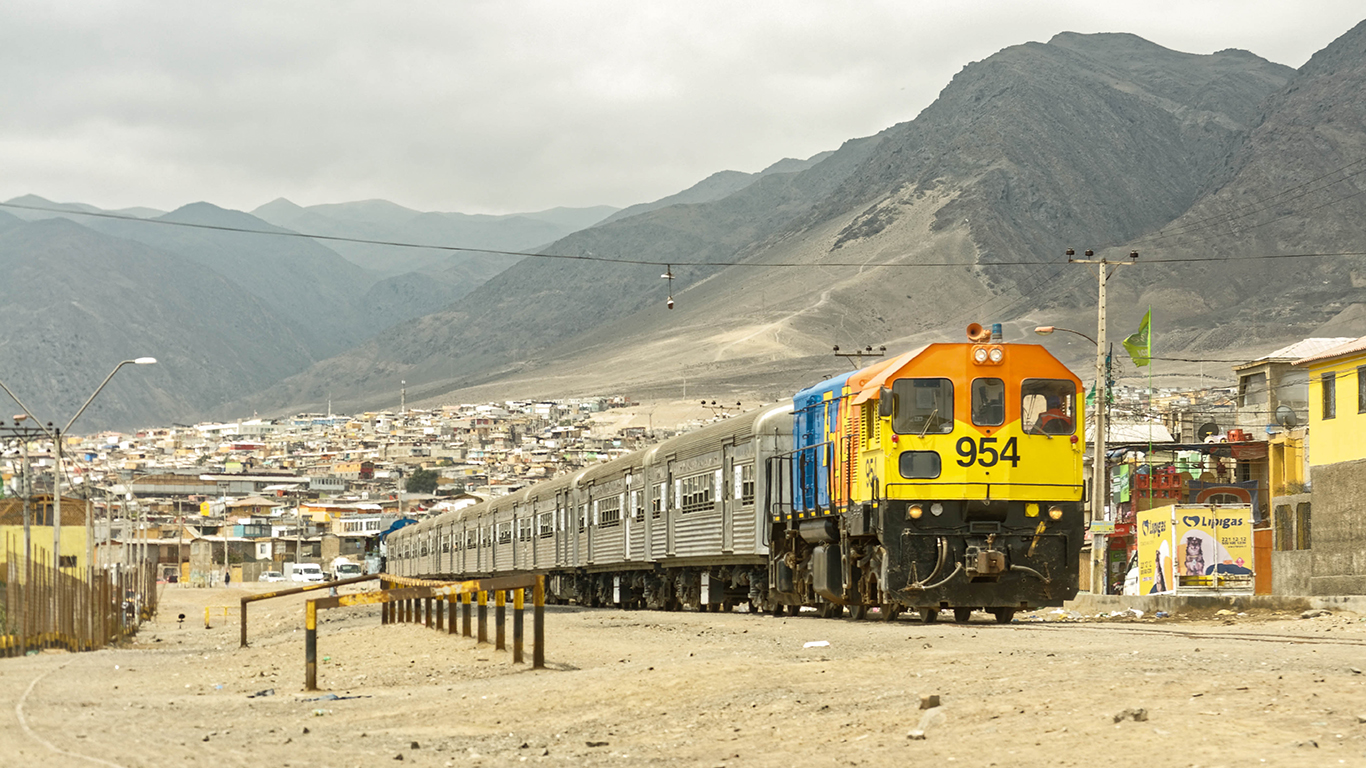
39. Copiapó, Chile
> Annual average precipitation (10 years of data): 0.9 inches
> Driest year in database: 2004, 3.0 inches
> Driest month on average: June, 0.5 inches
 24/7 Wall St.
38. Illizi, Algeria
> Annual average precipitation (8 years of data): 0.9 inches
> Driest year in database: 2000, 2.4 inches
> Driest month on average: October, 0.2 inches

37. Concordia Station, Antarctica
> Annual average precipitation (22 years of data): 0.9 inches
> Driest year in database: 2018, 2.5 inches
> Driest month on average: April, 0.1 inches
[in-text-ad-2]

36. Ouargla, Algeria
> Annual average precipitation (8 years of data): 0.9 inches
> Driest year in database: 2000, 1.5 inches
> Driest month on average: October, 0.3 inches
35. Masirah Island, Oman
> Annual average precipitation (22 years of data): 0.8 inches
> Driest year in database: 1997, 4.6 inches
> Driest month on average: November, 0.2 inches
[in-text-ad]
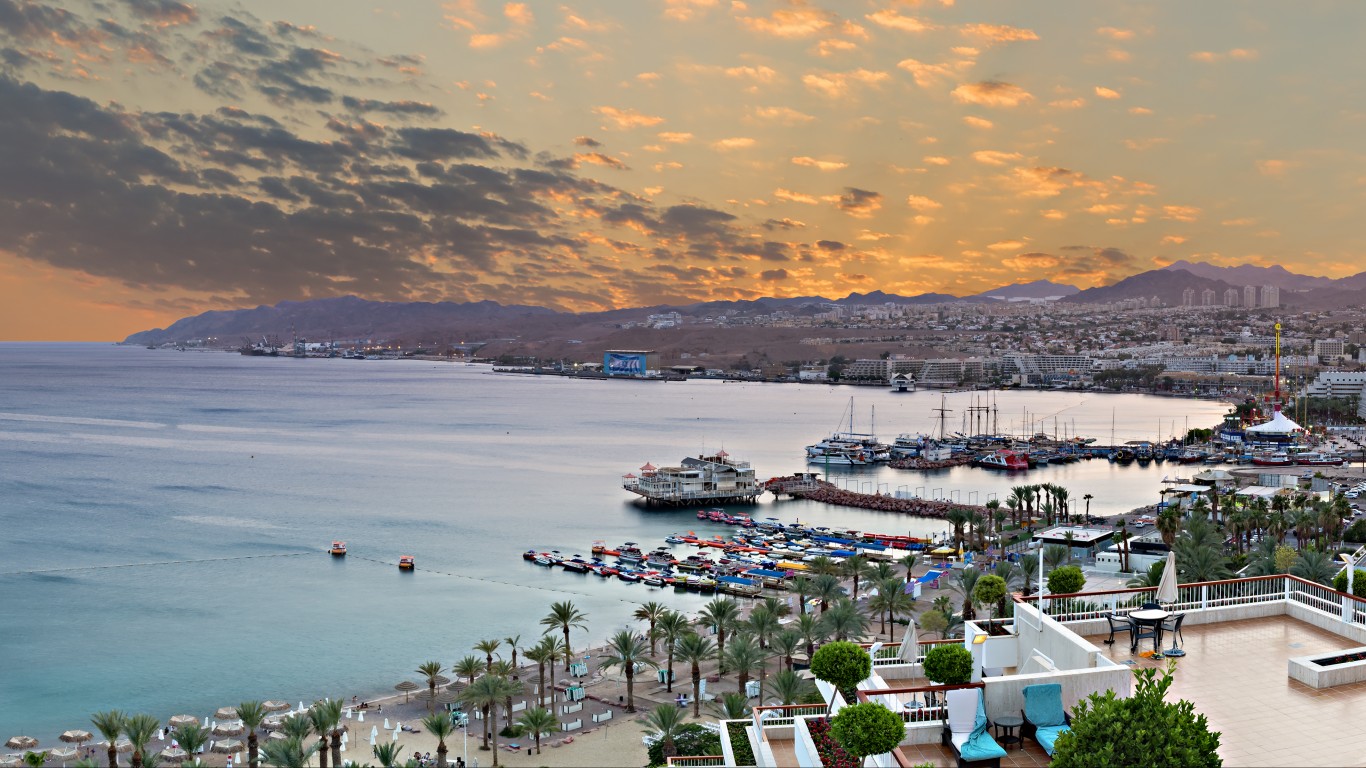
34. Aqaba, Israel
> Annual average precipitation (22 years of data): 0.7 inches
> Driest year in database: 2018, 1.7 inches
> Driest month on average: February, 0.2 inches
 24/7 Wall St.
33. Chiclayo, Peru
> Annual average precipitation (20 years of data): 0.7 inches
> Driest year in database: 2008, 2.1 inches
> Driest month on average: March, 0.4 inches

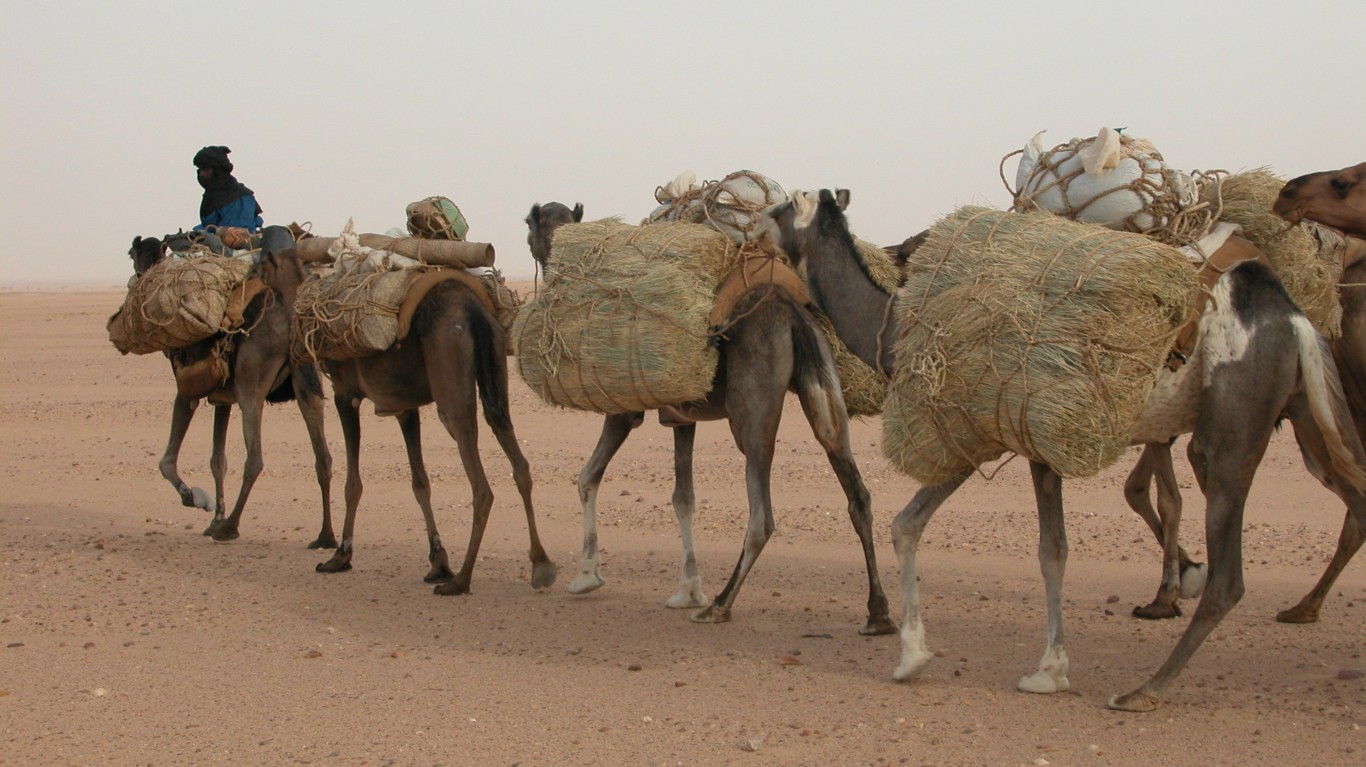
32. Bir Moghrein, Mauritania
> Annual average precipitation (5 years of data): 0.7 inches
> Driest year in database: 2003, 2.2 inches
> Driest month on average: October, 2.1 inches
[in-text-ad-2]

31. In Amenas, Algeria
> Annual average precipitation (22 years of data): 0.7 inches
> Driest year in database: 2005, 3.0 inches
> Driest month on average: October, 0.2 inches
30. Dakhla, Western Sahara (Morocco)
> Annual average precipitation (22 years of data): 0.7 inches
> Driest year in database: 2005, 2.3 inches
> Driest month on average: September, 0.4 inches
[in-text-ad]
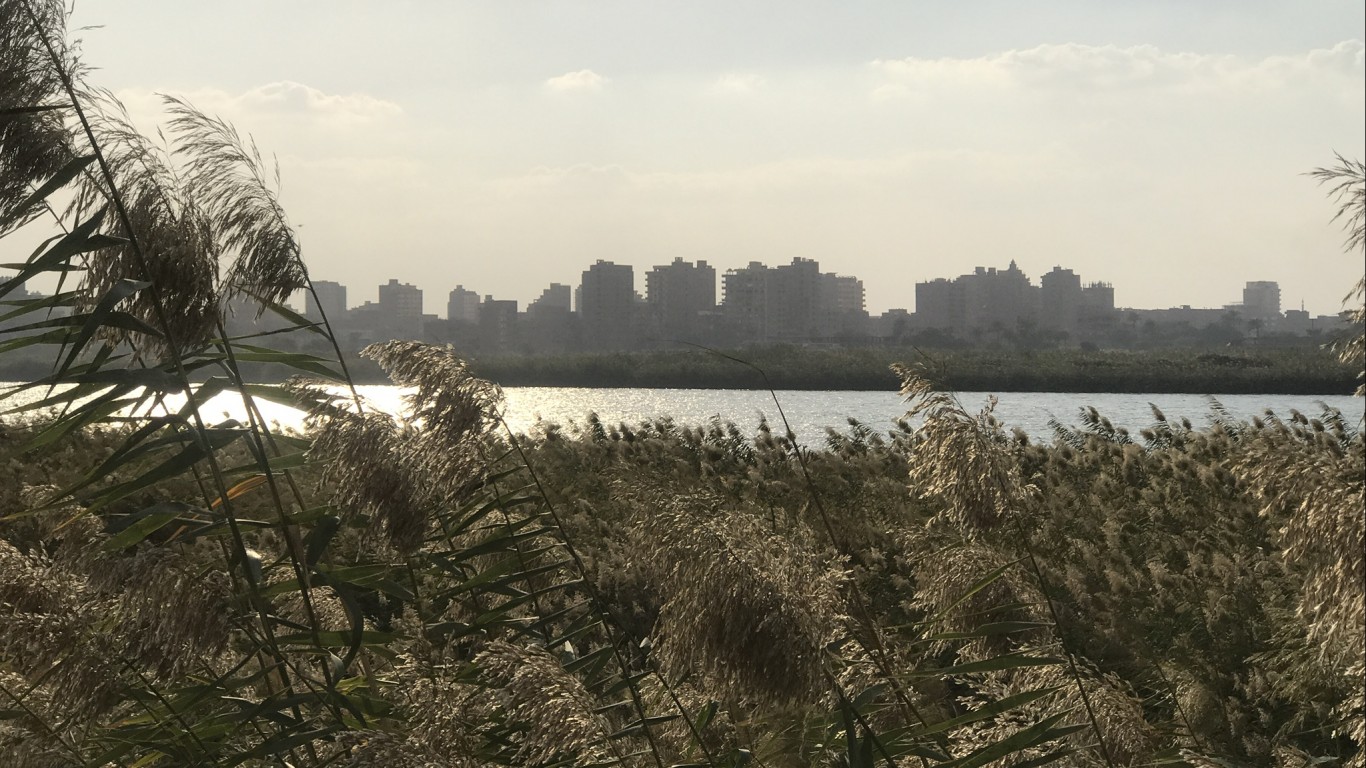
29. Helwan, Egypt
> Annual average precipitation (8 years of data): 0.7 inches
> Driest year in database: 1998, 1.3 inches
> Driest month on average: February, 0.2 inches
 24/7 Wall St.
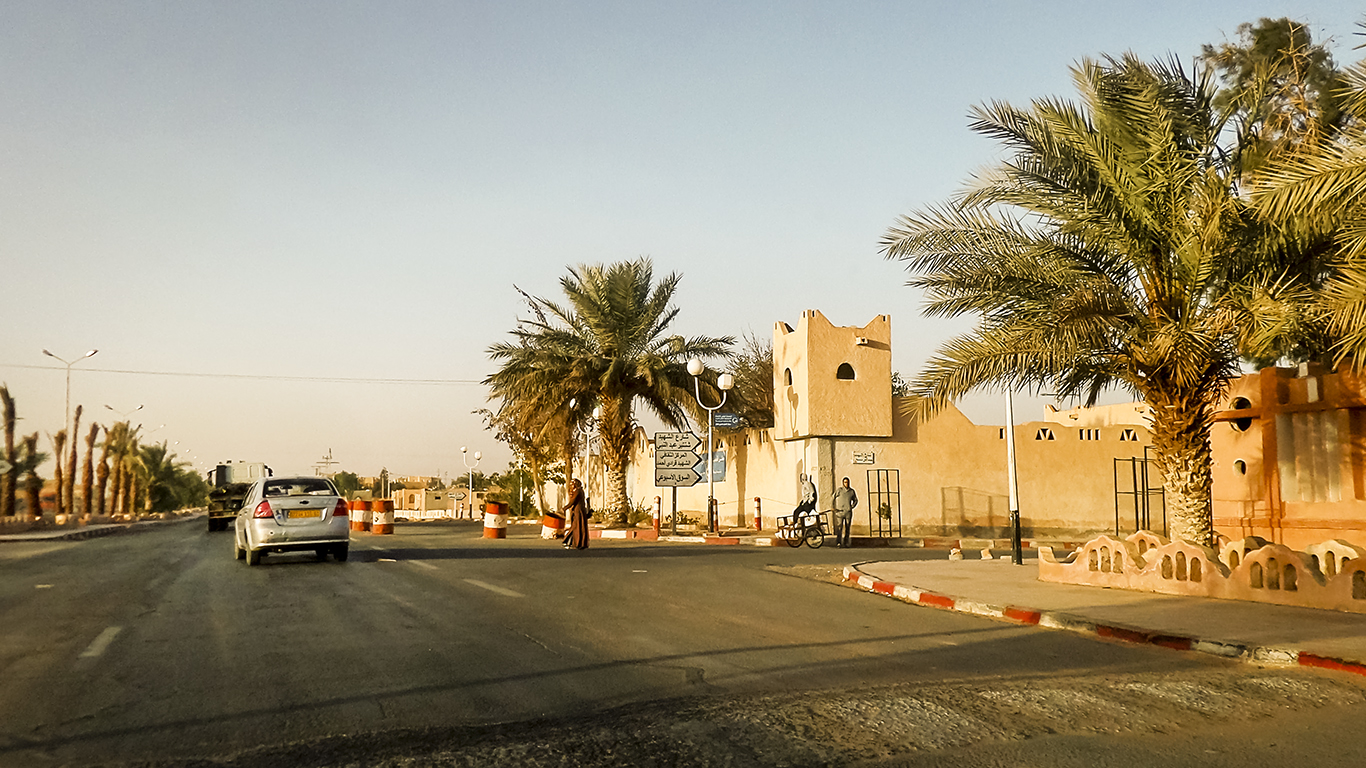
28. Hassi Fehal, Algeria
> Annual average precipitation (8 years of data): 0.7 inches
> Driest year in database: 2003, 1.4 inches
> Driest month on average: March, 0.2 inches
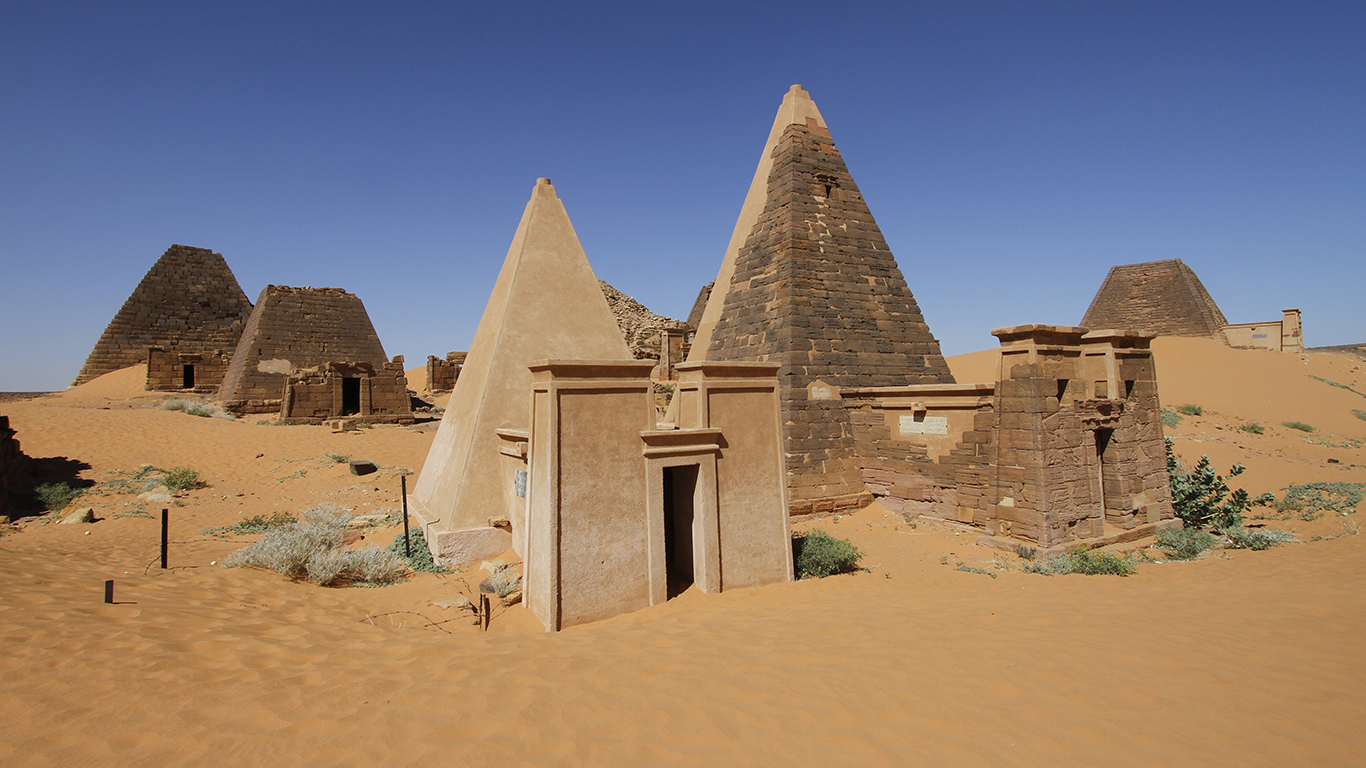
27. Merowe, Sudan
> Annual average precipitation (22 years of data): 0.6 inches
> Driest year in database: 2007, 3.1 inches
> Driest month on average: August, 0.4 inches
[in-text-ad-2]
26. Adrar, Algeria
> Annual average precipitation (22 years of data): 0.5 inches
> Driest year in database: 1999, 2.1 inches
> Driest month on average: September, 0.1 inches

25. Palmeira, Cape Verde
> Annual average precipitation (11 years of data): 0.5 inches
> Driest year in database: 2016, 4.6 inches
> Driest month on average: September, 2.0 inches
[in-text-ad]

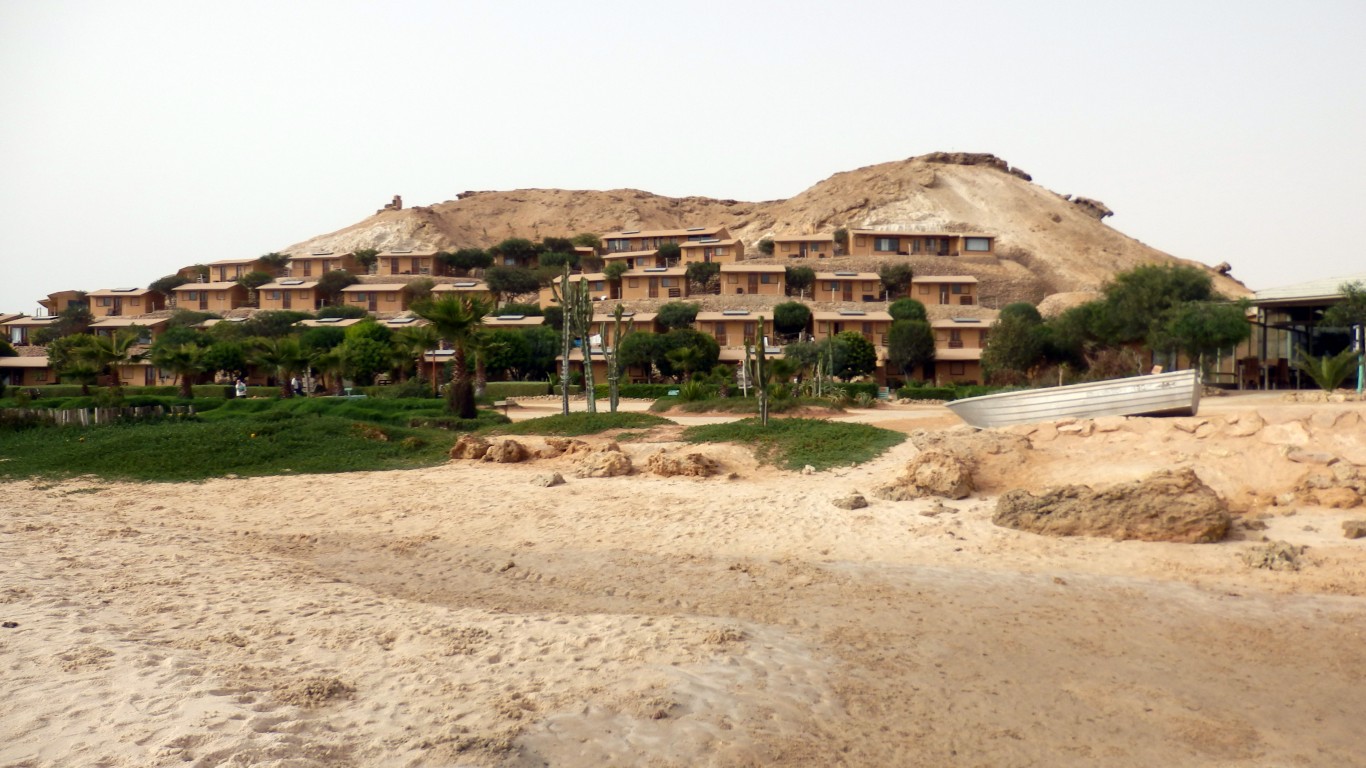
24. Thumrait, Oman
> Annual average precipitation (22 years of data): 0.5 inches
> Driest year in database: 2018, 3.6 inches
> Driest month on average: May, 0.2 inches
 24/7 Wall St.
23. Djanet, Algeria
> Annual average precipitation (22 years of data): 0.5 inches
> Driest year in database: 2005, 2.4 inches
> Driest month on average: June, 0.1 inches
22. Azekkour, Algeria
> Annual average precipitation (22 years of data): 0.5 inches
> Driest year in database: 2008, 1.4 inches
> Driest month on average: October, 0.2 inches
[in-text-ad-2]

21. Waddan, Libya
> Annual average precipitation (17 years of data): 0.5 inches
> Driest year in database: 2013, 1.6 inches
> Driest month on average: April, 0.2 inches
20. Nouadhibou, Mauritania
> Annual average precipitation (22 years of data): 0.4 inches
> Driest year in database: 2010, 3.7 inches
> Driest month on average: October, 0.4 inches
[in-text-ad]

19. Ain Salah, Algeria
> Annual average precipitation (22 years of data): 0.4 inches
> Driest year in database: 1999, 1.3 inches
> Driest month on average: January, 0.1 inches

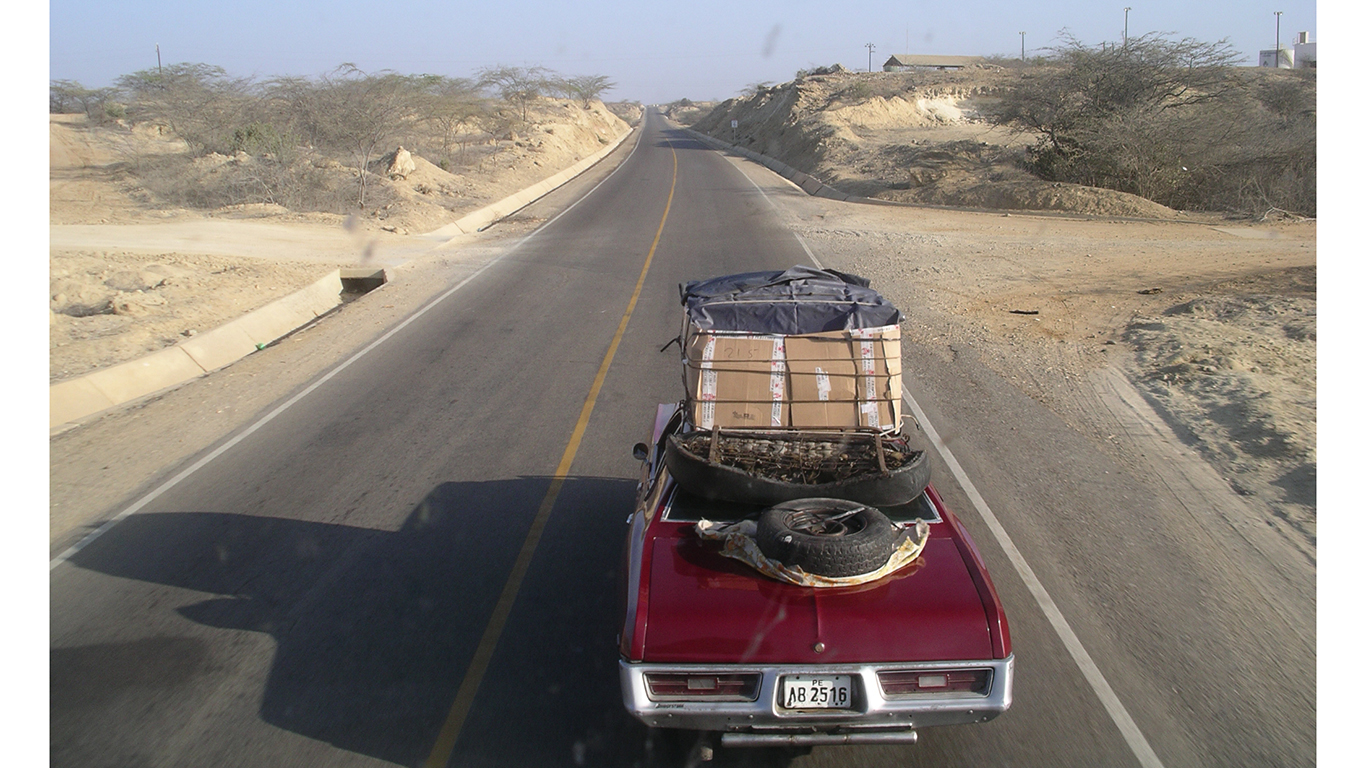
18. Trujillo, Peru
> Annual average precipitation (20 years of data): 0.4 inches
> Driest year in database: 2003, 1.2 inches
> Driest month on average: February, 0.2 inches

17. Nawabshah, Pakistan
> Annual average precipitation (5 years of data): 0.4 inches
> Driest year in database: 2003, 1.6 inches
> Driest month on average: August, 0.7 inches
[in-text-ad-2]
16. Bilma, Niger
> Annual average precipitation (22 years of data): 0.3 inches
> Driest year in database: 2004, 1.2 inches
> Driest month on average: August, 0.2 inches

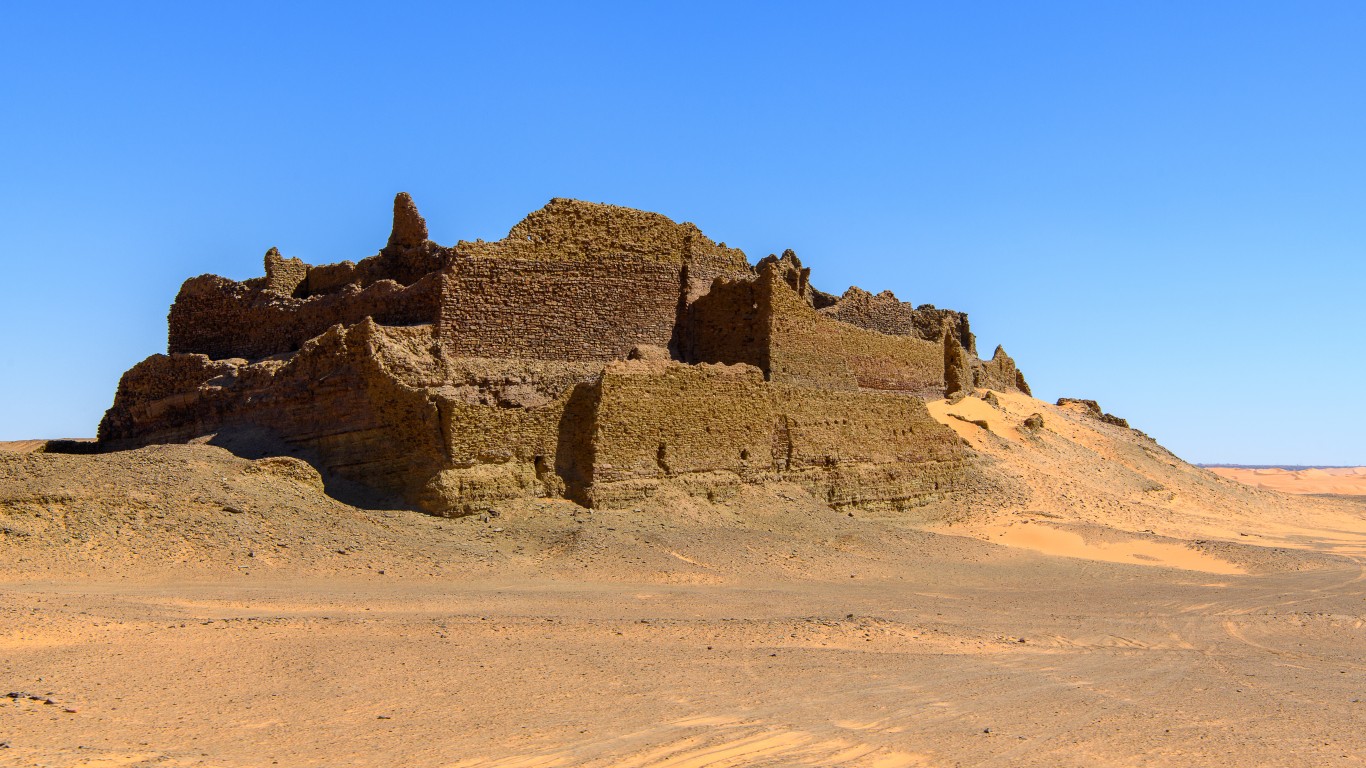
15. Abu Hamad, Sudan
> Annual average precipitation (22 years of data): 0.3 inches
> Driest year in database: 2007, 1.5 inches
> Driest month on average: August, 0.2 inches
[in-text-ad]
14. Talara, Peru
> Annual average precipitation (5 years of data): 0.3 inches
> Driest year in database: 1999, 0.8 inches
> Driest month on average: March, 0.6 inches

13. Dongola, Sudan
> Annual average precipitation (22 years of data): 0.3 inches
> Driest year in database: 2014, 1.3 inches
> Driest month on average: July, 0.2 inches
12. SabhÄ, Libya
> Annual average precipitation (18 years of data): 0.2 inches
> Driest year in database: 2013, 0.7 inches
> Driest month on average: January, 0.1 inches
[in-text-ad-2]
11. La Chimba, Chile
> Annual average precipitation (22 years of data): 0.2 inches
> Driest year in database: 2017, 2.0 inches
> Driest month on average: March, 0.1 inches
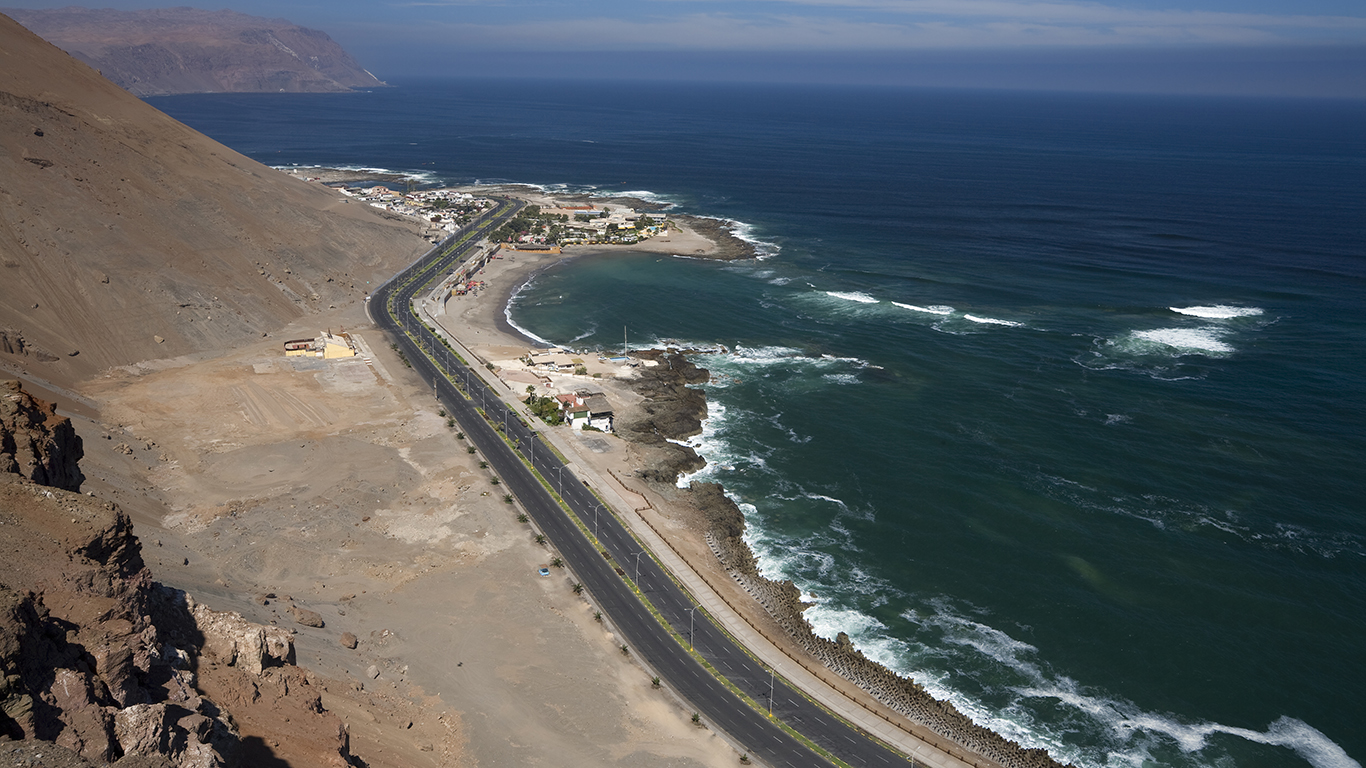
10. Arica, Chile
> Annual average precipitation (22 years of data): 0.1 inches
> Driest year in database: 2017, 1.3 inches
> Driest month on average: March, 0.1 inches
[in-text-ad]
9. Nok Kundi, Pakistan
> Annual average precipitation (5 years of data): 0.1 inches
> Driest year in database: 2003, 0.3 inches
> Driest month on average: January, 0.2 inches
 24/7 Wall St.
8. Aswan, Egypt
> Annual average precipitation (22 years of data): 0.1 inches
> Driest year in database: 2014, 0.7 inches
> Driest month on average: March, <0.0 inches
7. Kharga Oasis, Egypt
> Annual average precipitation (7 years of data): 0.1 inches
> Driest year in database: 1999, 0.2 inches
> Driest month on average: January, <0.0 inches
[in-text-ad-2]

6. Siwa Oasis, Egypt
> Annual average precipitation (6 years of data): <0.0 inches
> Driest year in database: 2001, 0.1 inches
> Driest month on average: February, <0.0 inches
5. Wadi Halfa, Sudan
> Annual average precipitation (22 years of data): <0.0 inches
> Driest year in database: 2010, 0.2 inches
> Driest month on average: August, <0.0 inches
[in-text-ad]

4. Pisco, Peru
> Annual average precipitation (19 years of data): <0.0 inches
> Driest year in database: 2011, 0.1 inches
> Driest month on average: January, <0.0 inches
 24/7 Wall St.
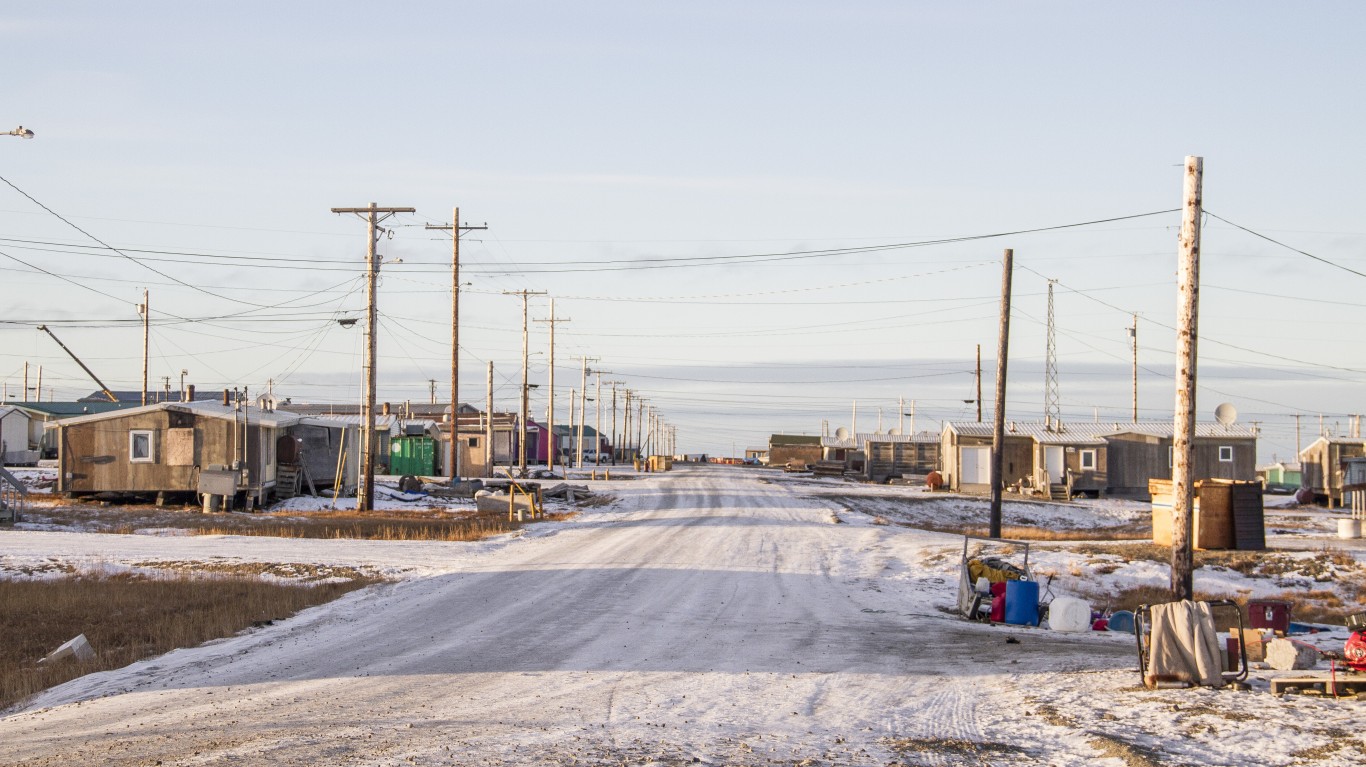
3. Kaktovik, AK, United States Of America
> Annual average precipitation (5 years of data): <0.0 inches
> Driest year in database: 1998, <0.0 inches
> Driest month on average: June, <0.0 inches
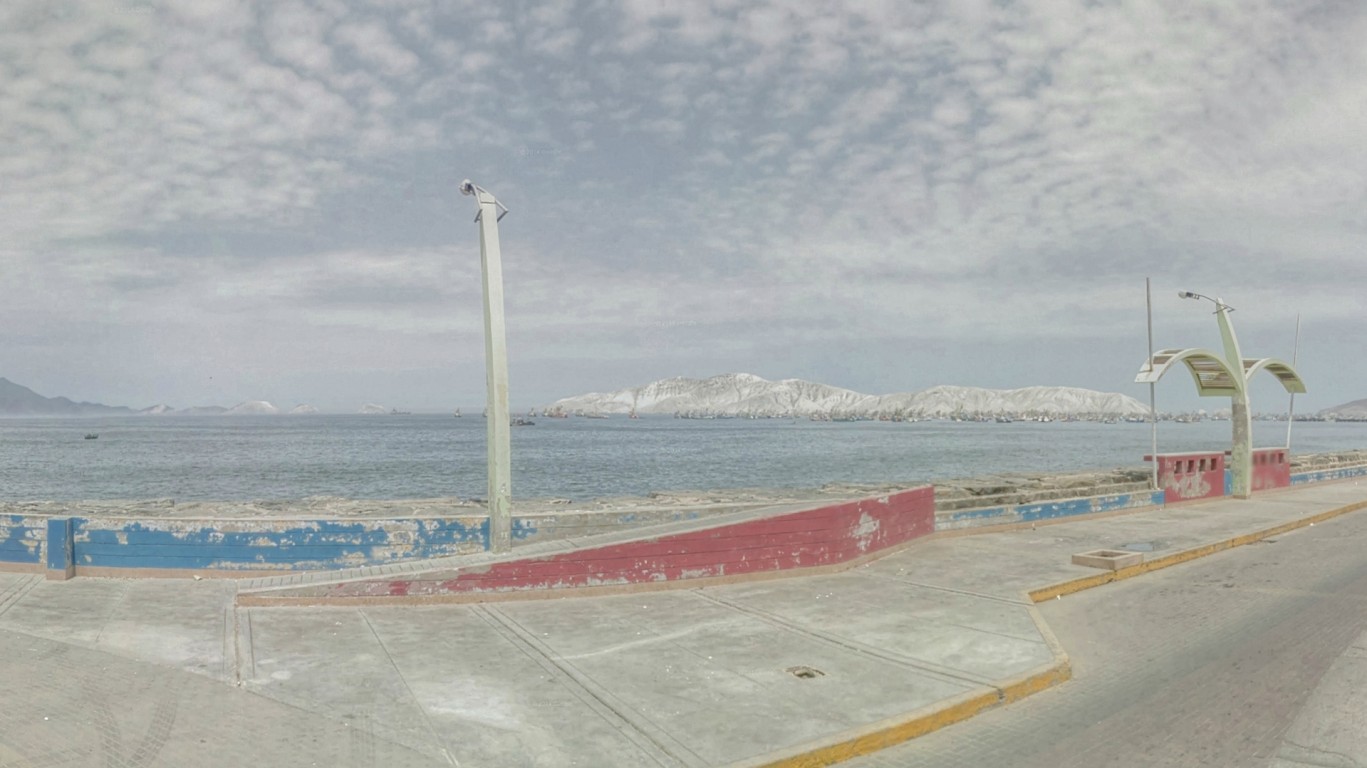
2. Chimbote, Peru
> Annual average precipitation (5 years of data): <0.0 inches
> Driest year in database: 1997, <0.0 inches
> Driest month on average: October, <0.0 inches
[in-text-ad-2]
1. Al Jawf, Libya
> Annual average precipitation (12 years of data): <0.0 inches
> Driest year in database: 1997, 0.1 inches
> Driest month on average: October, <0.0 inches
Get Ready To Retire (Sponsored)
Start by taking a quick retirement quiz from SmartAsset that will match you with up to 3 financial advisors that serve your area and beyond in 5 minutes, or less.
Each advisor has been vetted by SmartAsset and is held to a fiduciary standard to act in your best interests.
Here’s how it works:
1. Answer SmartAsset advisor match quiz
2. Review your pre-screened matches at your leisure. Check out the advisors’ profiles.
3. Speak with advisors at no cost to you. Have an introductory call on the phone or introduction in person and choose whom to work with in the future
Thank you for reading! Have some feedback for us?
Contact the 24/7 Wall St. editorial team.