
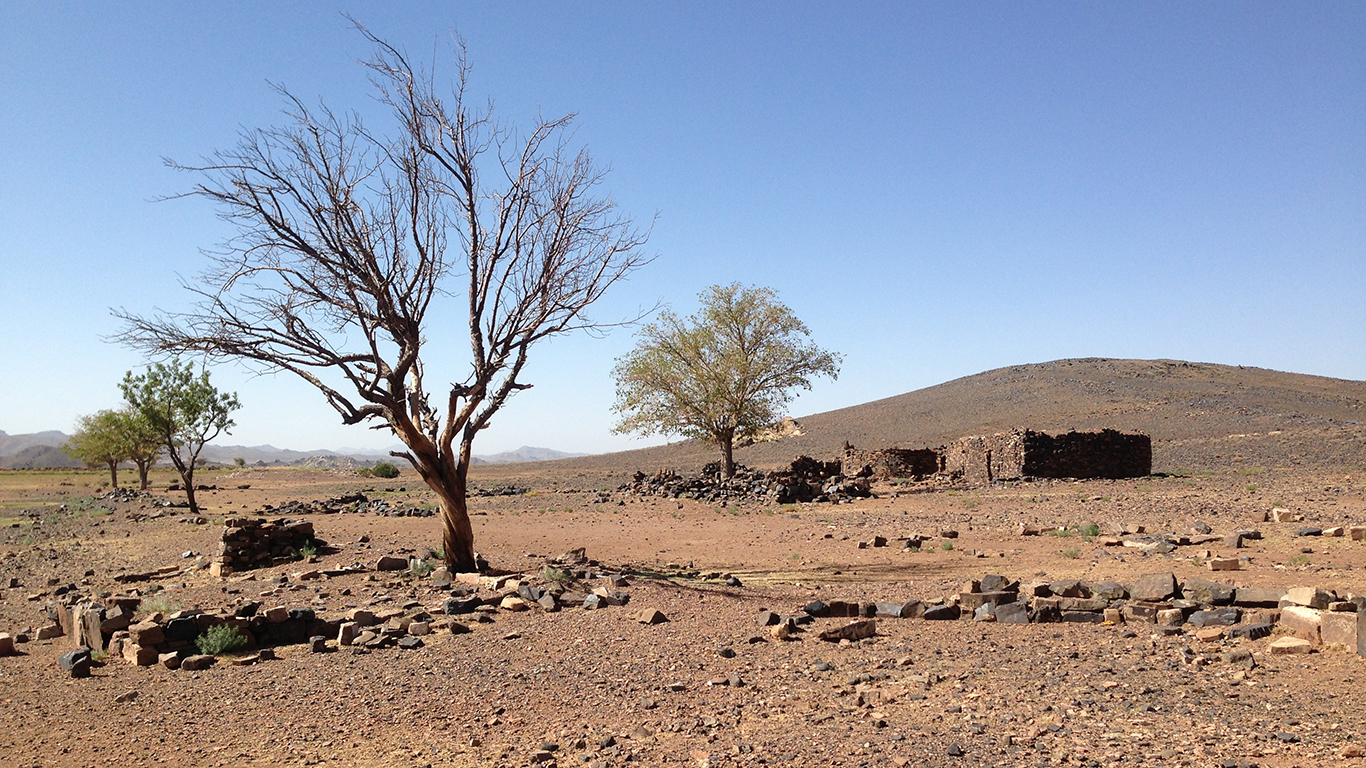
From the frozen landscapes of Antarctica to the scorching deserts of Africa to the often drought-stricken regions of North America, areas that get little to no rainfall tend to have harsh environments.
To identify the driest places on Earth, 24/7 Wall St. reviewed average annual rainfall recorded by weather stations around the world and compiled by the Global Historical Climatology Network, a program of the National Centers for Environmental Information (NCEI).
We calculated the average annual rainfall from precipitation in the years 1997 through 2018. Weather stations that did not have at least five years of data available between 1997 and 2018 were not considered.
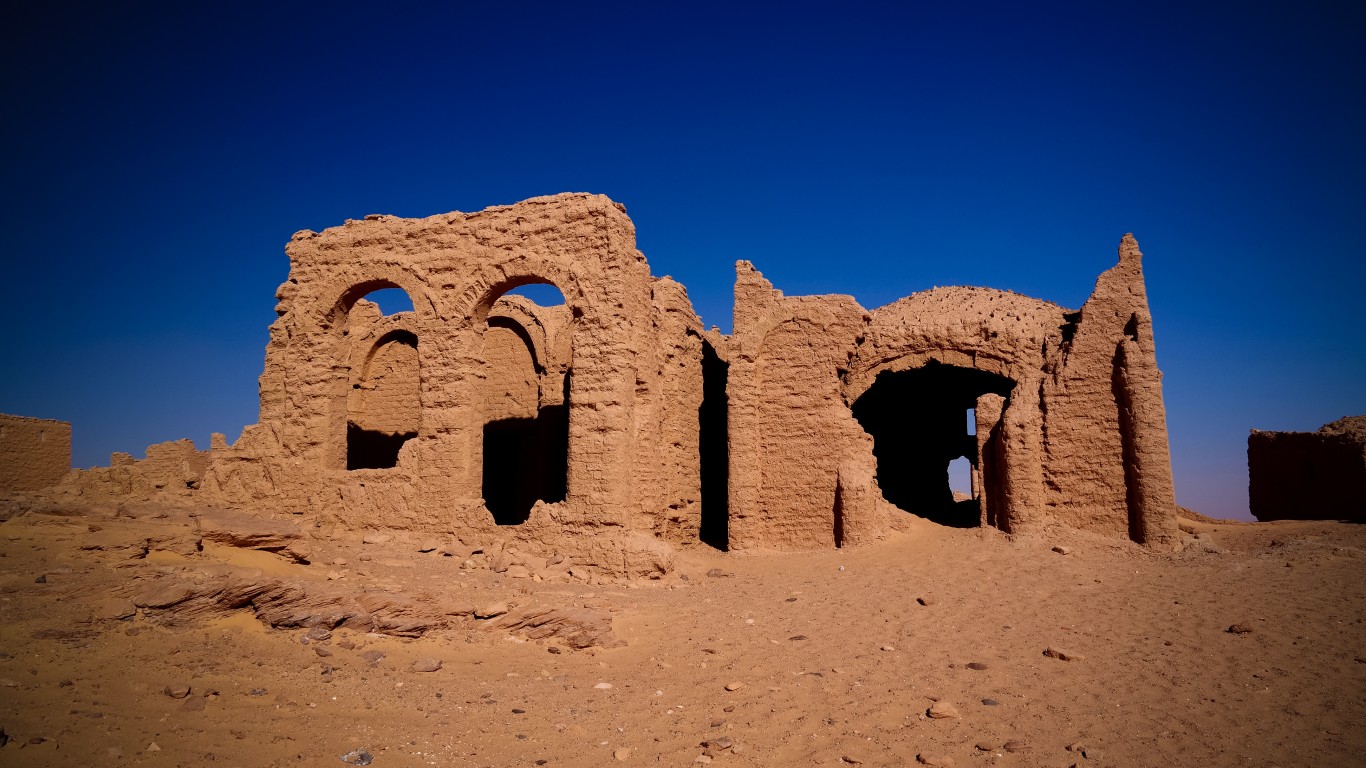
While many such hostile regions of the planet are barren of all life, many have been inhabited for millennia.
Most of these places are in Algeria, Egypt, and other countries along the southern coast of the Mediterranean. Six of the 50 driest places on Earth receive an average of less than 1 inch of rain each year.
Click here to see the driest places on Earth.
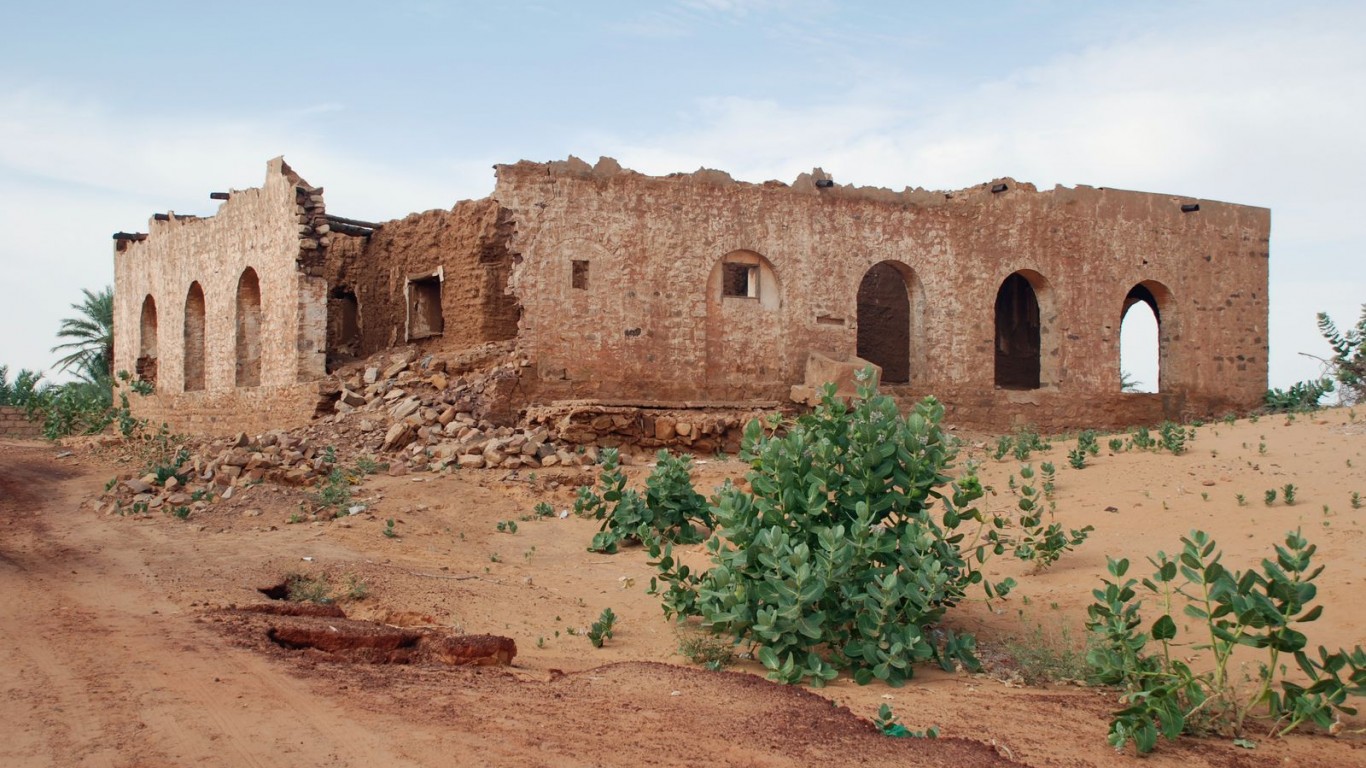
50. Tidjikja, Mauritania
> Annual average precipitation (16 years of data): 1.2 inches
> Driest year in database: 2010, 4.6 inches
> Driest month on average: August, 2.3 inches
[in-text-ad]
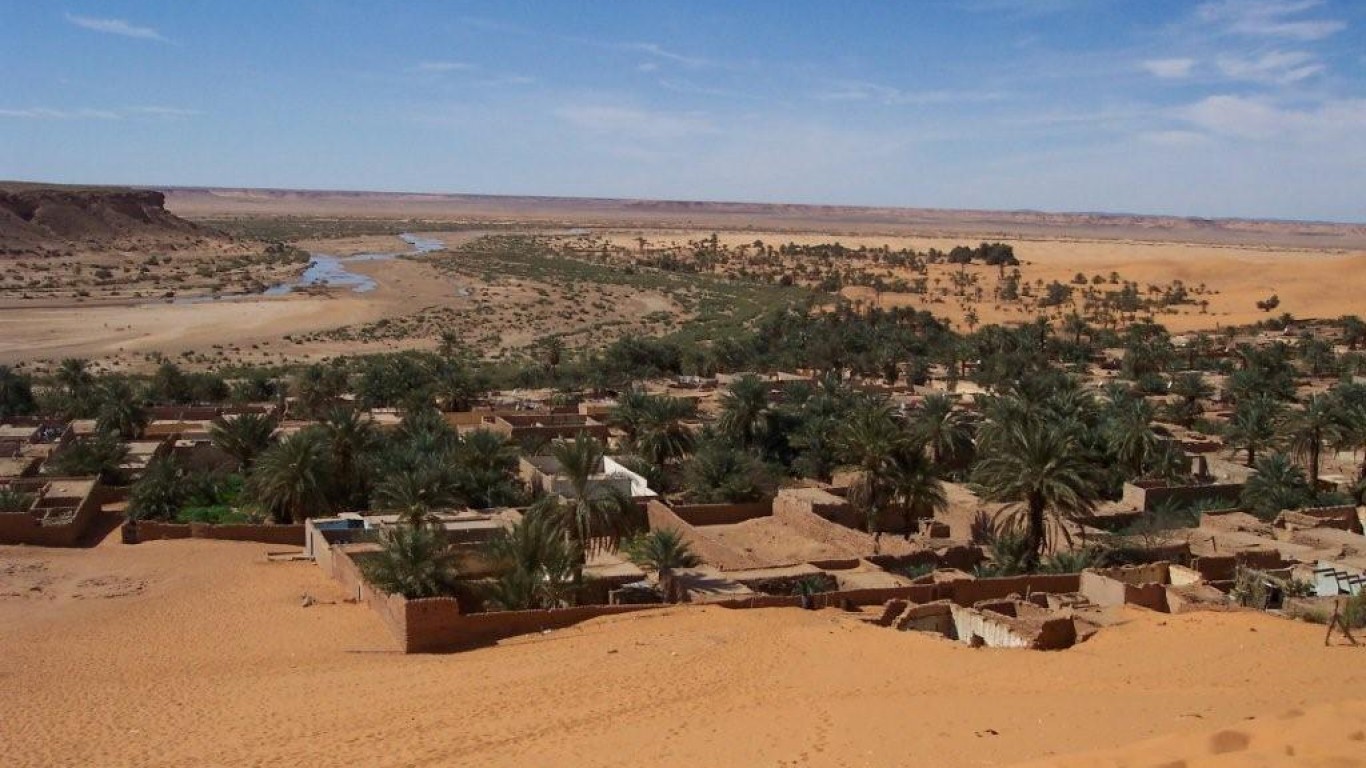
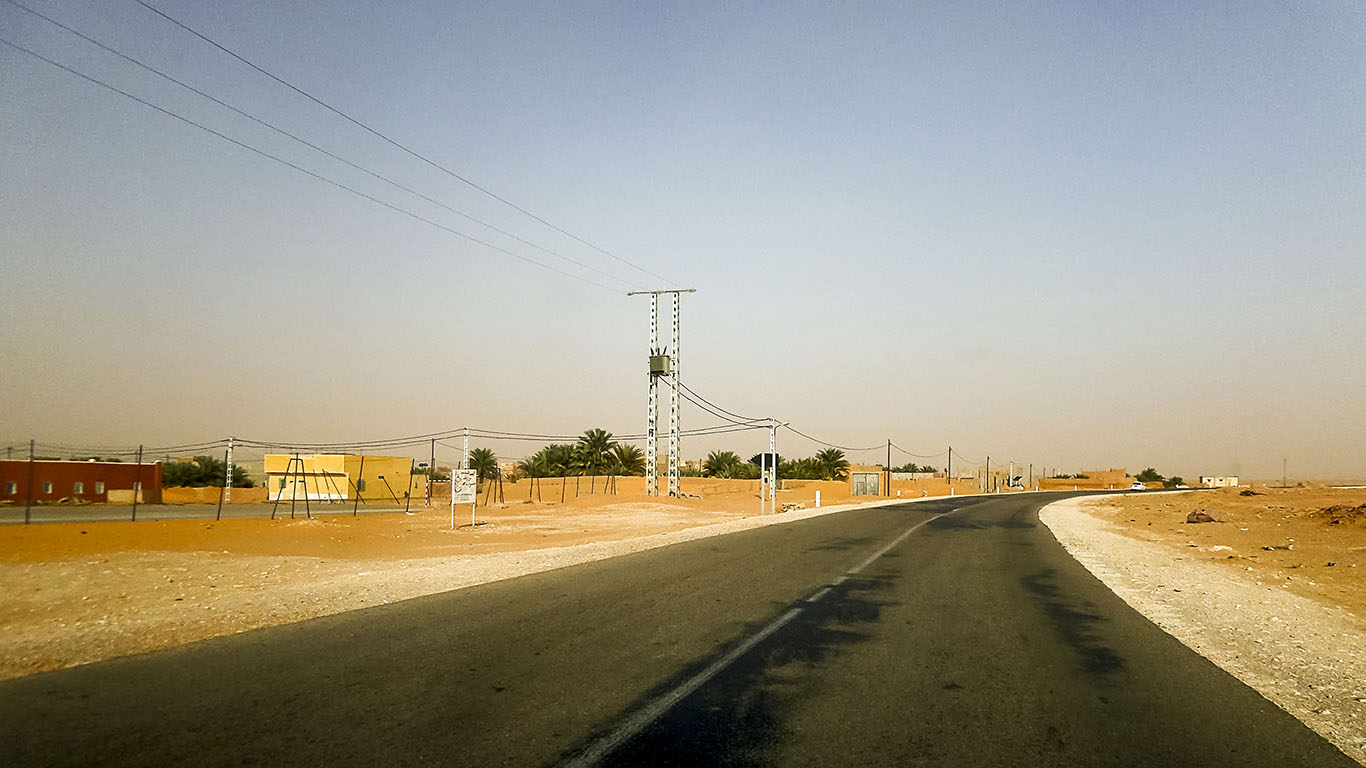
49. Béni Abbès, Algeria
> Annual average precipitation (22 years of data): 1.2 inches
> Driest year in database: 2009, 4.1 inches
> Driest month on average: October, 0.4 inches

48. Indio, CA, United States Of America
> Annual average precipitation (10 years of data): 1.2 inches
> Driest year in database: 2004, 2.9 inches
> Driest month on average: December, 0.3 inches

47. Pay Menar, Afghanistan
> Annual average precipitation (5 years of data): 1.1 inches
> Driest year in database: 2016, 1.7 inches
> Driest month on average: December, 0.8 inches
[in-text-ad-2]
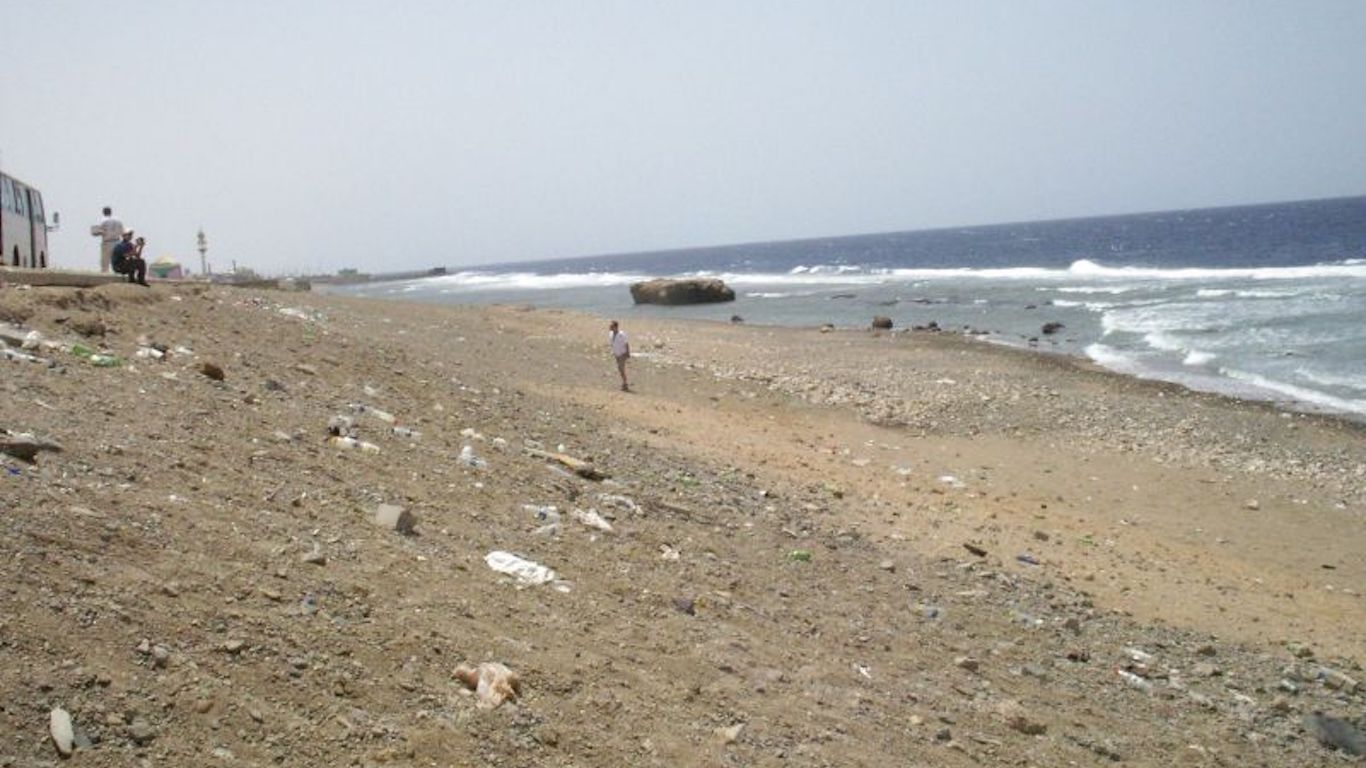
46. Al Wajh, Saudi Arabia
> Annual average precipitation (22 years of data): 1.1 inches
> Driest year in database: 2013, 3.3 inches
> Driest month on average: January, 0.4 inches

45. Fallon, NV, United States Of America
> Annual average precipitation (6 years of data): 1.0 inches
> Driest year in database: 1997, 4.5 inches
> Driest month on average: June, 1.2 inches
[in-text-ad]

44. Wake Island, United States Of America
> Annual average precipitation (11 years of data): 1.0 inches
> Driest year in database: 1997, 6.2 inches
> Driest month on average: May, 0.6 inches
 24/7 Wall St.
43. Ruoqiang, China
> Annual average precipitation (22 years of data): 0.9 inches
> Driest year in database: 2003, 2.2 inches
> Driest month on average: June, 0.4 inches
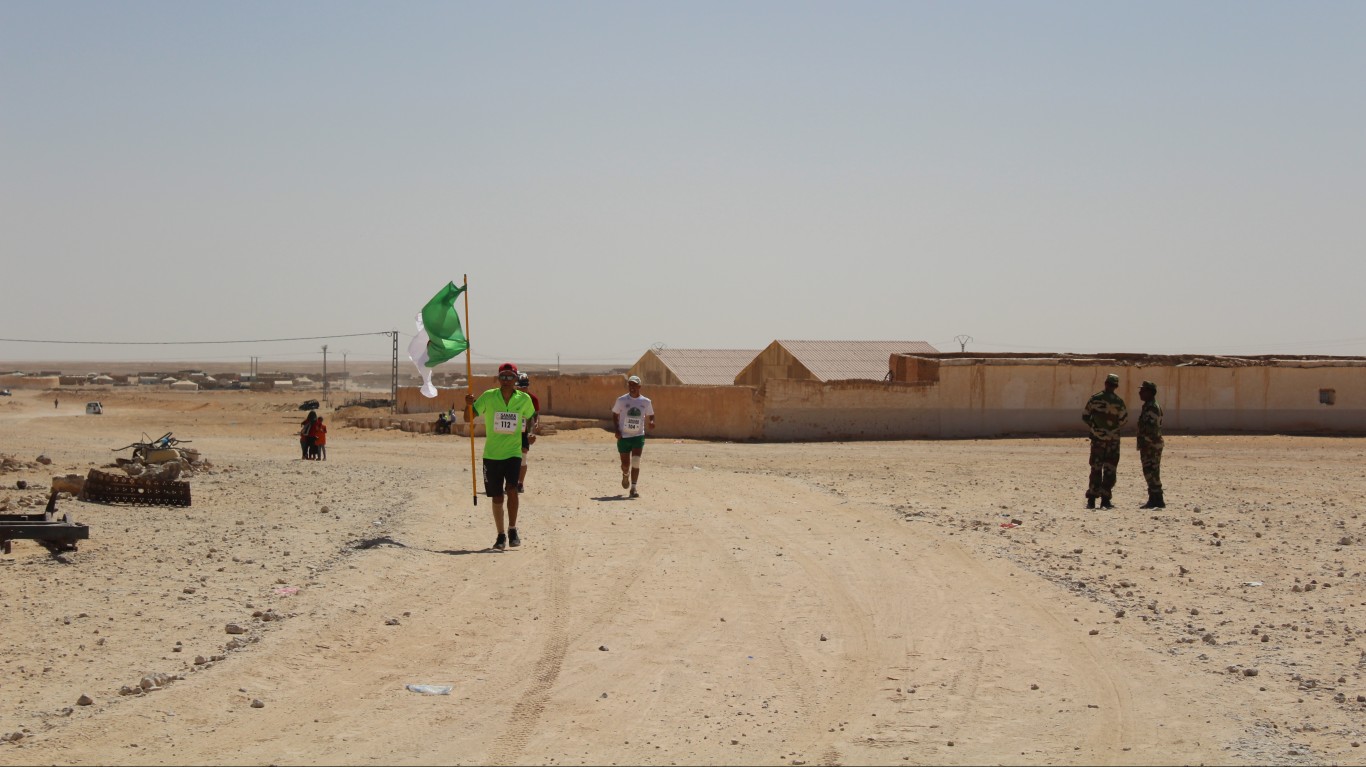
42. Tinduf, Algeria
> Annual average precipitation (8 years of data): 0.9 inches
> Driest year in database: 2003, 3.2 inches
> Driest month on average: October, 1.5 inches
[in-text-ad-2]
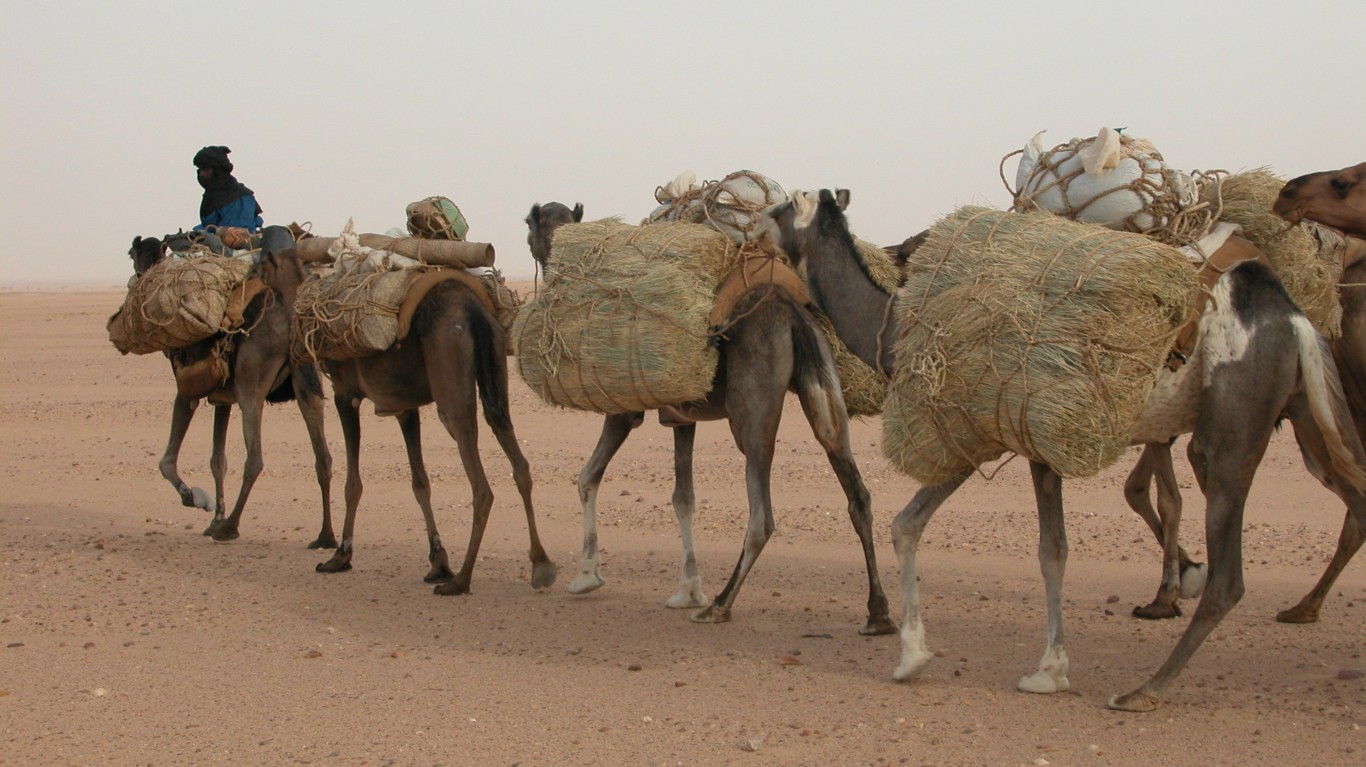
41. Atar, Mauritania
> Annual average precipitation (9 years of data): 0.9 inches
> Driest year in database: 2008, 2.1 inches
> Driest month on average: September, 1.3 inches
40. Tabuk, Saudi Arabia
> Annual average precipitation (22 years of data): 0.9 inches
> Driest year in database: 2015, 2.2 inches
> Driest month on average: January, 0.4 inches
[in-text-ad]

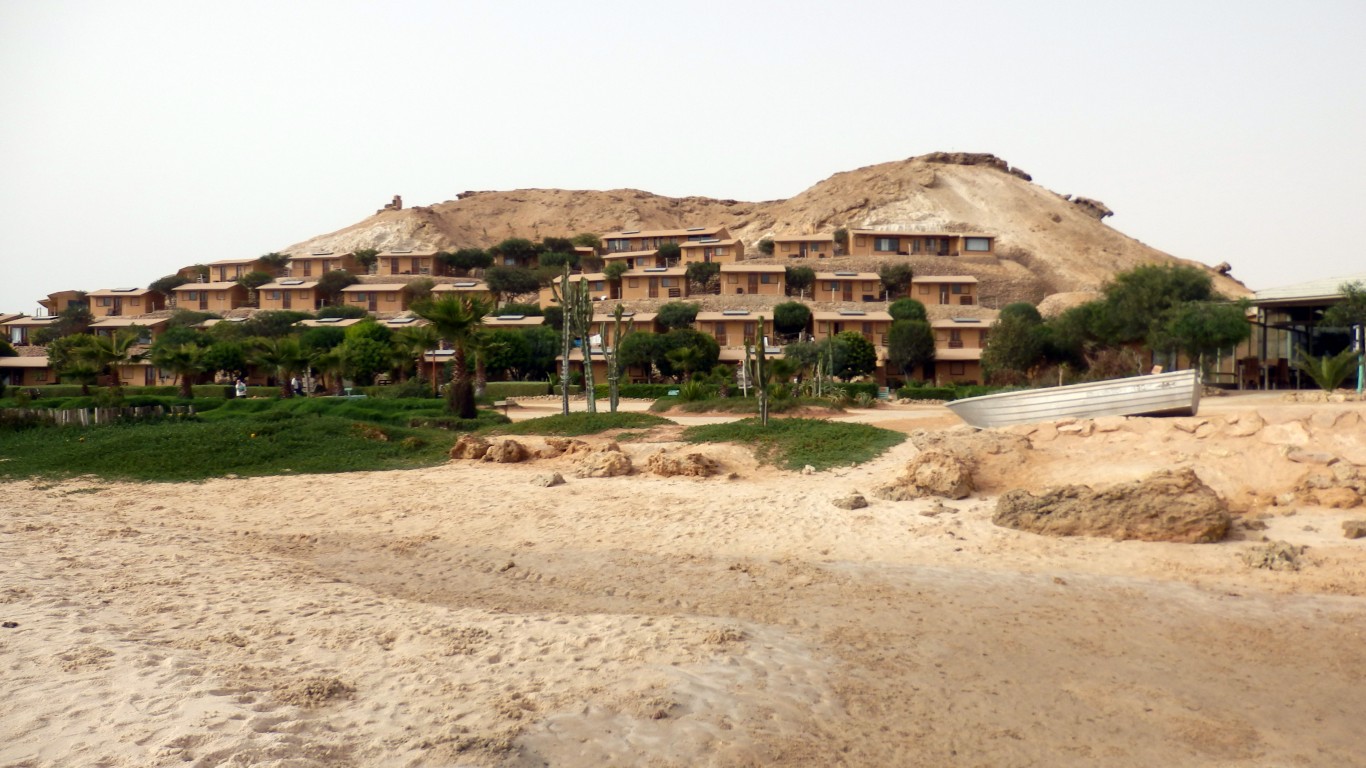
39. Copiapó, Chile
> Annual average precipitation (10 years of data): 0.9 inches
> Driest year in database: 2004, 3.0 inches
> Driest month on average: June, 0.5 inches
 24/7 Wall St.
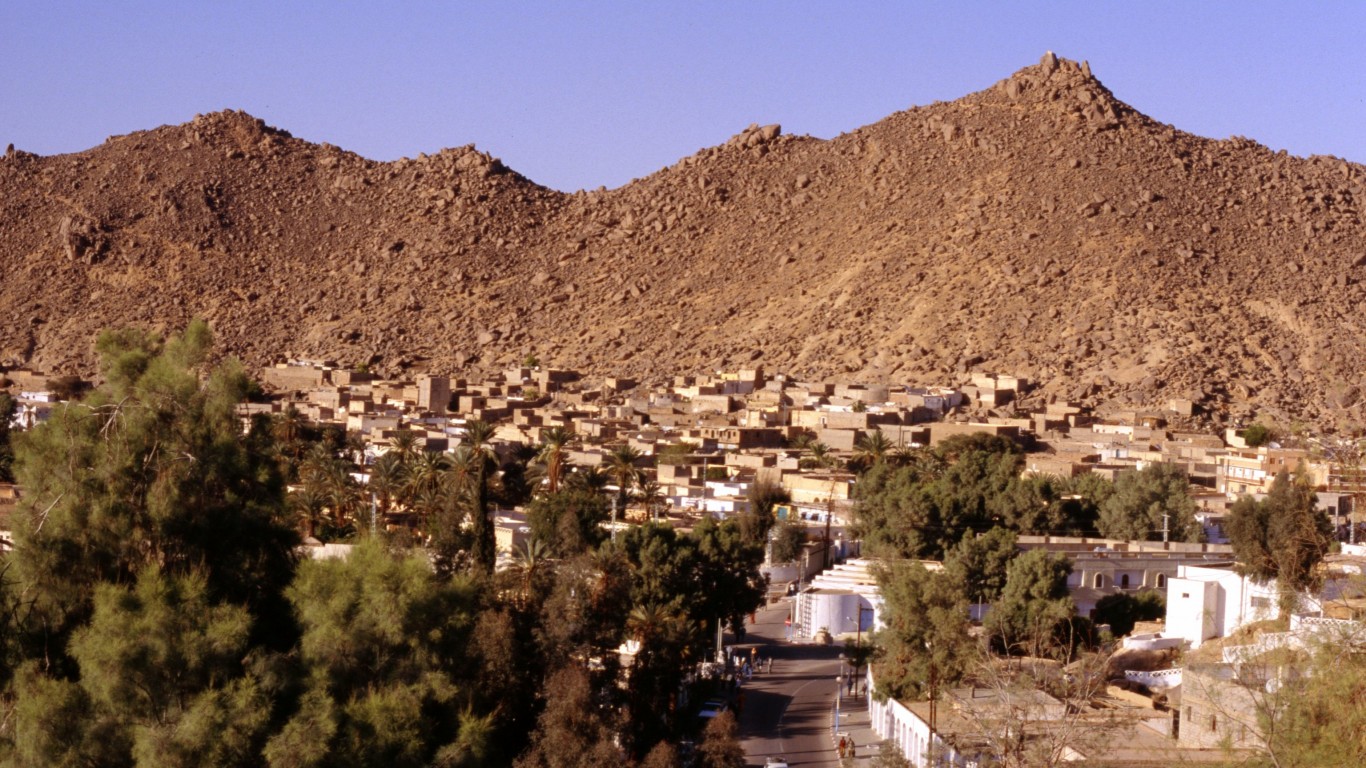
38. Illizi, Algeria
> Annual average precipitation (8 years of data): 0.9 inches
> Driest year in database: 2000, 2.4 inches
> Driest month on average: October, 0.2 inches

37. Concordia Station, Antarctica
> Annual average precipitation (22 years of data): 0.9 inches
> Driest year in database: 2018, 2.5 inches
> Driest month on average: April, 0.1 inches
[in-text-ad-2]

36. Ouargla, Algeria
> Annual average precipitation (8 years of data): 0.9 inches
> Driest year in database: 2000, 1.5 inches
> Driest month on average: October, 0.3 inches

35. Masirah Island, Oman
> Annual average precipitation (22 years of data): 0.8 inches
> Driest year in database: 1997, 4.6 inches
> Driest month on average: November, 0.2 inches
[in-text-ad]
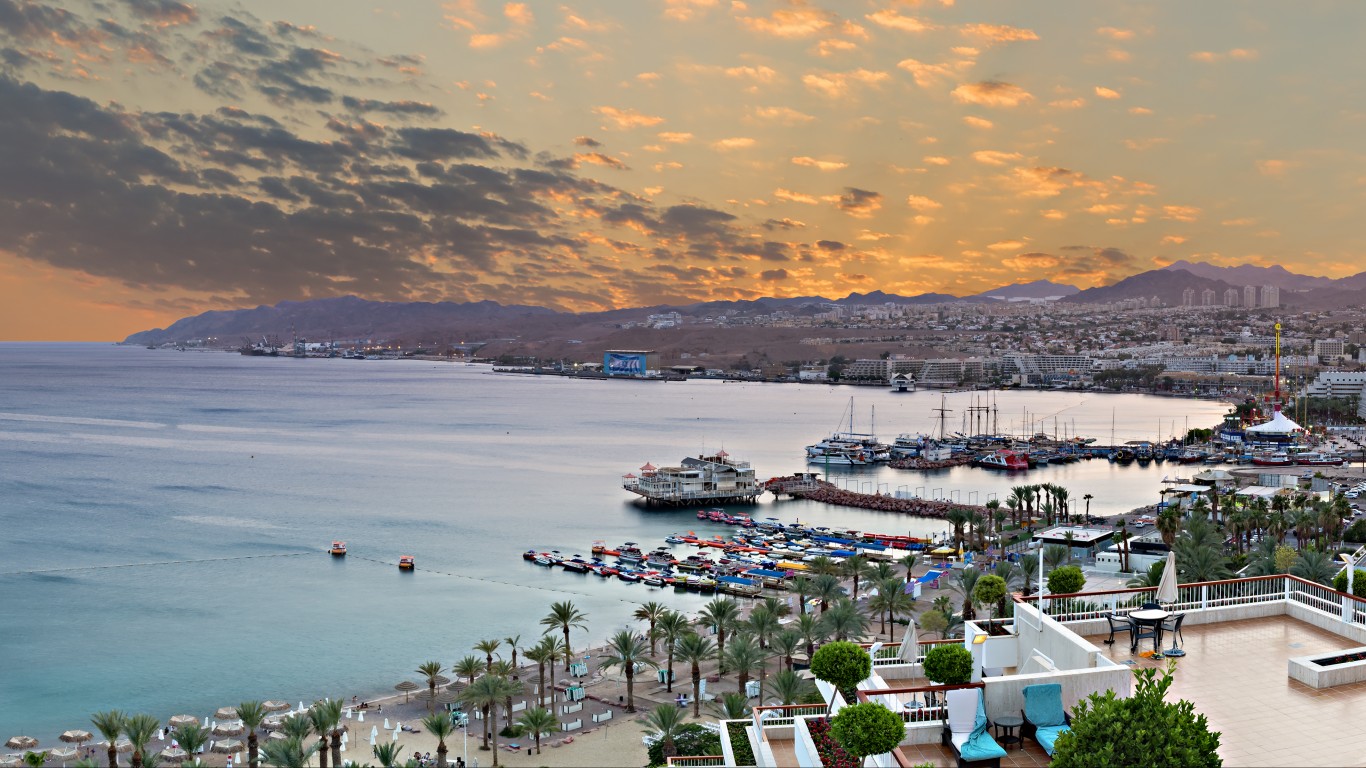
34. Aqaba, Israel
> Annual average precipitation (22 years of data): 0.7 inches
> Driest year in database: 2018, 1.7 inches
> Driest month on average: February, 0.2 inches

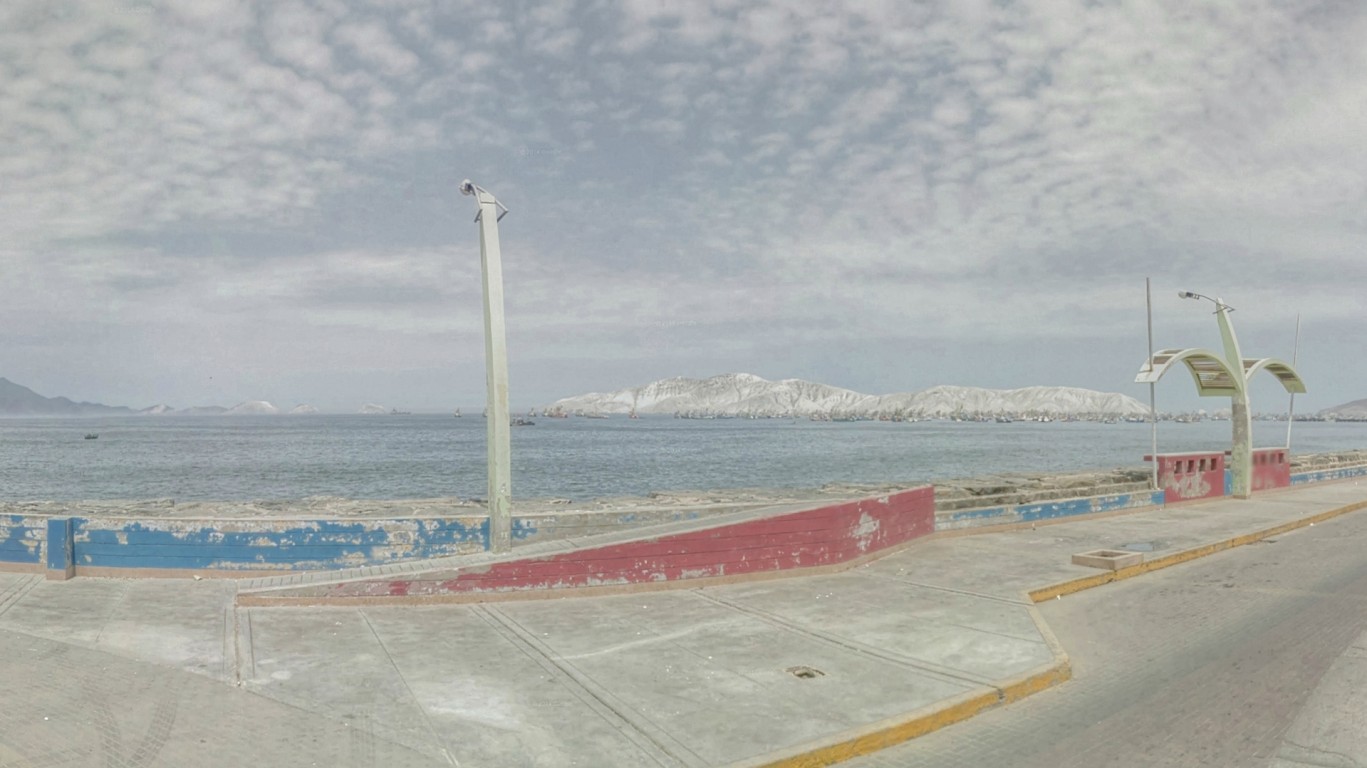
33. Chiclayo, Peru
> Annual average precipitation (20 years of data): 0.7 inches
> Driest year in database: 2008, 2.1 inches
> Driest month on average: March, 0.4 inches

32. Bir Moghrein, Mauritania
> Annual average precipitation (5 years of data): 0.7 inches
> Driest year in database: 2003, 2.2 inches
> Driest month on average: October, 2.1 inches
[in-text-ad-2]

31. In Amenas, Algeria
> Annual average precipitation (22 years of data): 0.7 inches
> Driest year in database: 2005, 3.0 inches
> Driest month on average: October, 0.2 inches
30. Dakhla, Western Sahara (Morocco)
> Annual average precipitation (22 years of data): 0.7 inches
> Driest year in database: 2005, 2.3 inches
> Driest month on average: September, 0.4 inches
[in-text-ad]
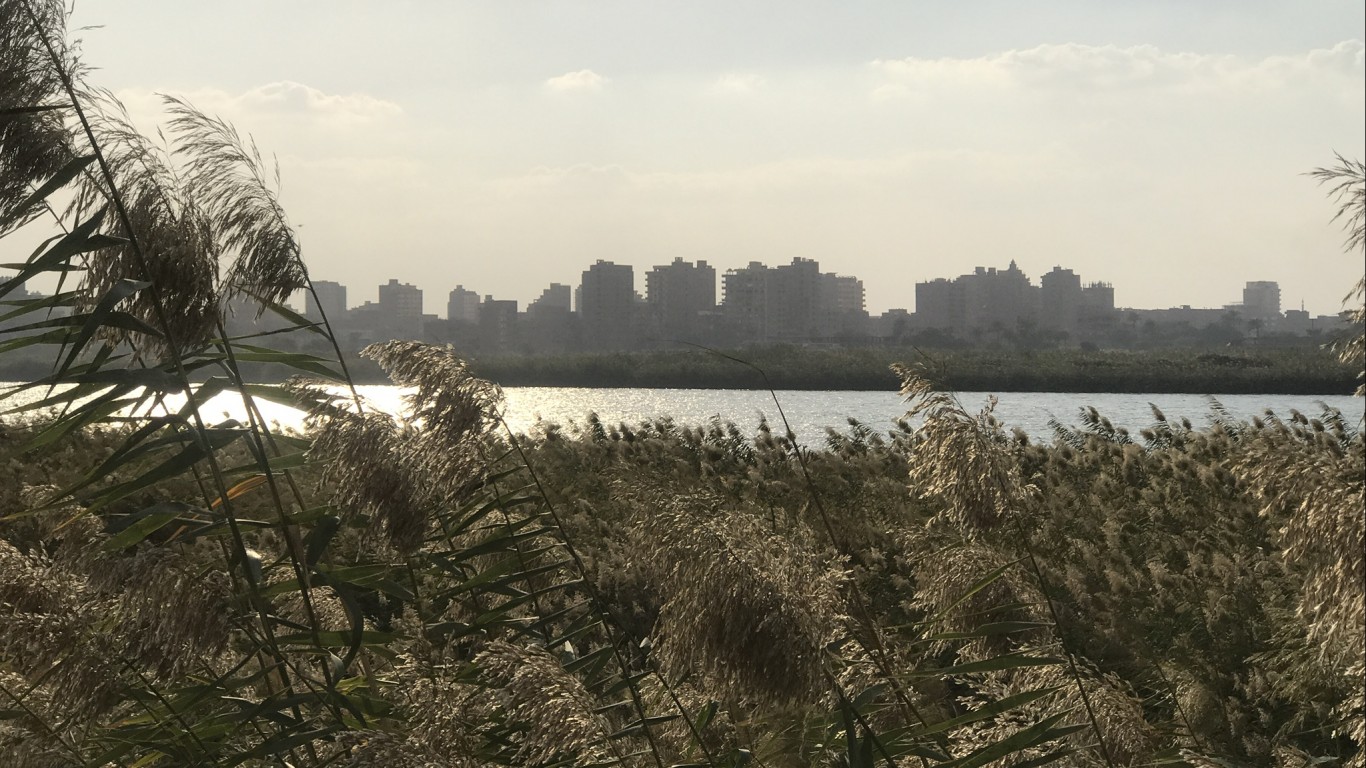
29. Helwan, Egypt
> Annual average precipitation (8 years of data): 0.7 inches
> Driest year in database: 1998, 1.3 inches
> Driest month on average: February, 0.2 inches
28. Hassi Fehal, Algeria
> Annual average precipitation (8 years of data): 0.7 inches
> Driest year in database: 2003, 1.4 inches
> Driest month on average: March, 0.2 inches
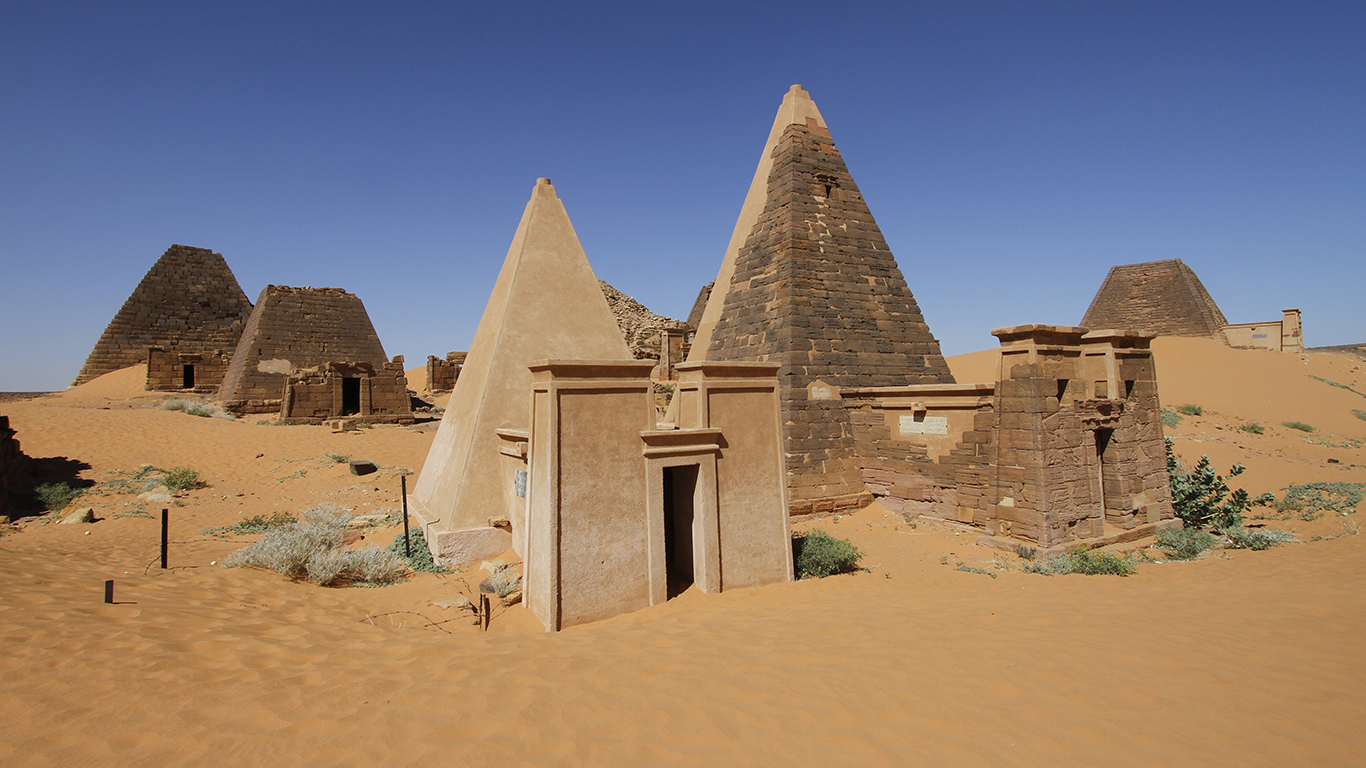
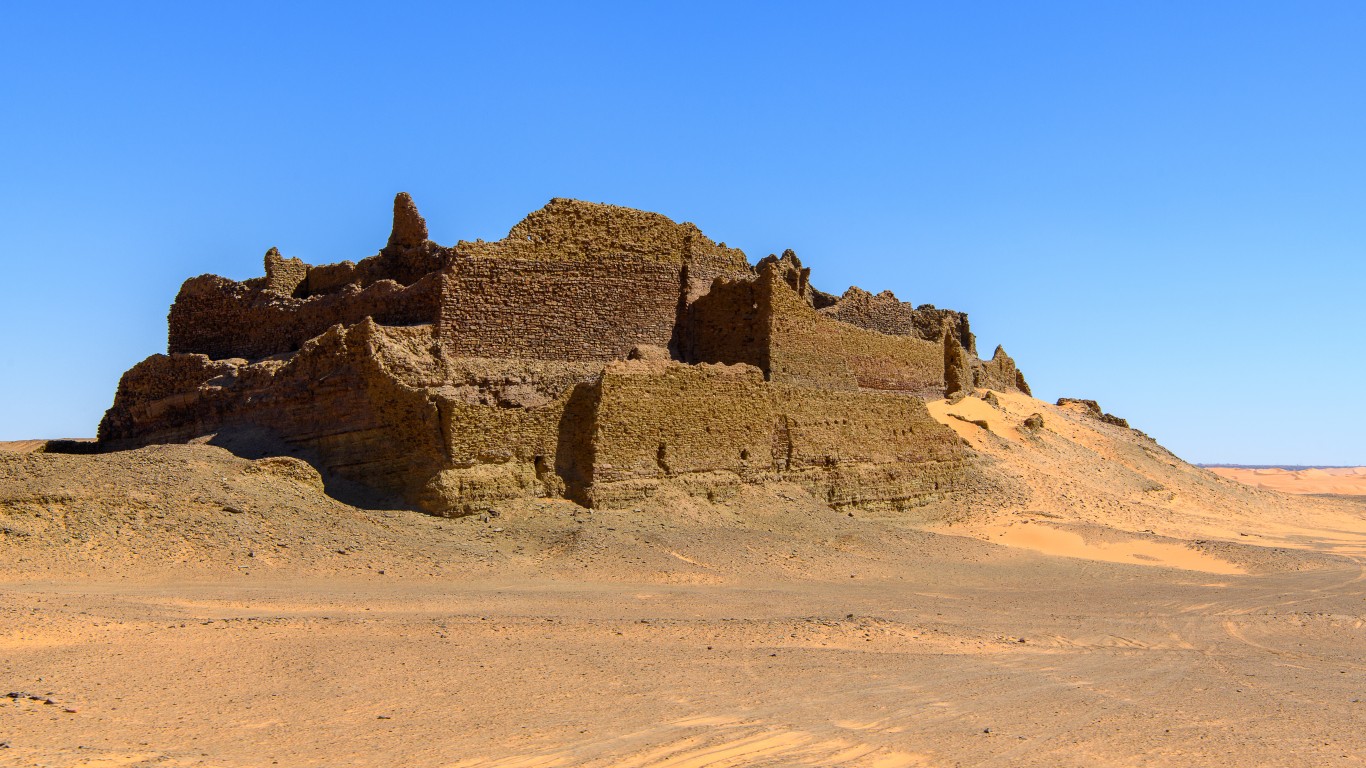
27. Merowe, Sudan
> Annual average precipitation (22 years of data): 0.6 inches
> Driest year in database: 2007, 3.1 inches
> Driest month on average: August, 0.4 inches
[in-text-ad-2]
26. Adrar, Algeria
> Annual average precipitation (22 years of data): 0.5 inches
> Driest year in database: 1999, 2.1 inches
> Driest month on average: September, 0.1 inches

25. Palmeira, Cape Verde
> Annual average precipitation (11 years of data): 0.5 inches
> Driest year in database: 2016, 4.6 inches
> Driest month on average: September, 2.0 inches
[in-text-ad]

24. Thumrait, Oman
> Annual average precipitation (22 years of data): 0.5 inches
> Driest year in database: 2018, 3.6 inches
> Driest month on average: May, 0.2 inches

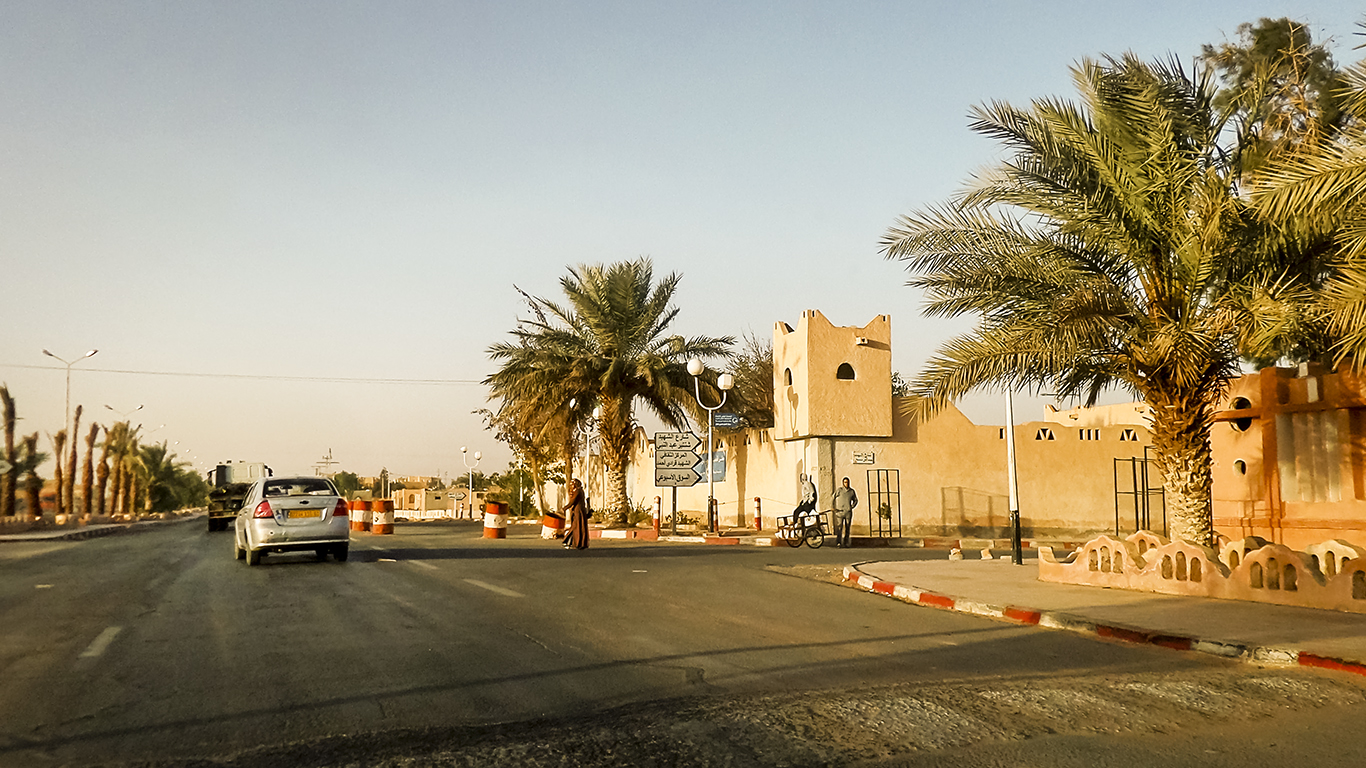
23. Djanet, Algeria
> Annual average precipitation (22 years of data): 0.5 inches
> Driest year in database: 2005, 2.4 inches
> Driest month on average: June, 0.1 inches
22. Azekkour, Algeria
> Annual average precipitation (22 years of data): 0.5 inches
> Driest year in database: 2008, 1.4 inches
> Driest month on average: October, 0.2 inches
[in-text-ad-2]

21. Waddan, Libya
> Annual average precipitation (17 years of data): 0.5 inches
> Driest year in database: 2013, 1.6 inches
> Driest month on average: April, 0.2 inches
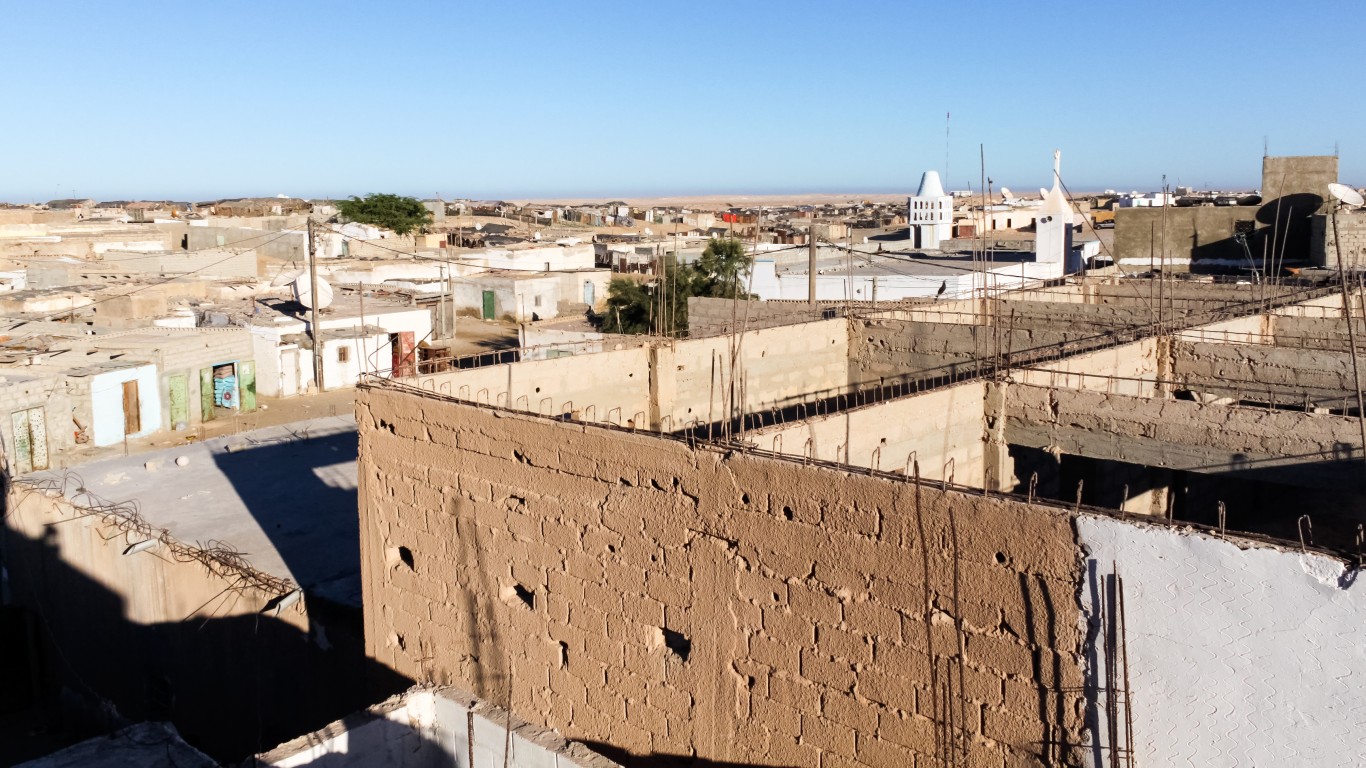
20. Nouadhibou, Mauritania
> Annual average precipitation (22 years of data): 0.4 inches
> Driest year in database: 2010, 3.7 inches
> Driest month on average: October, 0.4 inches
[in-text-ad]

19. Ain Salah, Algeria
> Annual average precipitation (22 years of data): 0.4 inches
> Driest year in database: 1999, 1.3 inches
> Driest month on average: January, 0.1 inches

18. Trujillo, Peru
> Annual average precipitation (20 years of data): 0.4 inches
> Driest year in database: 2003, 1.2 inches
> Driest month on average: February, 0.2 inches

17. Nawabshah, Pakistan
> Annual average precipitation (5 years of data): 0.4 inches
> Driest year in database: 2003, 1.6 inches
> Driest month on average: August, 0.7 inches
[in-text-ad-2]
16. Bilma, Niger
> Annual average precipitation (22 years of data): 0.3 inches
> Driest year in database: 2004, 1.2 inches
> Driest month on average: August, 0.2 inches

15. Abu Hamad, Sudan
> Annual average precipitation (22 years of data): 0.3 inches
> Driest year in database: 2007, 1.5 inches
> Driest month on average: August, 0.2 inches
[in-text-ad]
14. Talara, Peru
> Annual average precipitation (5 years of data): 0.3 inches
> Driest year in database: 1999, 0.8 inches
> Driest month on average: March, 0.6 inches
 24/7 Wall St.
13. Dongola, Sudan
> Annual average precipitation (22 years of data): 0.3 inches
> Driest year in database: 2014, 1.3 inches
> Driest month on average: July, 0.2 inches
12. SabhÄ, Libya
> Annual average precipitation (18 years of data): 0.2 inches
> Driest year in database: 2013, 0.7 inches
> Driest month on average: January, 0.1 inches
[in-text-ad-2]
11. La Chimba, Chile
> Annual average precipitation (22 years of data): 0.2 inches
> Driest year in database: 2017, 2.0 inches
> Driest month on average: March, 0.1 inches
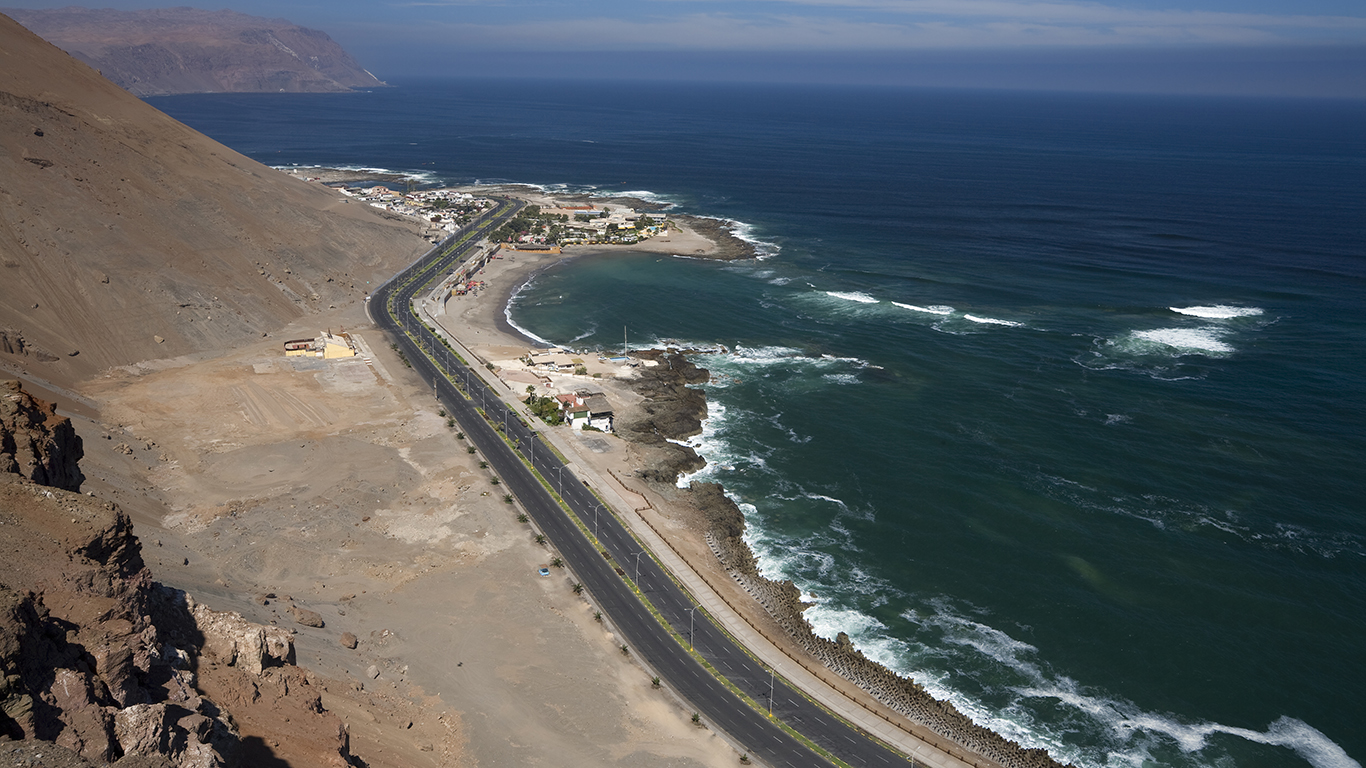
10. Arica, Chile
> Annual average precipitation (22 years of data): 0.1 inches
> Driest year in database: 2017, 1.3 inches
> Driest month on average: March, 0.1 inches
[in-text-ad]
9. Nok Kundi, Pakistan
> Annual average precipitation (5 years of data): 0.1 inches
> Driest year in database: 2003, 0.3 inches
> Driest month on average: January, 0.2 inches
 24/7 Wall St.
8. Aswan, Egypt
> Annual average precipitation (22 years of data): 0.1 inches
> Driest year in database: 2014, 0.7 inches
> Driest month on average: March, <0.0 inches
7. Kharga Oasis, Egypt
> Annual average precipitation (7 years of data): 0.1 inches
> Driest year in database: 1999, 0.2 inches
> Driest month on average: January, <0.0 inches
[in-text-ad-2]

6. Siwa Oasis, Egypt
> Annual average precipitation (6 years of data): <0.0 inches
> Driest year in database: 2001, 0.1 inches
> Driest month on average: February, <0.0 inches
5. Wadi Halfa, Sudan
> Annual average precipitation (22 years of data): <0.0 inches
> Driest year in database: 2010, 0.2 inches
> Driest month on average: August, <0.0 inches
[in-text-ad]

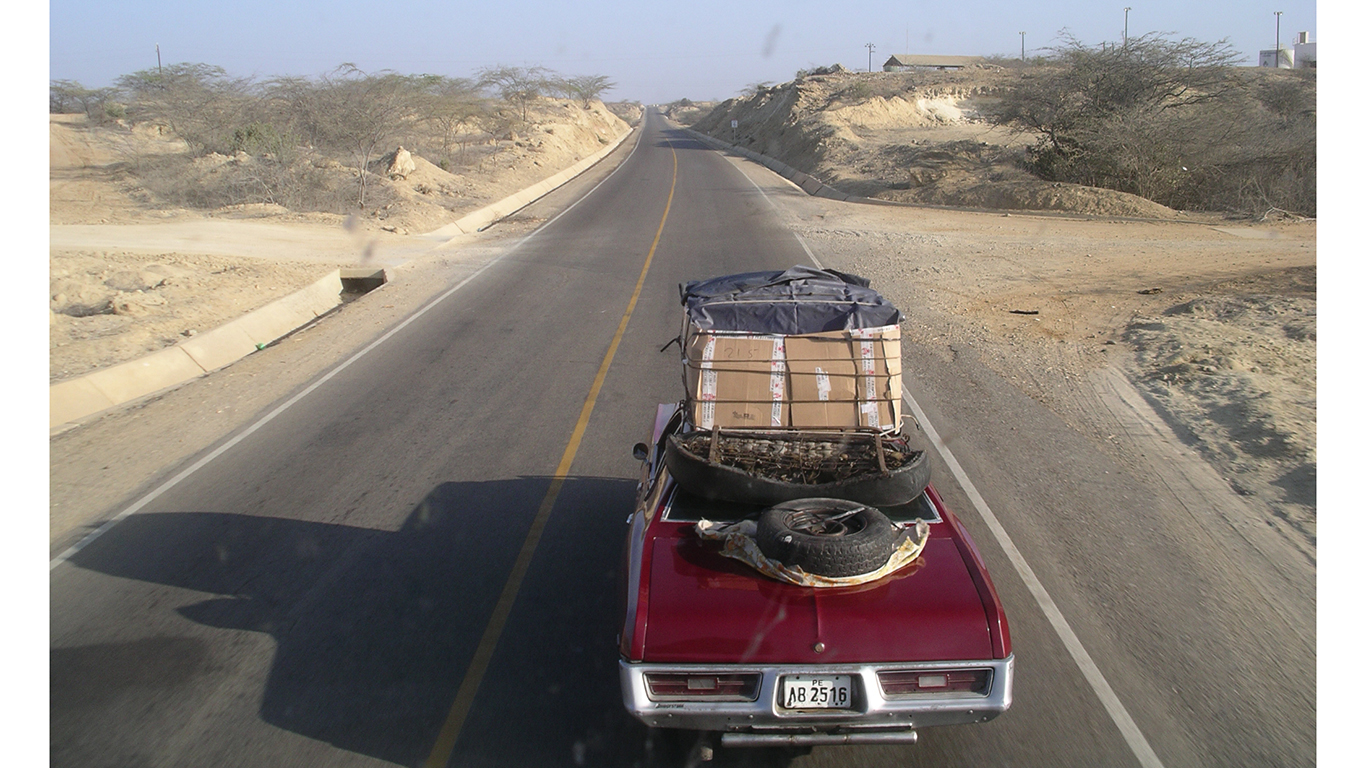
4. Pisco, Peru
> Annual average precipitation (19 years of data): <0.0 inches
> Driest year in database: 2011, 0.1 inches
> Driest month on average: January, <0.0 inches
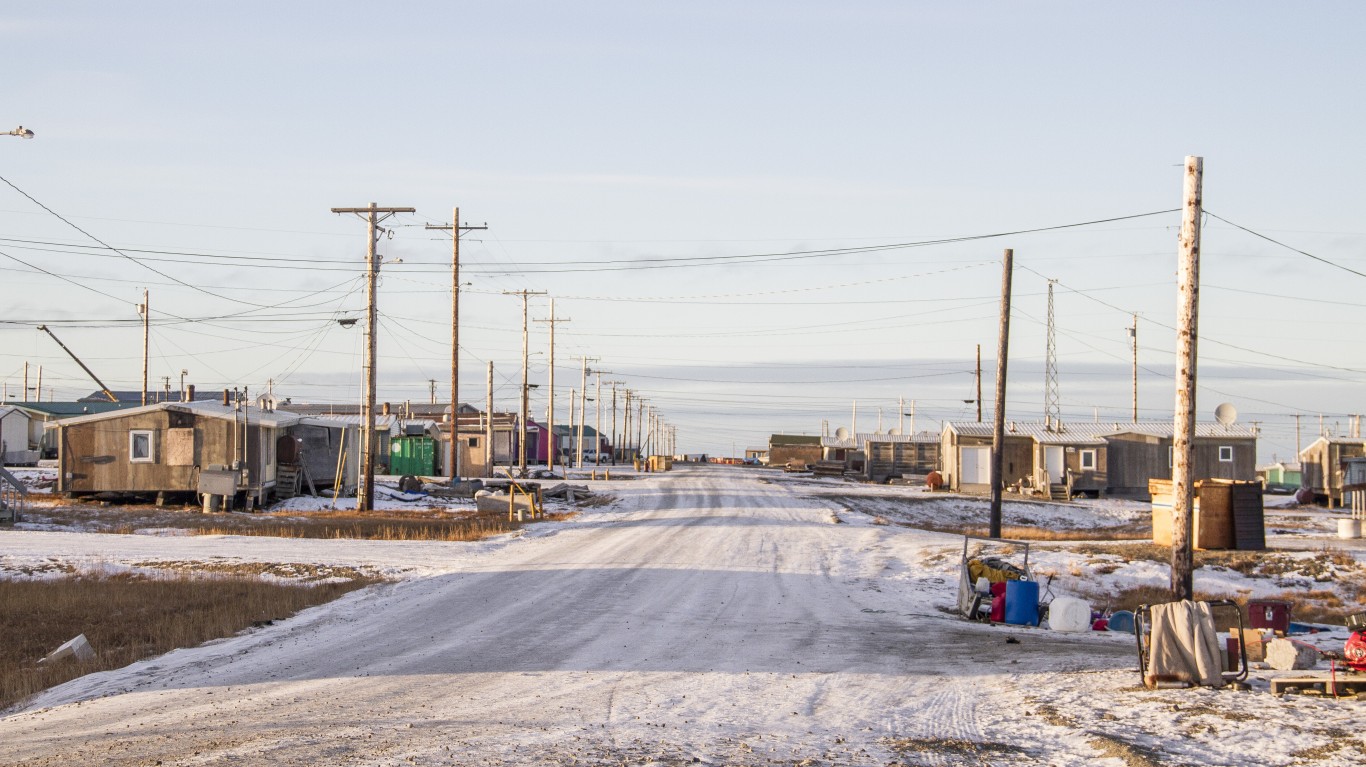
3. Kaktovik, AK, United States Of America
> Annual average precipitation (5 years of data): <0.0 inches
> Driest year in database: 1998, <0.0 inches
> Driest month on average: June, <0.0 inches
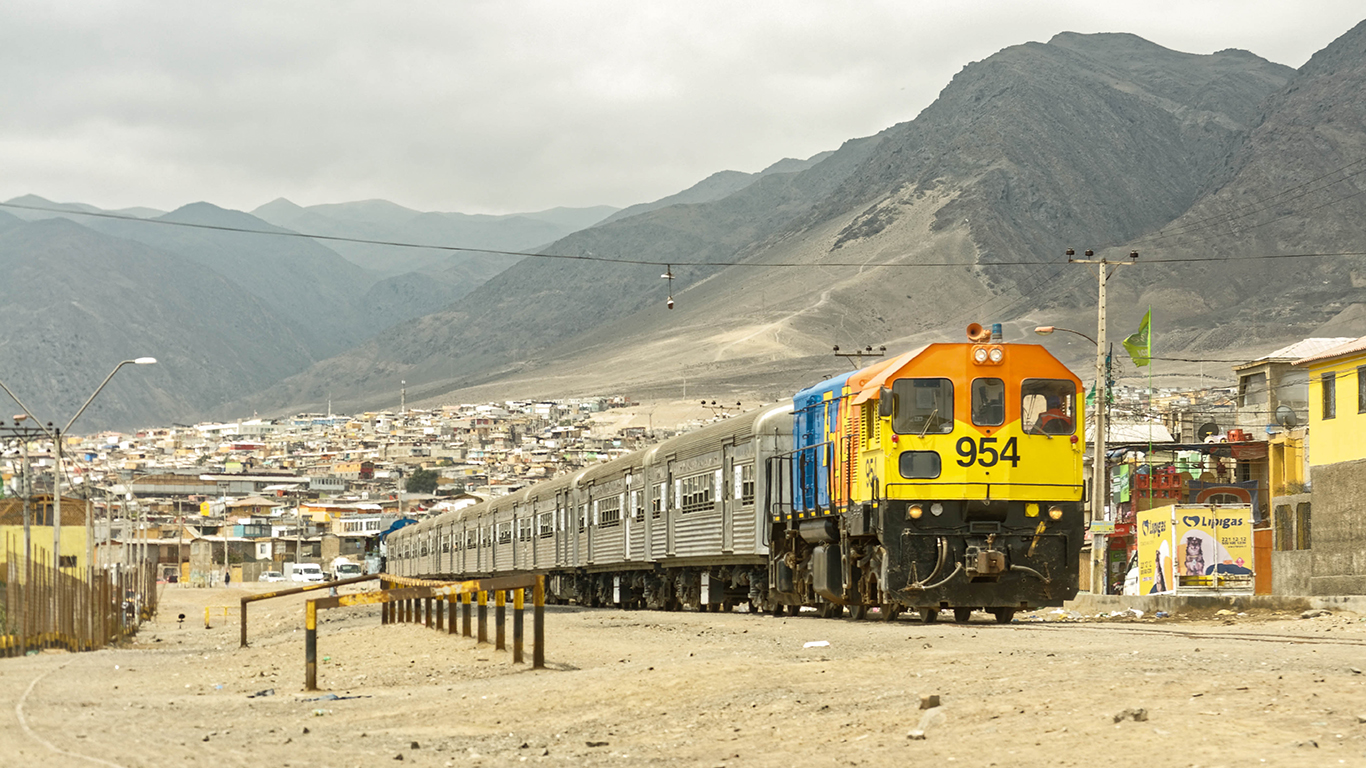
2. Chimbote, Peru
> Annual average precipitation (5 years of data): <0.0 inches
> Driest year in database: 1997, <0.0 inches
> Driest month on average: October, <0.0 inches
[in-text-ad-2]
1. Al Jawf, Libya
> Annual average precipitation (12 years of data): <0.0 inches
> Driest year in database: 1997, 0.1 inches
> Driest month on average: October, <0.0 inches
Take Charge of Your Retirement: Find the Right Financial Advisor For You in Minutes (Sponsor)
Retirement planning doesn’t have to feel overwhelming. The key is finding professional guidance—and we’ve made it easier than ever for you to connect with the right financial advisor for your unique needs.
Here’s how it works:
1️ Answer a Few Simple Questions
Tell us a bit about your goals and preferences—it only takes a few minutes!
2️ Get Your Top Advisor Matches
This tool matches you with qualified advisors who specialize in helping people like you achieve financial success.
3️ Choose Your Best Fit
Review their profiles, schedule an introductory meeting, and select the advisor who feels right for you.
Why wait? Start building the retirement you’ve always dreamed of. Click here to get started today!
Thank you for reading! Have some feedback for us?
Contact the 24/7 Wall St. editorial team.
Latest from 24/7


Our expert who first called NVIDIA in 2009 is predicting 2025 will see a historic AI breakthrough.
You can follow him investing $500,000 of his own money on our top AI stocks for free.