
Earth is an ocean planet. Water in liquid or frozen form covers 75% of Earth’s surface and fills the sky with clouds. Atmospheric rivers known as jet streams meander and encircle the Earth, contributing to seasonal patterns of rainfall in places across the globe. In many parts of the United States, there is the familiar association of rain with springtime. In other parts of the world, there is always rain.
To identify the rainiest places on Earth, 24/7 Wall St. reviewed average annual rainfall recorded by weather stations around the world and compiled by the Global Historical Climatology Network, a program of the National Centers for Environmental Information (NCEI).
We calculated the average annual rainfall from precipitation in the years 1997 through 2018. Weather stations that did not have at least five years of data available between 1997 and 2018 were not considered.
The most frequently occurring rainiest places on Earth are those in Malaysia and in other South Asian regions. Four places in the United States made our list.
Click here to see the rainiest places on earth.

50. Quillayute, WA, United States Of America
> Annual average precipitation (22 years of data): 103.0 inches
> Rainiest year in database: 1999, 131.6 inches
> Rainiest month on average: November, 15.9 inches
[in-text-ad]

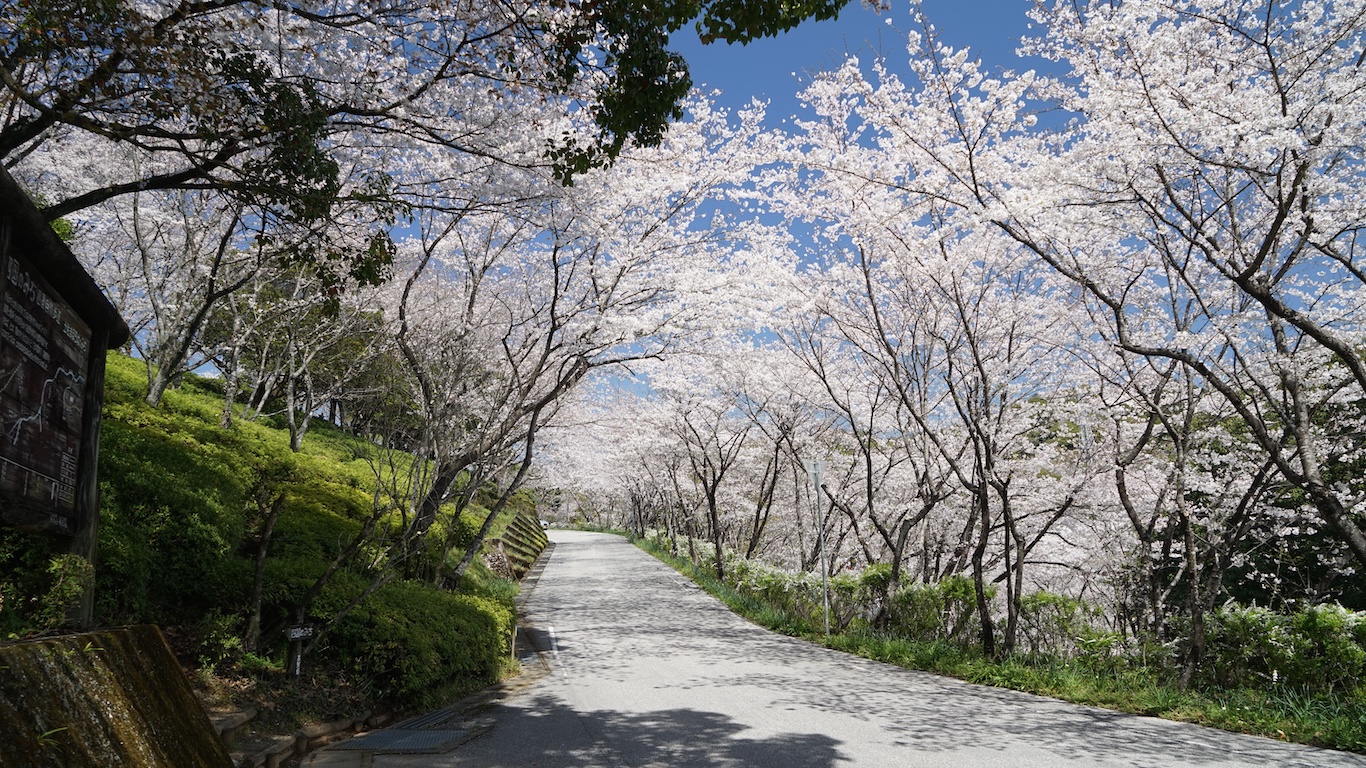
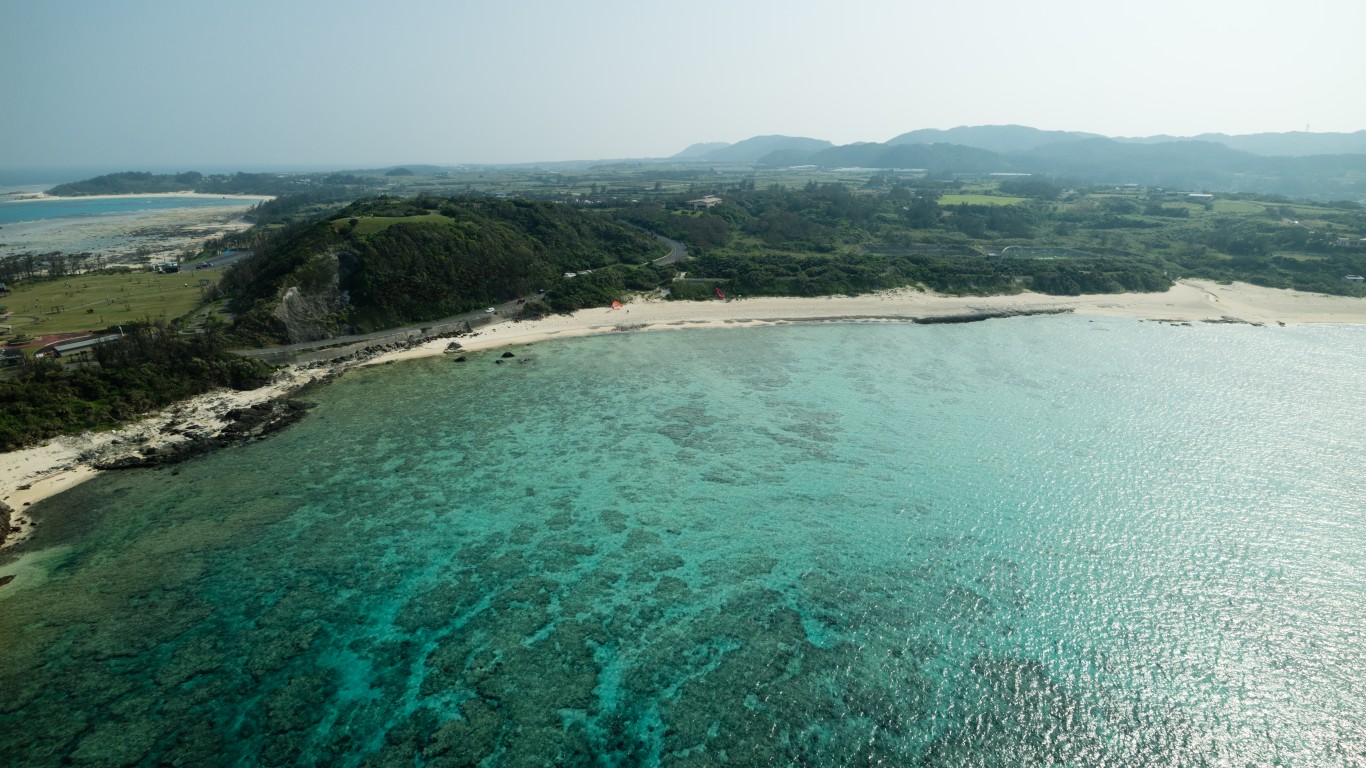
49. Miyazaki, Japan
> Annual average precipitation (22 years of data): 104.3 inches
> Rainiest year in database: 2015, 125.8 inches
> Rainiest month on average: June, 20.7 inches
 24/7 Wall St.
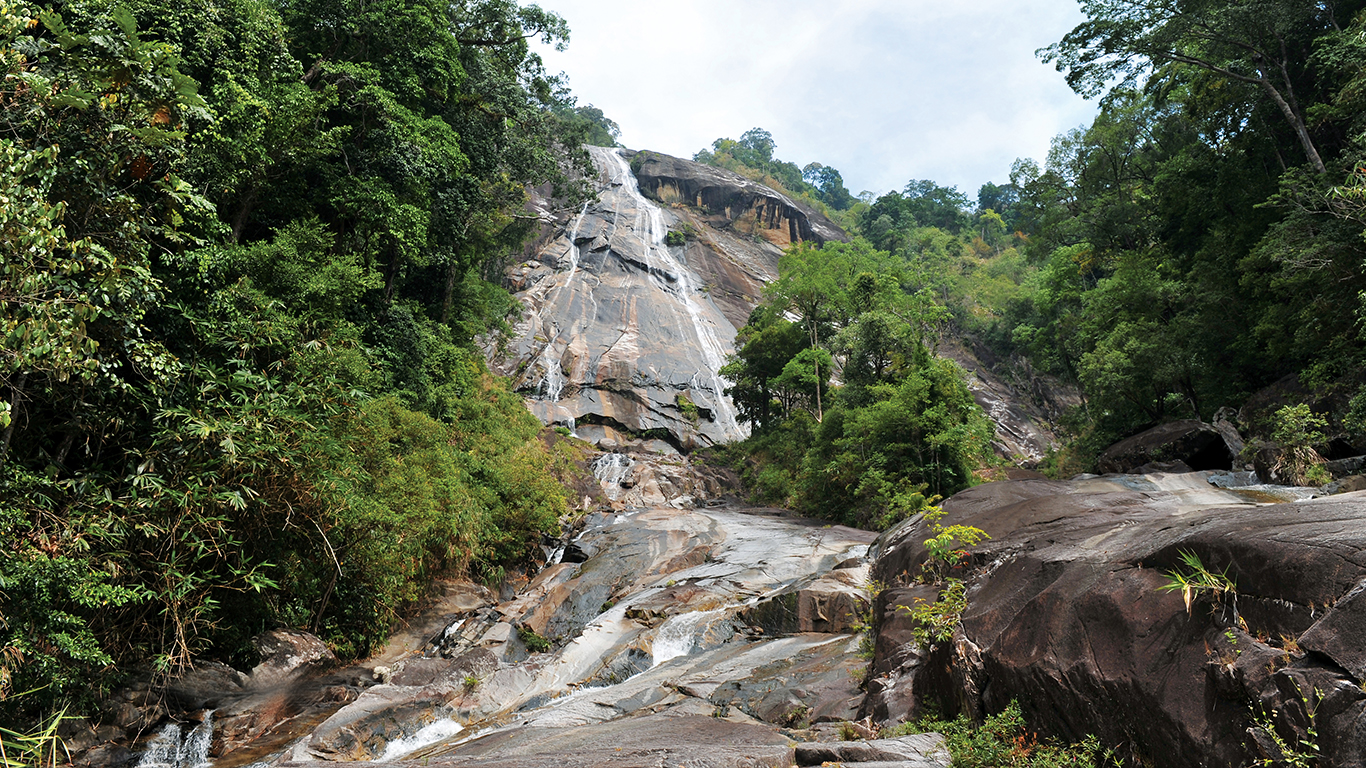
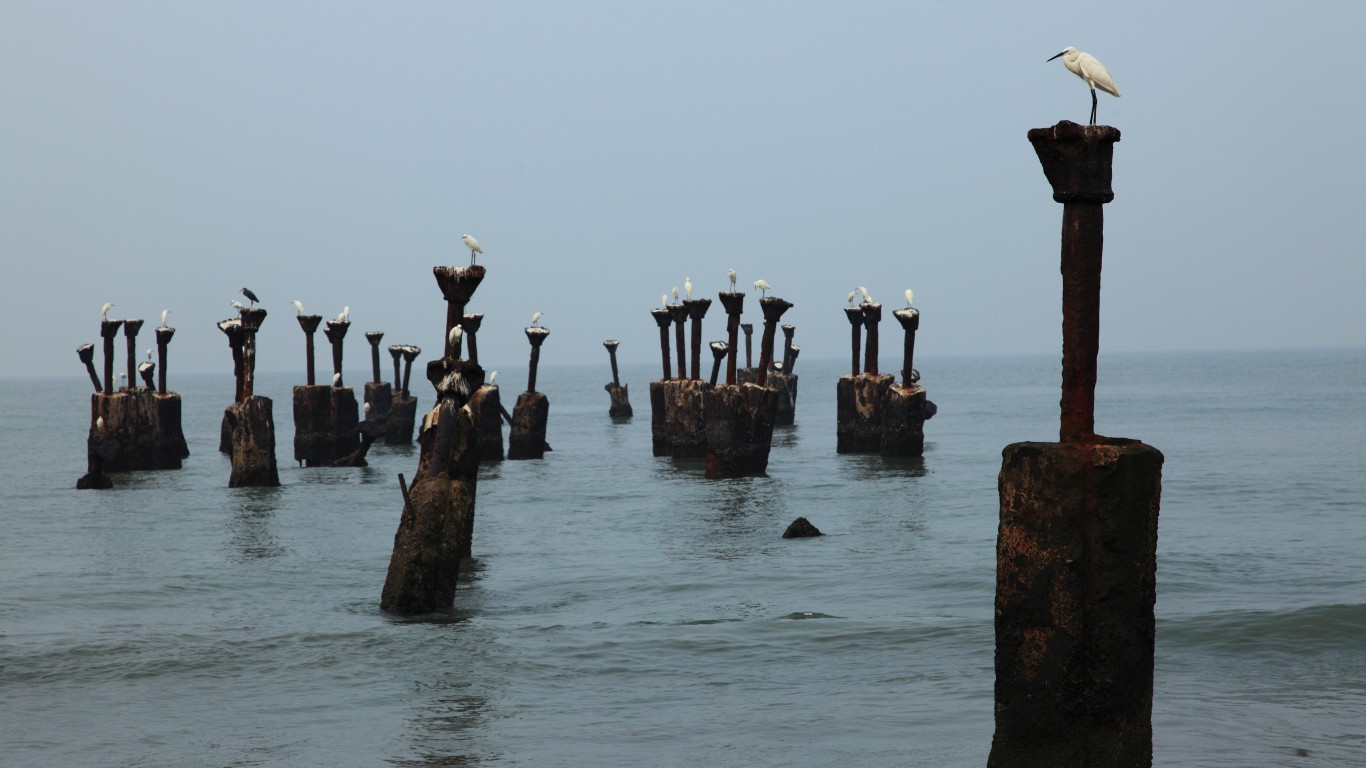
48. Pengkalan Chepa, Malaysia
> Annual average precipitation (22 years of data): 104.5 inches
> Rainiest year in database: 2000, 144.1 inches
> Rainiest month on average: November, 25.0 inches
47. Nankoku, Japan
> Annual average precipitation (16 years of data): 104.9 inches
> Rainiest year in database: 1998, 172.6 inches
> Rainiest month on average: September, 18.7 inches
[in-text-ad-2]
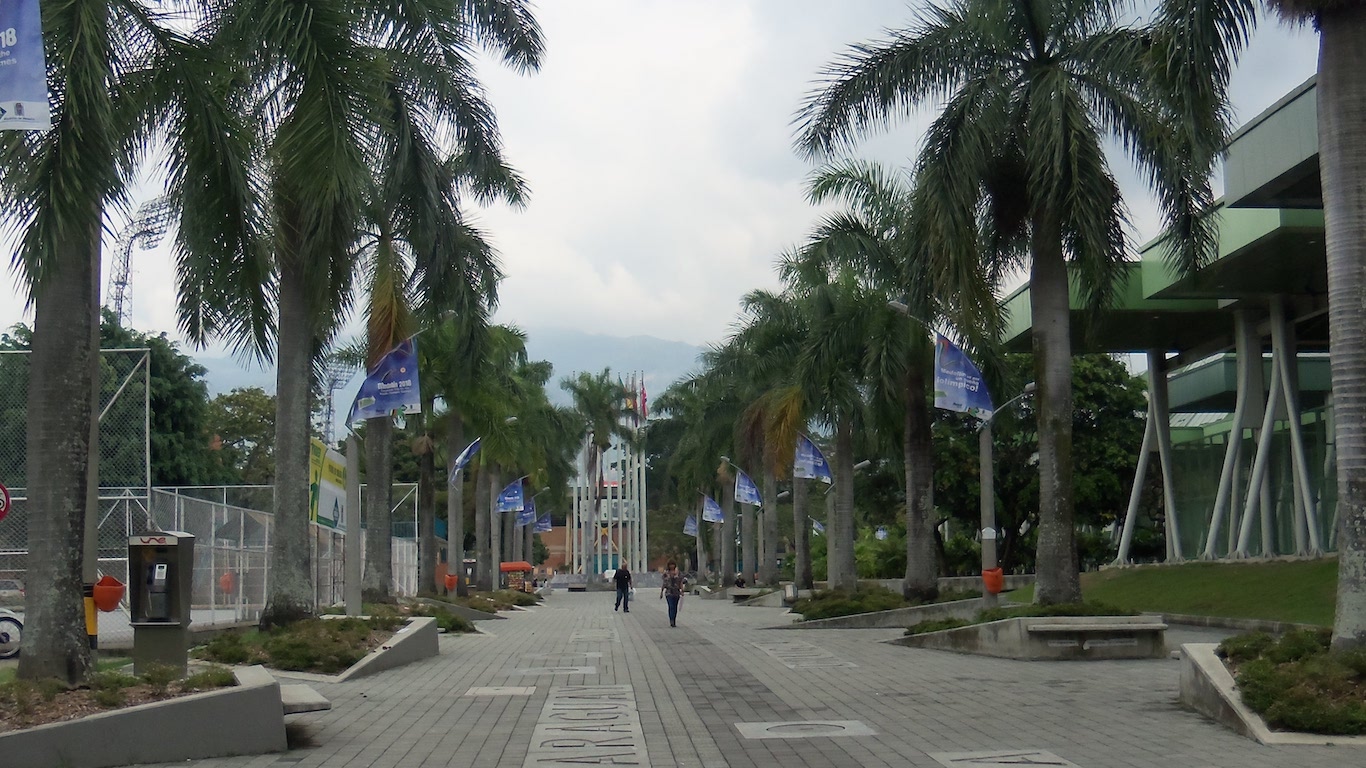
46. Los Laureles, Colombia
> Annual average precipitation (22 years of data): 104.9 inches
> Rainiest year in database: 2010, 148.1 inches
> Rainiest month on average: October, 15.3 inches
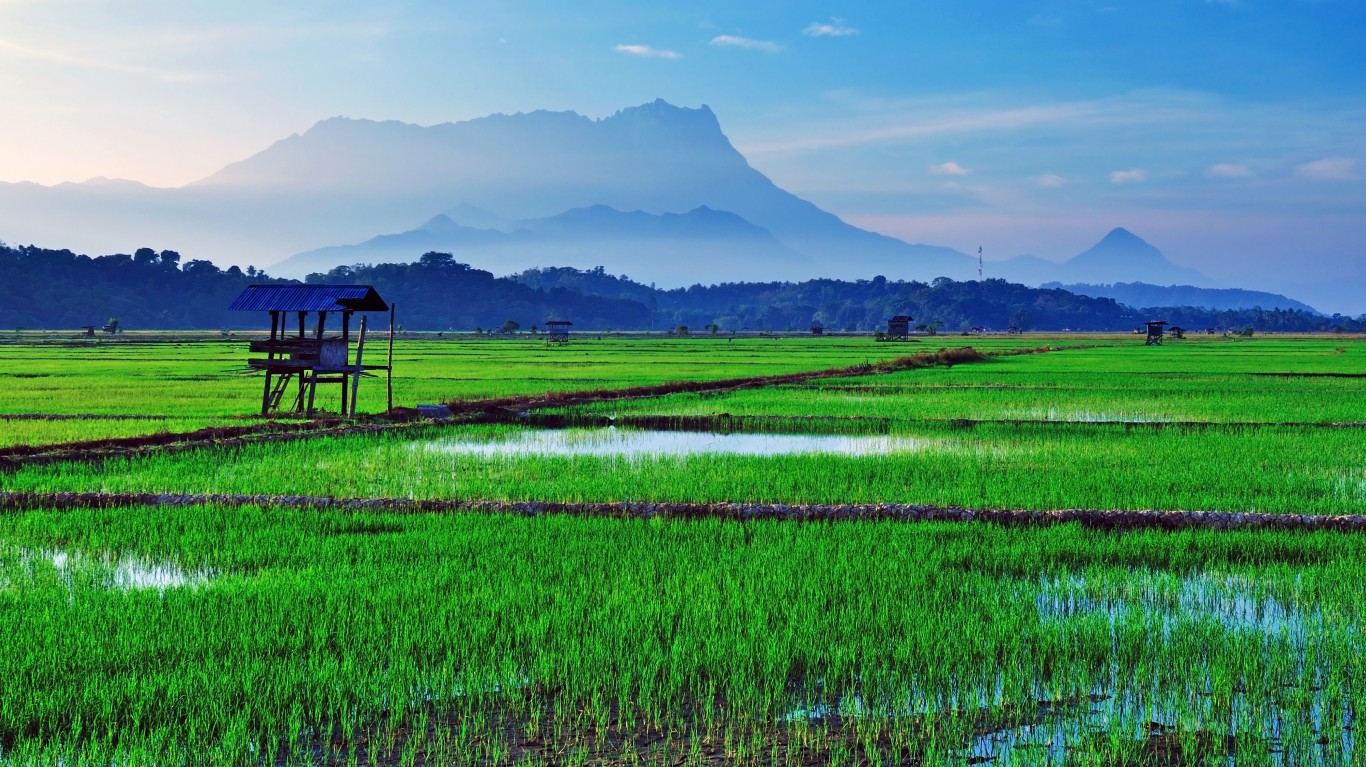
45. Kota Kinabalu, Malaysia
> Annual average precipitation (22 years of data): 106.4 inches
> Rainiest year in database: 2005, 156.5 inches
> Rainiest month on average: October, 15.2 inches
[in-text-ad]
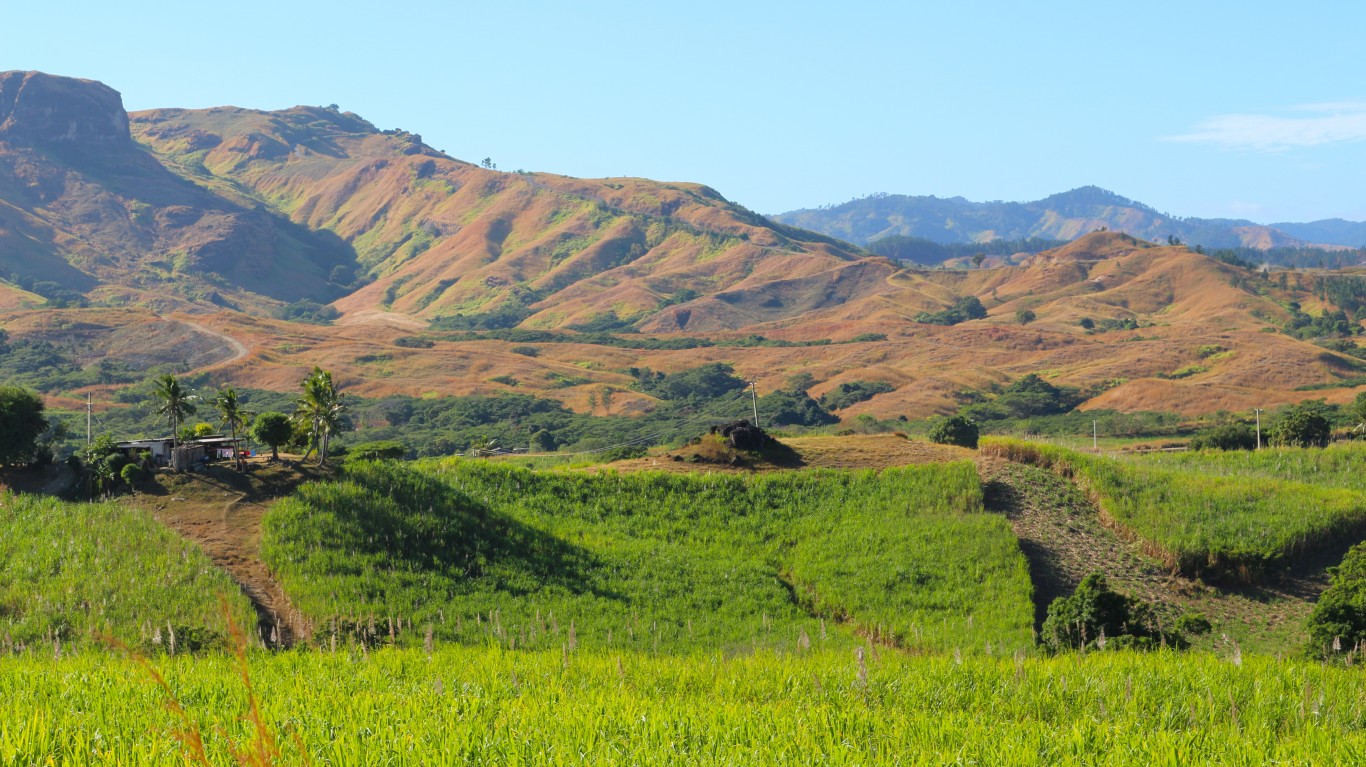
44. Nausori, Fiji
> Annual average precipitation (22 years of data): 106.8 inches
> Rainiest year in database: 1999, 140.3 inches
> Rainiest month on average: December, 14.4 inches
 24/7 Wall St.
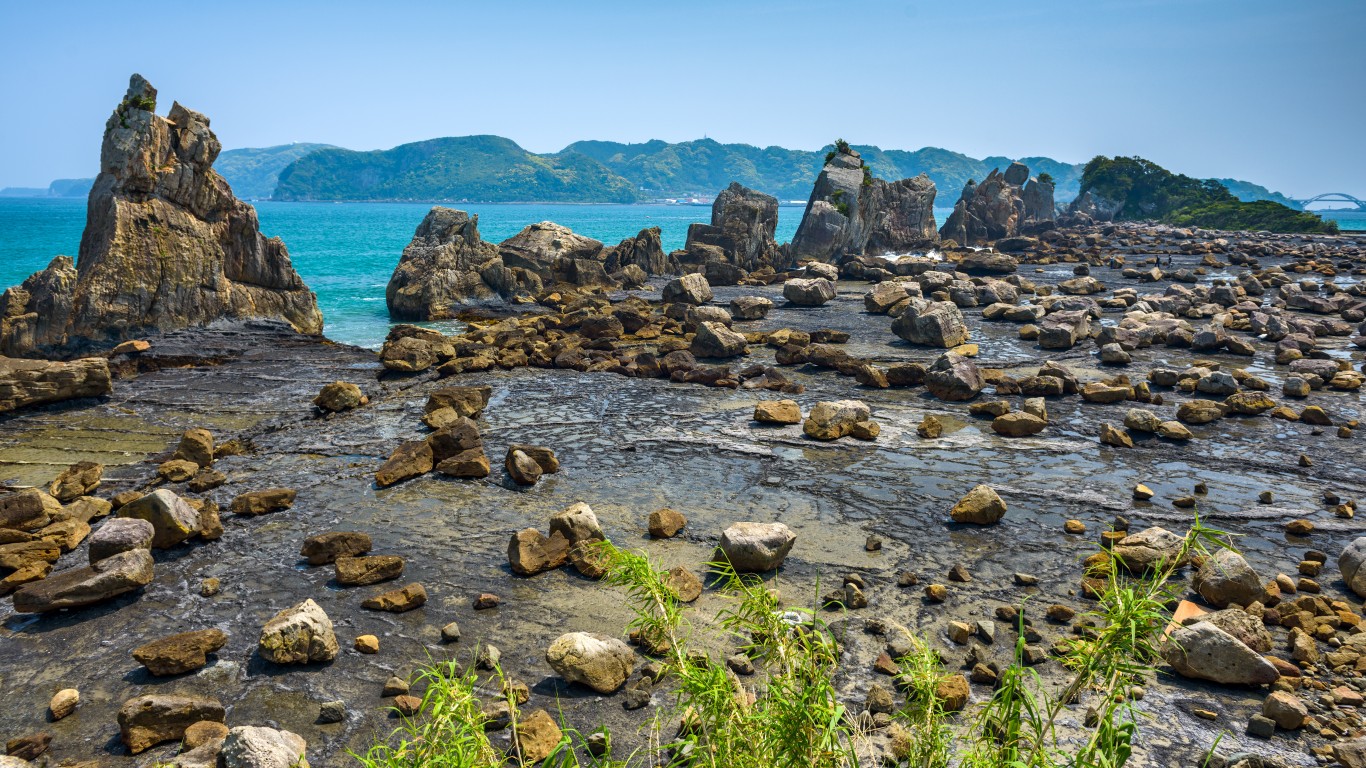
43. Kushimoto, Japan
> Annual average precipitation (22 years of data): 106.9 inches
> Rainiest year in database: 1998, 138.5 inches
> Rainiest month on average: June, 14.9 inches

42. Urnäsch, Switzerland
> Annual average precipitation (22 years of data): 107.9 inches
> Rainiest year in database: 2017, 140.1 inches
> Rainiest month on average: December, 11.9 inches
[in-text-ad-2]
41. Saint Georges, French Guiana (France)
> Annual average precipitation (8 years of data): 108.0 inches
> Rainiest year in database: 2000, 162.0 inches
> Rainiest month on average: May, 23.4 inches

40. Silchar, India
> Annual average precipitation (22 years of data): 109.1 inches
> Rainiest year in database: 2010, 174.6 inches
> Rainiest month on average: June, 20.4 inches
[in-text-ad]
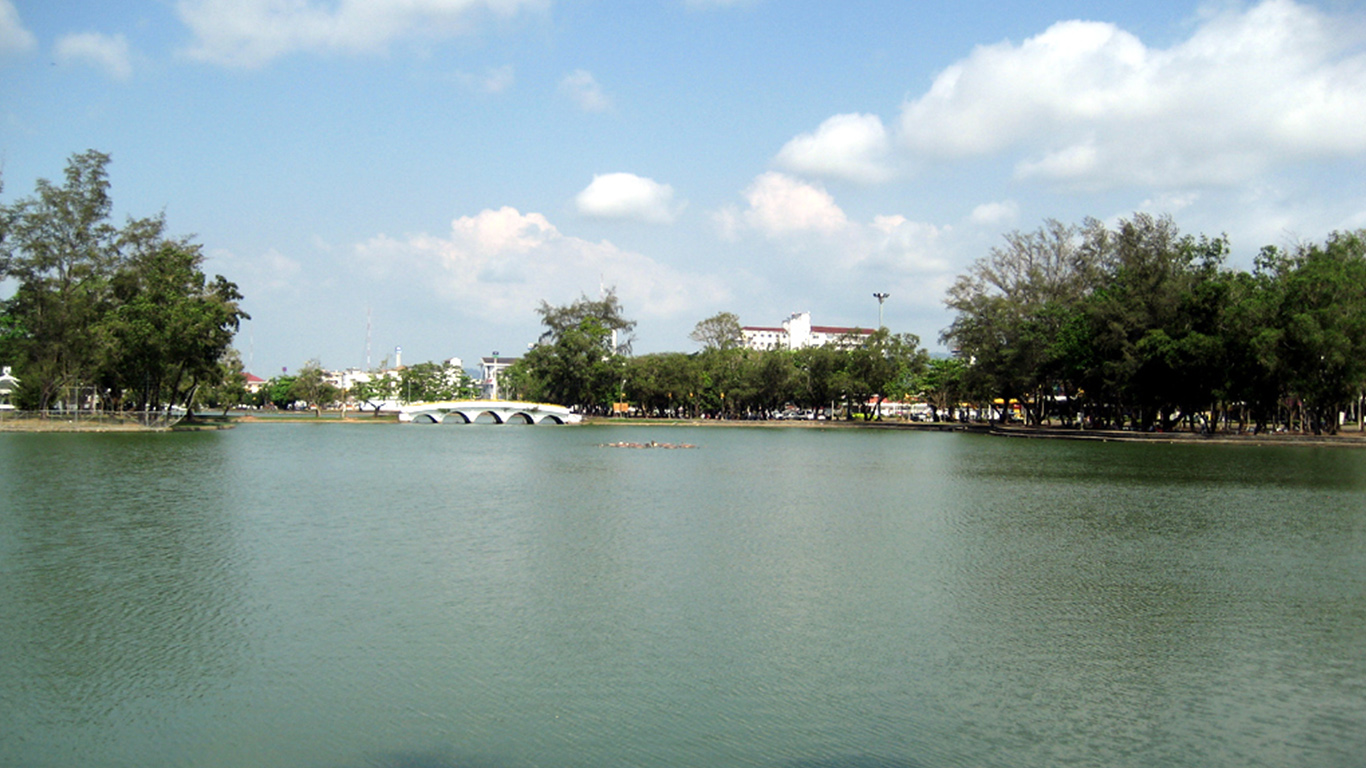
39. Wat Mai, Thailand
> Annual average precipitation (22 years of data): 109.3 inches
> Rainiest year in database: 2006, 153.9 inches
> Rainiest month on average: September, 19.8 inches
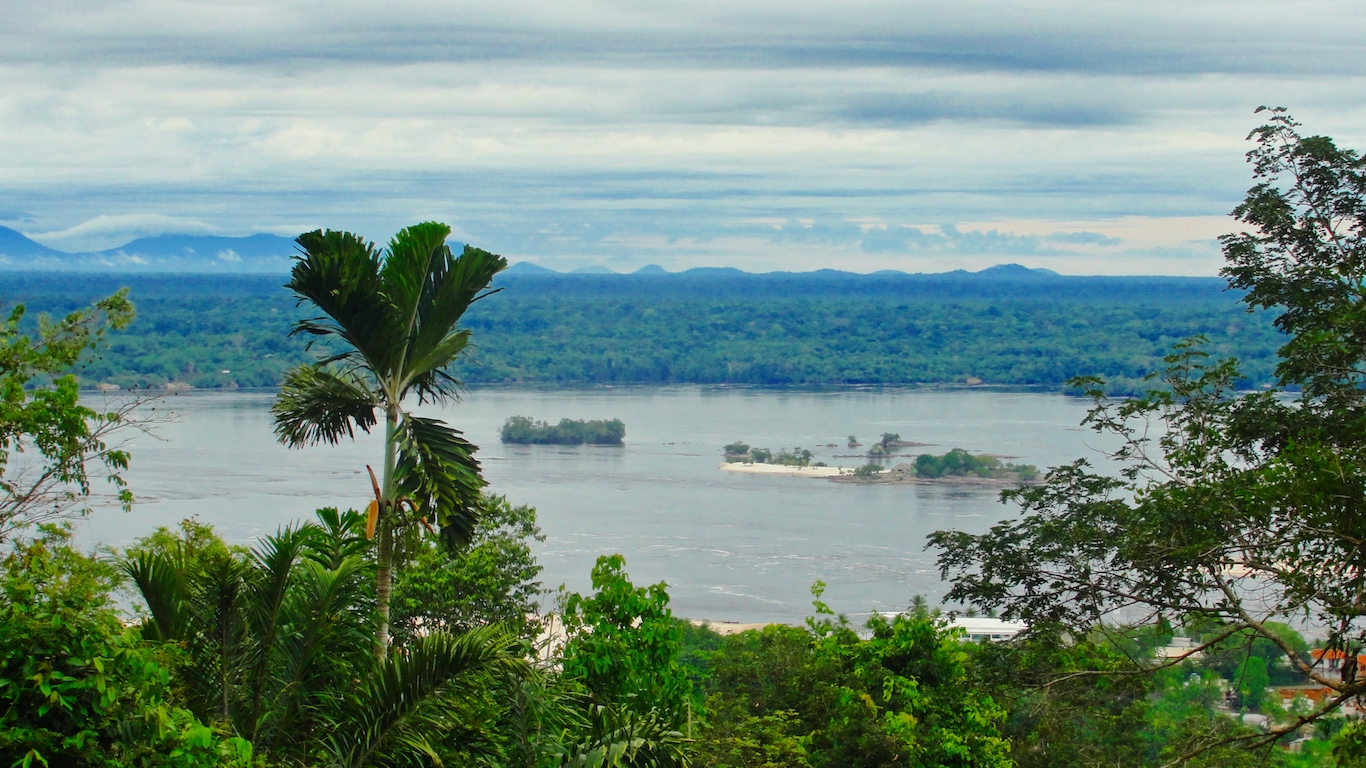
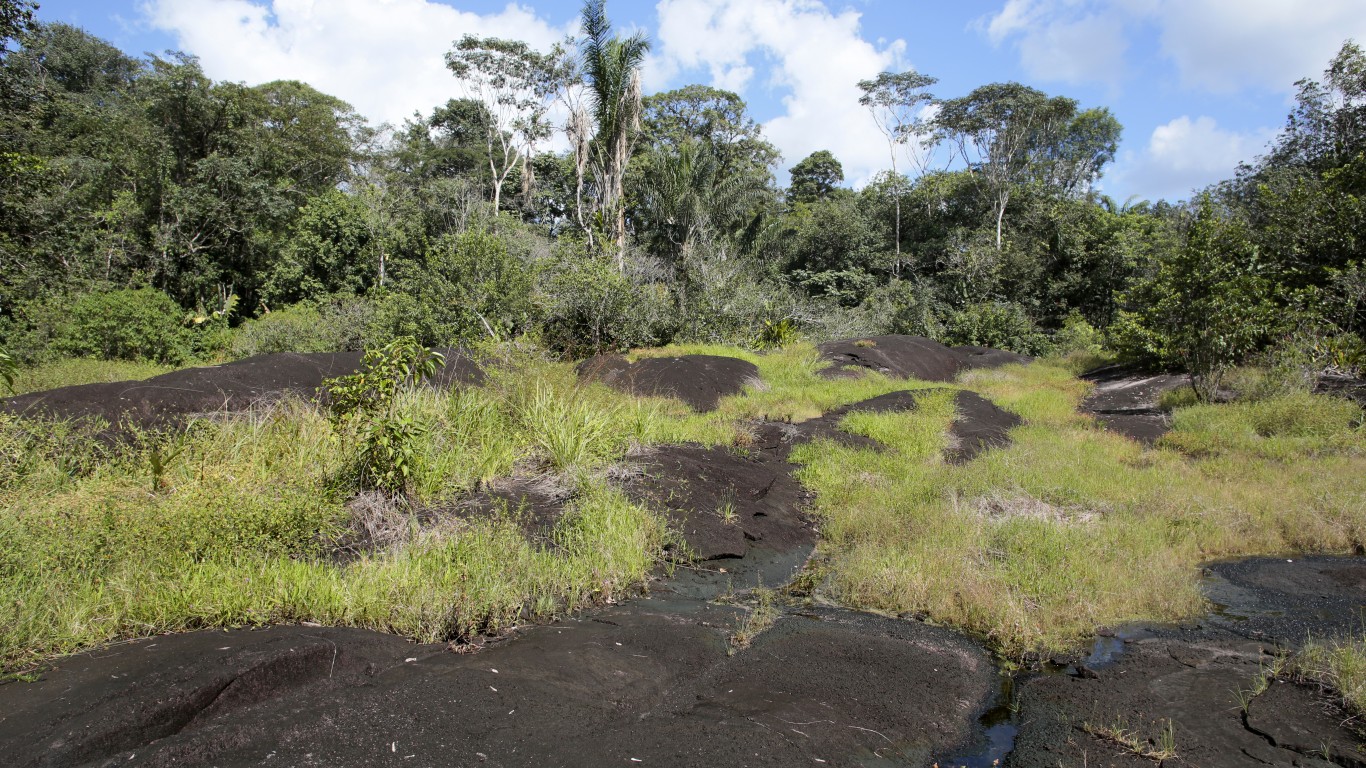
38. São Gabriel da Cachoeira, Brazil
> Annual average precipitation (22 years of data): 110.4 inches
> Rainiest year in database: 2002, 127.2 inches
> Rainiest month on average: May, 14.0 inches

37. Petaling Jaya, Malaysia
> Annual average precipitation (22 years of data): 110.6 inches
> Rainiest year in database: 2006, 136.1 inches
> Rainiest month on average: November, 14.5 inches
[in-text-ad-2]

36. Miri, Malaysia
> Annual average precipitation (22 years of data): 111.8 inches
> Rainiest year in database: 2018, 128.7 inches
> Rainiest month on average: December, 13.8 inches
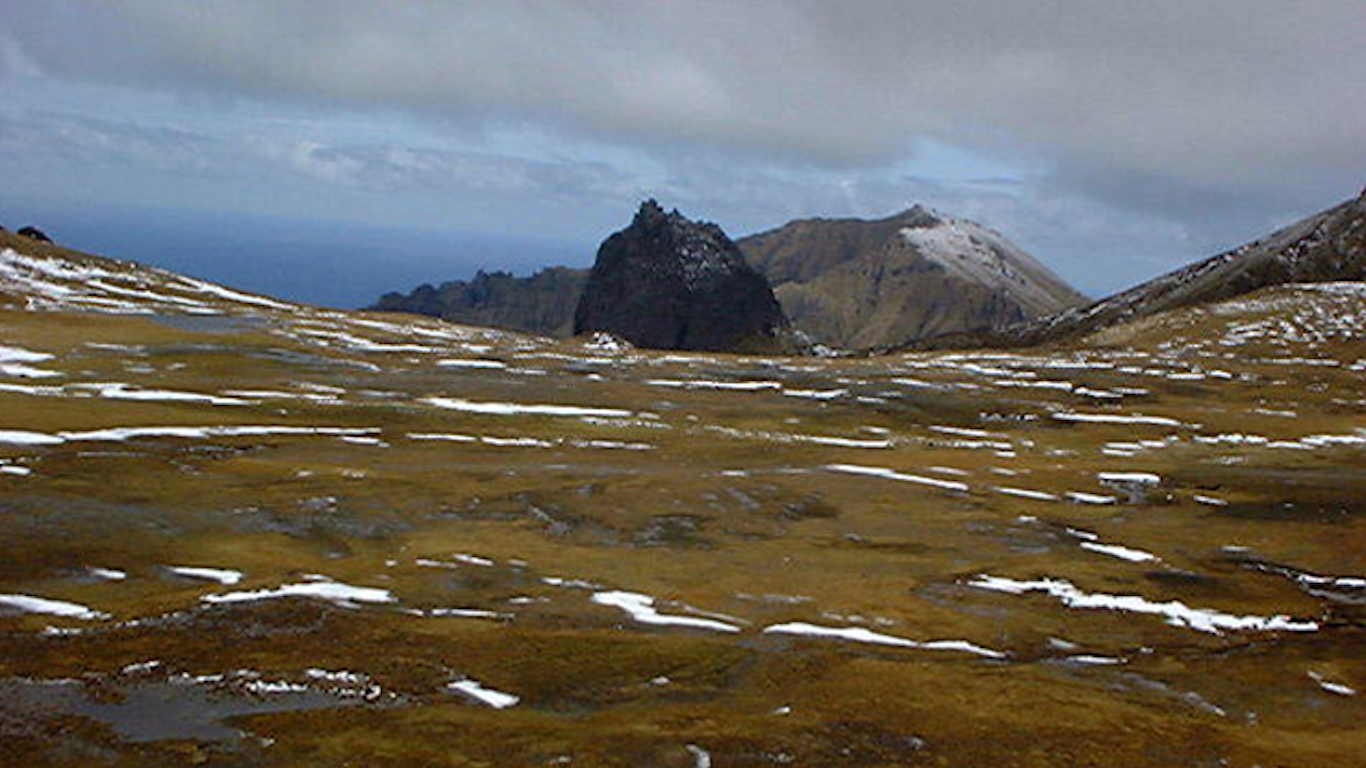
35. Gough (island), South Africa
> Annual average precipitation (22 years of data): 113.7 inches
> Rainiest year in database: 1997, 140.8 inches
> Rainiest month on average: June, 13.0 inches
[in-text-ad]

34. Panaji, India
> Annual average precipitation (22 years of data): 113.9 inches
> Rainiest year in database: 2007, 145.3 inches
> Rainiest month on average: June, 36.3 inches
 24/7 Wall St.
33. Baguio, Philippines
> Annual average precipitation (22 years of data): 114.0 inches
> Rainiest year in database: 2009, 241.6 inches
> Rainiest month on average: August, 36.7 inches
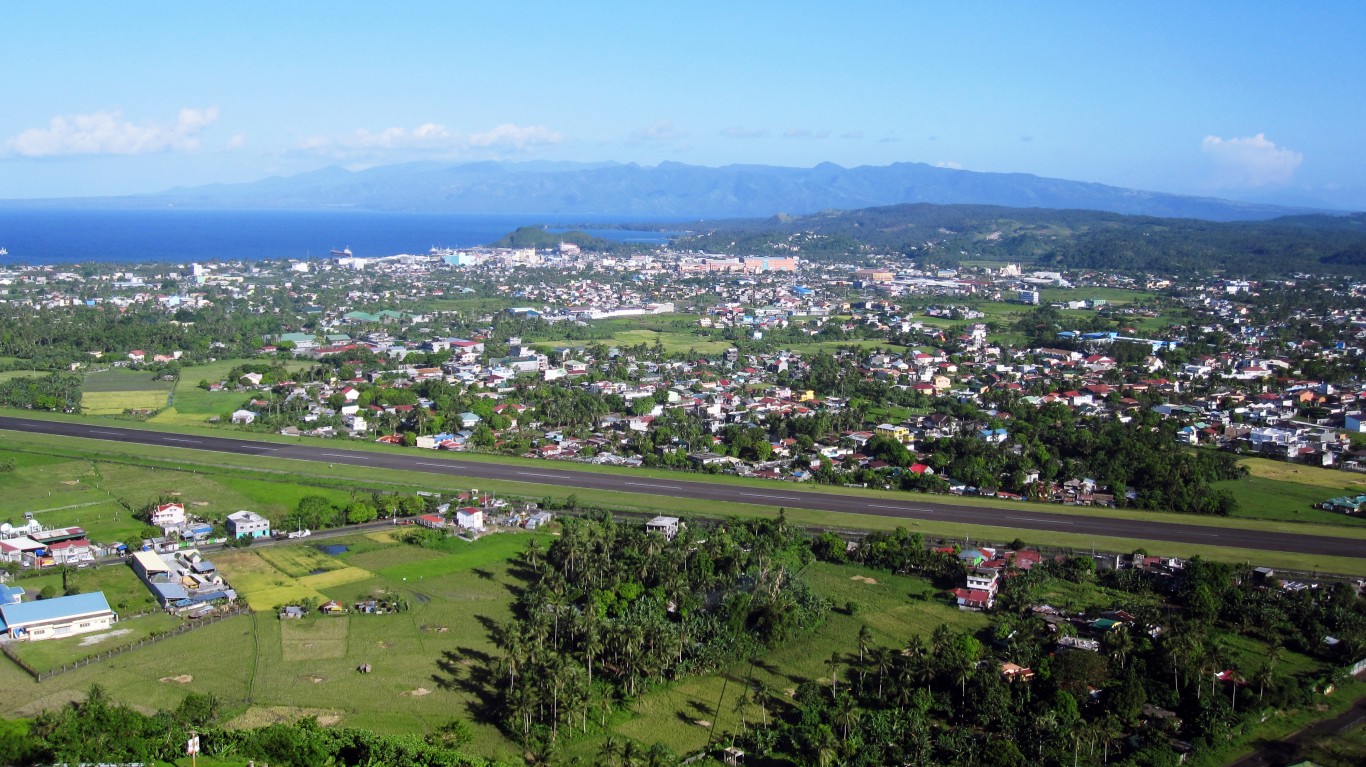
32. Legazpi City, Philippines
> Annual average precipitation (22 years of data): 114.5 inches
> Rainiest year in database: 2008, 168.5 inches
> Rainiest month on average: December, 24.4 inches
[in-text-ad-2]
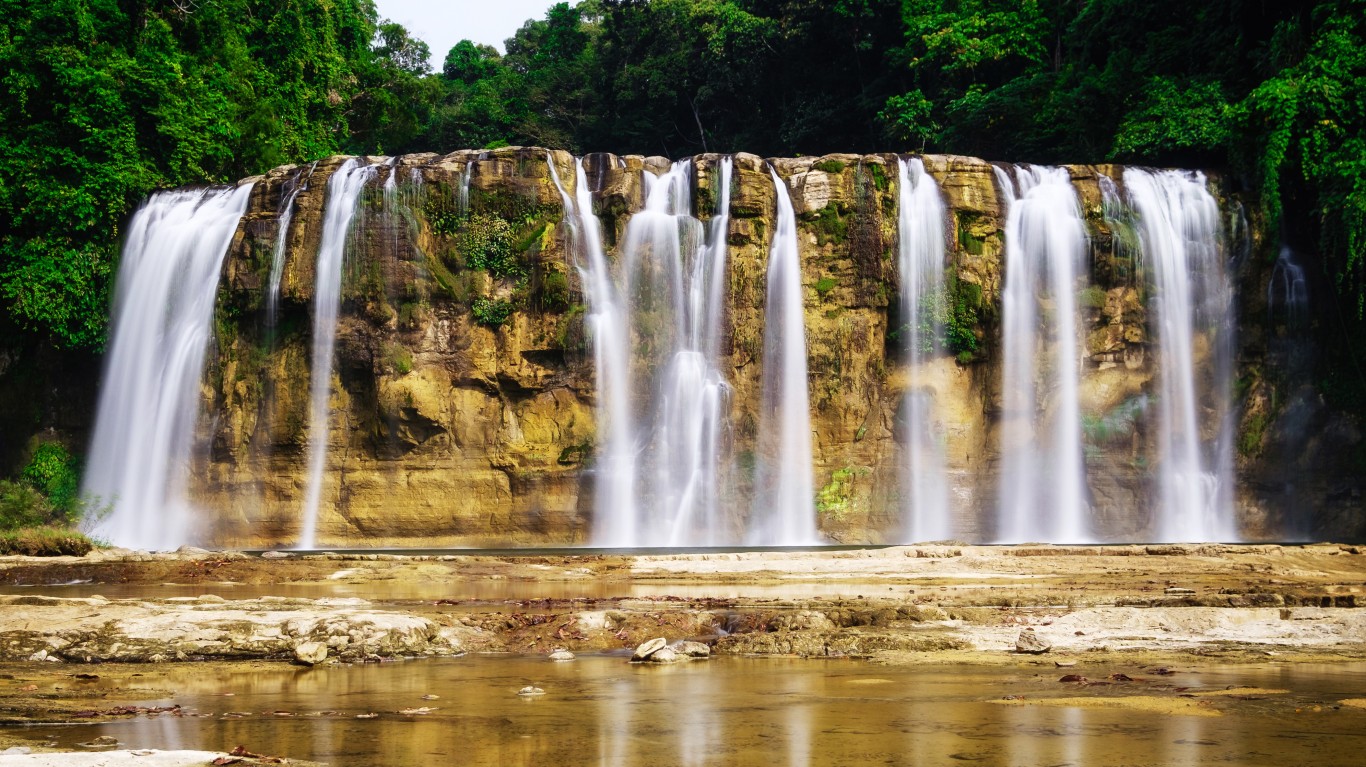
31. Surigao, Philippines
> Annual average precipitation (22 years of data): 114.6 inches
> Rainiest year in database: 2017, 174.7 inches
> Rainiest month on average: January, 28.3 inches

30. Kuantan, Malaysia
> Annual average precipitation (22 years of data): 115.1 inches
> Rainiest year in database: 2003, 149.4 inches
> Rainiest month on average: December, 28.8 inches
[in-text-ad]
29. Amami, Japan
> Annual average precipitation (22 years of data): 116.8 inches
> Rainiest year in database: 1998, 173.5 inches
> Rainiest month on average: June, 17.3 inches
 24/7 Wall St.
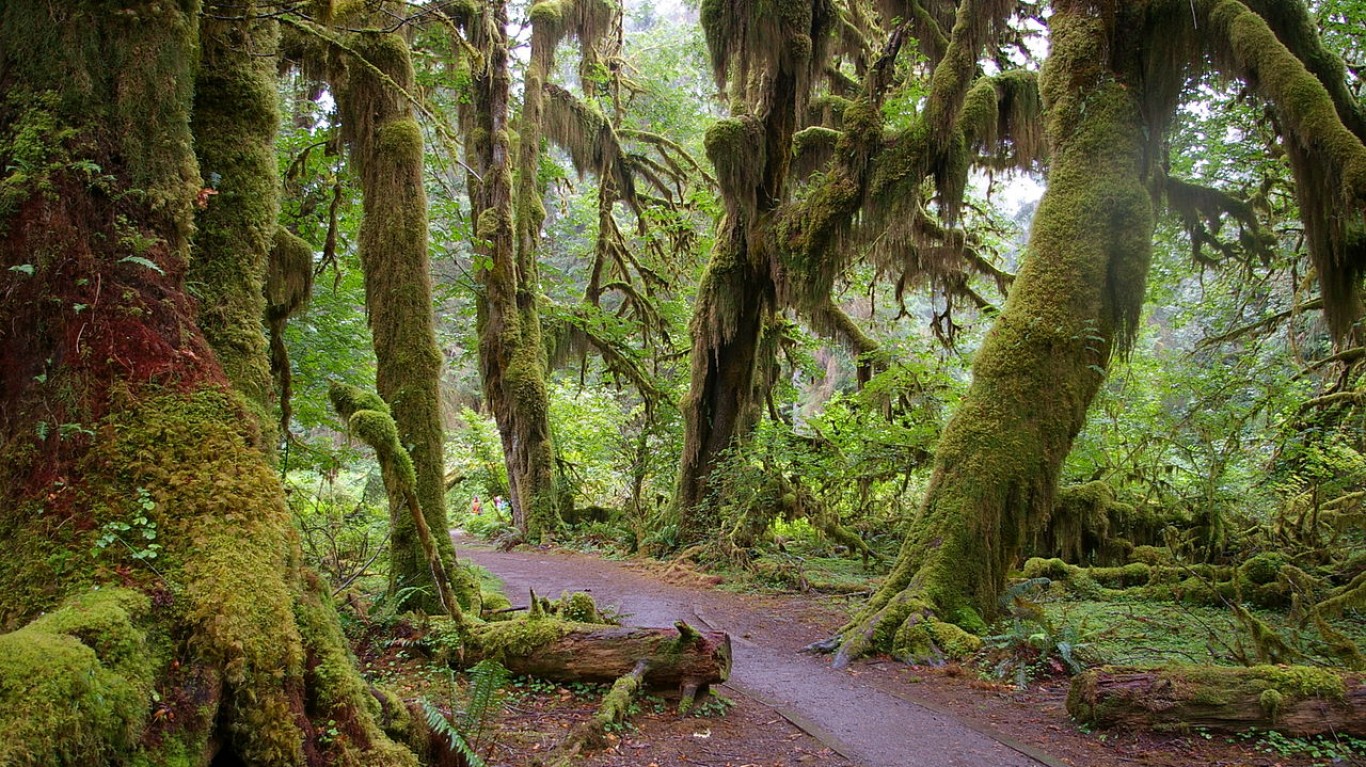
28. Forks, WA, United States Of America
> Annual average precipitation (10 years of data): 117.2 inches
> Rainiest year in database: 1997, 162.2 inches
> Rainiest month on average: January, 21.0 inches

27. Andaman and Nicobar Islands, India
> Annual average precipitation (22 years of data): 118.2 inches
> Rainiest year in database: 2008, 163.5 inches
> Rainiest month on average: September, 19.6 inches
[in-text-ad-2]
26. Kozhikode, India
> Annual average precipitation (22 years of data): 118.3 inches
> Rainiest year in database: 2007, 170.9 inches
> Rainiest month on average: June, 30.9 inches
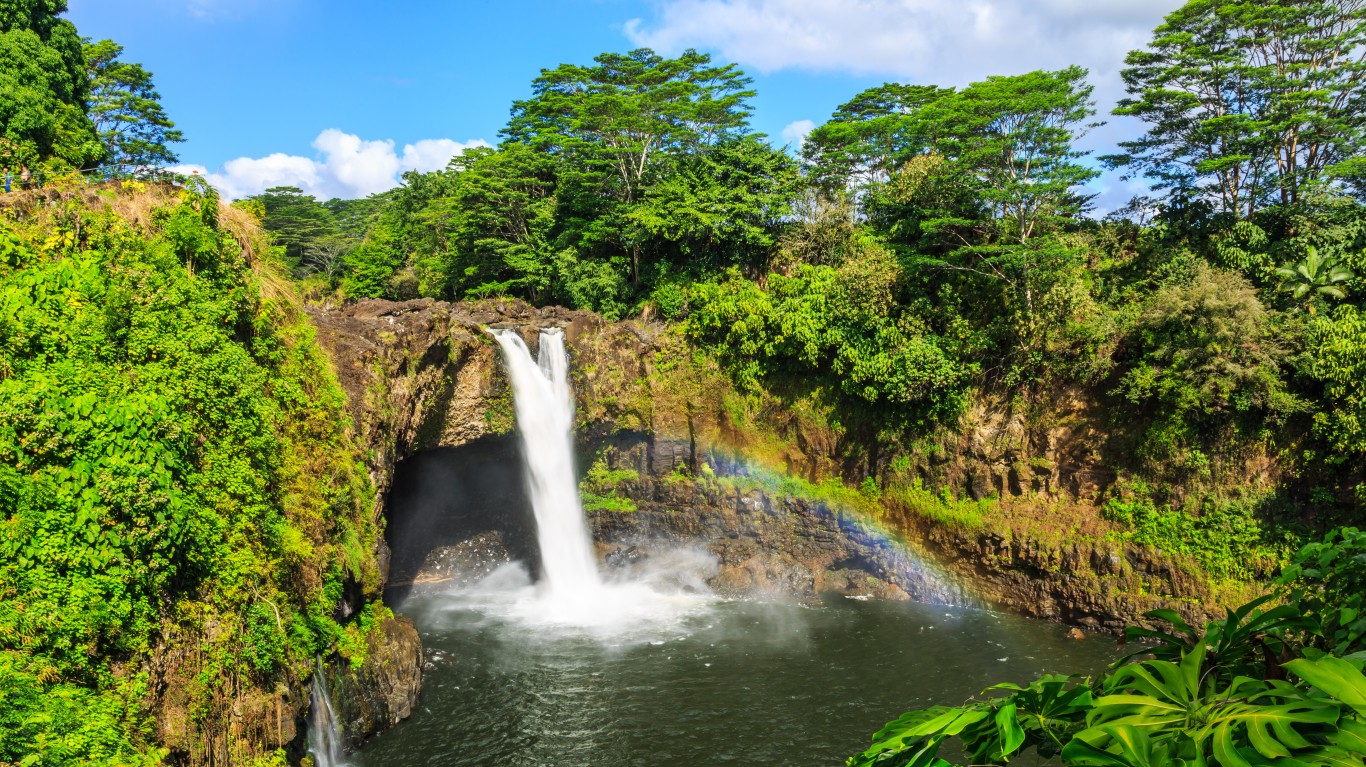
25. Hilo, Hi, United States Of America
> Annual average precipitation (22 years of data): 118.5 inches
> Rainiest year in database: 2018, 172.0 inches
> Rainiest month on average: November, 13.7 inches
[in-text-ad]

24. Leticia, Colombia
> Annual average precipitation (22 years of data): 119.4 inches
> Rainiest year in database: 2014, 155.0 inches
> Rainiest month on average: January, 15.3 inches
23. Rotuma island, Fiji
> Annual average precipitation (22 years of data): 120.9 inches
> Rainiest year in database: 2006, 172.4 inches
> Rainiest month on average: January, 14.3 inches
22. Colonia, Federated States Of Micronesia
> Annual average precipitation (22 years of data): 123.1 inches
> Rainiest year in database: 2011, 158.7 inches
> Rainiest month on average: August, 15.7 inches
[in-text-ad-2]
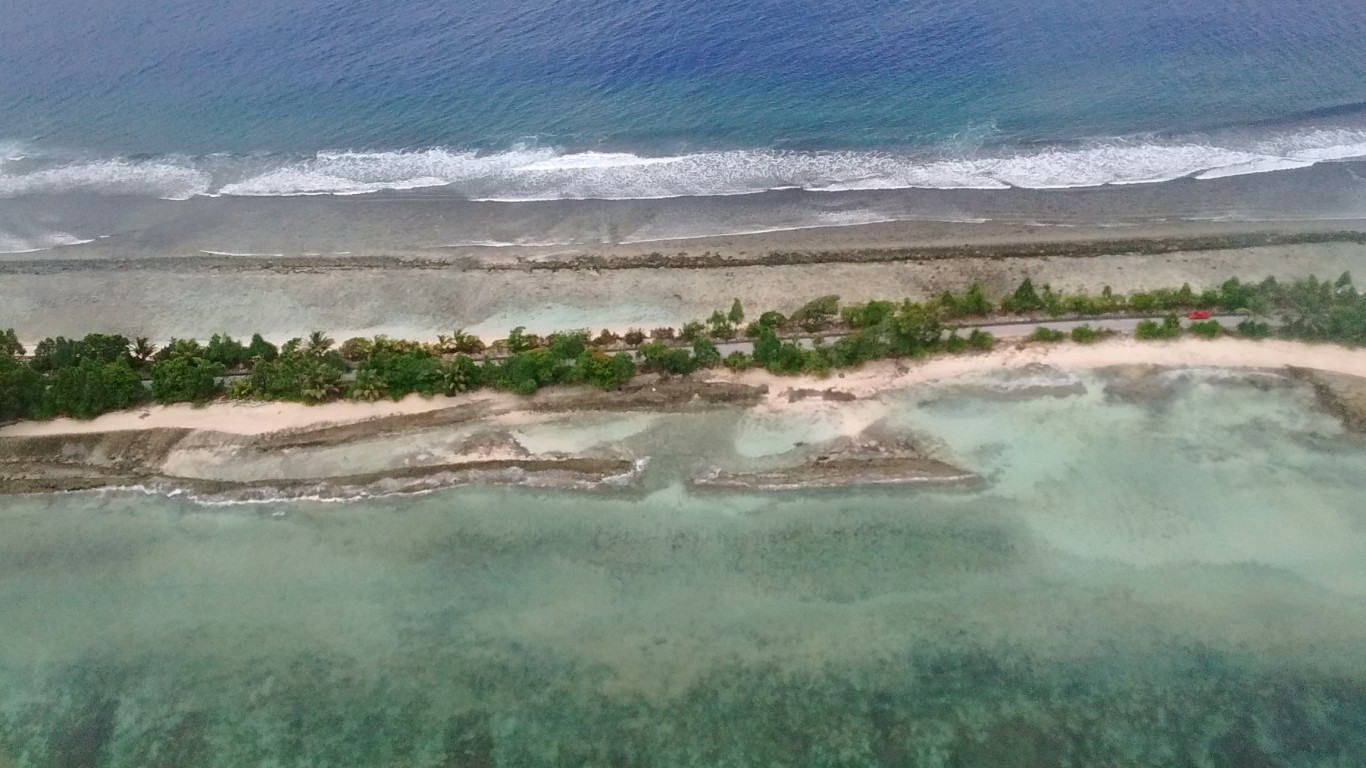
21. Majuro (island), Marshall Islands
> Annual average precipitation (22 years of data): 124.9 inches
> Rainiest year in database: 2018, 171.7 inches
> Rainiest month on average: October, 13.4 inches

20. Juneau, AK, United States Of America
> Annual average precipitation (22 years of data): 125.1 inches
> Rainiest year in database: 2005, 161.9 inches
> Rainiest month on average: September, 18.5 inches
[in-text-ad]

19. Sandakan, Malaysia
> Annual average precipitation (22 years of data): 126.3 inches
> Rainiest year in database: 2011, 212.5 inches
> Rainiest month on average: January, 18.3 inches

18. Limón, Costa Rica
> Annual average precipitation (22 years of data): 126.9 inches
> Rainiest year in database: 2004, 178.3 inches
> Rainiest month on average: December, 17.6 inches

17. Hachijō, Japan
> Annual average precipitation (22 years of data): 127.1 inches
> Rainiest year in database: 1998, 181.4 inches
> Rainiest month on average: October, 16.9 inches
[in-text-ad-2]
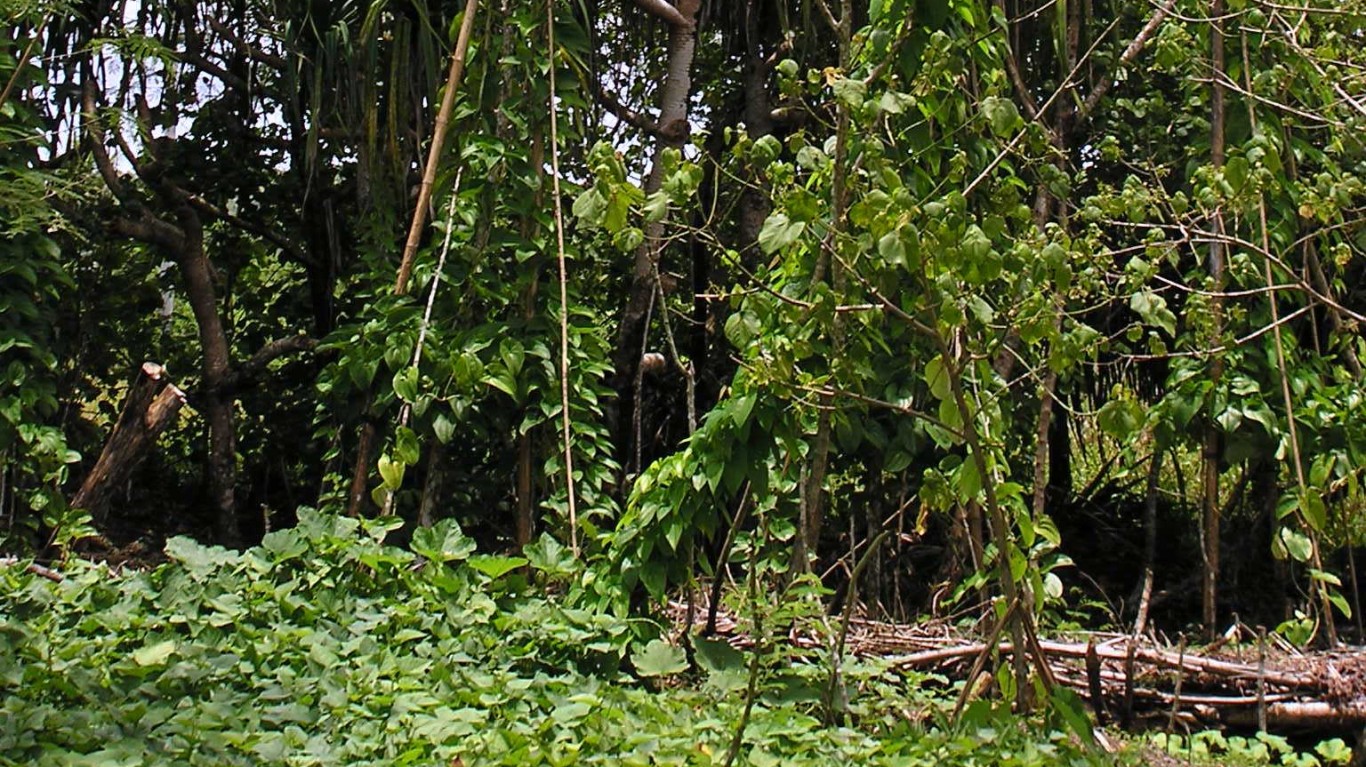
16. Nukuoro Atoll, Federated States Of Micronesia
> Annual average precipitation (9 years of data): 128.0 inches
> Rainiest year in database: 1999, 225.1 inches
> Rainiest month on average: March, 16.2 inches

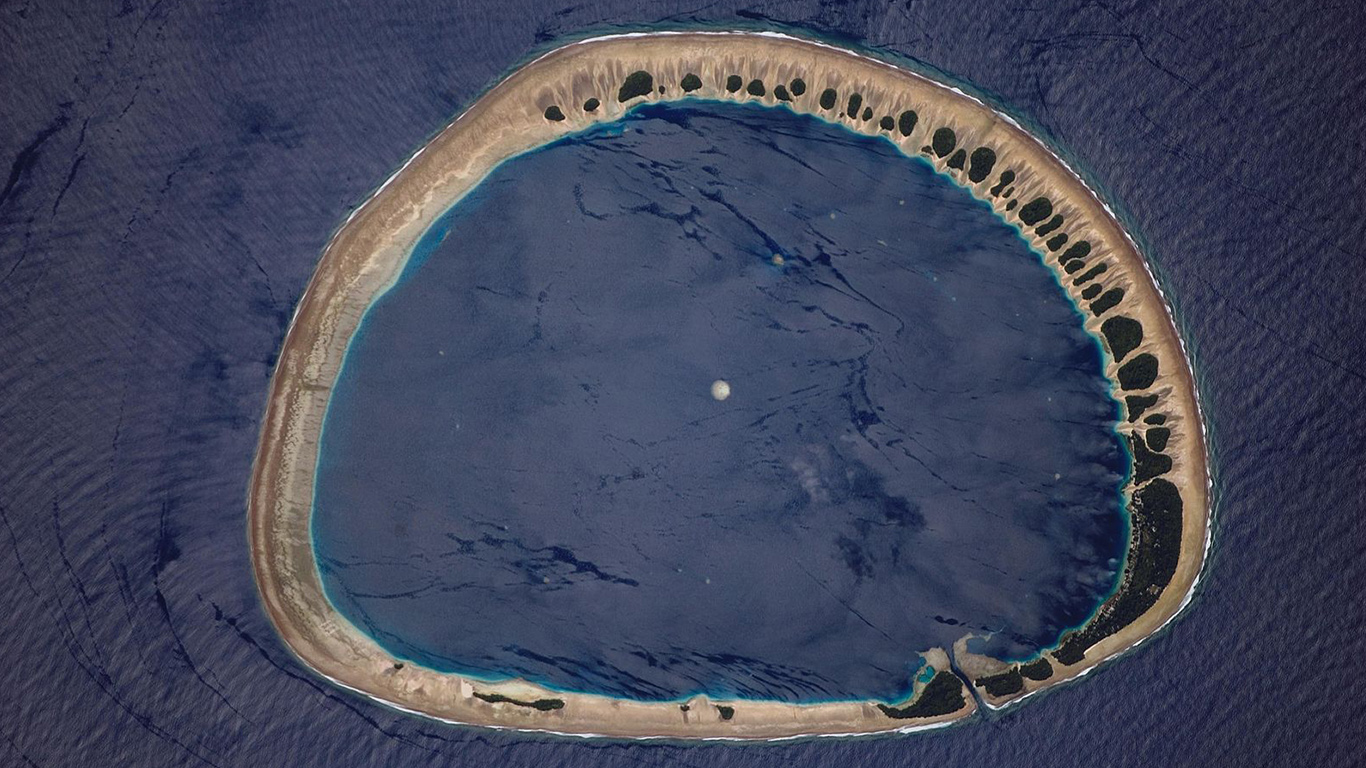
15. Pingelap Atoll, Federated States Of Micronesia
> Annual average precipitation (9 years of data): 128.6 inches
> Rainiest year in database: 1999, 220.3 inches
> Rainiest month on average: August, 17.1 inches
[in-text-ad]

14. Belém, Brazil
> Annual average precipitation (22 years of data): 128.8 inches
> Rainiest year in database: 2018, 150.8 inches
> Rainiest month on average: March, 19.5 inches
 24/7 Wall St.
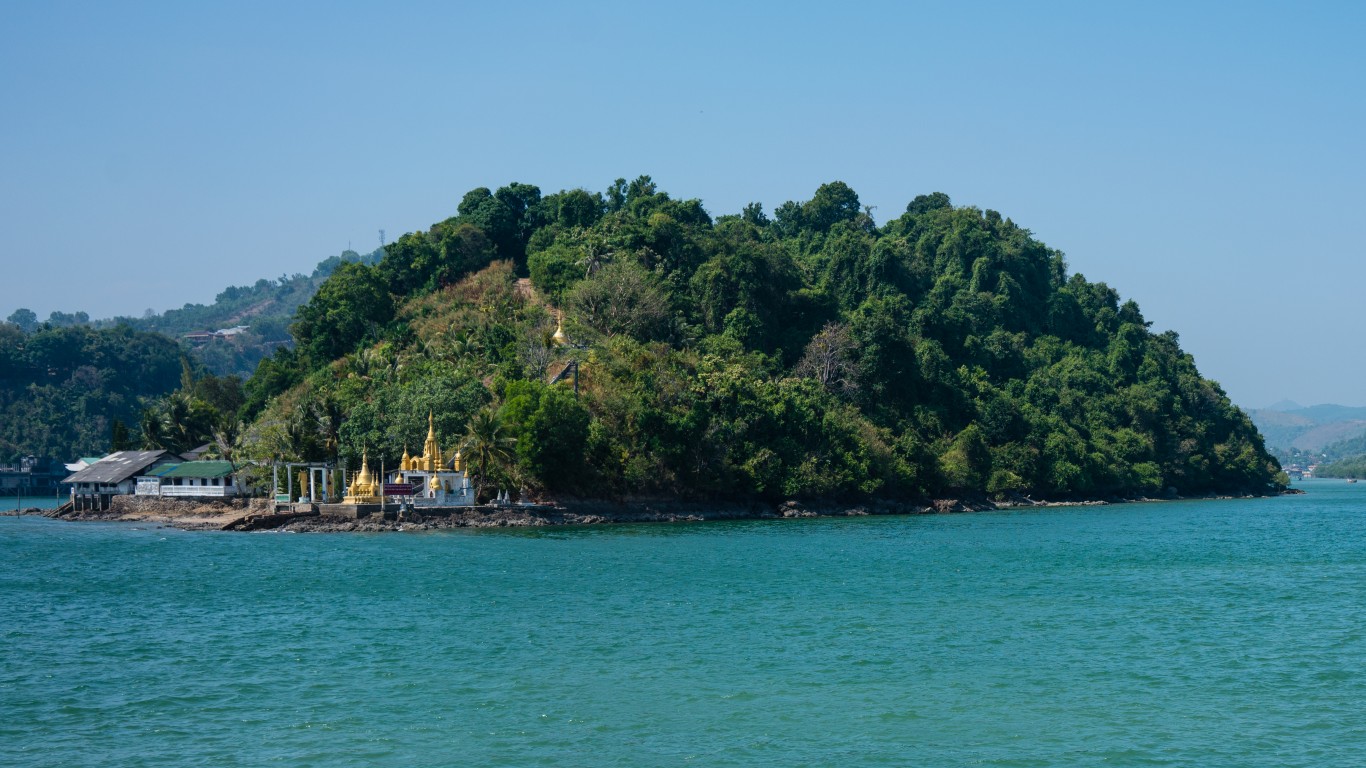
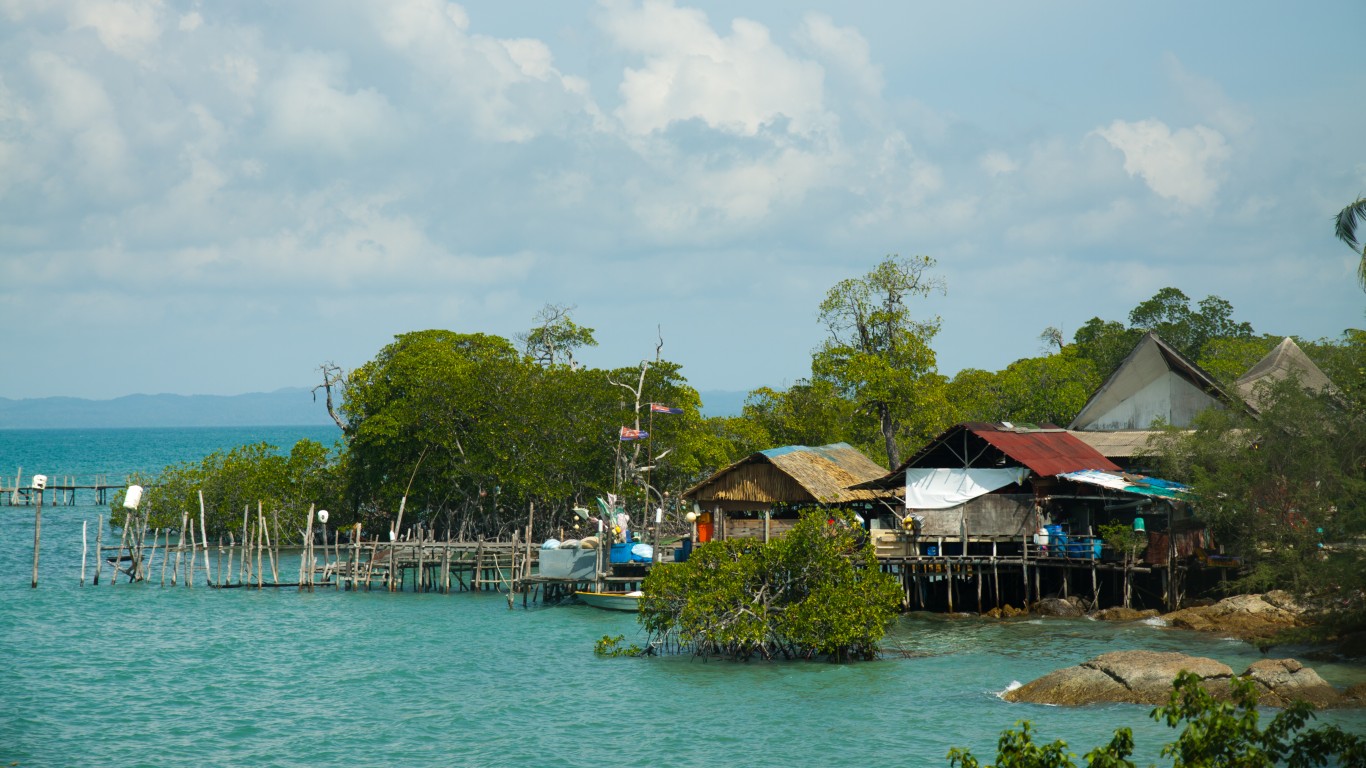
13. Kawthoung, Myanmar
> Annual average precipitation (9 years of data): 131.8 inches
> Rainiest year in database: 2013, 194.3 inches
> Rainiest month on average: July, 36.7 inches
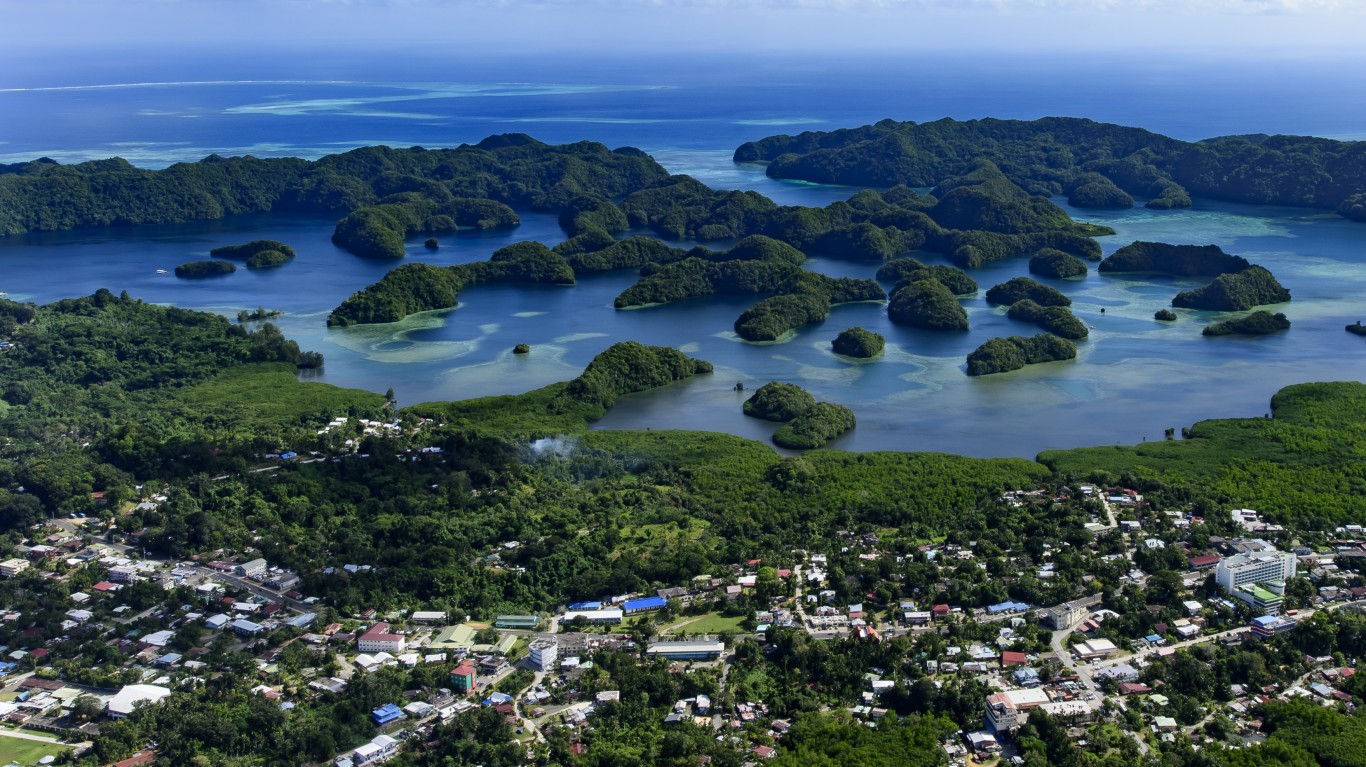
12. Koror Island, Belau
> Annual average precipitation (22 years of data): 133.5 inches
> Rainiest year in database: 2011, 190.0 inches
> Rainiest month on average: June, 16.2 inches
[in-text-ad-2]

11. Innisfail, Australia
> Annual average precipitation (9 years of data): 138.4 inches
> Rainiest year in database: 1999, 227.8 inches
> Rainiest month on average: March, 23.5 inches

10. Cayenne, French Guiana
> Annual average precipitation (22 years of data): 139.8 inches
> Rainiest year in database: 2006, 173.1 inches
> Rainiest month on average: May, 23.4 inches
[in-text-ad]
9. Sibu, Malaysia
> Annual average precipitation (22 years of data): 140.3 inches
> Rainiest year in database: 2016, 192.8 inches
> Rainiest month on average: January, 19.0 inches

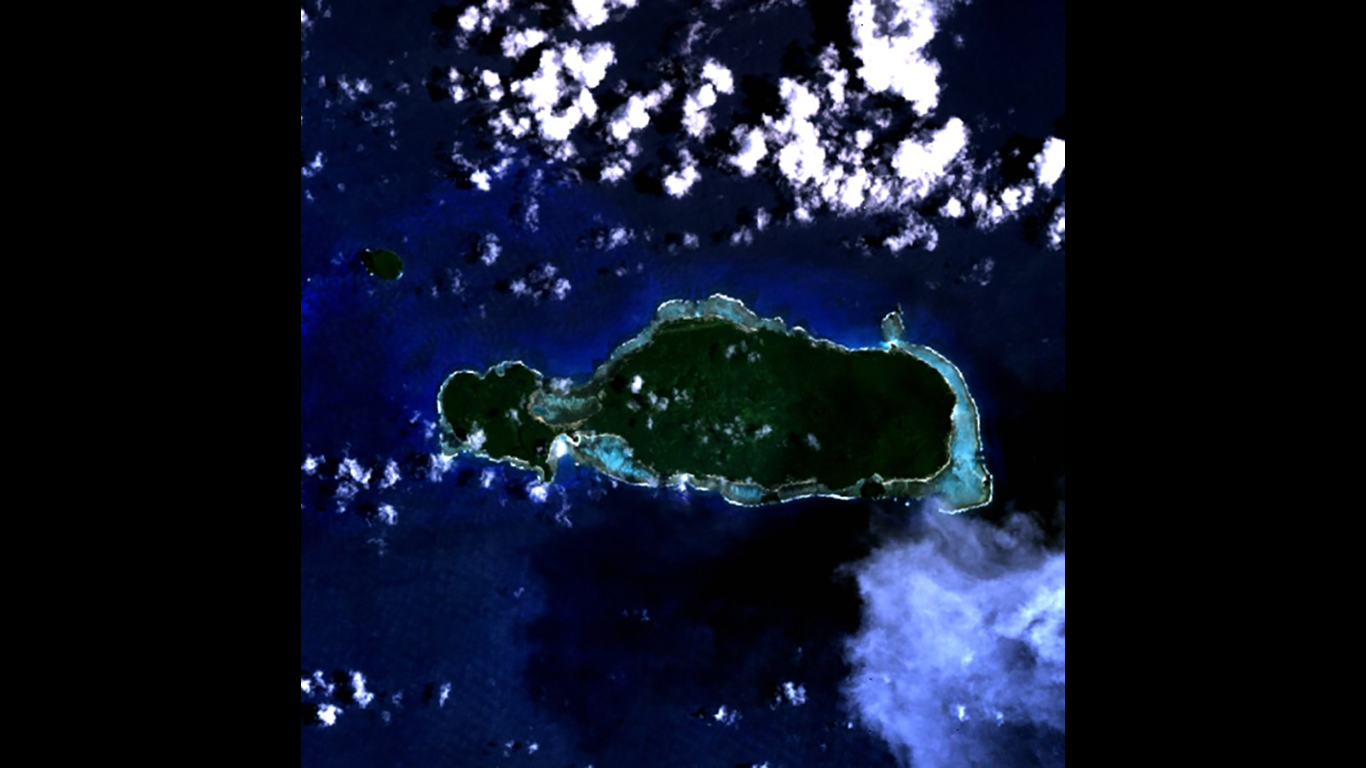
8. Fono Island, Federated States Of Micronesia
> Annual average precipitation (22 years of data): 140.5 inches
> Rainiest year in database: 2002, 171.0 inches
> Rainiest month on average: September, 14.9 inches

7. Sittwe, Myanmar
> Annual average precipitation (11 years of data): 145.9 inches
> Rainiest year in database: 2004, 224.0 inches
> Rainiest month on average: July, 52.5 inches
[in-text-ad-2]

6. Villavicencio, Colombia
> Annual average precipitation (22 years of data): 147.6 inches
> Rainiest year in database: 2010, 202.1 inches
> Rainiest month on average: May, 23.3 inches

5. Bintulu, Malaysia
> Annual average precipitation (22 years of data): 153.2 inches
> Rainiest year in database: 2008, 212.0 inches
> Rainiest month on average: January, 19.8 inches
[in-text-ad]
4. Taman Desa Wira, Malaysia
> Annual average precipitation (22 years of data): 166.2 inches
> Rainiest year in database: 2003, 206.7 inches
> Rainiest month on average: January, 27.3 inches
 24/7 Wall St.
3. Kolonia, Federated States Of Micronesia
> Annual average precipitation (22 years of data): 168.7 inches
> Rainiest year in database: 2018, 209.0 inches
> Rainiest month on average: April, 17.5 inches
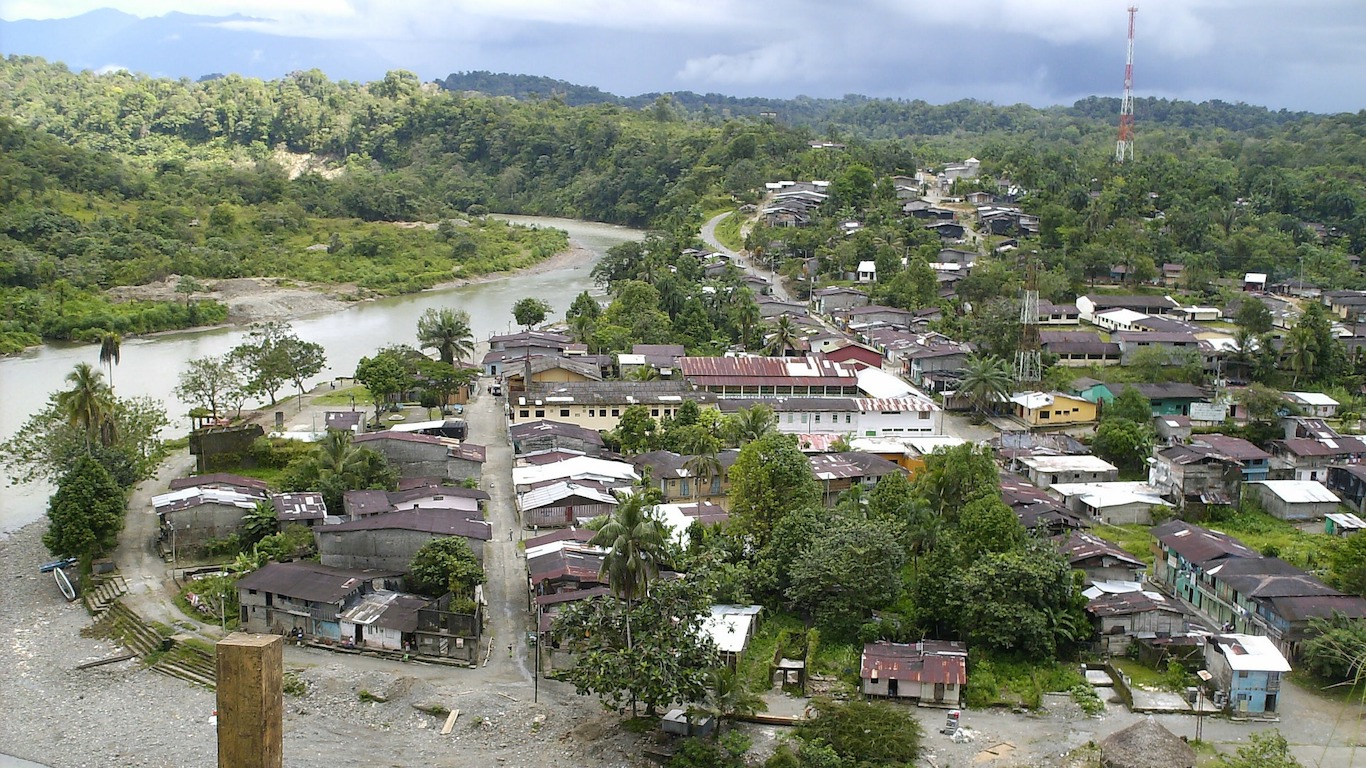
2. Bagadó, Colombia
> Annual average precipitation (9 years of data): 258.9 inches
> Rainiest year in database: 2000, 344.9 inches
> Rainiest month on average: August, 34.6 inches
[in-text-ad-2]
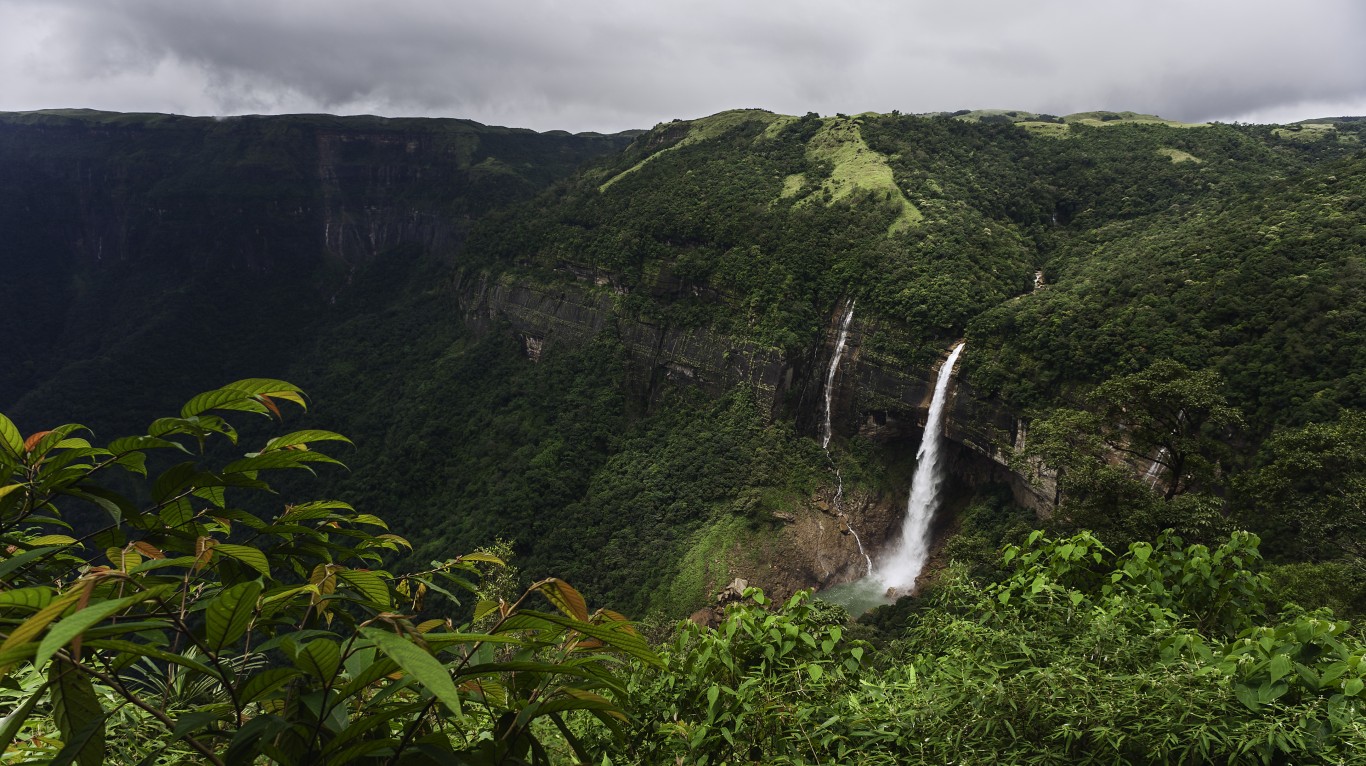
1. Cherrapunji, India
> Annual average precipitation (22 years of data): 382.2 inches
> Rainiest year in database: 2010, 530.4 inches
> Rainiest month on average: July, 97.2 inches
It’s Your Money, Your Future—Own It (sponsor)
Retirement can be daunting, but it doesn’t need to be.
Imagine having an expert in your corner to help you with your financial goals. Someone to help you determine if you’re ahead, behind, or right on track. With SmartAsset, that’s not just a dream—it’s reality. This free tool connects you with pre-screened financial advisors who work in your best interests. It’s quick, it’s easy, so take the leap today and start planning smarter!
Don’t waste another minute; get started right here and help your retirement dreams become a retirement reality.
Thank you for reading! Have some feedback for us?
Contact the 24/7 Wall St. editorial team.
Latest from 24/7


Our expert who first called NVIDIA in 2009 is predicting 2025 will see a historic AI breakthrough.
You can follow him investing $500,000 of his own money on our top AI stocks for free.