Special Report
States With the Strongest and Weakest Unions

Published:
Last Updated:

The share of American workers in unions fell once again in 2018, from 10.7% in 2017 to 10.5%. The decline is part of a much longer-term trend of the slow and steady disintegration of organized labor in the United States. In 1983, according to the Bureau of Labor Statistics, 20.1% of American workers were union members.
Labor unions exist to increase the collective bargaining power of their members to negotiate higher wages and better benefits. And historically, they have done just that. According to the Bureau of Labor Statistics, the typical non-union worker earns just under 80% of the wages of the typical unionized worker on a weekly basis. Labor unions have also helped to greatly improve benefits and reduce pay inequality along racial and gender lines.
While unions provide some benefits to workers, anti-union advocates argue that unions stifle economic growth, limit corporate competitiveness, and unfairly pass higher costs down to the consumer or taxpayer. They argue that states that have passed right-to-work legislation — laws that prohibit unions from requiring workers in certain trades to be due-paying members — are better states for business. Currently, 27 states have passed right-to-work laws.
Labor unions are an inherently political issue, and some states are more likely to be receptive to collective bargaining than others. 24/7 Wall St. reviewed data from the Bureau of Labor Statistics to identify the states where union membership is the strongest and the weakest.
The public sector is much more heavily unionized than the private sector — 33.9% of public-sector workers are union members compared to 6.4% of those in the private sector. For this reason, states where government employment represents a larger share of total workers tend to have stronger overall union representation.
Methodology
Based on figures published by Unionstats.com, an online union membership and coverage database, 24/7 Wall St. identified the states with the highest and lowest union membership as a percentage of total employment. The database, which analyzes Bureau of Labor Statistics’ Current Population Survey, provides labor force and union membership figures in both the public and private sectors. Annual average wages by state came from Bureau of Economic Analysis. Rates of change in union membership were calculated over the period of 2008 to 2018.
Click here to see the states with the strongest and weakest unions.

1. Hawaii
> Pct. of workers in unions: 23.1%
> Change in union membership (2008-2018): -1.2 ppt. (25th largest decrease)
> Union workers: 138,854 (24th fewest)
> Avg. annual wage: $50,968 (22nd highest)
[in-text-ad]

2. New York
> Pct. of workers in unions: 22.3%
> Change in union membership (2008-2018): -2.6 ppt. (15th largest decrease)
> Union workers: 1,873,880 (2nd most)
> Avg. annual wage: $69,947 (the highest)

3. Washington
> Pct. of workers in unions: 19.8%
> Change in union membership (2008-2018): unchanged
> Union workers: 648,139 (5th most)
> Avg. annual wage: $61,893 (6th highest)

4. Alaska
> Pct. of workers in unions: 18.4%
> Change in union membership (2008-2018): -5.1 ppt. (2nd largest decrease)
> Union workers: 55,148 (8th fewest)
> Avg. annual wage: $57,052 (11th highest)
[in-text-ad-2]

5. Rhode Island
> Pct. of workers in unions: 17.3%
> Change in union membership (2008-2018): +0.8 ppt. (2nd largest increase)
> Union workers: 83,165 (18th fewest)
> Avg. annual wage: $53,408 (16th highest)

6. Connecticut
> Pct. of workers in unions: 15.9%
> Change in union membership (2008-2018): -1.0 ppt. (11th smallest decrease)
> Union workers: 267,222 (16th most)
> Avg. annual wage: $65,748 (4th highest)
[in-text-ad]

7. Minnesota
> Pct. of workers in unions: 15.0%
> Change in union membership (2008-2018): -1.1 ppt. (13th smallest decrease)
> Union workers: 395,407 (12th most)
> Avg. annual wage: $55,310 (13th highest)

8. New Jersey
> Pct. of workers in unions: 14.9%
> Change in union membership (2008-2018): -3.4 ppt. (8th largest decrease)
> Union workers: 587,219 (8th most)
> Avg. annual wage: $63,563 (5th highest)

9. California
> Pct. of workers in unions: 14.7%
> Change in union membership (2008-2018): -3.7 ppt. (5th largest decrease)
> Union workers: 2,404,888 (the most)
> Avg. annual wage: $66,308 (3rd highest)
[in-text-ad-2]

10. Michigan
> Pct. of workers in unions: 14.5%
> Change in union membership (2008-2018): -4.3 ppt. (3rd largest decrease)
> Union workers: 624,598 (7th most)
> Avg. annual wage: $52,069 (19th highest)

11. Oregon
> Pct. of workers in unions: 13.9%
> Change in union membership (2008-2018): -2.7 ppt. (14th largest decrease)
> Union workers: 241,150 (18th most)
> Avg. annual wage: $51,951 (20th highest)
[in-text-ad]
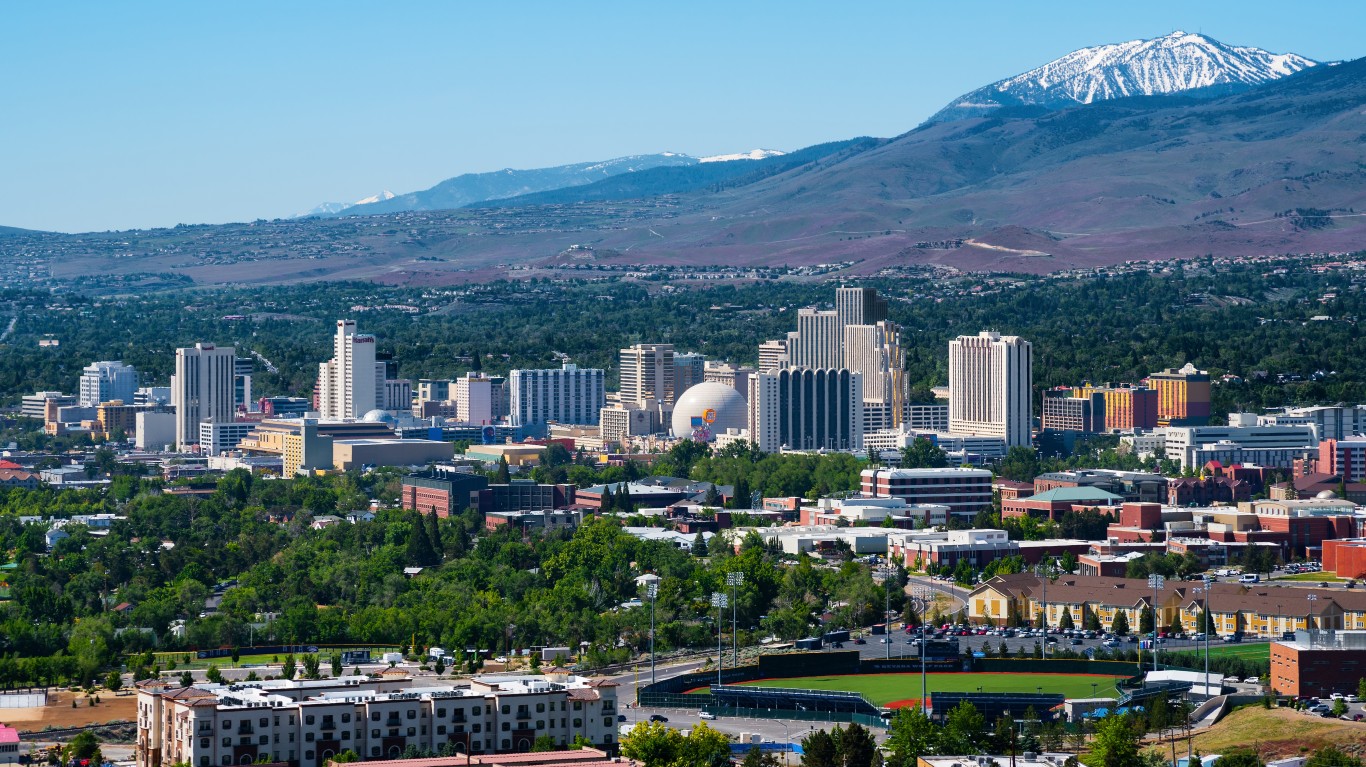
12. Nevada
> Pct. of workers in unions: 13.9%
> Change in union membership (2008-2018): -2.8 ppt. (13th largest decrease)
> Union workers: 190,774 (21st most)
> Avg. annual wage: $49,316 (24th lowest)

13. Illinois
> Pct. of workers in unions: 13.8%
> Change in union membership (2008-2018): -2.8 ppt. (12th largest decrease)
> Union workers: 785,966 (3rd most)
> Avg. annual wage: $59,191 (8th highest)

14. Massachusetts
> Pct. of workers in unions: 13.6%
> Change in union membership (2008-2018): -2.1 ppt. (17th largest decrease)
> Union workers: 462,739 (11th most)
> Avg. annual wage: $68,455 (2nd highest)
[in-text-ad-2]

15. Maine
> Pct. of workers in unions: 12.9%
> Change in union membership (2008-2018): +0.6 ppt. (4th largest increase)
> Union workers: 73,905 (17th fewest)
> Avg. annual wage: $45,053 (9th lowest)
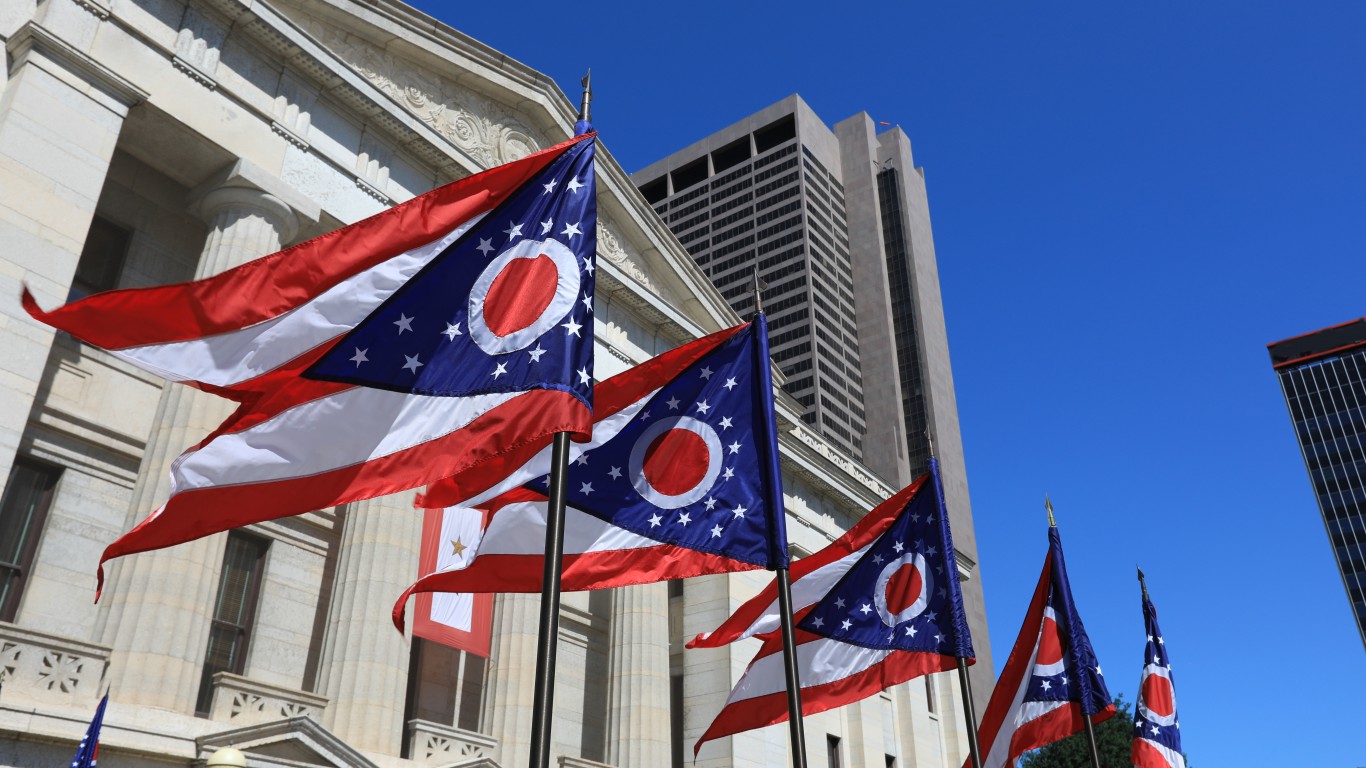
16. Ohio
> Pct. of workers in unions: 12.7%
> Change in union membership (2008-2018): -1.5 ppt. (22nd largest decrease)
> Union workers: 639,909 (6th most)
> Avg. annual wage: $49,988 (23rd highest)
[in-text-ad]

17. Pennsylvania
> Pct. of workers in unions: 12.5%
> Change in union membership (2008-2018): -2.9 ppt. (10th largest decrease)
> Union workers: 700,130 (4th most)
> Avg. annual wage: $52,865 (18th highest)

18. Montana
> Pct. of workers in unions: 11.8%
> Change in union membership (2008-2018): -0.4 ppt. (3rd smallest decrease)
> Union workers: 50,441 (7th fewest)
> Avg. annual wage: $42,133 (4th lowest)
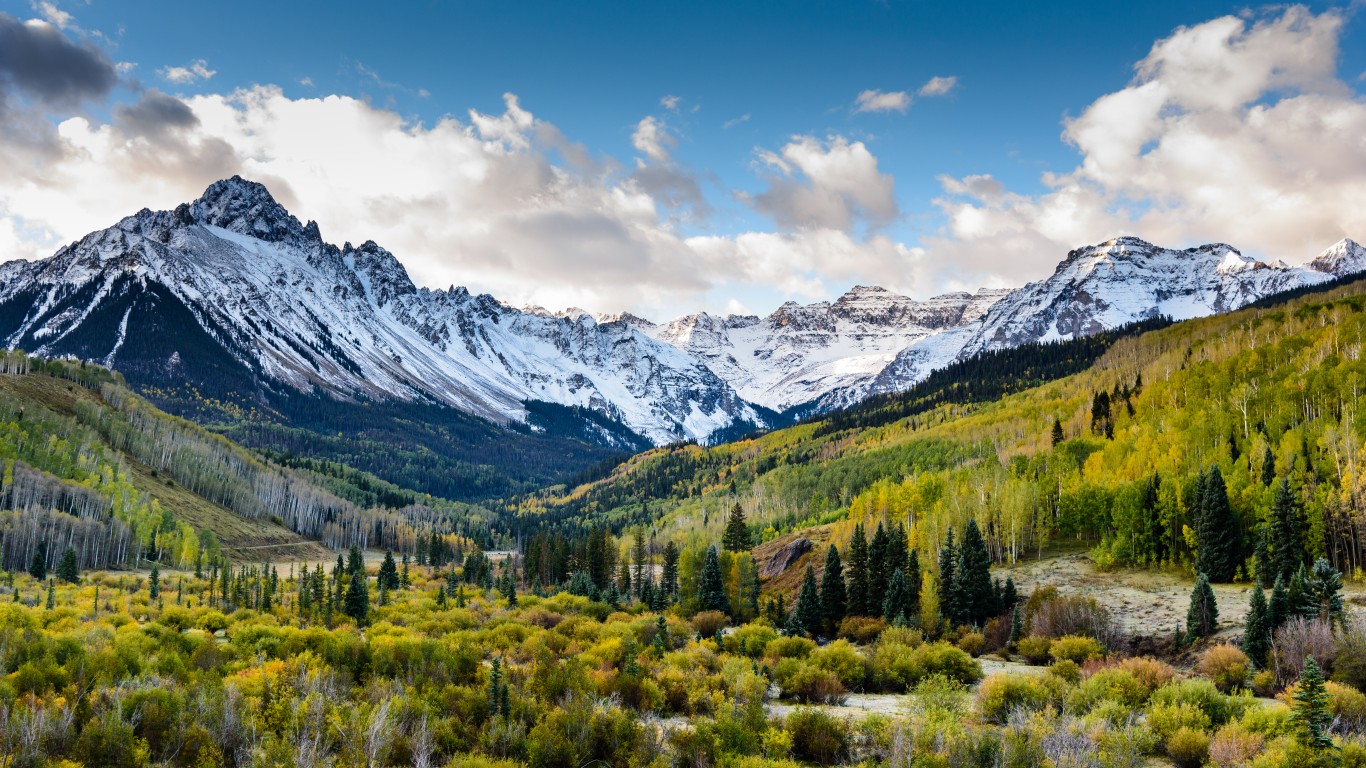
19. Colorado
> Pct. of workers in unions: 11.0%
> Change in union membership (2008-2018): +3.0 ppt. (the largest increase)
> Union workers: 281,098 (14th most)
> Avg. annual wage: $57,603 (10th highest)
[in-text-ad-2]

20. Maryland
> Pct. of workers in unions: 11.0%
> Change in union membership (2008-2018): -1.6 ppt. (21st largest decrease)
> Union workers: 306,318 (13th most)
> Avg. annual wage: $61,133 (7th highest)

21. Vermont
> Pct. of workers in unions: 10.5%
> Change in union membership (2008-2018): +0.1 ppt. (9th largest increase)
> Union workers: 30,619 (4th fewest)
> Avg. annual wage: $45,314 (12th lowest)
[in-text-ad]

22. Delaware
> Pct. of workers in unions: 10.3%
> Change in union membership (2008-2018): -3.1 ppt. (9th largest decrease)
> Union workers: 44,835 (6th fewest)
> Avg. annual wage: $55,134 (14th highest)

23. New Hampshire
> Pct. of workers in unions: 10.2%
> Change in union membership (2008-2018): -0.4 ppt. (4th smallest decrease)
> Union workers: 67,707 (15th fewest)
> Avg. annual wage: $54,319 (15th highest)

24. West Virginia
> Pct. of workers in unions: 10.0%
> Change in union membership (2008-2018): -3.8 ppt. (4th largest decrease)
> Union workers: 68,464 (16th fewest)
> Avg. annual wage: $42,871 (5th lowest)
[in-text-ad-2]

25. Missouri
> Pct. of workers in unions: 9.4%
> Change in union membership (2008-2018): -1.8 ppt. (18th largest decrease)
> Union workers: 251,770 (17th most)
> Avg. annual wage: $48,525 (23rd lowest)
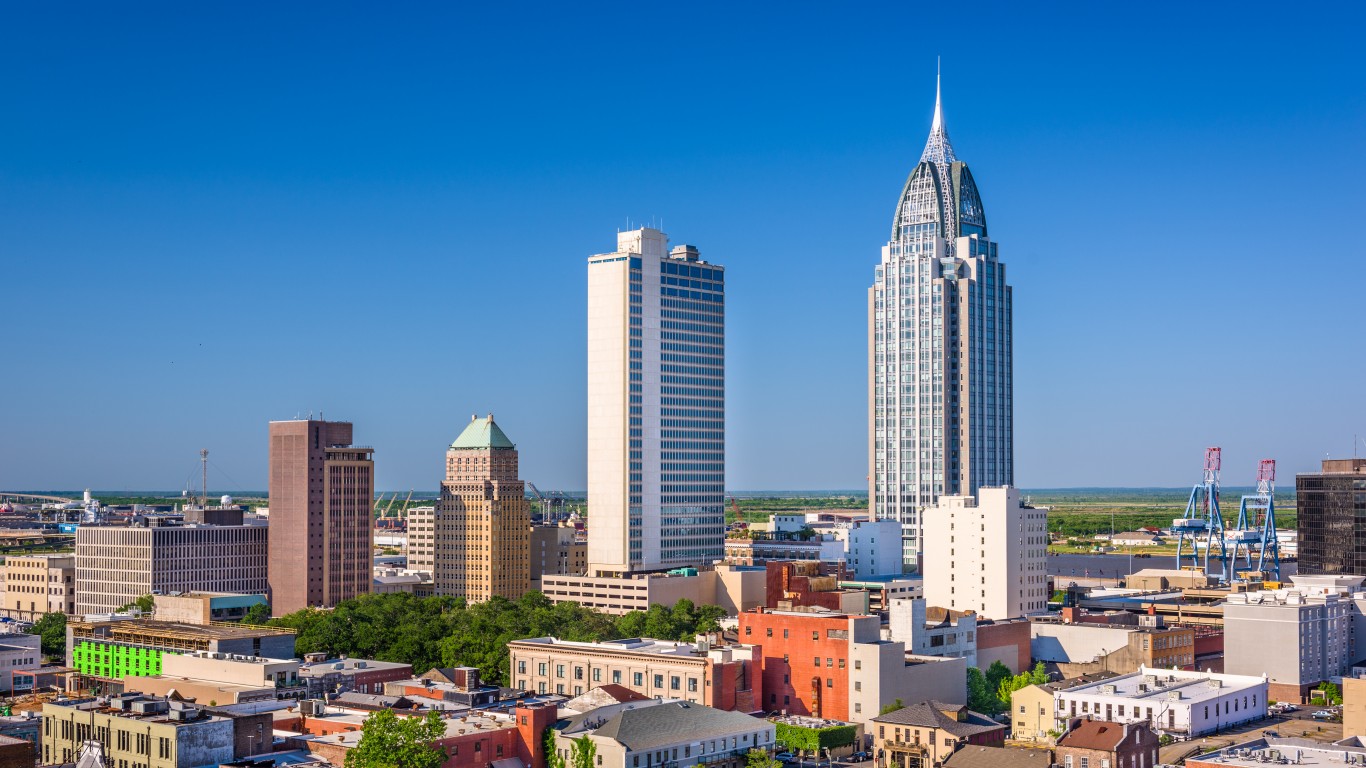
26. Alabama
> Pct. of workers in unions: 9.3%
> Change in union membership (2008-2018): -0.5 ppt. (6th smallest decrease)
> Union workers: 180,645 (22nd most)
> Avg. annual wage: $45,308 (11th lowest)
[in-text-ad]

27. Kentucky
> Pct. of workers in unions: 8.8%
> Change in union membership (2008-2018): +0.2 ppt. (7th largest increase)
> Union workers: 160,209 (24th most)
> Avg. annual wage: $44,855 (8th lowest)

28. Indiana
> Pct. of workers in unions: 8.8%
> Change in union membership (2008-2018): -3.6 ppt. (6th largest decrease)
> Union workers: 269,025 (15th most)
> Avg. annual wage: $46,897 (17th lowest)

29. Wisconsin
> Pct. of workers in unions: 8.1%
> Change in union membership (2008-2018): -6.9 ppt. (the largest decrease)
> Union workers: 218,590 (19th most)
> Avg. annual wage: $47,804 (21st lowest)
[in-text-ad-2]

30. Iowa
> Pct. of workers in unions: 7.7%
> Change in union membership (2008-2018): -2.9 ppt. (10th largest decrease)
> Union workers: 112,771 (22nd fewest)
> Avg. annual wage: $45,186 (10th lowest)

31. Kansas
> Pct. of workers in unions: 7.0%
> Change in union membership (2008-2018): unchanged
> Union workers: 90,558 (21st fewest)
> Avg. annual wage: $46,413 (15th lowest)
[in-text-ad]

32. New Mexico
> Pct. of workers in unions: 6.8%
> Change in union membership (2008-2018): -0.4 ppt. (4th smallest decrease)
> Union workers: 55,336 (9th fewest)
> Avg. annual wage: $44,725 (7th lowest)
33. Nebraska
> Pct. of workers in unions: 6.6%
> Change in union membership (2008-2018): -1.7 ppt. (19th largest decrease)
> Union workers: 58,447 (14th fewest)
> Avg. annual wage: $46,540 (16th lowest)
34. Wyoming
> Pct. of workers in unions: 6.5%
> Change in union membership (2008-2018): -1.2 ppt. (23rd largest decrease)
> Union workers: 15,376 (the fewest)
> Avg. annual wage: $47,285 (18th lowest)
[in-text-ad-2]

35. Oklahoma
> Pct. of workers in unions: 5.7%
> Change in union membership (2008-2018): -0.9 ppt. (10th smallest decrease)
> Union workers: 90,114 (20th fewest)
> Avg. annual wage: $45,997 (14th lowest)
36. South Dakota
> Pct. of workers in unions: 5.6%
> Change in union membership (2008-2018): +0.6 ppt. (4th largest increase)
> Union workers: 21,701 (3rd fewest)
> Avg. annual wage: $41,912 (2nd lowest)
[in-text-ad]

37. Florida
> Pct. of workers in unions: 5.6%
> Change in union membership (2008-2018): -0.8 ppt. (8th smallest decrease)
> Union workers: 484,162 (10th most)
> Avg. annual wage: $49,906 (24th highest)

38. Tennessee
> Pct. of workers in unions: 5.5%
> Change in union membership (2008-2018): unchanged
> Union workers: 154,128 (25th fewest)
> Avg. annual wage: $48,322 (22nd lowest)

39. Arizona
> Pct. of workers in unions: 5.3%
> Change in union membership (2008-2018): -3.5 ppt. (7th largest decrease)
> Union workers: 156,622 (25th most)
> Avg. annual wage: $51,157 (21st highest)
[in-text-ad-2]
40. North Dakota
> Pct. of workers in unions: 5.2%
> Change in union membership (2008-2018): -0.9 ppt. (9th smallest decrease)
> Union workers: 17,907 (2nd fewest)
> Avg. annual wage: $49,441 (25th lowest)

41. Mississippi
> Pct. of workers in unions: 5.1%
> Change in union membership (2008-2018): -0.2 ppt. (the smallest decrease)
> Union workers: 57,656 (13th fewest)
> Avg. annual wage: $39,825 (the lowest)
[in-text-ad]

42. Louisiana
> Pct. of workers in unions: 5.0%
> Change in union membership (2008-2018): +0.4 ppt. (6th largest increase)
> Union workers: 89,016 (19th fewest)
> Avg. annual wage: $47,645 (20th lowest)

43. Arkansas
> Pct. of workers in unions: 4.8%
> Change in union membership (2008-2018): -1.1 ppt. (12th smallest decrease)
> Union workers: 56,247 (12th fewest)
> Avg. annual wage: $43,490 (6th lowest)
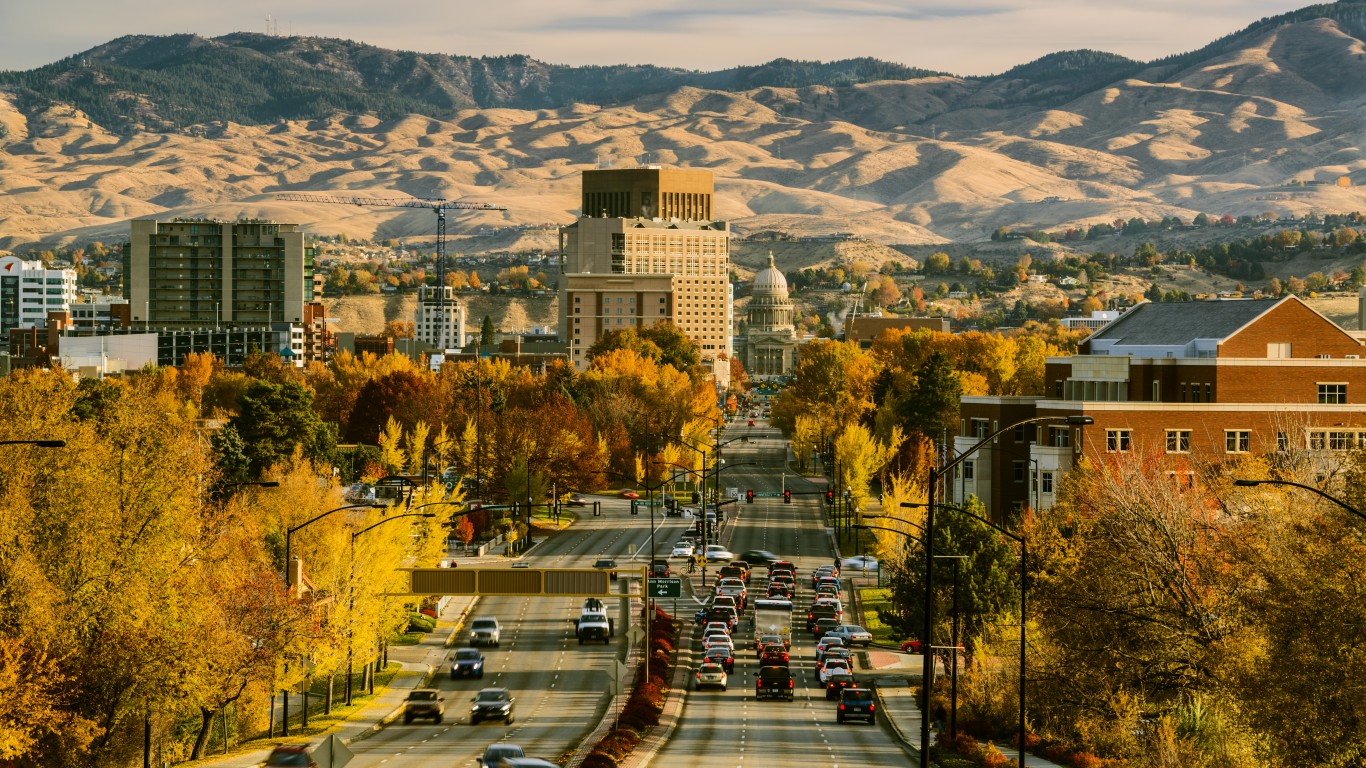
44. Idaho
> Pct. of workers in unions: 4.7%
> Change in union membership (2008-2018): -2.4 ppt. (16th largest decrease)
> Union workers: 34,244 (5th fewest)
> Avg. annual wage: $42,022 (3rd lowest)
[in-text-ad-2]

45. Georgia
> Pct. of workers in unions: 4.5%
> Change in union membership (2008-2018): +0.8 ppt. (3rd largest increase)
> Union workers: 200,070 (20th most)
> Avg. annual wage: $53,035 (17th highest)

46. Virginia
> Pct. of workers in unions: 4.3%
> Change in union membership (2008-2018): +0.2 ppt. (8th largest increase)
> Union workers: 167,784 (23rd most)
> Avg. annual wage: $58,022 (9th highest)
[in-text-ad]

47. Texas
> Pct. of workers in unions: 4.3%
> Change in union membership (2008-2018): -0.2 ppt. (the smallest decrease)
> Union workers: 511,944 (9th most)
> Avg. annual wage: $55,374 (12th highest)

48. Utah
> Pct. of workers in unions: 4.1%
> Change in union membership (2008-2018): -1.7 ppt. (19th largest decrease)
> Union workers: 55,634 (11th fewest)
> Avg. annual wage: $47,447 (19th lowest)

49. North Carolina
> Pct. of workers in unions: 2.7%
> Change in union membership (2008-2018): -0.8 ppt. (7th smallest decrease)
> Union workers: 117,060 (23rd fewest)
> Avg. annual wage: $49,867 (25th highest)
[in-text-ad-2]

50. South Carolina
> Pct. of workers in unions: 2.7%
> Change in union membership (2008-2018): -1.2 ppt. (23rd largest decrease)
> Union workers: 55,369 (10th fewest)
> Avg. annual wage: $45,499 (13th lowest)
Credit card companies are at war. The biggest issuers are handing out free rewards and benefits to win the best customers.
It’s possible to find cards paying unlimited 1.5%, 2%, and even more today. That’s free money for qualified borrowers, and the type of thing that would be crazy to pass up. Those rewards can add up to thousands of dollars every year in free money, and include other benefits as well.
We’ve assembled some of the best credit cards for users today. Don’t miss these offers because they won’t be this good forever.
Flywheel Publishing has partnered with CardRatings for our coverage of credit card products. Flywheel Publishing and CardRatings may receive a commission from card issuers.
Thank you for reading! Have some feedback for us?
Contact the 24/7 Wall St. editorial team.