Special Report
Countries Buying the Most Weapons From the US Government

Published:
Last Updated:

The United States is notably not just by far the world’s largest military force, but also by far the largest supplier of arms.
As the source of approximately 36% of the world’s military exports, the United States is by far the largest exporter of weapons, according to the latest report on major arms export volumes published by the Stockholm International Peace Research Institute (SIPRI) on March 11.
The U.S. has been both the largest exporter of military supplies and the country with the largest military expenditure since the SIPRI started its database in the early 1990s. The U.S.’s outsized share of world arms exports has also increased over the past five years since the previous five-year period through 2013, when 30% of world arms exports came from the United States.
This increase, however, is largely due to deliveries, mainly of F-35 combat jets, over the past five years, said Aude Fleurant, director of the arms and military expenditure programme with SIPRI, in an email to 24/7 Wall St. While the United States will almost certainly remain the dominant exporter of weapons, the large increase in arms exports was due primarily to the nature of cycles and transfers.
The United States supplies arms to at least 98 nations, and it is the largest supplier to 20 of the 40 largest arms importers in the world. These arms include ammunition such as missiles, various aircraft, submarines, surface ships, anti-submarine weaponry, tanks, armoured vehicles, as well as electronics such as radar, sonar, and guiding systems.
The United States selects its clients based on well-established partnerships, as well as for strategic reasons related to the leverage it could gain during conflicts. Of the 25 countries buying the most weapons from the U.S., 10 are either NATO member nations or part of other alliances formed with the United States since the Cold War.
“The US transfers to these countries are meant to ensure allies security, as arms transfers from the US brings with it security guarantees, which basically entail diplomatic and military assistance in case of troubles,” said Fleurant.
Click here to see the countries buying the most weapons from the U.S. government.
Methodology
To identify the countries buying the most weapons from the U.S. government, 24/7 Wall St. reviewed the total value of arms exports from the United States over the decade 2008 to 2018 delivered to the 183 countries available in SIPRI’s Arms Transfers Database updated March 11 2019. The arms data cover actual deliveries of major conventional weapons. The first, second, and third largest suppliers to each country came from SIPRI’s major arms export volumes report published March 11, 2019.
These figures do not represent sales prices for arms transfers. They should therefore not be directly compared with gross domestic product (GDP), military expenditure, sales values, or the financial value of export licenses in an attempt to measure the economic burden of arms imports or the economic benefits of exports.
GDP per capita for each country was obtained from the World Bank.
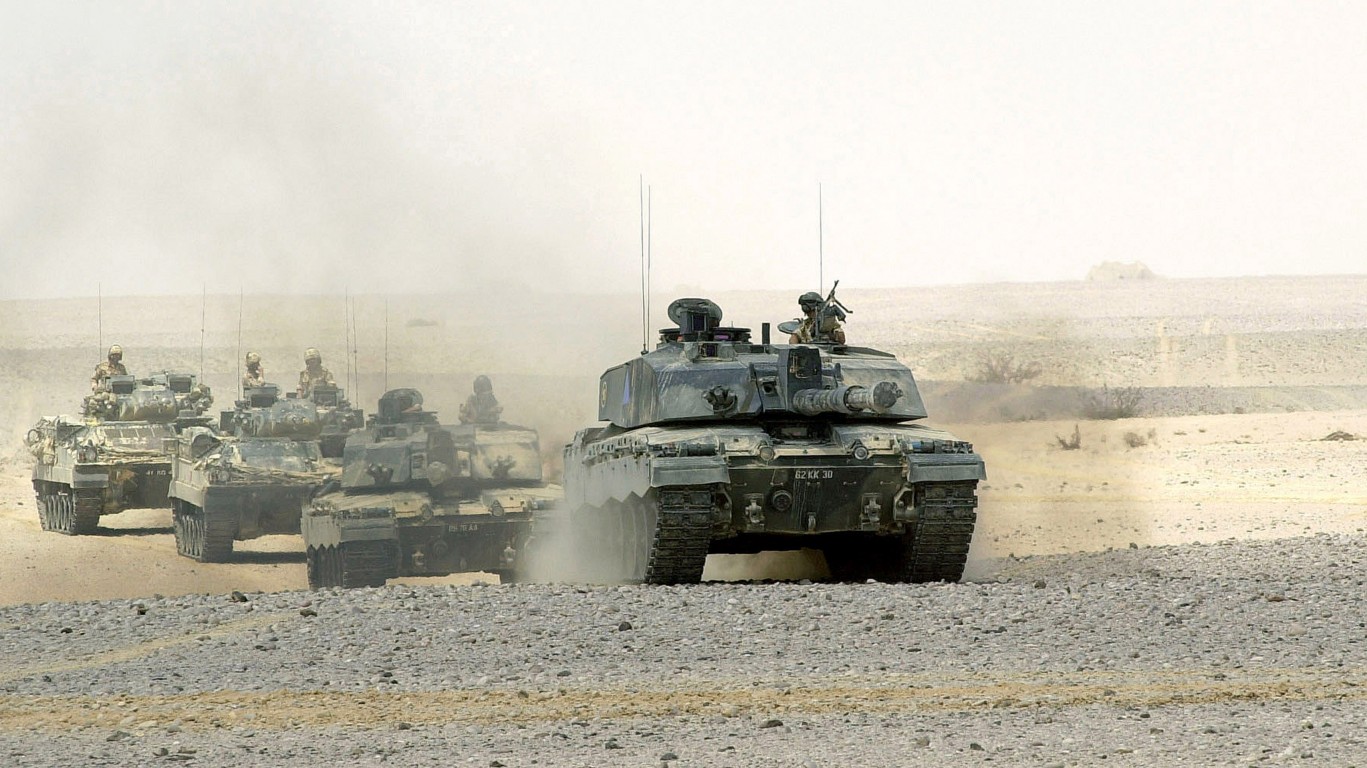
25. Oman
> Arms imports from US, 2008-2018: $842 million, 26.5% of arms imports
> Arms imports from US, 2018: Not available
> 1st, 2nd, and 3rd largest suppliers (2014-2018): UK, USA, Norway
> GDP per capita: $37,961
[in-text-ad]

24. Mexico
> Arms imports from US, 2008-2018: $899 million, 51.2% of arms imports
> Arms imports from US, 2018: $18 million, 69.2% of arms imports
> 1st, 2nd, and 3rd largest suppliers (2014-2018): USA, France, Netherlands
> GDP per capita: $17,331

23. Germany
> Arms imports from US, 2008-2018: $1 billion, 65.1% of arms imports
> Arms imports from US, 2018: $2 million, 14.3% of arms imports
> 1st, 2nd, and 3rd largest suppliers (2014-2018): Not available
> GDP per capita: $45,229
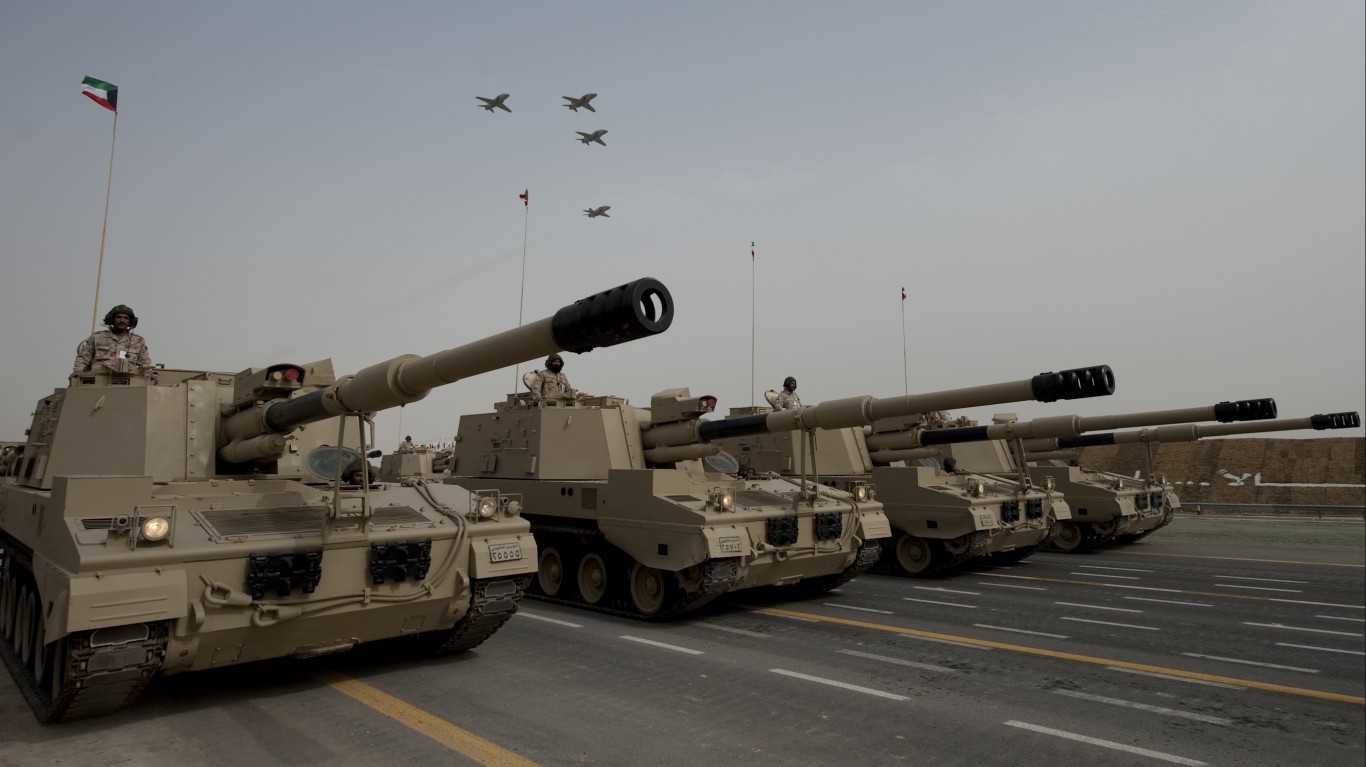
22. Kuwait
> Arms imports from US, 2008-2018: $1.36 billion, 79.6% of arms imports
> Arms imports from US, 2018: $55 million, 62.5% of arms imports
> 1st, 2nd, and 3rd largest suppliers (2014-2018): USA, Russia, Switzerland
> GDP per capita: $65,531
[in-text-ad-2]

21. Norway
> Arms imports from US, 2008-2018: $1.38 billion, 40.8% of arms imports
> Arms imports from US, 2018: $346 million, 64.4% of arms imports
> 1st, 2nd, and 3rd largest suppliers (2014-2018): USA, South Korea, Italy
> GDP per capita: $64,800

20. Greece
> Arms imports from US, 2008-2018: $1.40 billion, 35.4% of arms imports
> Arms imports from US, 2018: $59 million, 90.8% of arms imports
> 1st, 2nd, and 3rd largest suppliers (2014-2018): Germany, USA, France
> GDP per capita: $24,574
[in-text-ad]

19. Italy
> Arms imports from US, 2008-2018: $1.81 billion, 55.5% of arms imports
> Arms imports from US, 2018: $241 million, 77.5% of arms imports
> 1st, 2nd, and 3rd largest suppliers (2014-2018): USA, Germany, Israel
> GDP per capita: $35,220

18. Morocco
> Arms imports from US, 2008-2018: $2.05 billion, 45.2% of arms imports
> Arms imports from US, 2018: $333 million, 86.0% of arms imports
> 1st, 2nd, and 3rd largest suppliers (2014-2018): USA, France, Italy
> GDP per capita: $7,485

17. Canada
> Arms imports from US, 2008-2018: $2.26 billion, 76.2% of arms imports
> Arms imports from US, 2018: $121 million, 56.3% of arms imports
> 1st, 2nd, and 3rd largest suppliers (2014-2018): USA, Netherlands, Germany
> GDP per capita: $44,018
[in-text-ad-2]

16. Afghanistan
> Arms imports from US, 2008-2018: $2.40 billion, 70.8% of arms imports
> Arms imports from US, 2018: $206 million, 85.8% of arms imports
> 1st, 2nd, and 3rd largest suppliers (2014-2018): USA, Russia, Brazil
> GDP per capita: $1,796

15. Pakistan
> Arms imports from US, 2008-2018: $2.51 billion, 21.6% of arms imports
> Arms imports from US, 2018: $12 million, 1.5% of arms imports
> 1st, 2nd, and 3rd largest suppliers (2014-2018): China, USA, Russia
> GDP per capita: $5,035
[in-text-ad]

14. Qatar
> Arms imports from US, 2008-2018: $2.63 billion, 68.3% of arms imports
> Arms imports from US, 2018: $423 million, 51.8% of arms imports
> 1st, 2nd, and 3rd largest suppliers (2014-2018): USA, Germany, France
> GDP per capita: $116,932

13. Egypt
> Arms imports from US, 2008-2018: $2.84 billion, 27.9% of arms imports
> Arms imports from US, 2018: $197 million, 13.3% of arms imports
> 1st, 2nd, and 3rd largest suppliers (2014-2018): France, Russia, USA
> GDP per capita: $10,551

12. Israel
> Arms imports from US, 2008-2018: $2.91 billion, 69.6% of arms imports
> Arms imports from US, 2018: $480 million, 96.4% of arms imports
> 1st, 2nd, and 3rd largest suppliers (2014-2018): USA, Germany, Italy
> GDP per capita: $33,132
[in-text-ad-2]

11. India
> Arms imports from US, 2008-2018: $3.10 billion, 9.1% of arms imports
> Arms imports from US, 2018: $25 million, 1.6% of arms imports
> 1st, 2nd, and 3rd largest suppliers (2014-2018): Russia, Israel, USA
> GDP per capita: $6,430

10. Taiwan
> Arms imports from US, 2008-2018: $3.58 billion, 95.1% of arms imports
> Arms imports from US, 2018: $129 million, 100% of arms imports
> 1st, 2nd, and 3rd largest suppliers (2014-2018): USA, Germany, Italy
> GDP per capita: $00
[in-text-ad]

9. United Kingdom
> Arms imports from US, 2008-2018: $3.60 billion, 70.1% of arms imports
> Arms imports from US, 2018: $194 million, 36.4% of arms imports
> 1st, 2nd, and 3rd largest suppliers (2014-2018): USA, South Korea, Germany
> GDP per capita: $39,753

8. Turkey
> Arms imports from US, 2008-2018: $3.82 billion, 45.8% of arms imports
> Arms imports from US, 2018: $293 million, 42.8% of arms imports
> 1st, 2nd, and 3rd largest suppliers (2014-2018): USA, Spain, Italy
> GDP per capita: $25,135
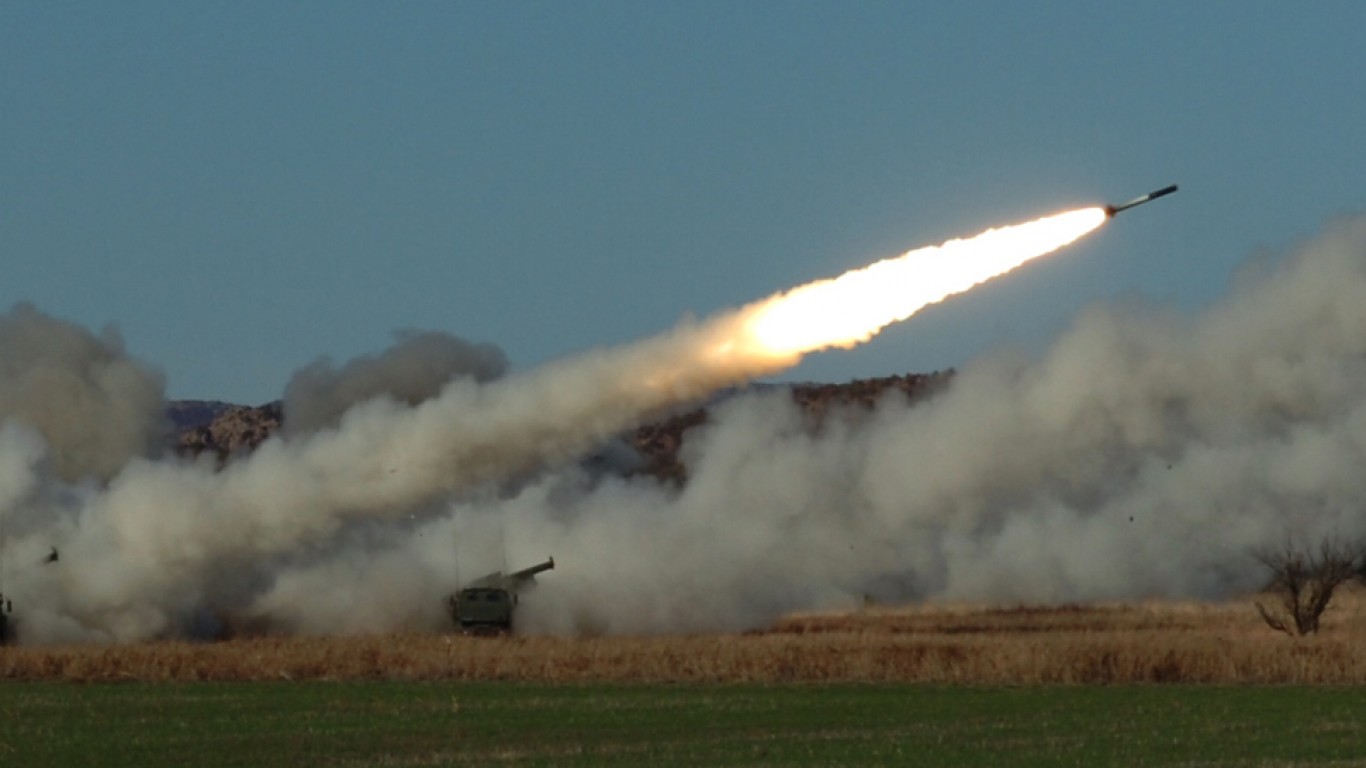
7. Singapore
> Arms imports from US, 2008-2018: $3.97 billion, 49.8% of arms imports
> Arms imports from US, 2018: $56 million, 11.0% of arms imports
> 1st, 2nd, and 3rd largest suppliers (2014-2018): USA, France, Spain
> GDP per capita: $85,535
[in-text-ad-2]

6. Japan
> Arms imports from US, 2008-2018: $4.31 billion, 93.4% of arms imports
> Arms imports from US, 2018: $675 million, 97.0% of arms imports
> 1st, 2nd, and 3rd largest suppliers (2014-2018): USA, UK, Sweden
> GDP per capita: $39,002

5. Iraq
> Arms imports from US, 2008-2018: $4.45 billion, 55.8% of arms imports
> Arms imports from US, 2018: $40 million, 6.7% of arms imports
> 1st, 2nd, and 3rd largest suppliers (2014-2018): USA, Russia, South Korea
> GDP per capita: $15,393
[in-text-ad]

4. South Korea
> Arms imports from US, 2008-2018: $7.40 billion, 66.7% of arms imports
> Arms imports from US, 2018: $612 million, 46.5% of arms imports
> 1st, 2nd, and 3rd largest suppliers (2014-2018): USA, Germany, UK
> GDP per capita: $35,938
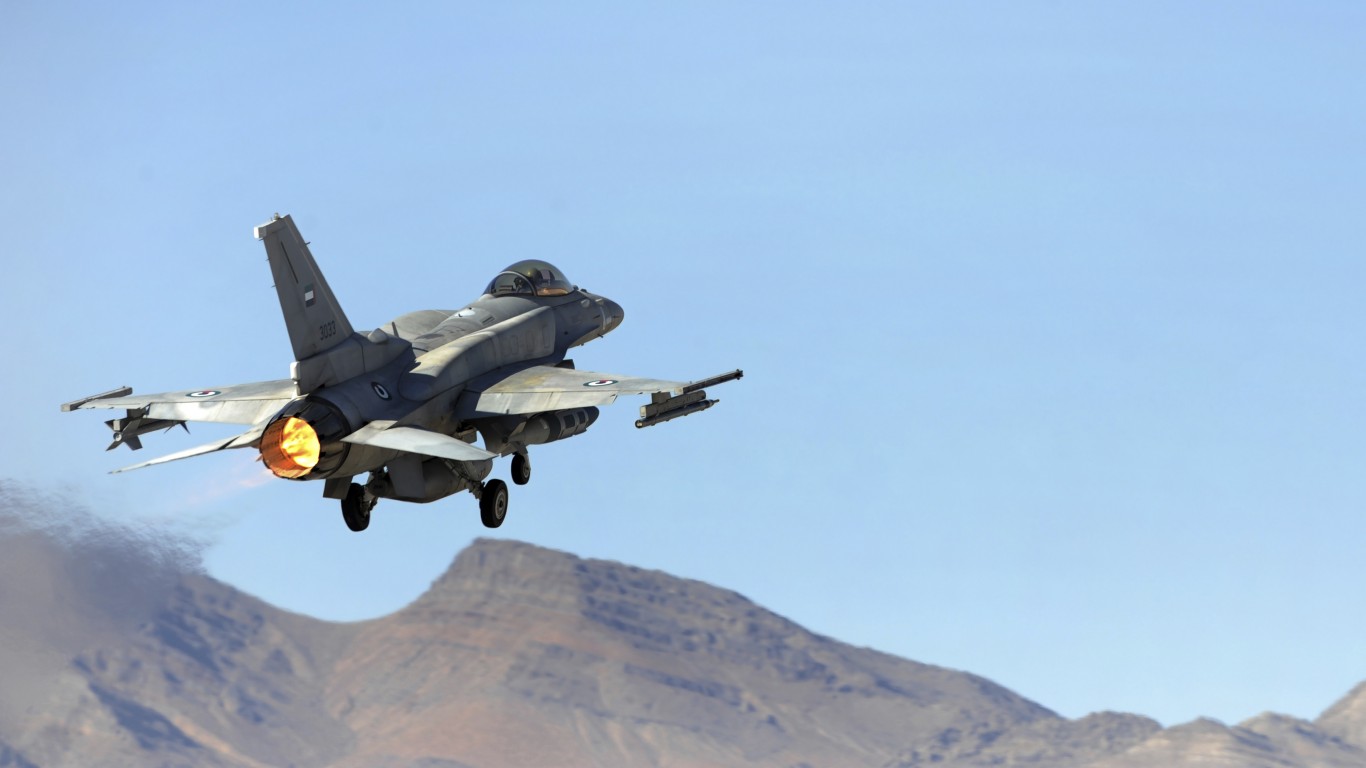
3. UAE
> Arms imports from US, 2008-2018: $7.60 billion, 63.7% of arms imports
> Arms imports from US, 2018: $799 million, 72.6% of arms imports
> 1st, 2nd, and 3rd largest suppliers (2014-2018): USA, France, Turkey
> GDP per capita: $67,293

2. Australia
> Arms imports from US, 2008-2018: $8.09 billion, 66.4% of arms imports
> Arms imports from US, 2018: $918 million, 58.4% of arms imports
> 1st, 2nd, and 3rd largest suppliers (2014-2018): USA, Spain, France
> GDP per capita: $44,649
[in-text-ad-2]
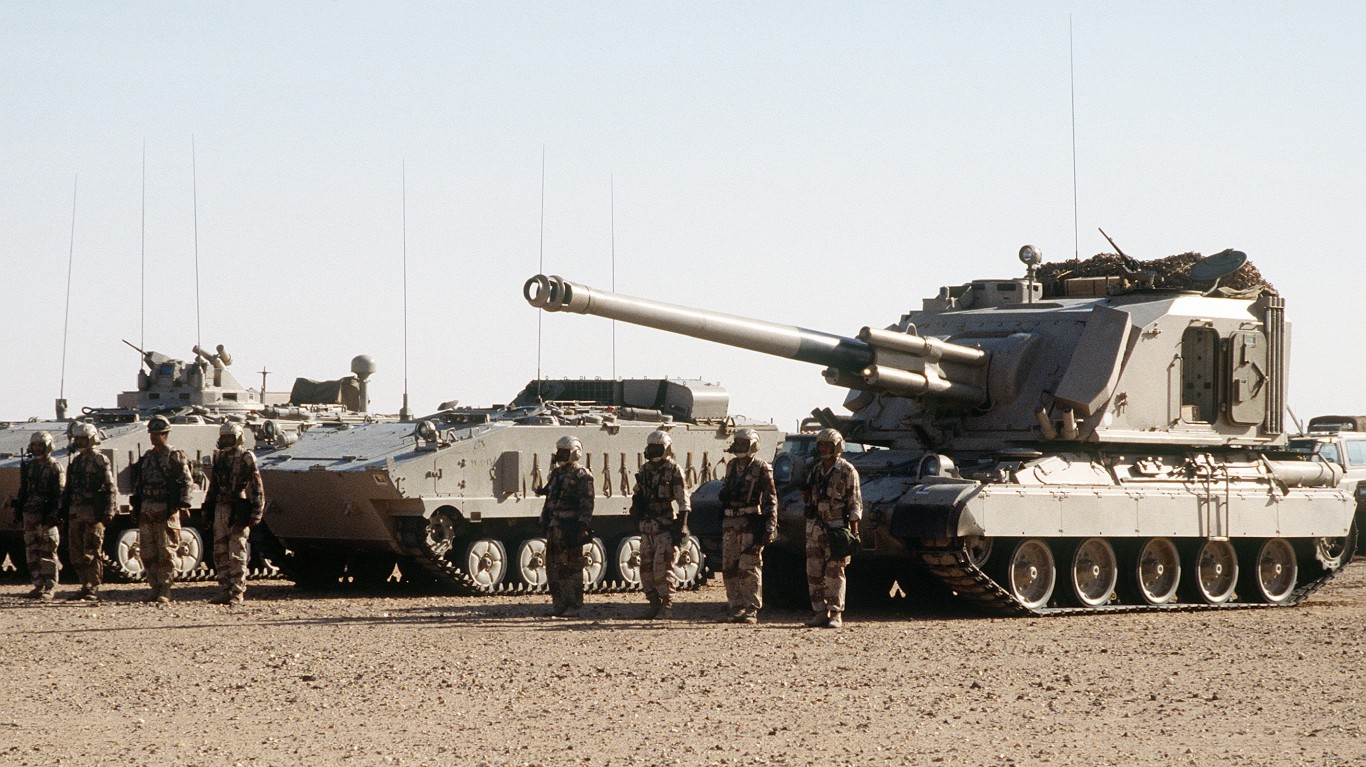
1. Saudi Arabia
> Arms imports from US, 2008-2018: $13.72 billion, 59.6% of arms imports
> Arms imports from US, 2018: $3.35 billion, 88.0% of arms imports
> 1st, 2nd, and 3rd largest suppliers (2014-2018): USA, UK, France
> GDP per capita: $48,986
If you’re like many Americans and keep your money ‘safe’ in a checking or savings account, think again. The average yield on a savings account is a paltry .4% today, and inflation is much higher. Checking accounts are even worse.
Every day you don’t move to a high-yield savings account that beats inflation, you lose more and more value.
But there is good news. To win qualified customers, some accounts are paying 9-10x this national average. That’s an incredible way to keep your money safe, and get paid at the same time. Our top pick for high yield savings accounts includes other one time cash bonuses, and is FDIC insured.
Click here to see how much more you could be earning on your savings today. It takes just a few minutes and your money could be working for you.
Thank you for reading! Have some feedback for us?
Contact the 24/7 Wall St. editorial team.