With the exception of the small European country of Monaco, the United States has more cars per capita than every other country in the world. For better or worse, the United States is a country uniquely dependent on the personal automobile. Driving, while a practical necessity for millions of Americans, can also be a financial burden, a major cause of stress — and also a dangerous activity.
On every road in the country, driving comes with a set of inherent risks and costs. Congested roads, high gas prices, and fatal collisions caused by distracted or drunk drivers are but a few. While drivers accept these road conditions, potential hazards, and costs when they get behind the wheel, not all cities are equally safe or congested, and some are certainly more expensive for drivers than others.
24/7 Wall St. created an index composed of several driving-related measures to identify the worst metropolitan statistical area to drive in each state. The components of the index — which include average commute time, gas prices, and accident rates — were selected to capture an area’s safety, convenience, and cost of driving.
Just because a metro area ranks as the worst place to drive in a given state does not necessarily mean it compares poorly to the nation as a whole. For example, 21 cities on this list have a lower per capita roadway fatality rate than the national rate of 11.4 deaths per 100,000 Americans. The cities on this list in Delaware, New Hampshire, Rhode Island, and Vermont also rank as the worst by default as they are the only metro area in the state.
Click here to read about the worst cities to drive in every state.
To identify the worst cities to drive in every state, 24/7 Wall St. created an index based on measures of safety, cost, and the convenience of driving, normalized to be comparable with one another. Total fatalities and traffic fatalities involving drunk drivers per 100,000, is from the Fatality Analysis Reporting System (FARS) for 2017. Mean travel time to work and the percentage of the working-age population with a commute of 60 minutes or longer came from the American Community Survey (ACS) 2017 1-year estimates. The rate of car theft per 100,000 people is from the National Insurance Crime Bureau (NICB) Hot Spots report for the year 2017. The average price of gasoline from Q2 2017 to Q2 2018 is from the Council for Community and Economic Research’s (C2ER) cost of living index for metropolitan statistical areas.
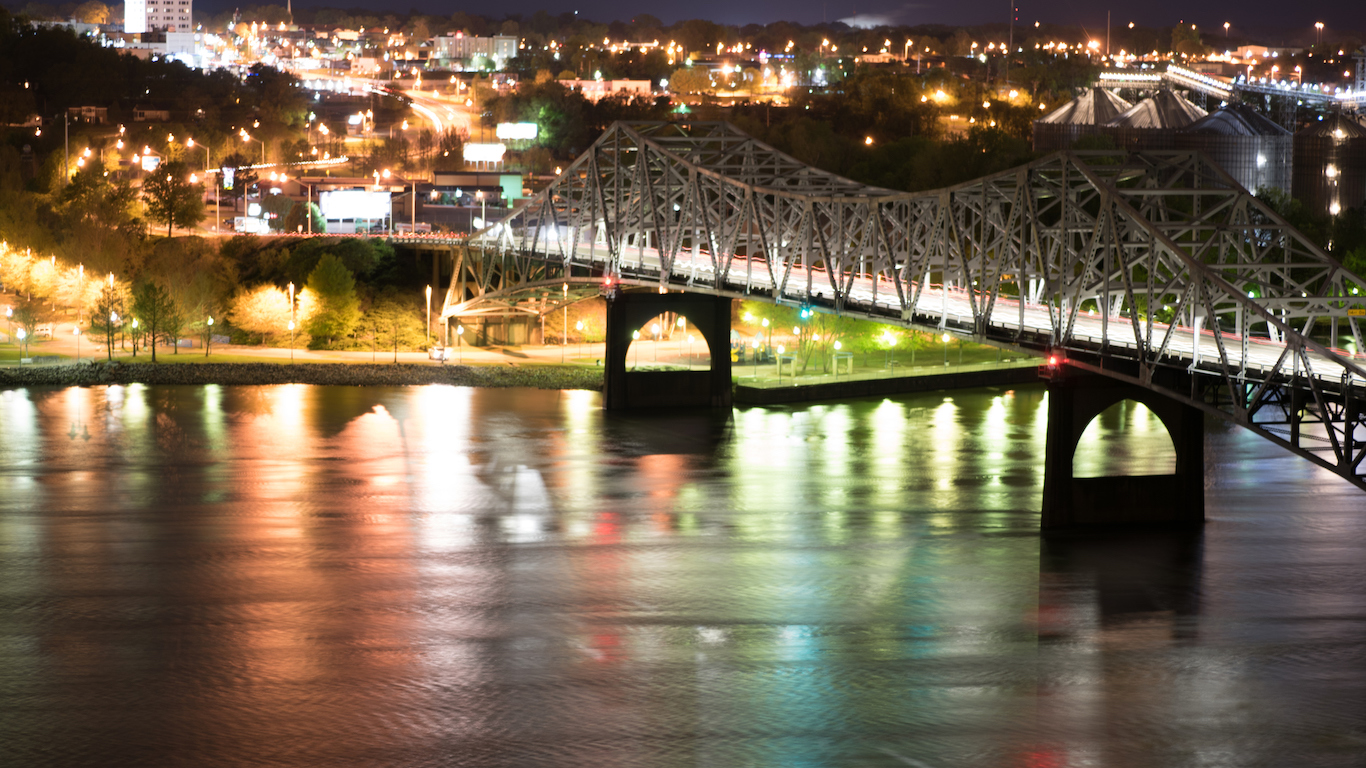
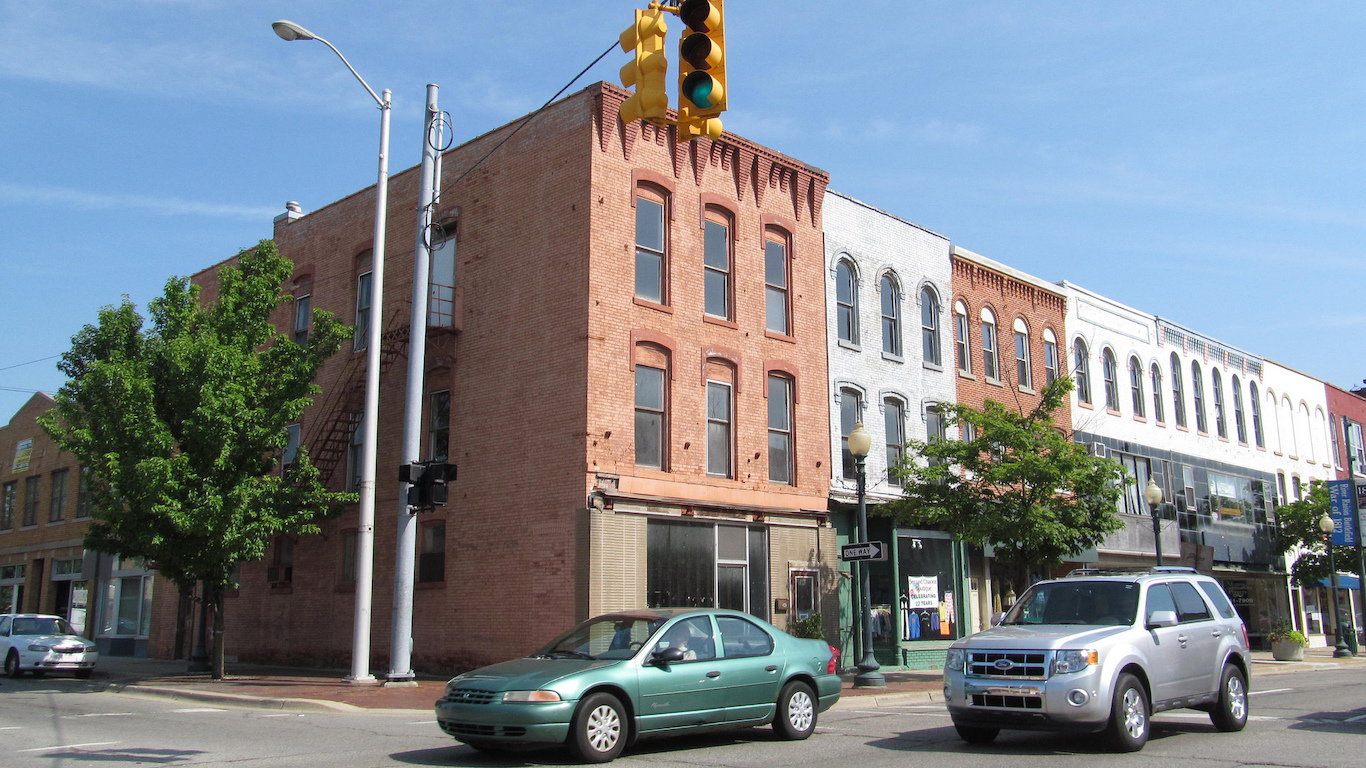
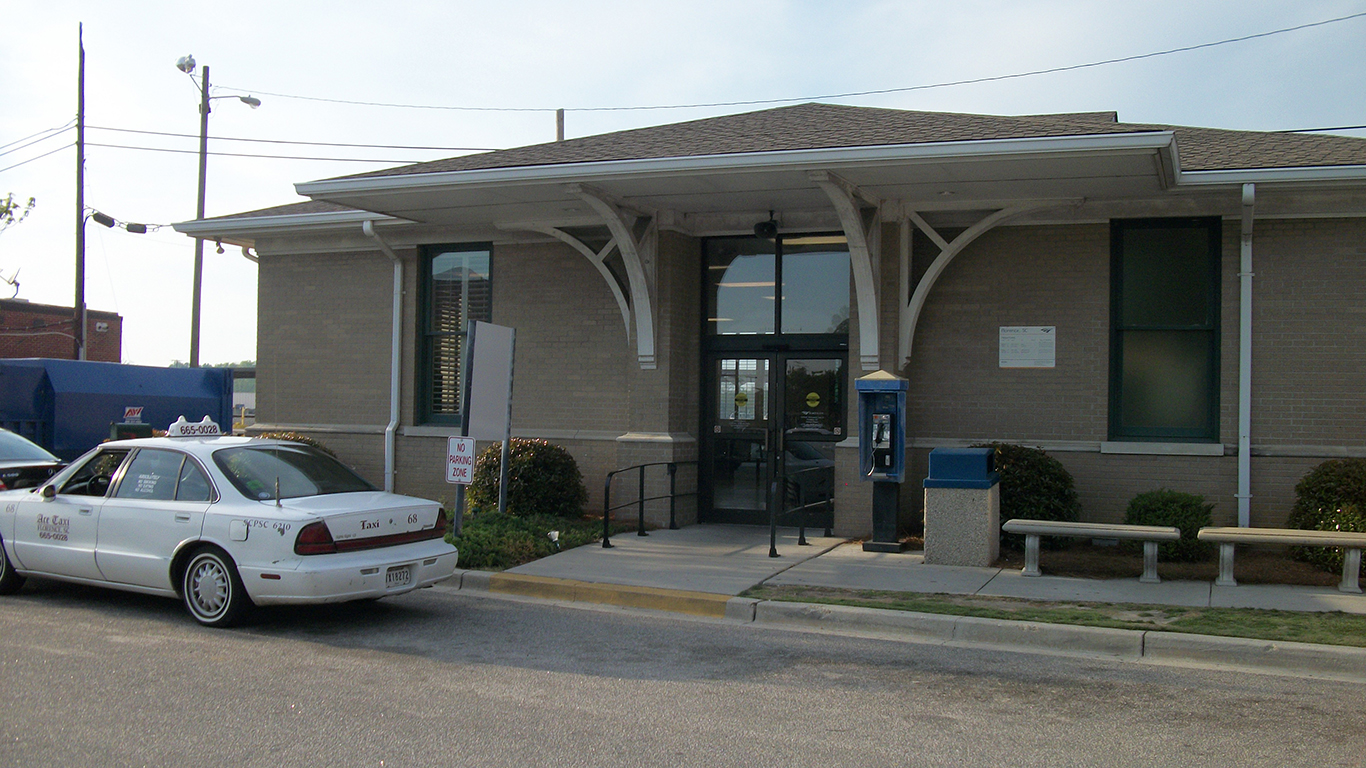
Alabama: Florence-Muscle Shoals
> Traffic fatalities per 100,000 people: 23.8 (state: 19.4)
> Avg. commute time: 23.7 min. (state: 24.6 min.)
> Commuters driving to work: 95.8% (state: 94.2%)
> 2017 car thefts per 100,000 people: 242.8
See all stories featuring: Alabama
[in-text-ad]
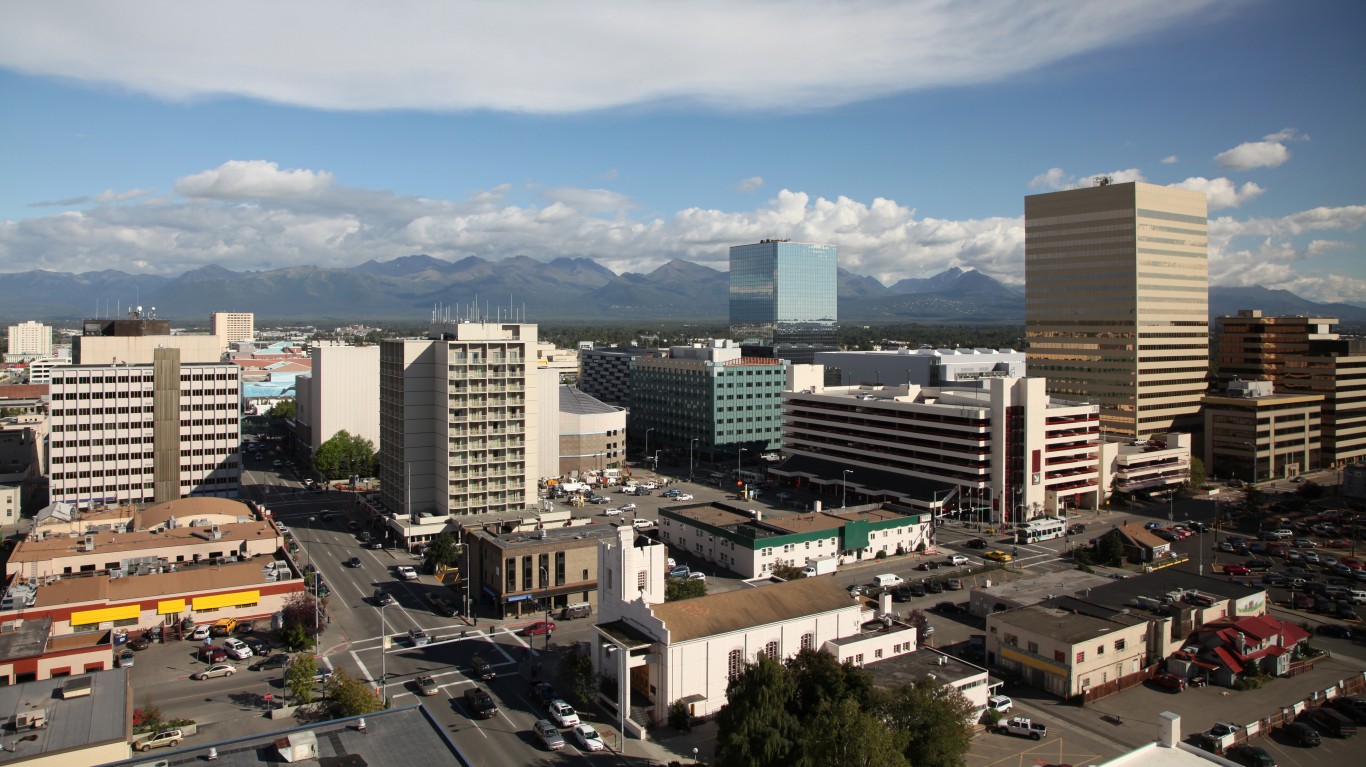
Alaska: Anchorage
> Traffic fatalities per 100,000 people: 9.7 (state: 10.7)
> Avg. commute time: 22.1 min. (state: 19.6 min.)
> Commuters driving to work: 87.0% (state: 81.1%)
> 2017 car thefts per 100,000 people: 816.7
See all stories featuring: Alaska
 24/7 Wall St.
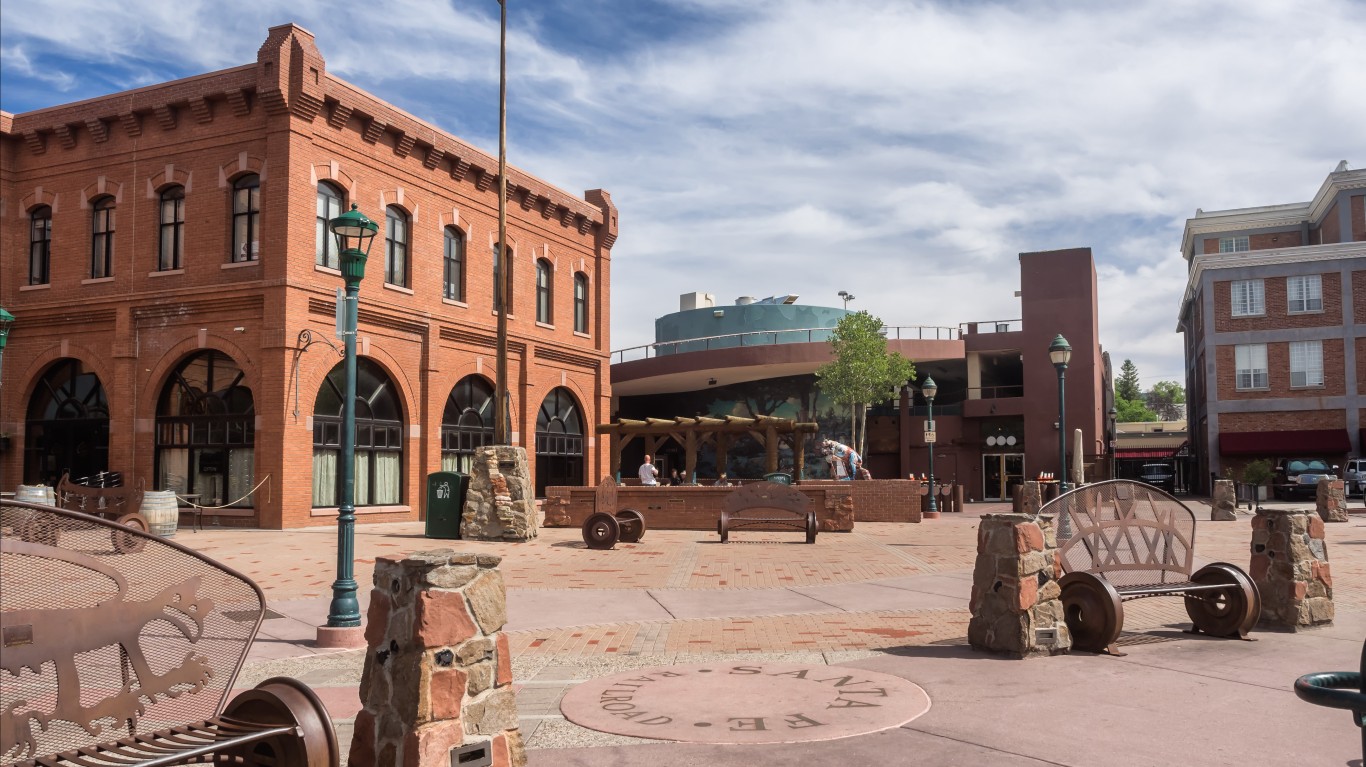
Arizona: Flagstaff
> Traffic fatalities per 100,000 people: 33.4 (state: 14.3)
> Avg. commute time: 18.4 min. (state: 25.6 min.)
> Commuters driving to work: 81.5% (state: 87.5%)
> 2017 car thefts per 100,000 people: 142.1
See all stories featuring: Arizona
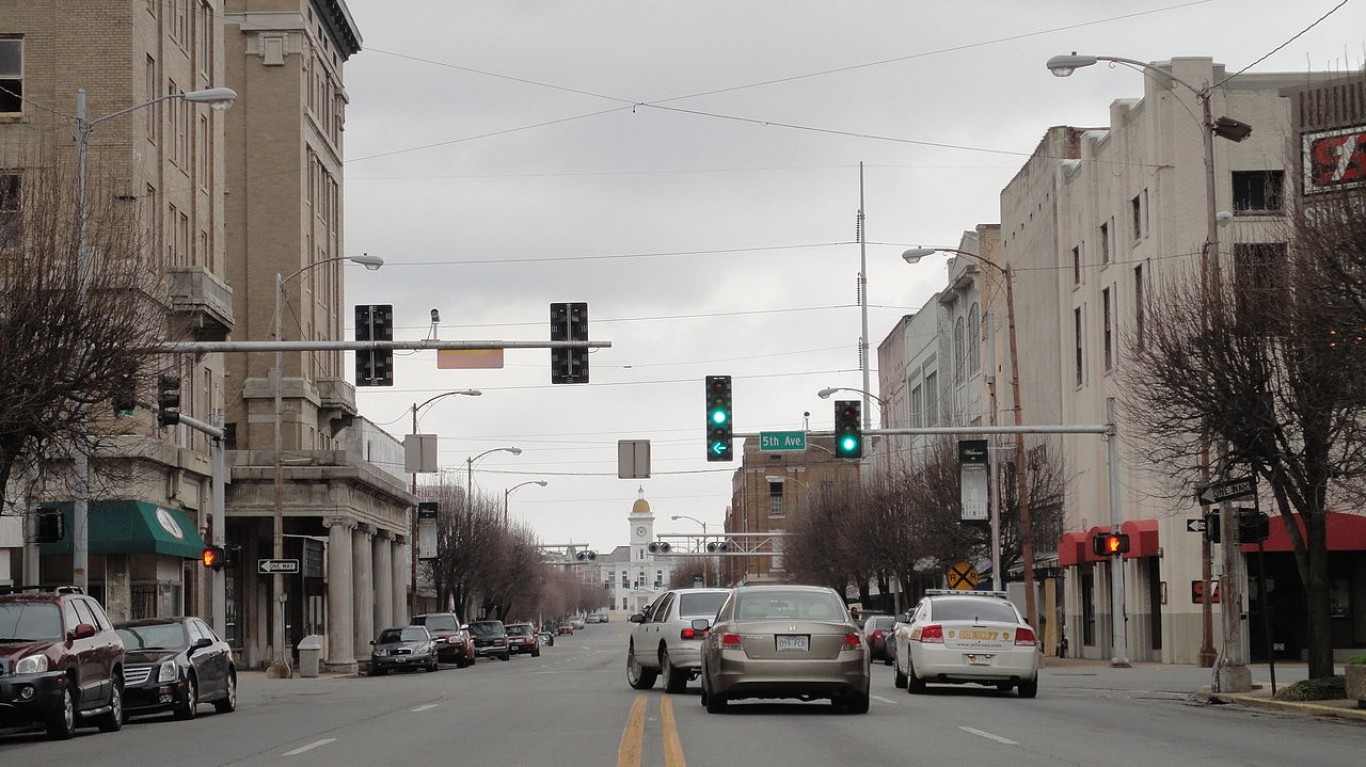
Arkansas: Pine Bluff
> Traffic fatalities per 100,000 people: 22.2 (state: 16.4)
> Avg. commute time: 22.2 min. (state: 21.6 min.)
> Commuters driving to work: N/A (state: 93.2%)
> 2017 car thefts per 100,000 people: 355.1
See all stories featuring: Arkansas
[in-text-ad-2]
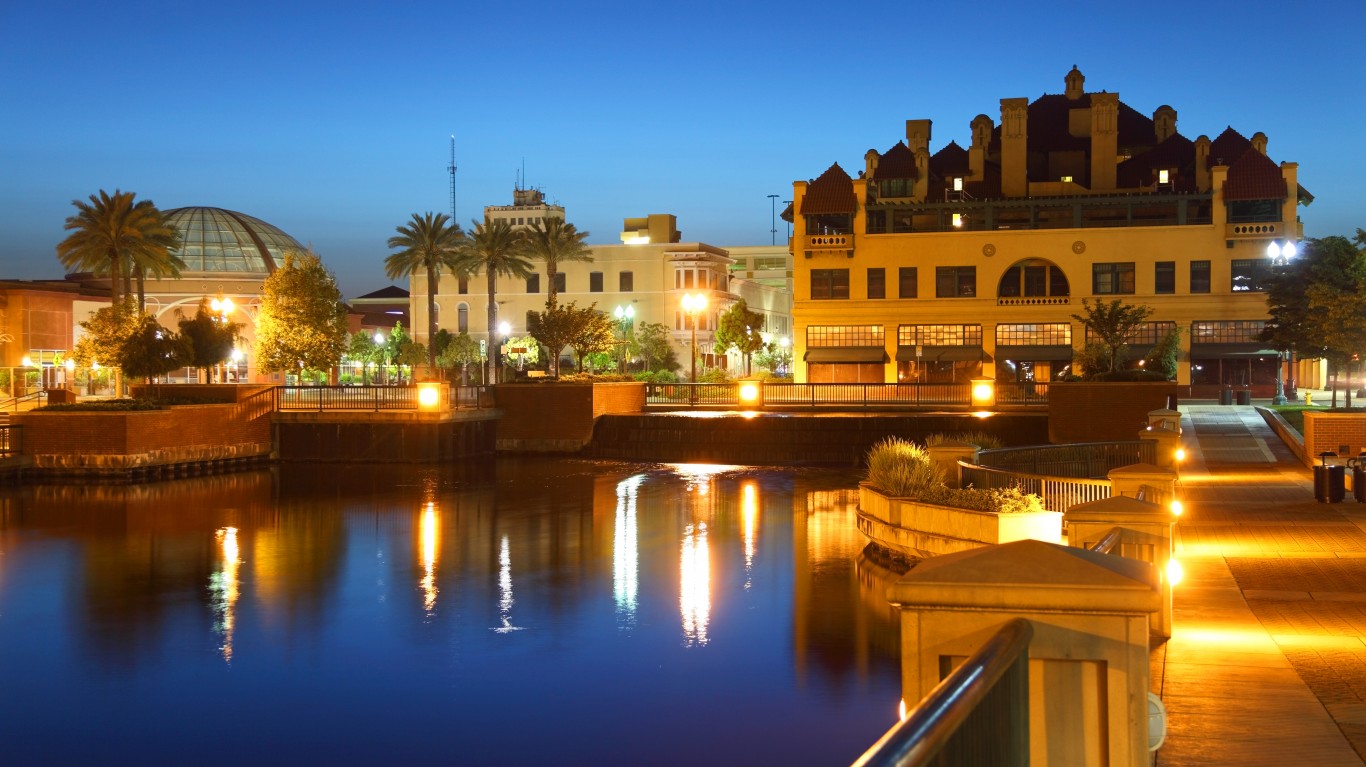
California: Stockton-Lodi
> Traffic fatalities per 100,000 people: 15.6 (state: 9.1)
> Avg. commute time: 32 min. (state: 29.8 min.)
> Commuters driving to work: 92.4% (state: 83.9%)
> 2017 car thefts per 100,000 people: 613.7
See all stories featuring: California
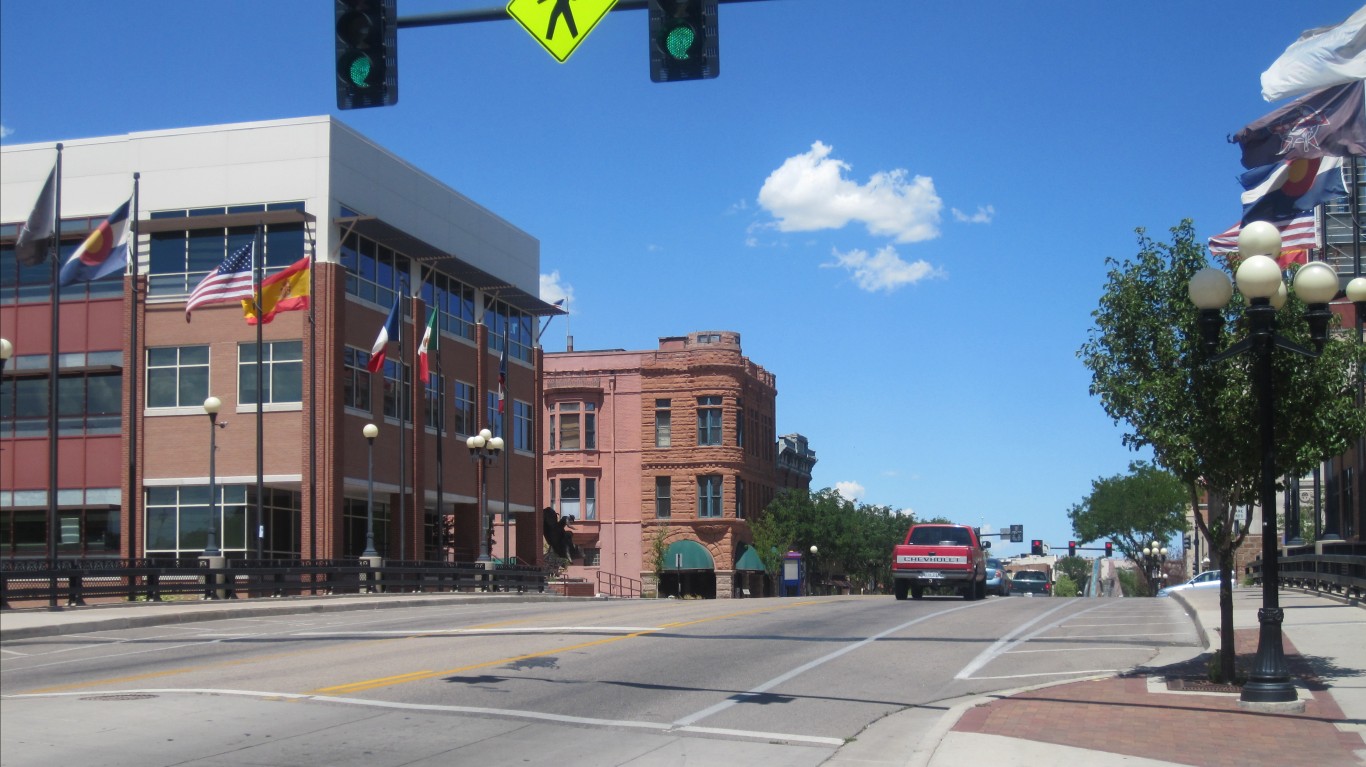
Colorado: Pueblo
> Traffic fatalities per 100,000 people: 20.4 (state: 11.6)
> Avg. commute time: 21.8 min. (state: 25.9 min.)
> Commuters driving to work: 94.1% (state: 83.4%)
> 2017 car thefts per 100,000 people: 812.7
See all stories featuring: Colorado
[in-text-ad]
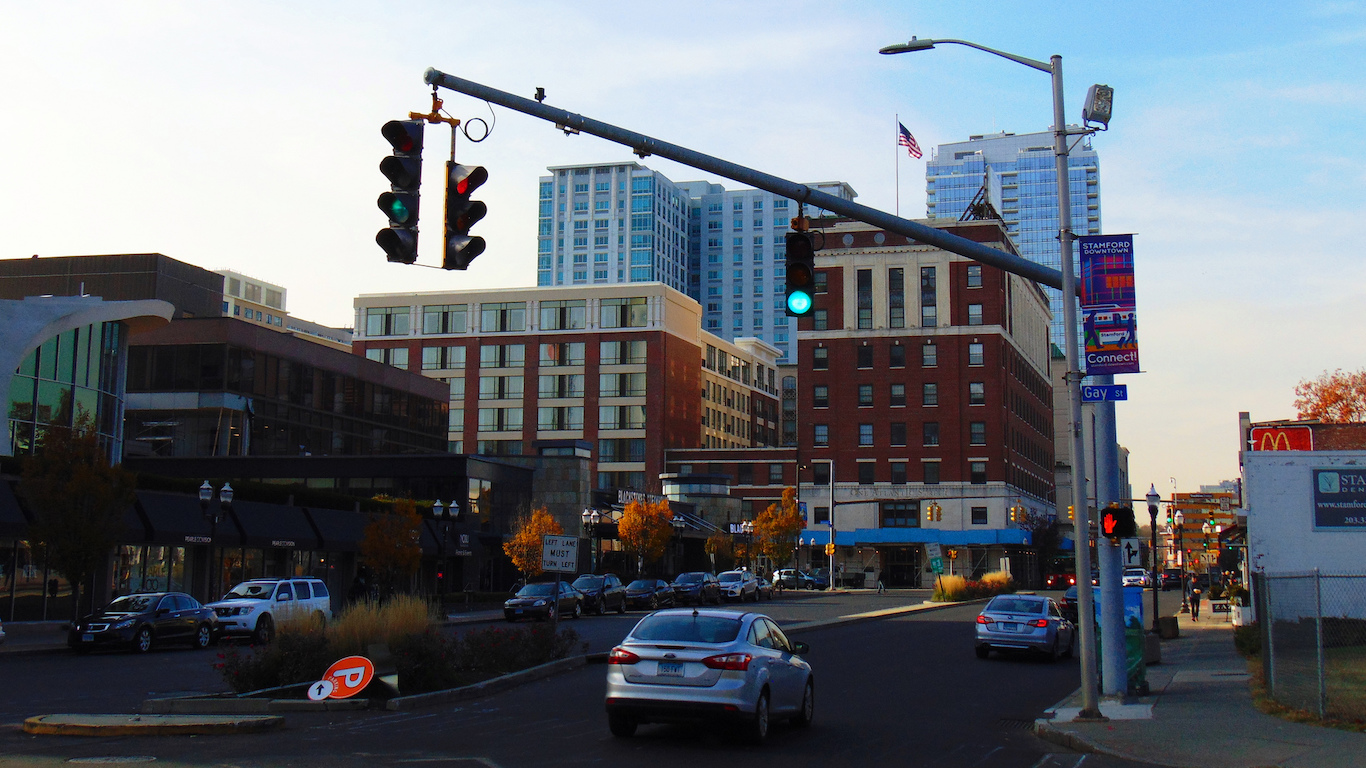
Connecticut: Bridgeport-Stamford-Norwalk
> Traffic fatalities per 100,000 people: 6.2 (state: 7.7)
> Avg. commute time: 30.4 min. (state: 26.4 min.)
> Commuters driving to work: 80.2% (state: 86.1%)
> 2017 car thefts per 100,000 people: 185.1
See all stories featuring: Connecticut
 24/7 Wall St.
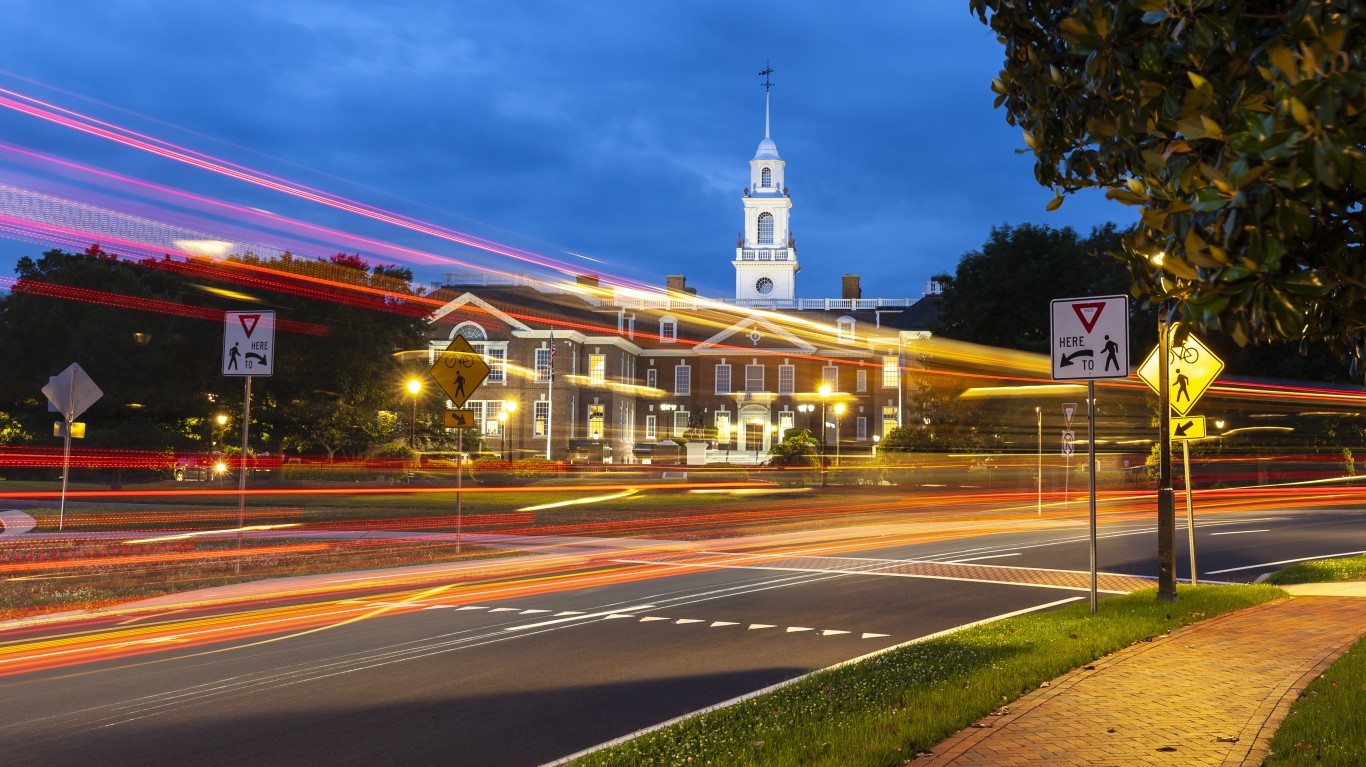
Delaware: Dover
> Traffic fatalities per 100,000 people: 11.9 (state: 12.4)
> Avg. commute time: 26.3 min. (state: 26.5 min.)
> Commuters driving to work: 90.2% (state: 89.2%)
> 2017 car thefts per 100,000 people: 100.1
See all stories featuring: Delaware
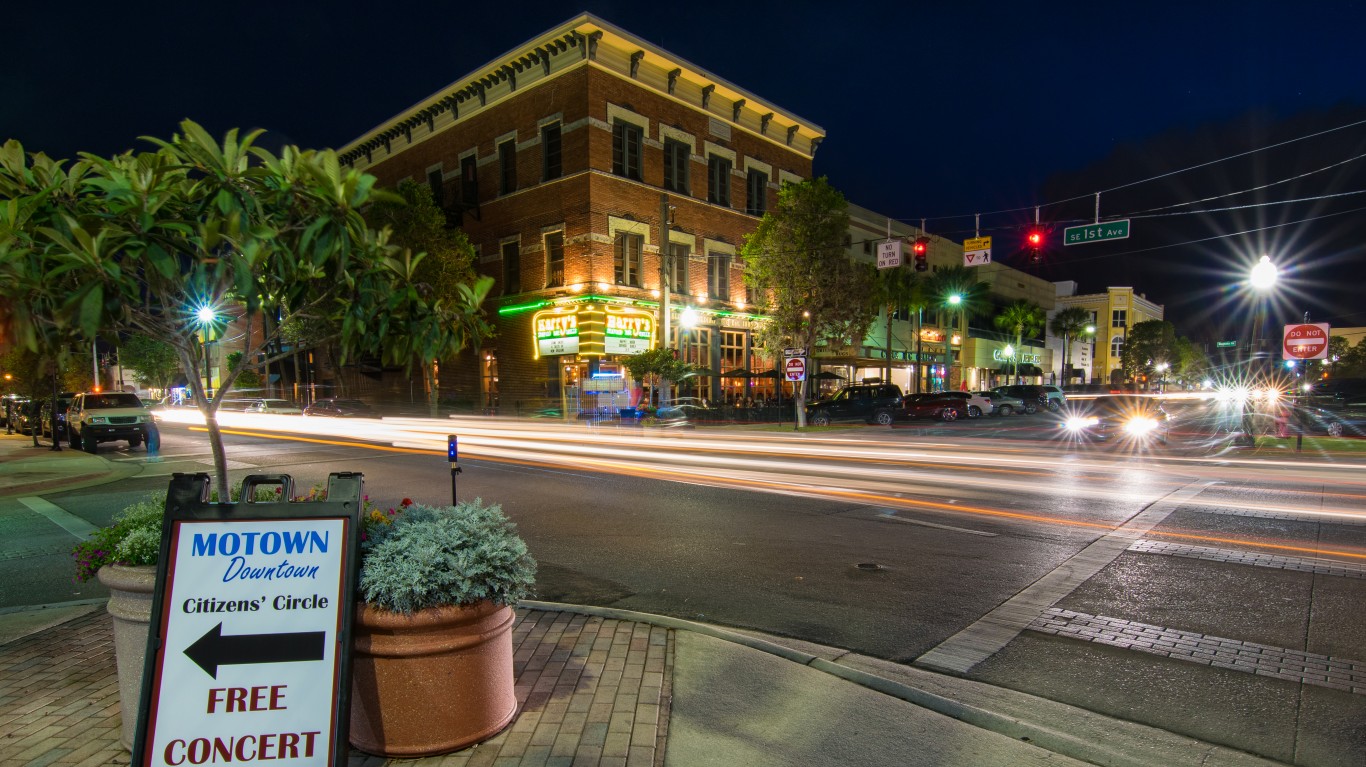
Florida: Ocala
> Traffic fatalities per 100,000 people: 25.4 (state: 14.8)
> Avg. commute time: 25.4 min. (state: 27.8 min.)
> Commuters driving to work: 90.0% (state: 88.4%)
> 2017 car thefts per 100,000 people: 224.6
See all stories featuring: Florida
[in-text-ad-2]
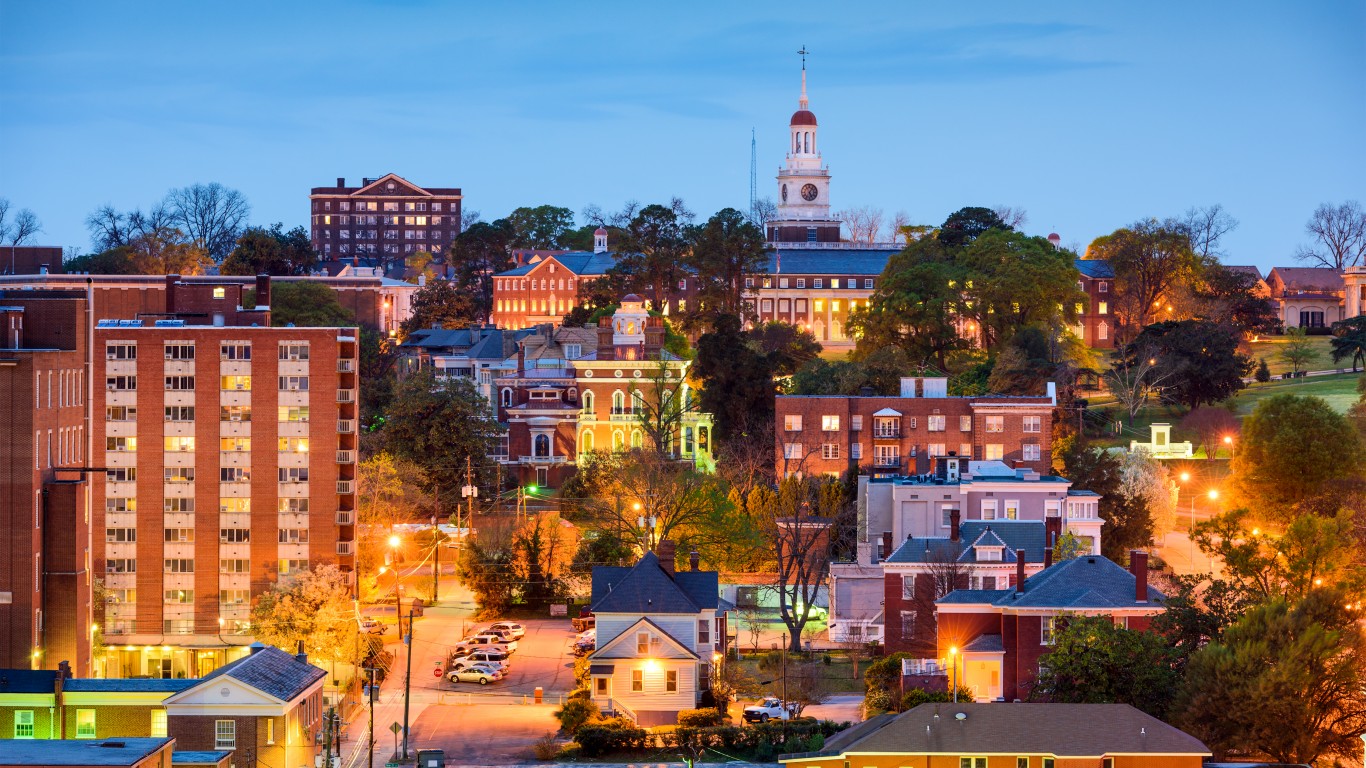
Georgia: Macon
> Traffic fatalities per 100,000 people: 28.4 (state: 14.8)
> Avg. commute time: 23.2 min. (state: 28.8 min.)
> Commuters driving to work: 93.8% (state: 88.6%)
> 2017 car thefts per 100,000 people: 318.9
See all stories featuring: Georgia

Hawaii: Urban Honolulu
> Traffic fatalities per 100,000 people: 5.0 (state: 7.5)
> Avg. commute time: 29.1 min. (state: 27 min.)
> Commuters driving to work: 78.0% (state: 80.8%)
> 2017 car thefts per 100,000 people: 272.8
See all stories featuring: Hawaii
[in-text-ad]
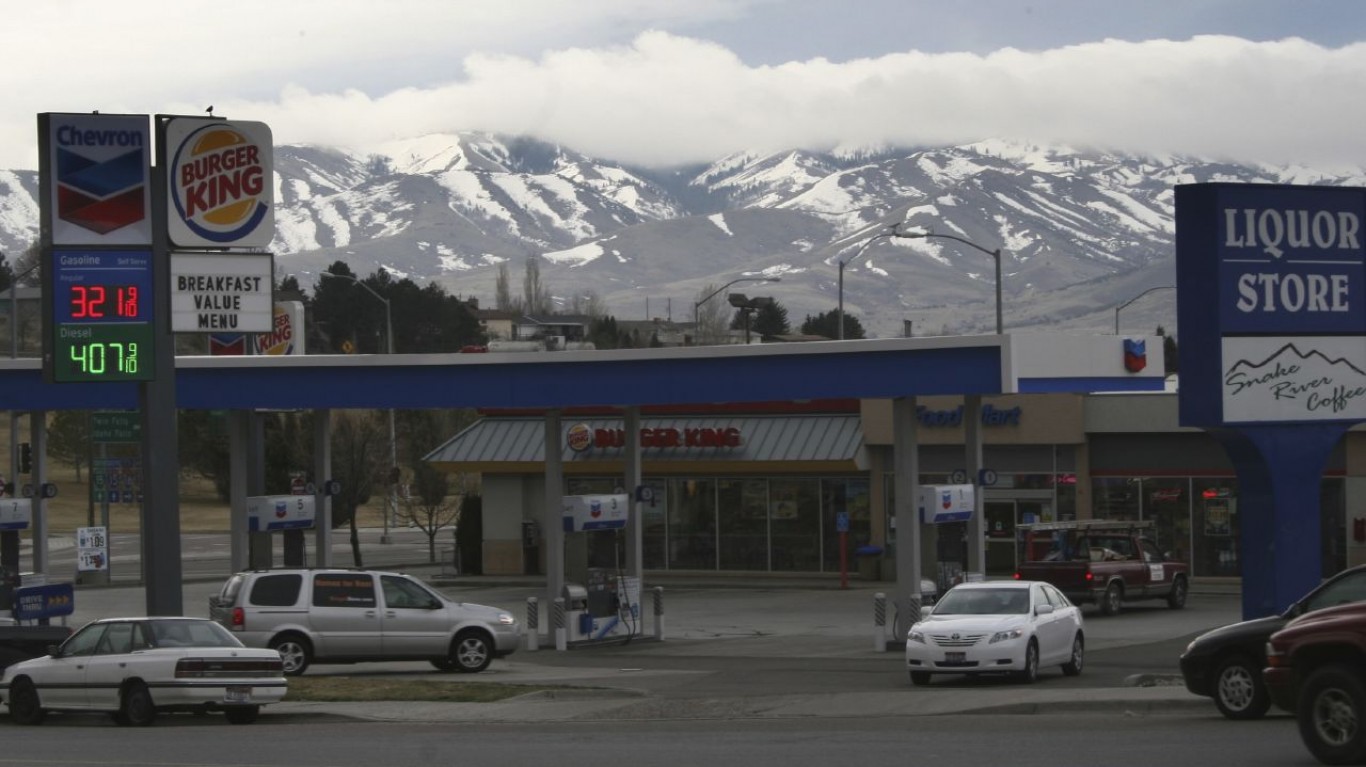
Idaho: Pocatello
> Traffic fatalities per 100,000 people: 15.2 (state: 14.2)
> Avg. commute time: 17.6 min. (state: 21 min.)
> Commuters driving to work: 87.0% (state: 89.3%)
> 2017 car thefts per 100,000 people: 174.7
See all stories featuring: Idaho
 24/7 Wall St.
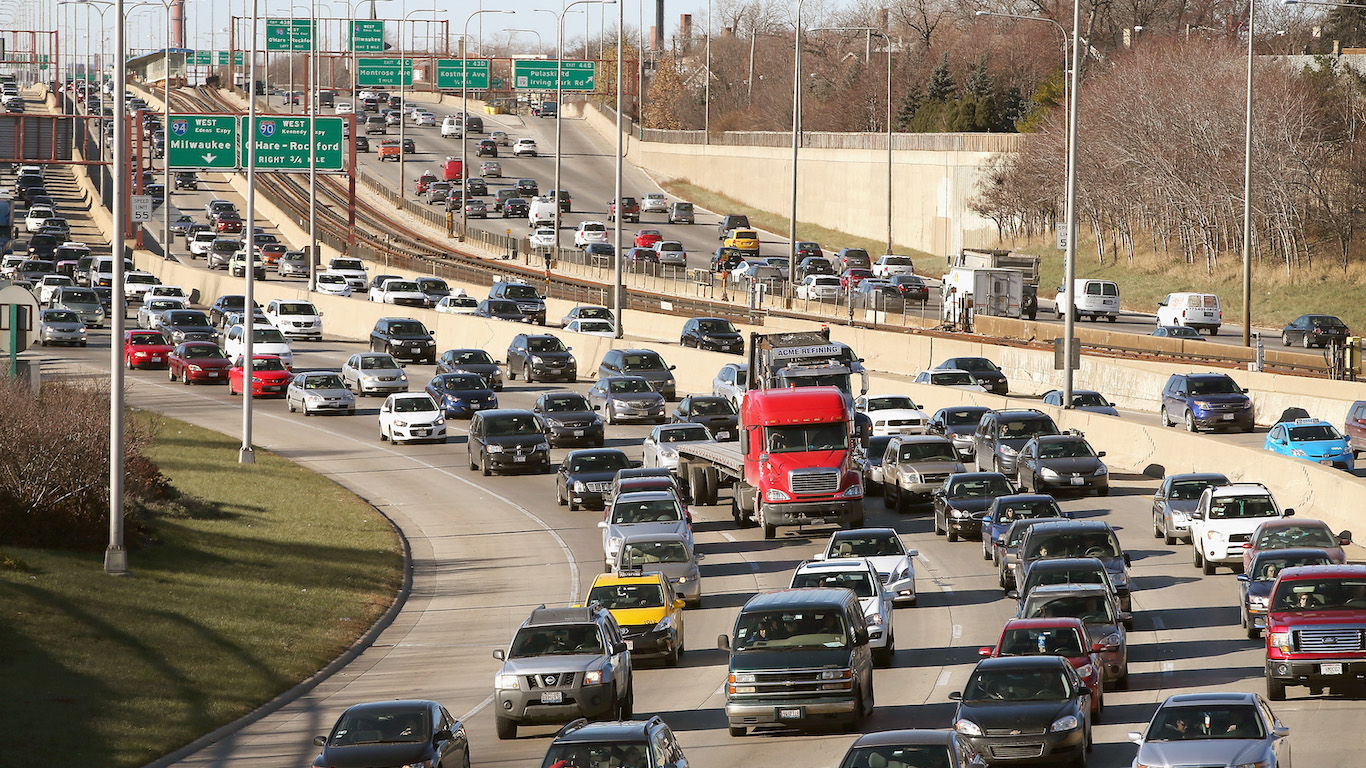
Illinois: Chicago-Naperville-Elgin
> Traffic fatalities per 100,000 people: 6.6 (state: 8.6)
> Avg. commute time: 31.6 min. (state: 29.1 min.)
> Commuters driving to work: 77.6% (state: 80.8%)
> 2017 car thefts per 100,000 people: 254.4
See all stories featuring: Illinois
Indiana: Michigan City-La Porte
> Traffic fatalities per 100,000 people: 24.5 (state: 13.7)
> Avg. commute time: 22.1 min. (state: 23.6 min.)
> Commuters driving to work: 91.9% (state: 91.2%)
> 2017 car thefts per 100,000 people: 159.1
See all stories featuring: Indiana
[in-text-ad-2]
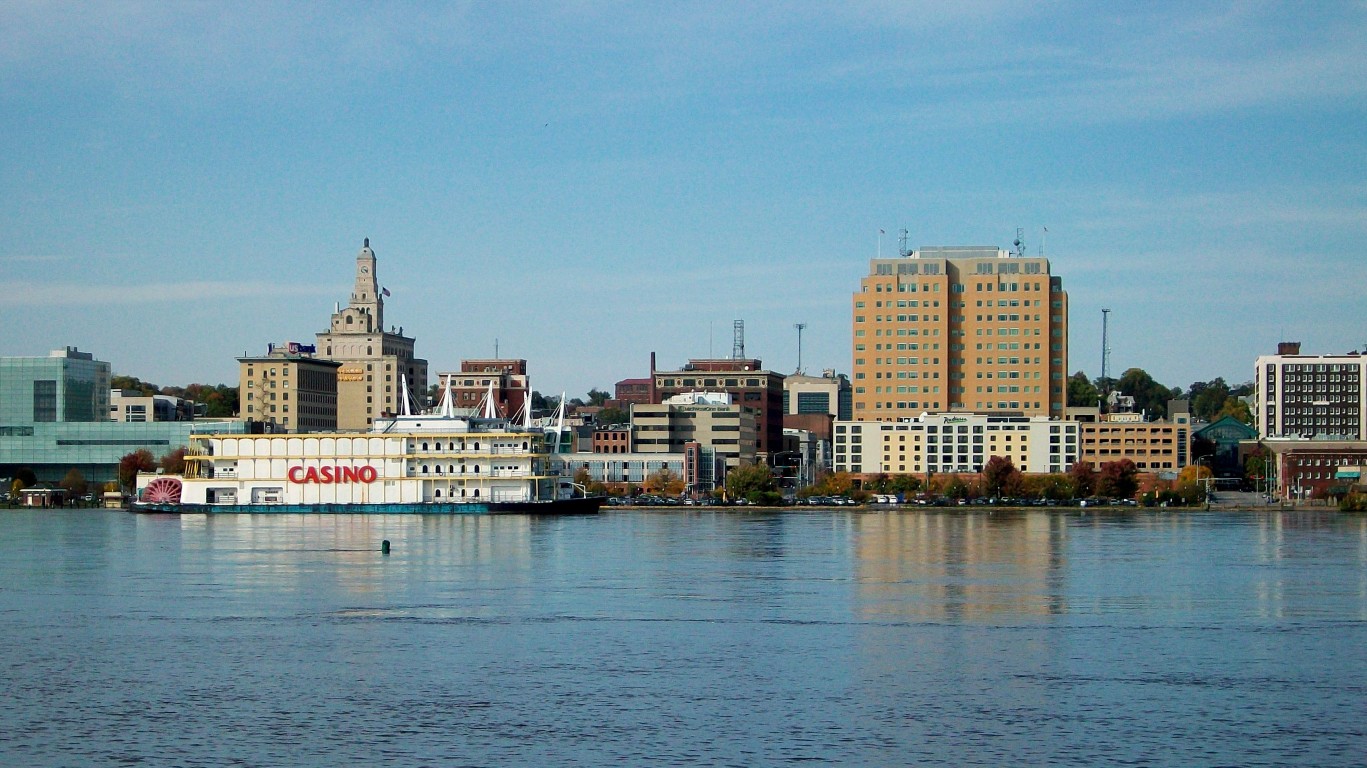
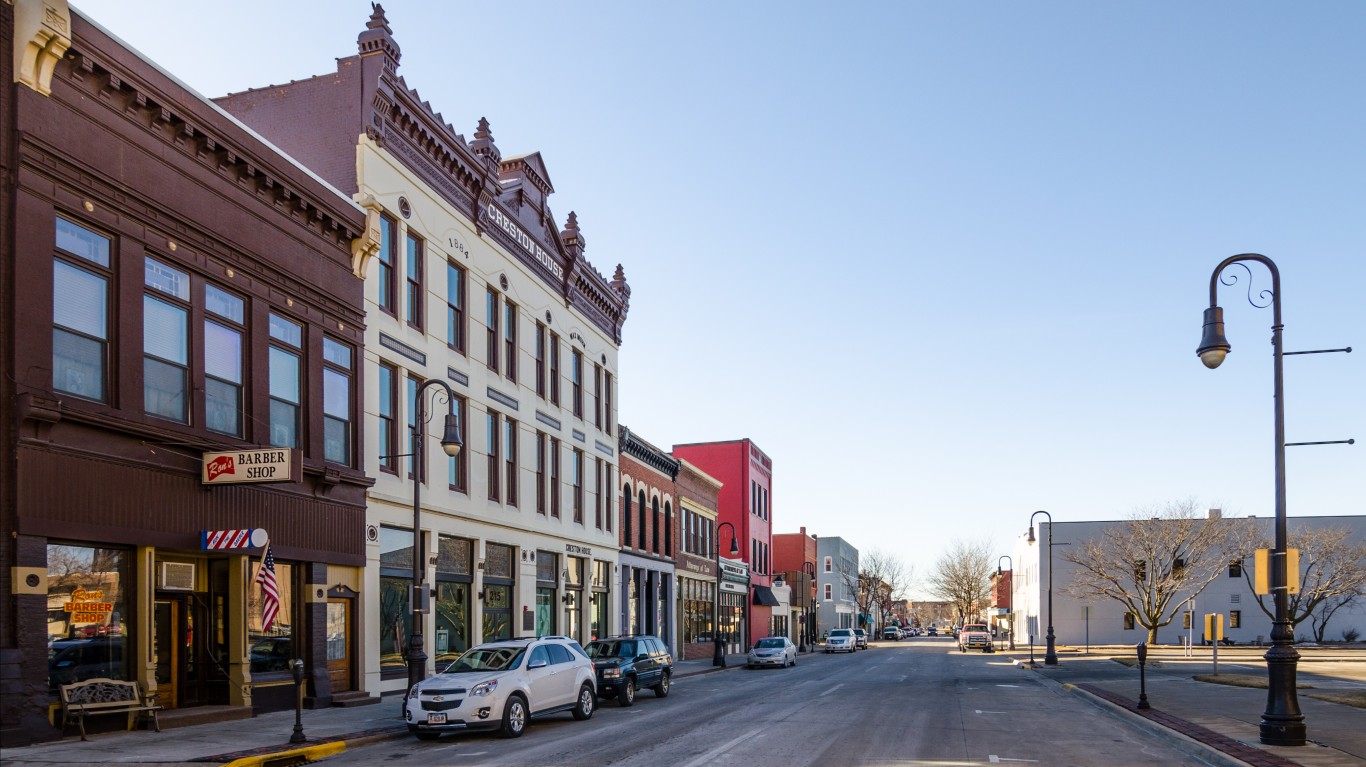
Iowa: Davenport-Moline-Rock Island
> Traffic fatalities per 100,000 people: 6.3 (state: 10.5)
> Avg. commute time: 19.8 min. (state: 19.4 min.)
> Commuters driving to work: 92.7% (state: 89.4%)
> 2017 car thefts per 100,000 people: 278.3
See all stories featuring: Iowa
Kansas: Topeka
> Traffic fatalities per 100,000 people: 14.6 (state: 15.8)
> Avg. commute time: 20.4 min. (state: 19.1 min.)
> Commuters driving to work: 93.2% (state: 91.2%)
> 2017 car thefts per 100,000 people: 450.4
See all stories featuring: Kansas
[in-text-ad]
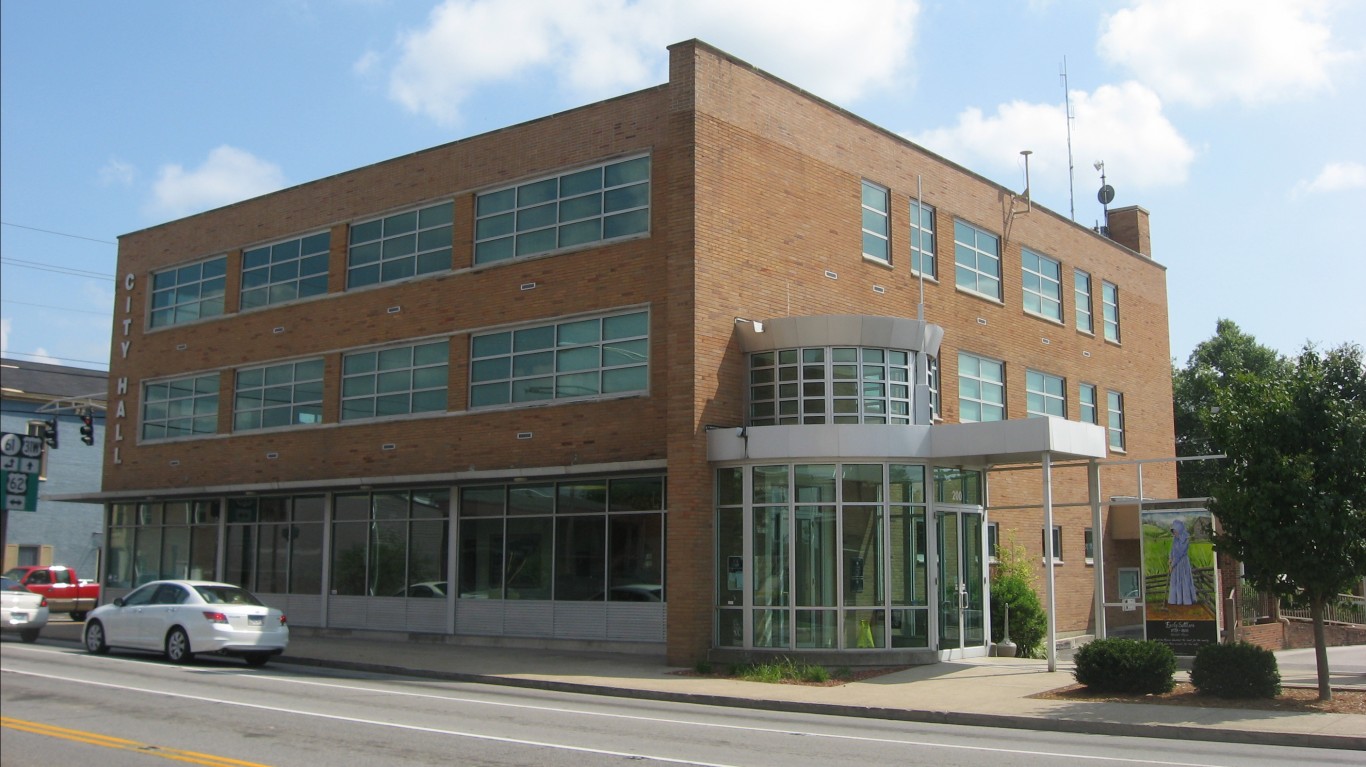
Kentucky: Elizabethtown-Fort Knox
> Traffic fatalities per 100,000 people: 19.4 (state: 17.6)
> Avg. commute time: 24.1 min. (state: 23.3 min.)
> Commuters driving to work: 93.1% (state: 91.4%)
> 2017 car thefts per 100,000 people: 140.3
See all stories featuring: Kentucky
 24/7 Wall St.
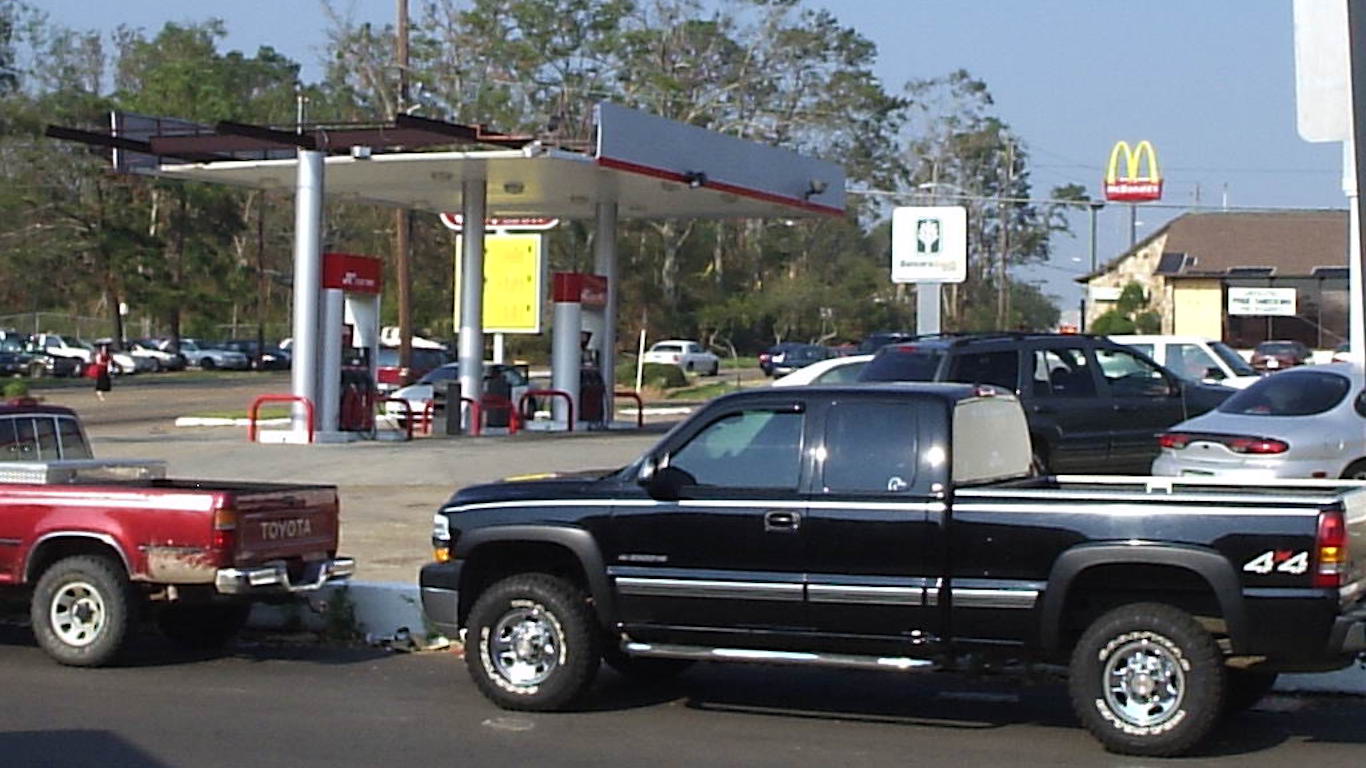
Louisiana: Hammond
> Traffic fatalities per 100,000 people: 23.4 (state: 16.2)
> Avg. commute time: 31.3 min. (state: 25.3 min.)
> Commuters driving to work: 92.8% (state: 91.9%)
> 2017 car thefts per 100,000 people: 247.6
See all stories featuring: Louisiana
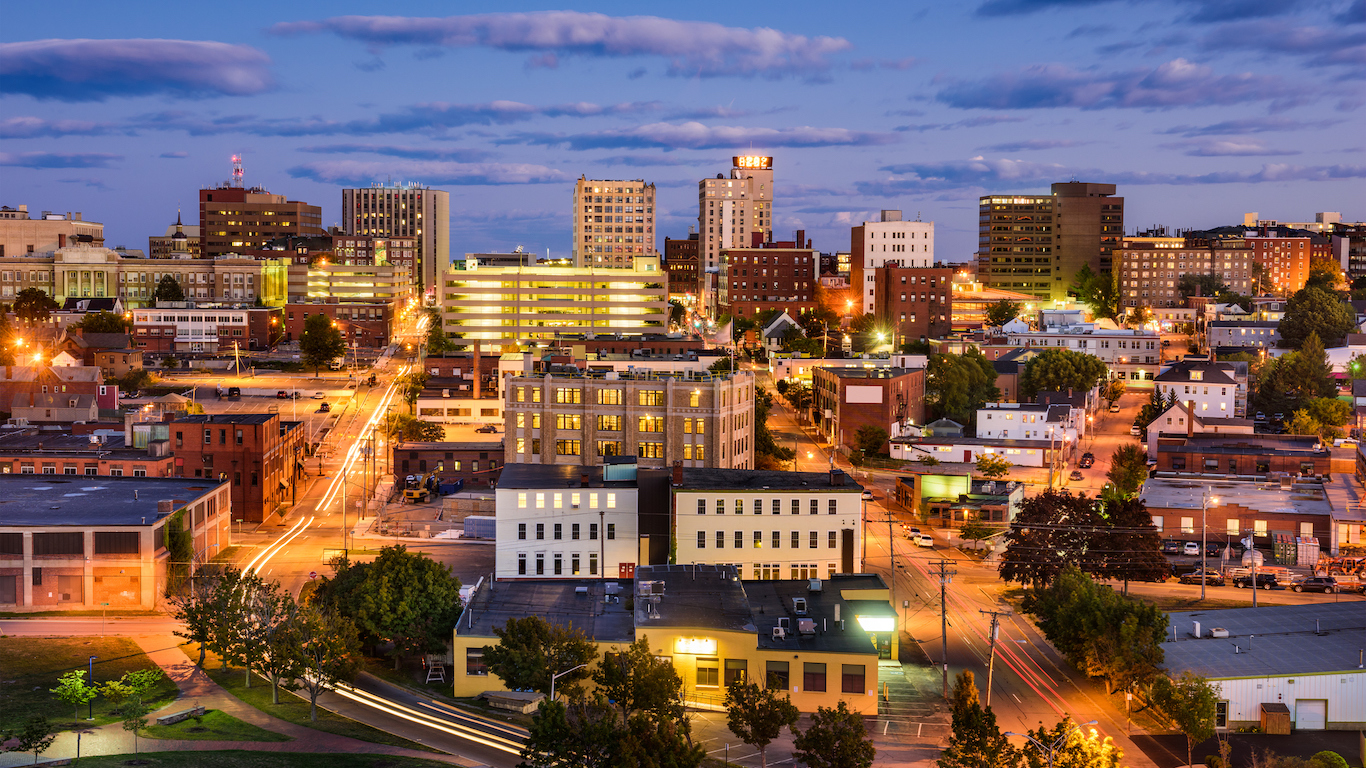
Maine: Portland-South Portland
> Traffic fatalities per 100,000 people: 9.4 (state: 12.9)
> Avg. commute time: 24.8 min. (state: 24 min.)
> Commuters driving to work: 86.5% (state: 87.9%)
> 2017 car thefts per 100,000 people: 49.2
See all stories featuring: Maine
[in-text-ad-2]
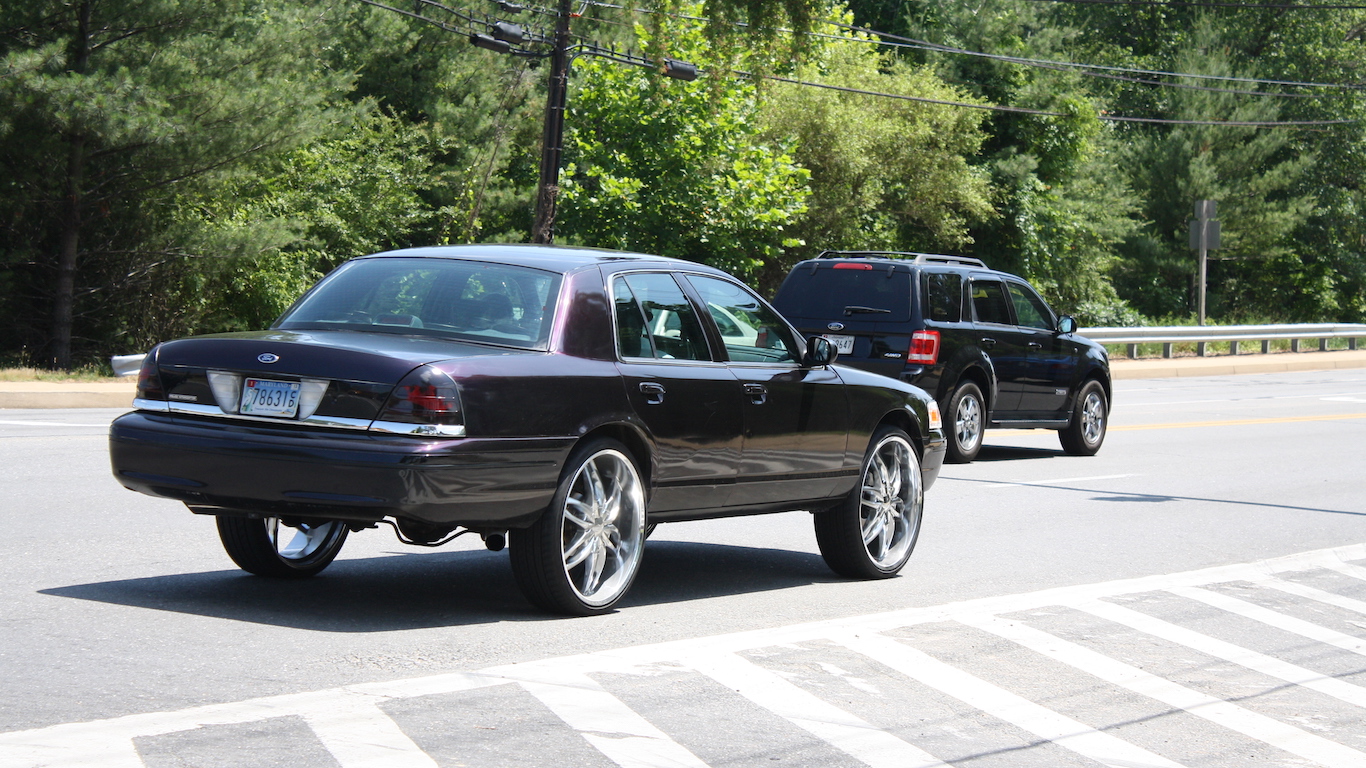
Maryland: California-Lexington Park
> Traffic fatalities per 100,000 people: 16.9 (state: 9.1)
> Avg. commute time: 30.9 min. (state: 33.3 min.)
> Commuters driving to work: 89.9% (state: 82.8%)
> 2017 car thefts per 100,000 people: 55.9
See all stories featuring: Maryland
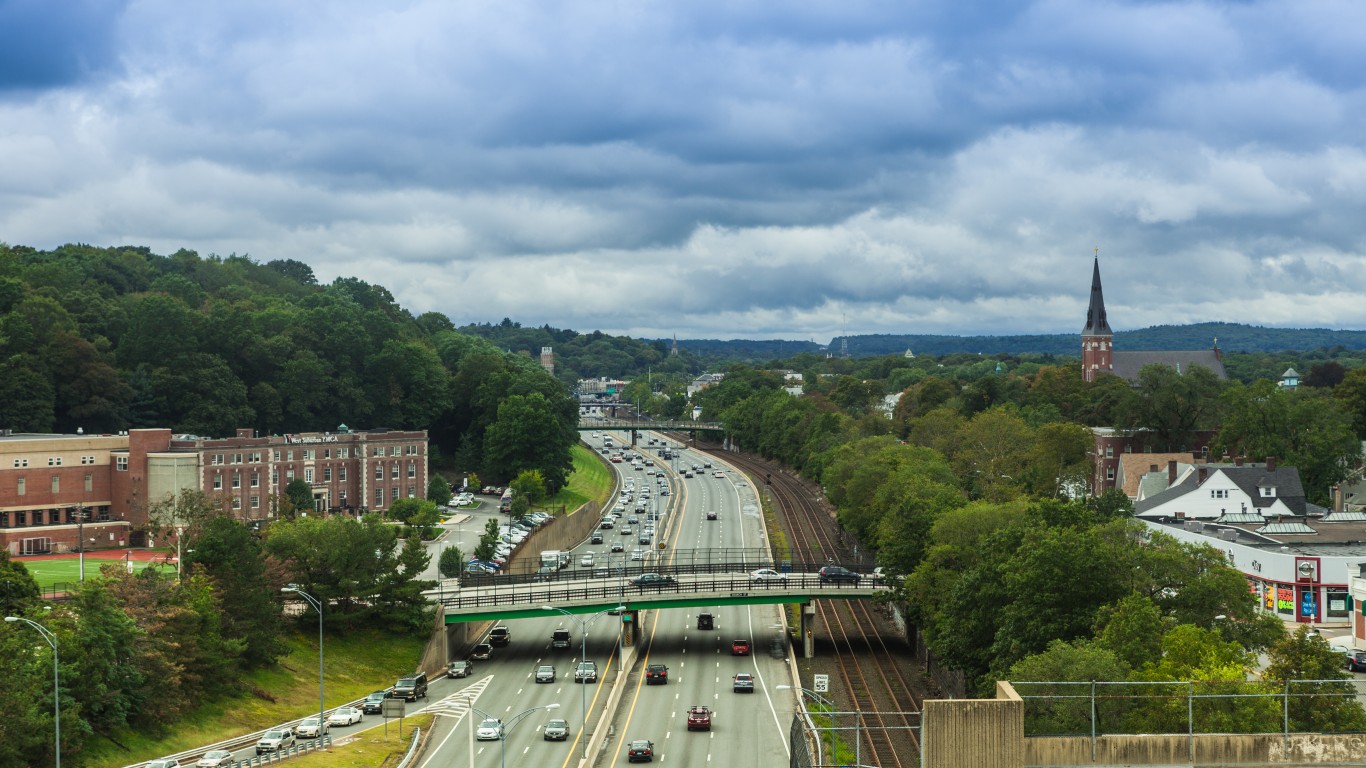
Massachusetts: Boston-Cambridge-Newton
> Traffic fatalities per 100,000 people: 4.2 (state: 5.1)
> Avg. commute time: 31 min. (state: 29.8 min.)
> Commuters driving to work: 73.6% (state: 77.3%)
> 2017 car thefts per 100,000 people: 105.4
See all stories featuring: Massachusetts
[in-text-ad]
Michigan: Monroe
> Traffic fatalities per 100,000 people: 15.4 (state: 10.3)
> Avg. commute time: 24.5 min. (state: 24.3 min.)
> Commuters driving to work: 92.4% (state: 91.2%)
> 2017 car thefts per 100,000 people: 123.6
See all stories featuring: Michigan
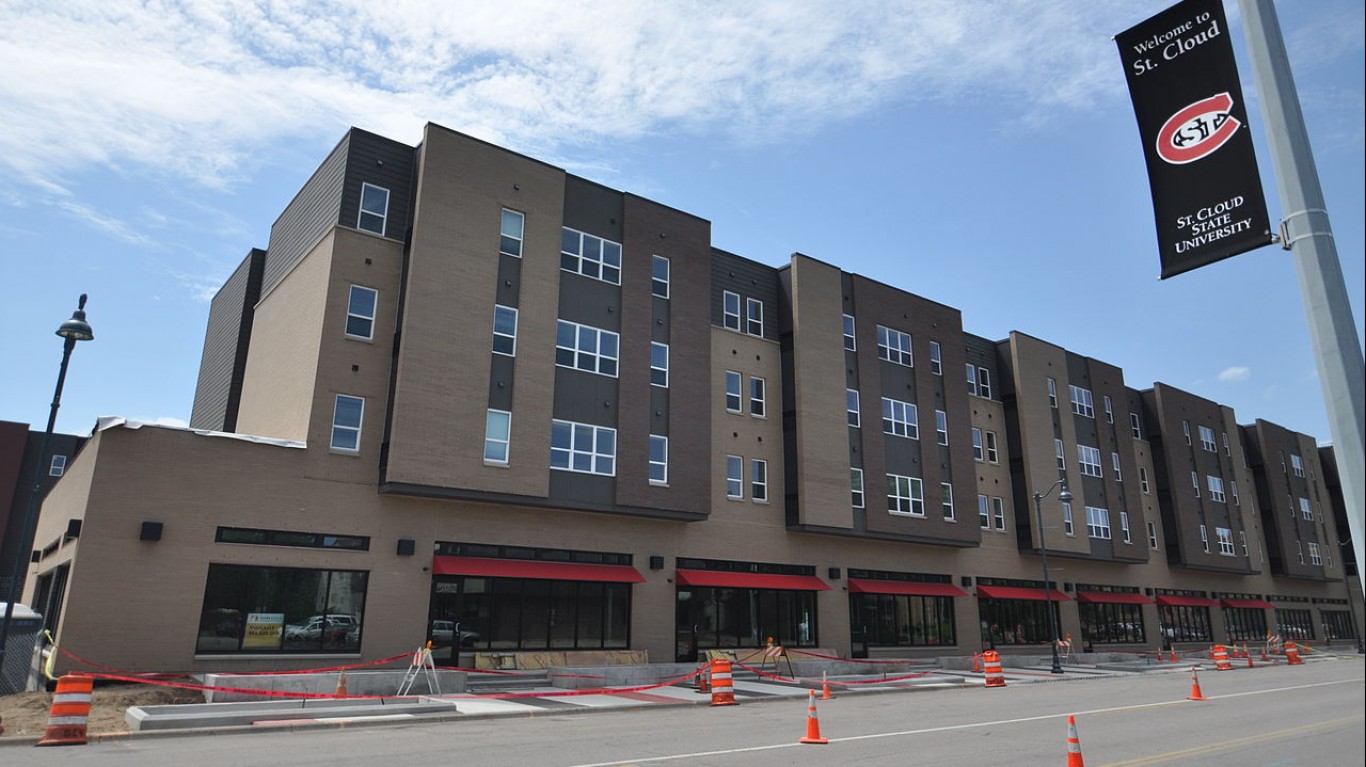
Minnesota: St. Cloud
> Traffic fatalities per 100,000 people: 11.1 (state: 6.4)
> Avg. commute time: 20.9 min. (state: 23.8 min.)
> Commuters driving to work: 89.6% (state: 86.2%)
> 2017 car thefts per 100,000 people: 151.2
See all stories featuring: Minnesota
Mississippi: Hattiesburg
> Traffic fatalities per 100,000 people: 21.8 (state: 23.1)
> Avg. commute time: 23.8 min. (state: 24.9 min.)
> Commuters driving to work: 87.6% (state: 94.6%)
> 2017 car thefts per 100,000 people: 216.3
See all stories featuring: Mississippi
[in-text-ad-2]
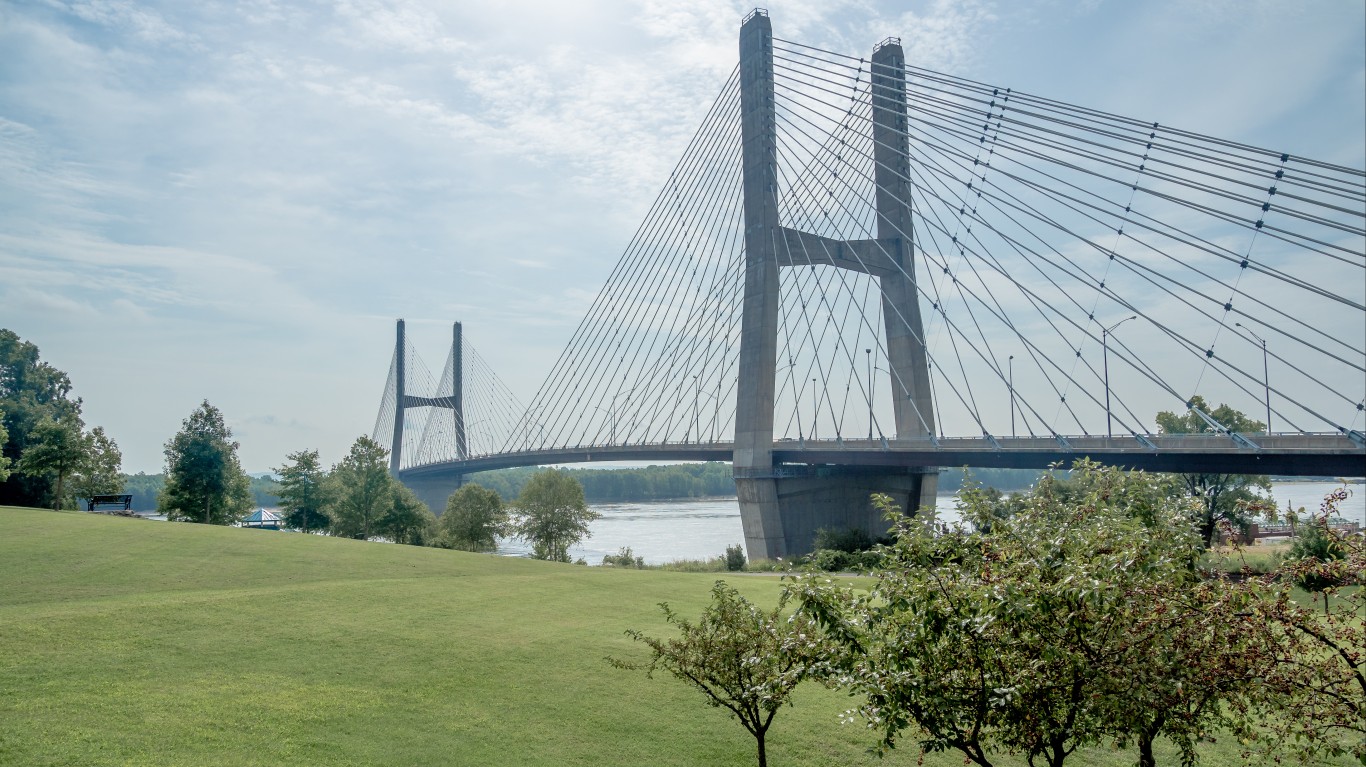
Missouri: Cape Girardeau
> Traffic fatalities per 100,000 people: 18.3 (state: 15.2)
> Avg. commute time: 21.4 min. (state: 23.7 min.)
> Commuters driving to work: 89.0% (state: 90.6%)
> 2017 car thefts per 100,000 people: 149.8
See all stories featuring: Missouri
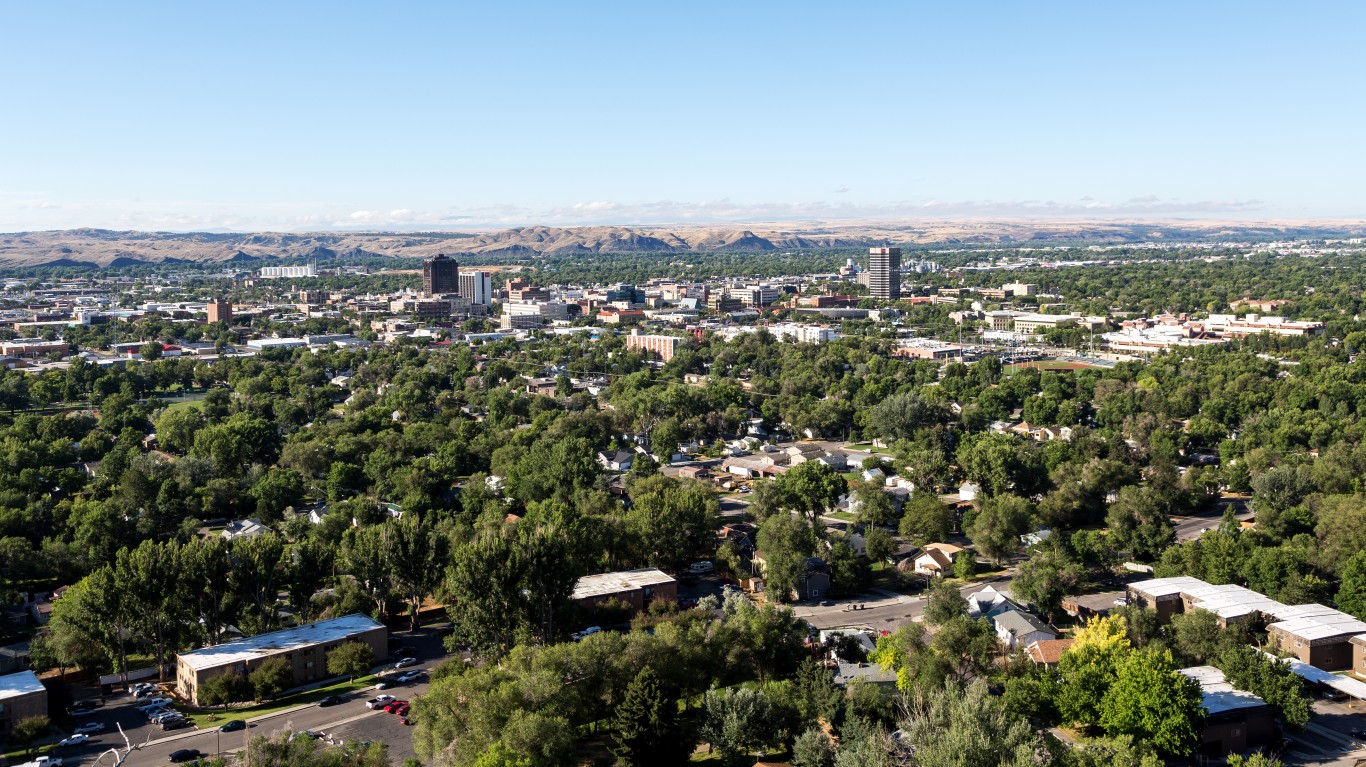
Montana: Billings
> Traffic fatalities per 100,000 people: 8.1 (state: 17.7)
> Avg. commute time: 18.9 min. (state: 18.1 min.)
> Commuters driving to work: 90.2% (state: 85.4%)
> 2017 car thefts per 100,000 people: 558.4
See all stories featuring: Montana
[in-text-ad]
Nebraska: Omaha-Council Bluffs
> Traffic fatalities per 100,000 people: 9.2 (state: 11.9)
> Avg. commute time: 20.2 min. (state: 18.5 min.)
> Commuters driving to work: 91.7% (state: 90.8%)
> 2017 car thefts per 100,000 people: 429.3
See all stories featuring: Nebraska

Nevada: Las Vegas-Henderson-Paradise
> Traffic fatalities per 100,000 people: 9.4 (state: 10.3)
> Avg. commute time: 24.5 min. (state: 24.2 min.)
> Commuters driving to work: 88.1% (state: 88.3%)
> 2017 car thefts per 100,000 people: 482.0
See all stories featuring: Nevada

New Hampshire: Manchester-Nashua
> Traffic fatalities per 100,000 people: 4.9 (state: 7.6)
> Avg. commute time: 27.9 min. (state: 27.3 min.)
> Commuters driving to work: 89.6% (state: 89.2%)
> 2017 car thefts per 100,000 people: 62.7
See all stories featuring: New Hampshire
[in-text-ad-2]
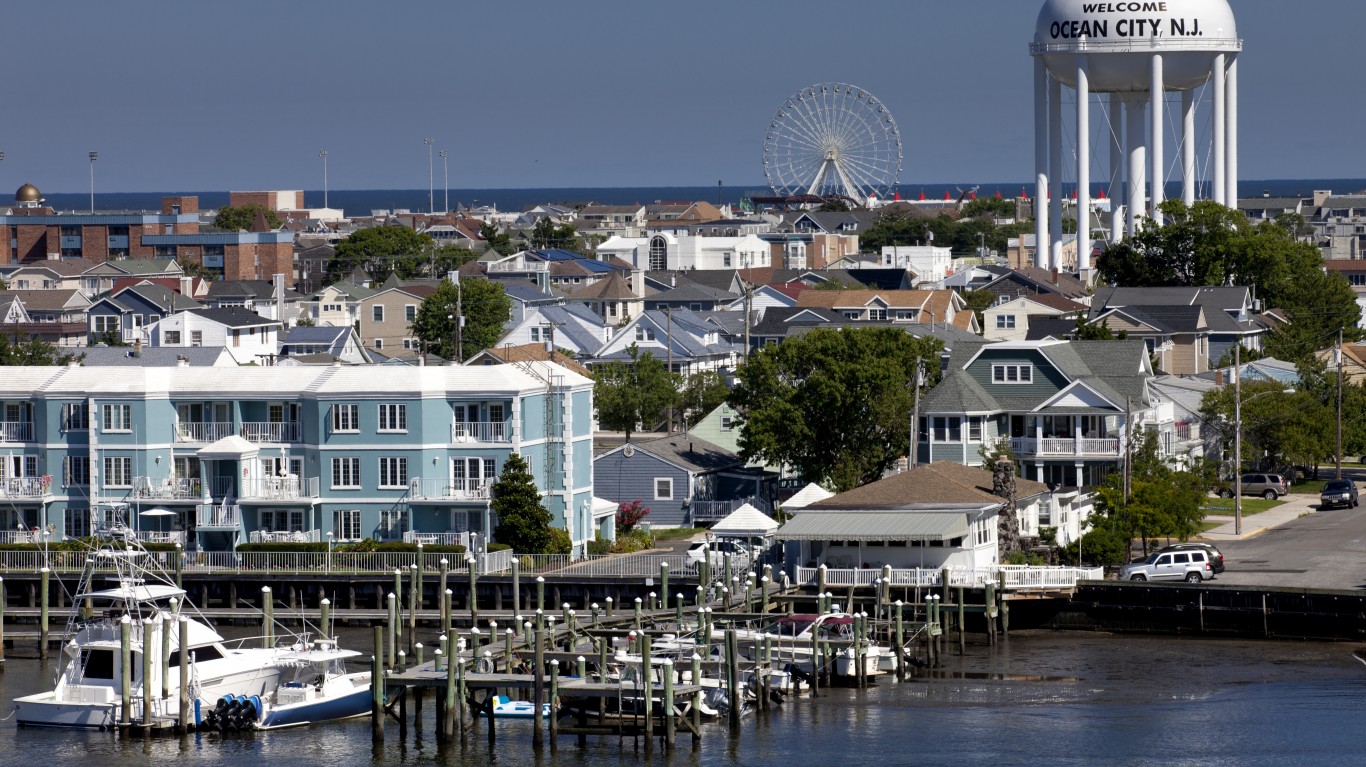
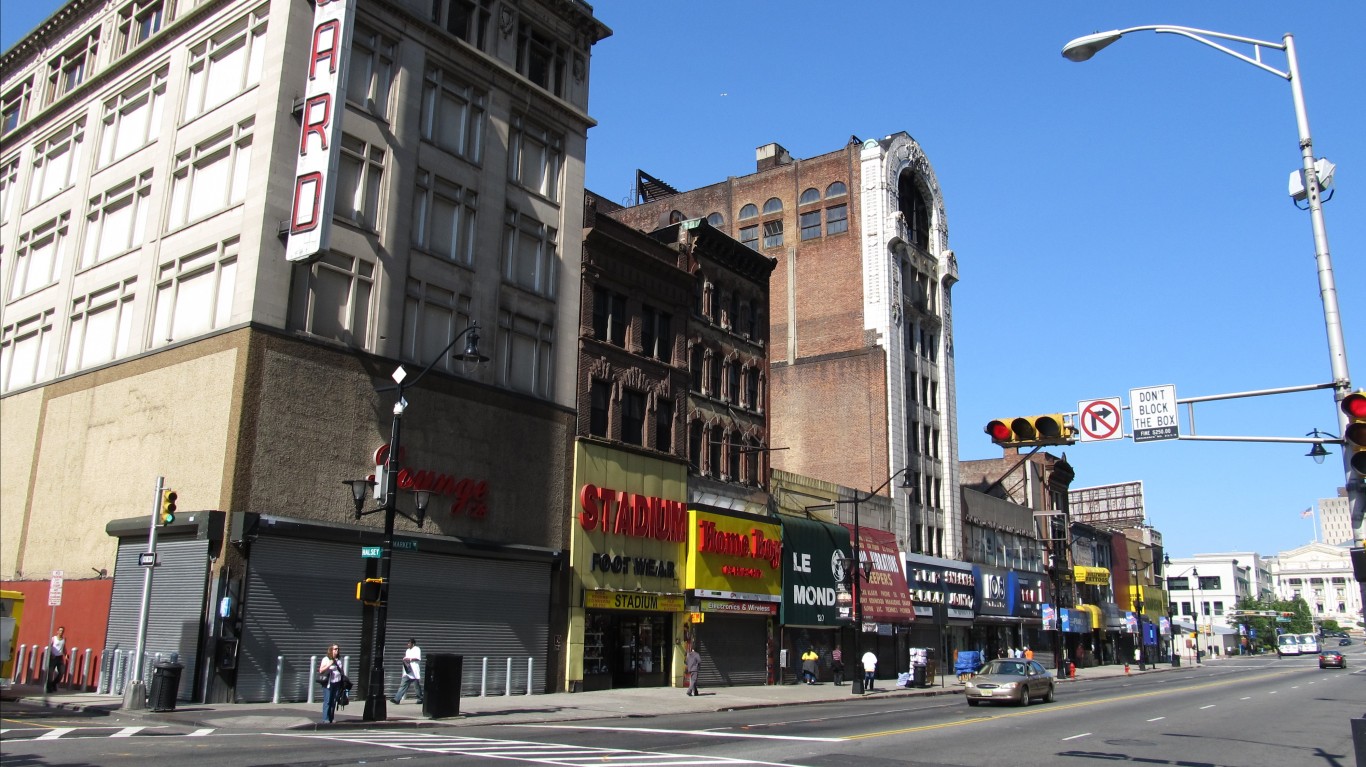
New Jersey: Ocean City
> Traffic fatalities per 100,000 people: 17.1 (state: 6.9)
> Avg. commute time: 22.9 min. (state: 32.1 min.)
> Commuters driving to work: 89.1% (state: 78.9%)
> 2017 car thefts per 100,000 people: 87.7
See all stories featuring: New Jersey
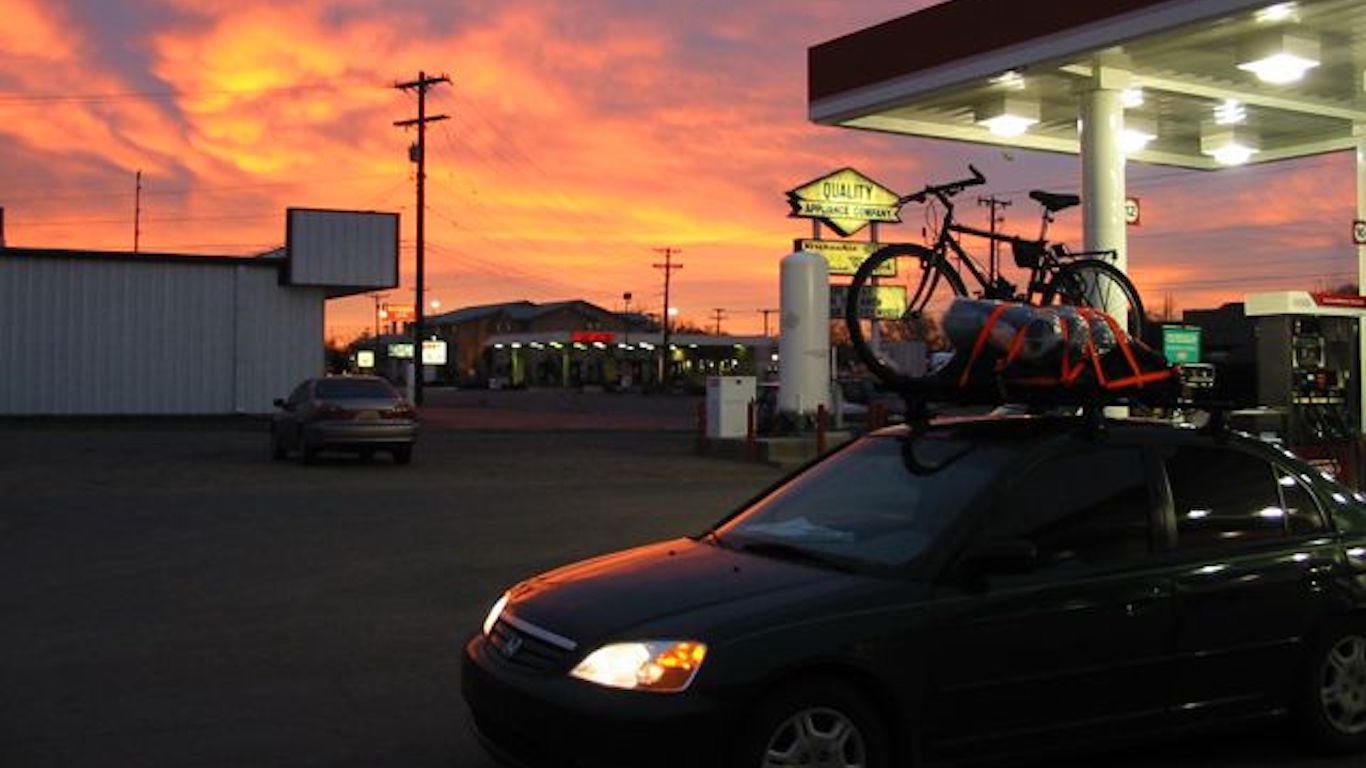
New Mexico: Farmington
> Traffic fatalities per 100,000 people: 26.8 (state: 18.2)
> Avg. commute time: 23.9 min. (state: 22.3 min.)
> Commuters driving to work: 95.2% (state: 90.0%)
> 2017 car thefts per 100,000 people: 215.1
See all stories featuring: New Mexico
[in-text-ad]
New York: New York-Newark-Jersey City
> Traffic fatalities per 100,000 people: 4.3 (state: 5.0)
> Avg. commute time: 36.3 min. (state: 33.7 min.)
> Commuters driving to work: 56.4% (state: 59.4%)
> 2017 car thefts per 100,000 people: 104.7
See all stories featuring: New York
North Carolina: Rocky Mount
> Traffic fatalities per 100,000 people: 21.1 (state: 13.7)
> Avg. commute time: 21.9 min. (state: 24.9 min.)
> Commuters driving to work: 92.7% (state: 89.9%)
> 2017 car thefts per 100,000 people: 141.8
See all stories featuring: North Carolina
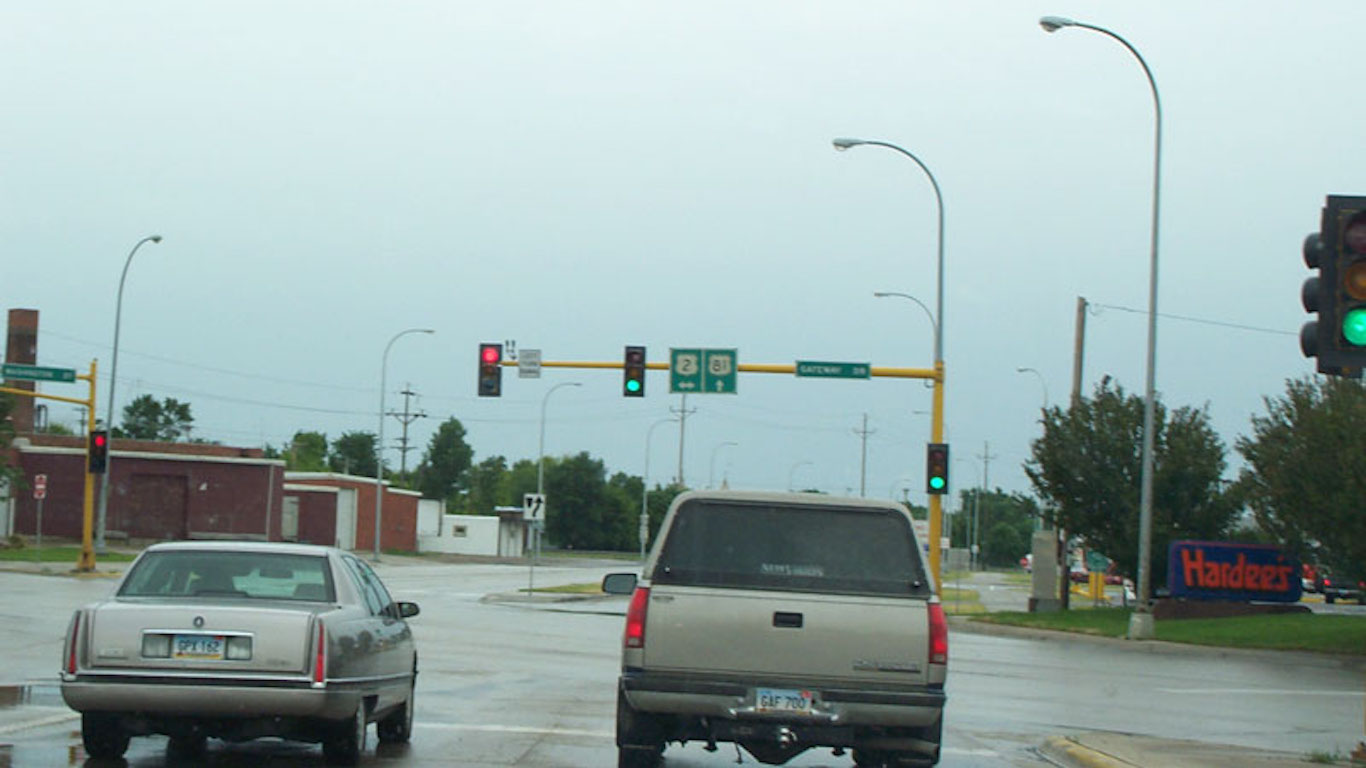
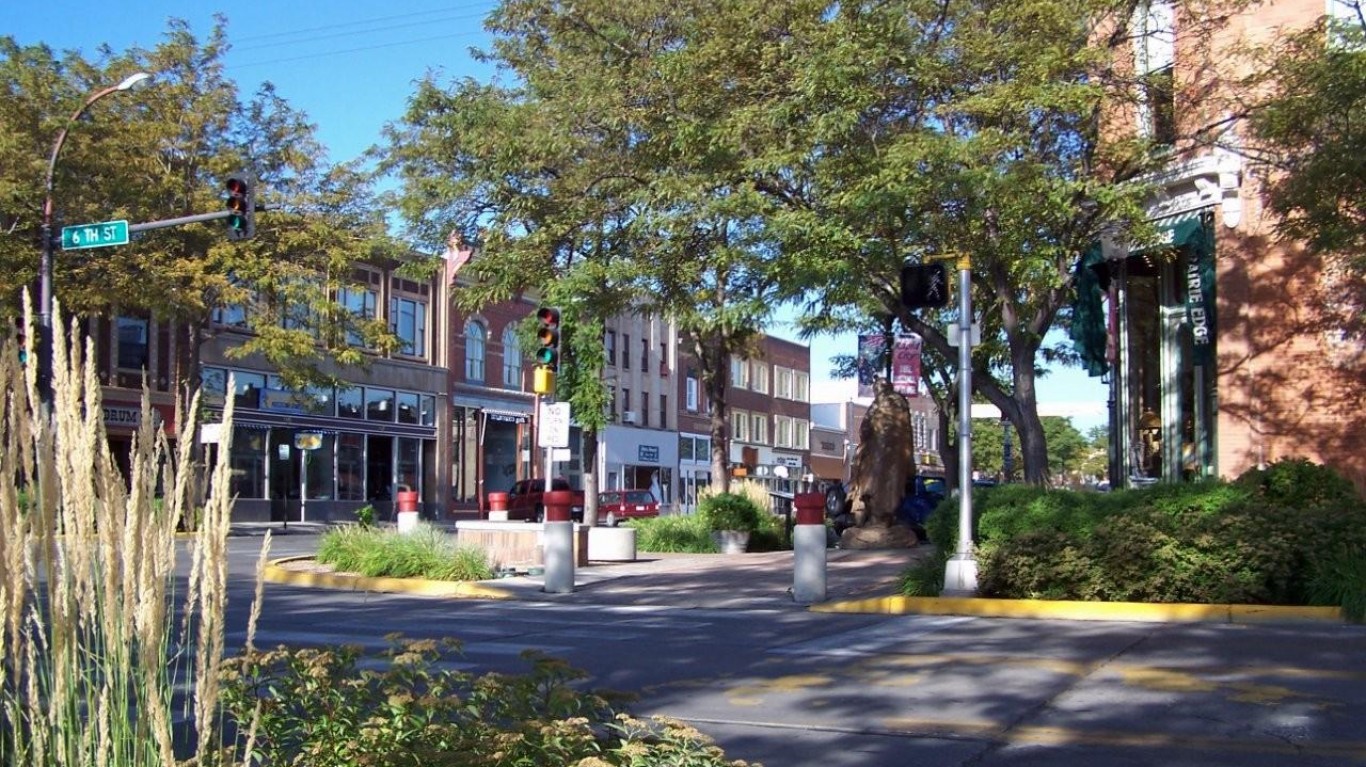
North Dakota: Grand Forks
> Traffic fatalities per 100,000 people: 10.7 (state: 15.2)
> Avg. commute time: 15.4 min. (state: 16.5 min.)
> Commuters driving to work: 88.8% (state: 89.8%)
> 2017 car thefts per 100,000 people: 141.6
See all stories featuring: North Dakota
[in-text-ad-2]
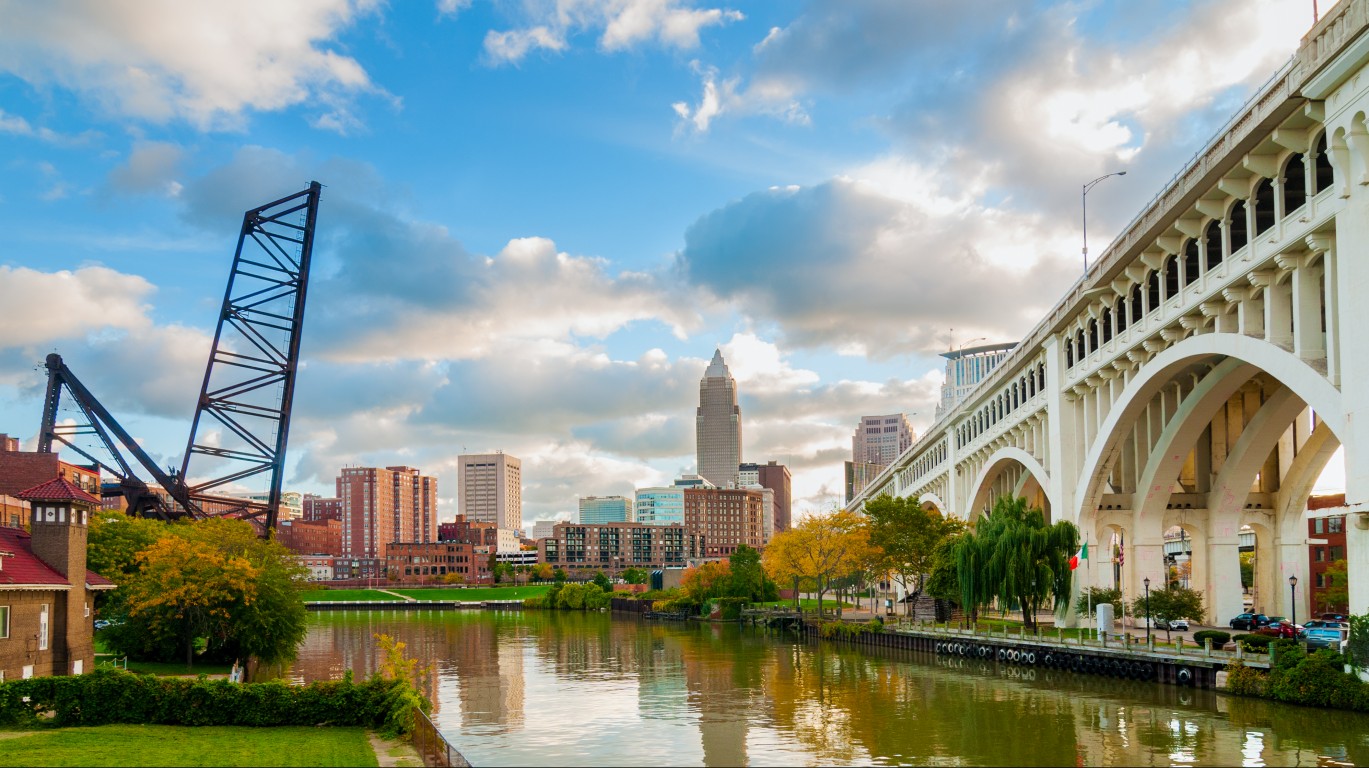
Ohio: Cleveland-Elyria
> Traffic fatalities per 100,000 people: 8.1 (state: 10.1)
> Avg. commute time: 24.6 min. (state: 23.6 min.)
> Commuters driving to work: 89.7% (state: 91.0%)
> 2017 car thefts per 100,000 people: 294.8
See all stories featuring: Ohio
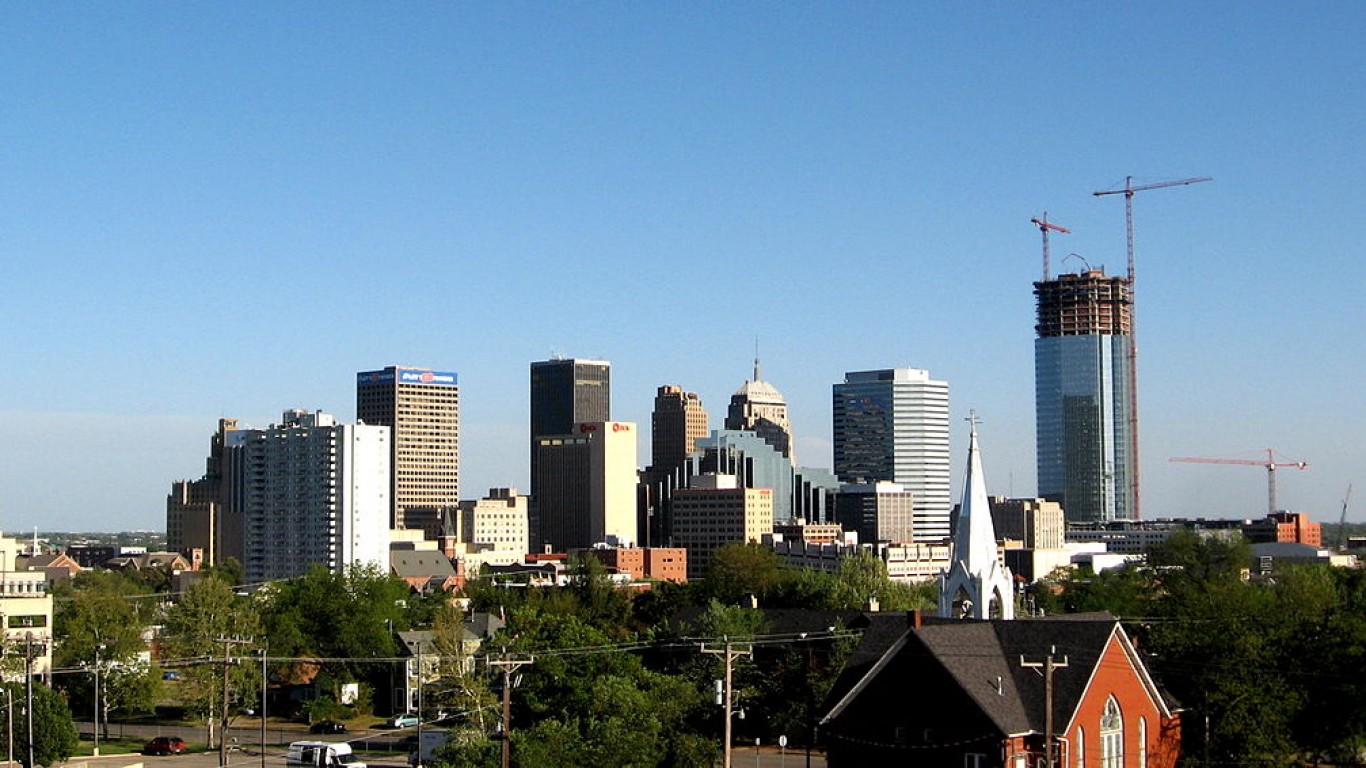
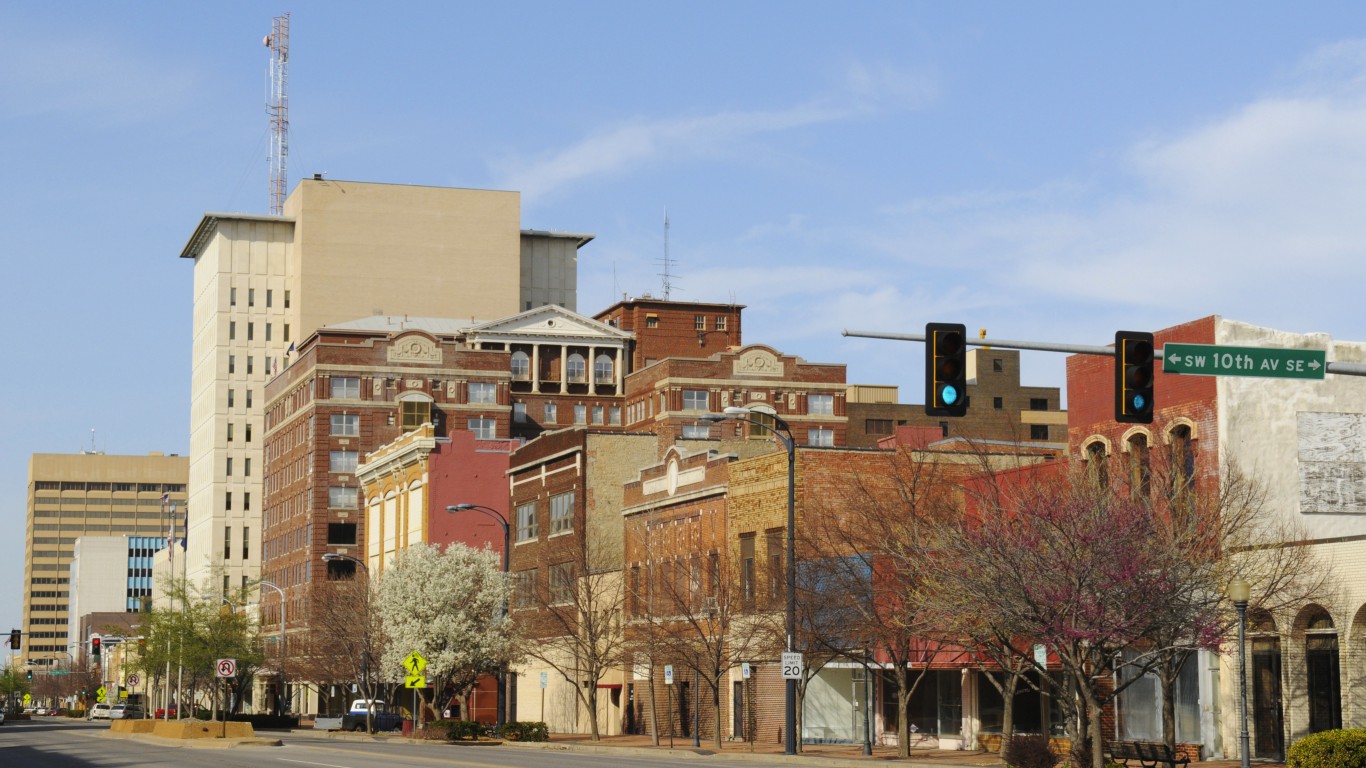
Oklahoma: Oklahoma City
> Traffic fatalities per 100,000 people: 13.0 (state: 16.7)
> Avg. commute time: 22.7 min. (state: 21.9 min.)
> Commuters driving to work: 92.6% (state: 92.1%)
> 2017 car thefts per 100,000 people: 325.1
See all stories featuring: Oklahoma
[in-text-ad]
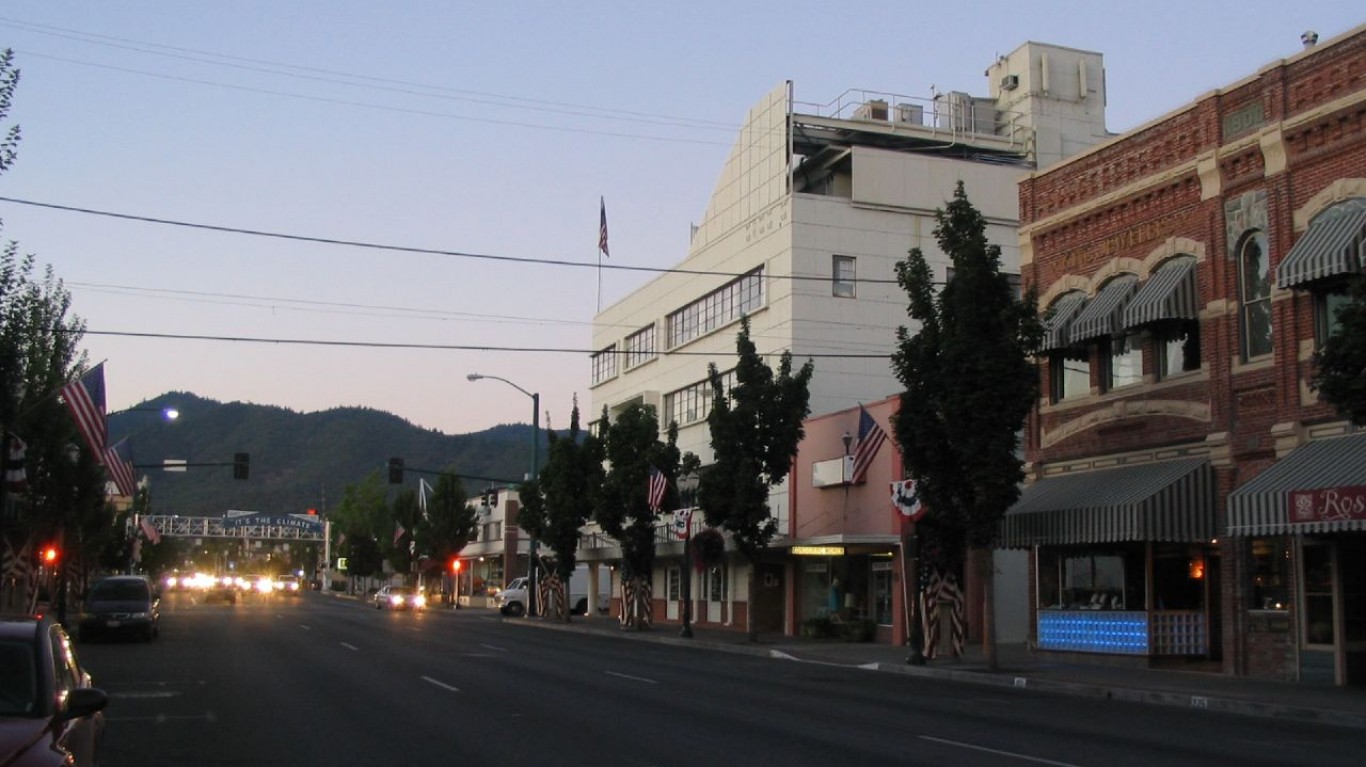
Oregon: Grants Pass
> Traffic fatalities per 100,000 people: 22.0 (state: 10.5)
> Avg. commute time: 20.1 min. (state: 24.3 min.)
> Commuters driving to work: 86.8% (state: 81.4%)
> 2017 car thefts per 100,000 people: 415.7
See all stories featuring: Oregon
 24/7 Wall St.
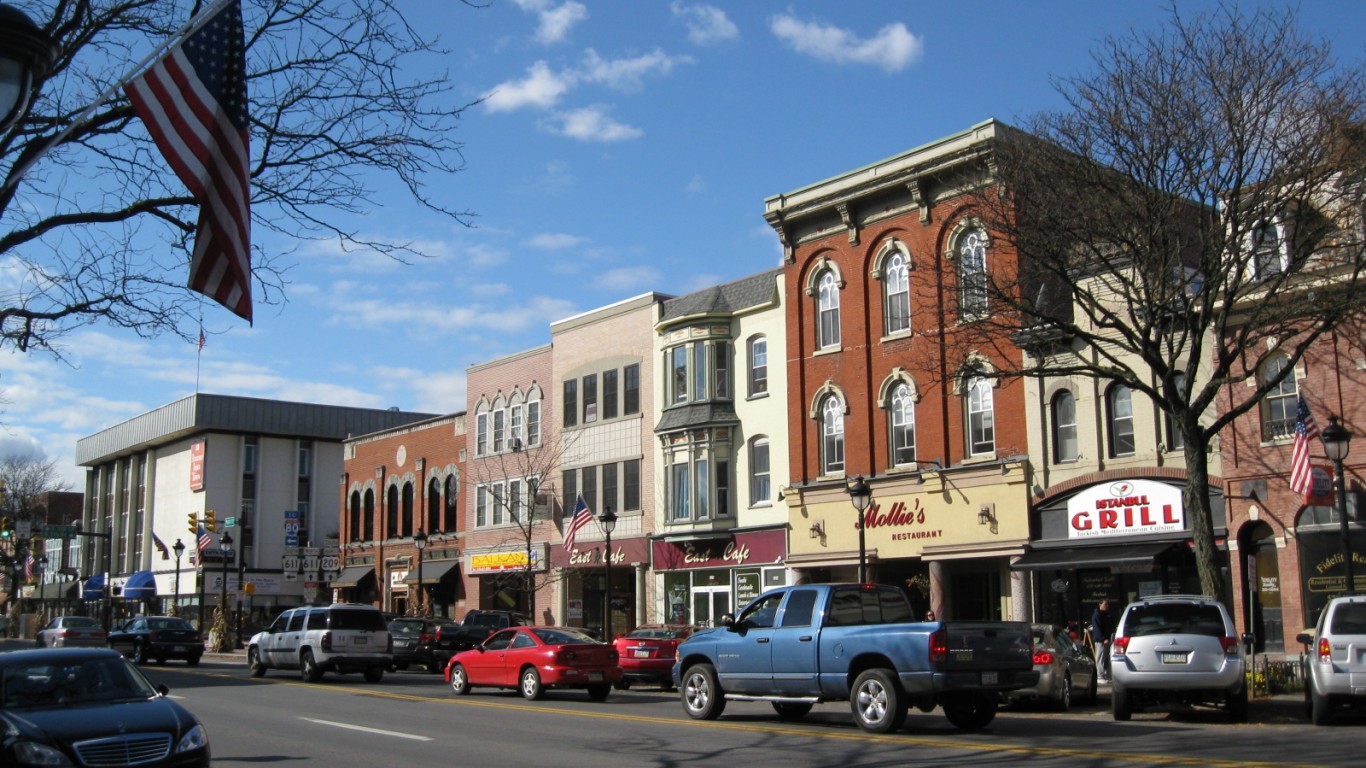
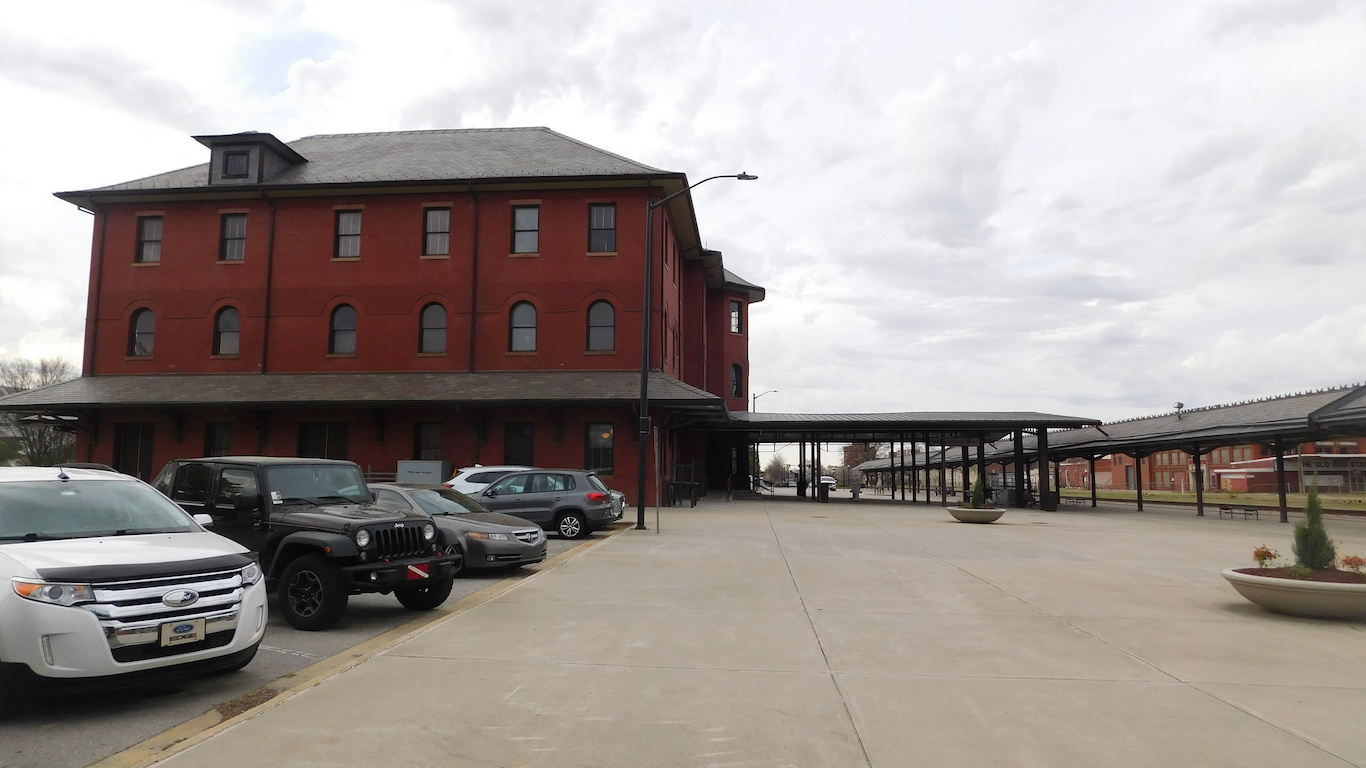
Pennsylvania: East Stroudsburg
> Traffic fatalities per 100,000 people: 10.7 (state: 8.9)
> Avg. commute time: 38.6 min. (state: 27.1 min.)
> Commuters driving to work: 92.3% (state: 84.7%)
> 2017 car thefts per 100,000 people: 66.1
See all stories featuring: Pennsylvania
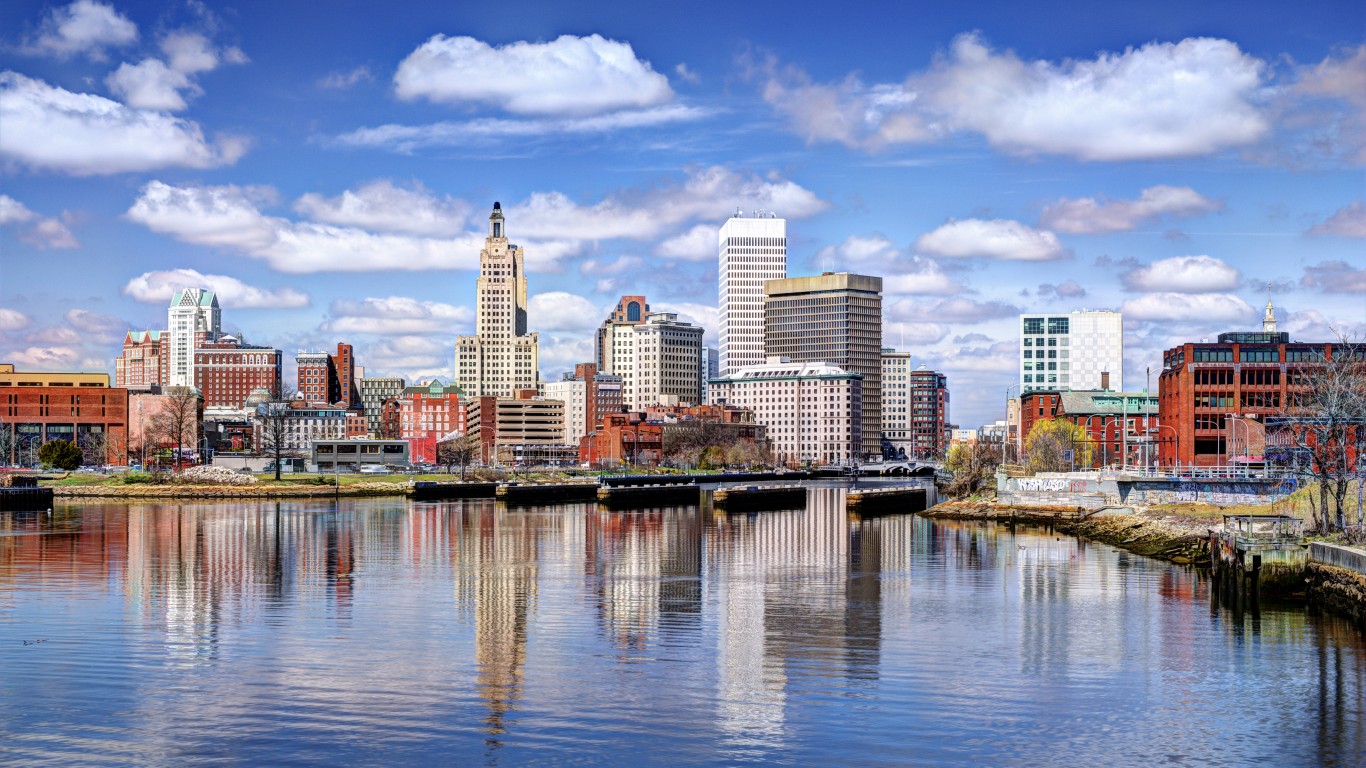
Rhode Island: Providence-Warwick
> Traffic fatalities per 100,000 people: 7.9 (state: 7.8)
> Avg. commute time: 25.8 min. (state: 25.1 min.)
> Commuters driving to work: 89.2% (state: 88.8%)
> 2017 car thefts per 100,000 people: 140.6
See all stories featuring: Rhode Island
[in-text-ad-2]
South Carolina: Florence
> Traffic fatalities per 100,000 people: 22.8 (state: 19.7)
> Avg. commute time: 23.1 min. (state: 24.6 min.)
> Commuters driving to work: 92.1% (state: 91.3%)
> 2017 car thefts per 100,000 people: 275.5
See all stories featuring: South Carolina
South Dakota: Rapid City
> Traffic fatalities per 100,000 people: 14.3 (state: 14.8)
> Avg. commute time: 18.4 min. (state: 17.3 min.)
> Commuters driving to work: 88.8% (state: 89.0%)
> 2017 car thefts per 100,000 people: 252.6
See all stories featuring: South Dakota
[in-text-ad]
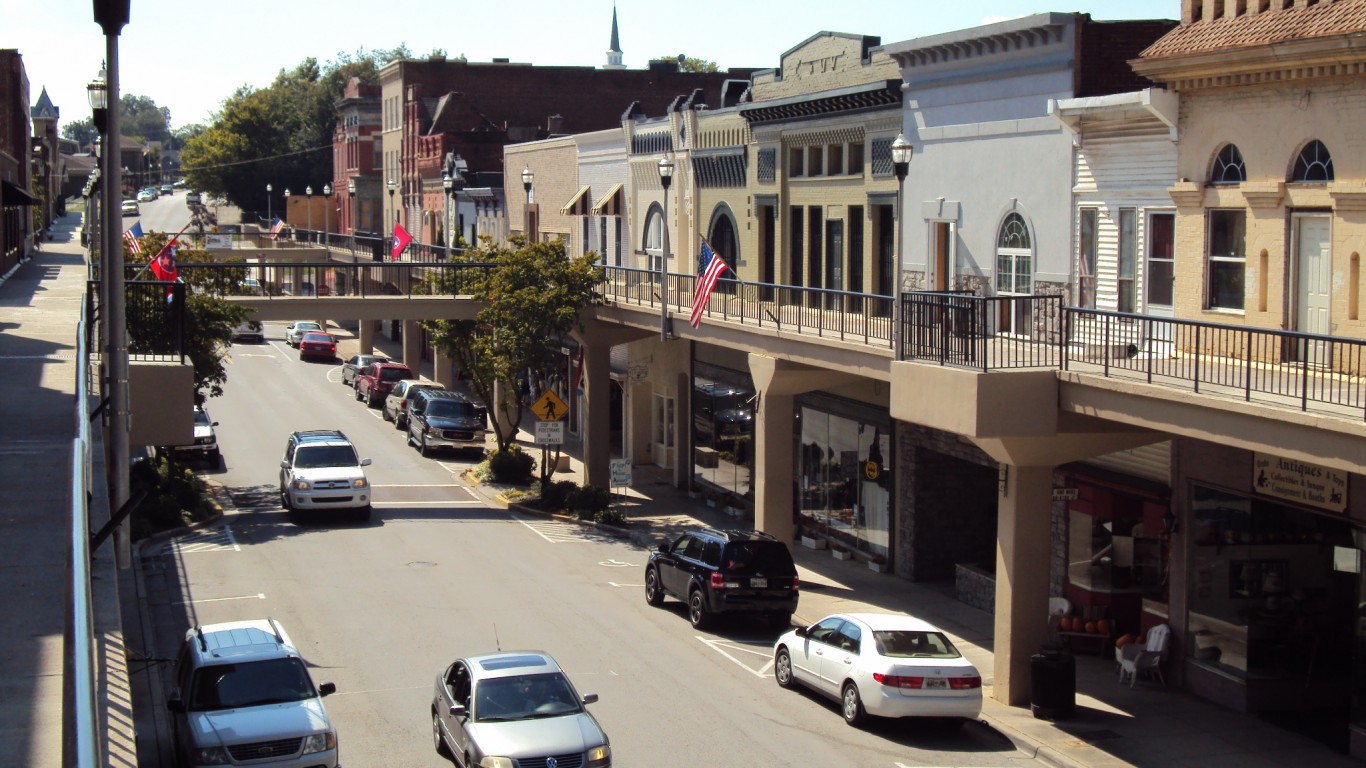
Tennessee: Morristown
> Traffic fatalities per 100,000 people: 16.9 (state: 15.5)
> Avg. commute time: 23.8 min. (state: 25.1 min.)
> Commuters driving to work: N/A (state: 92.0%)
> 2017 car thefts per 100,000 people: 260.0
See all stories featuring: Tennessee
 24/7 Wall St.
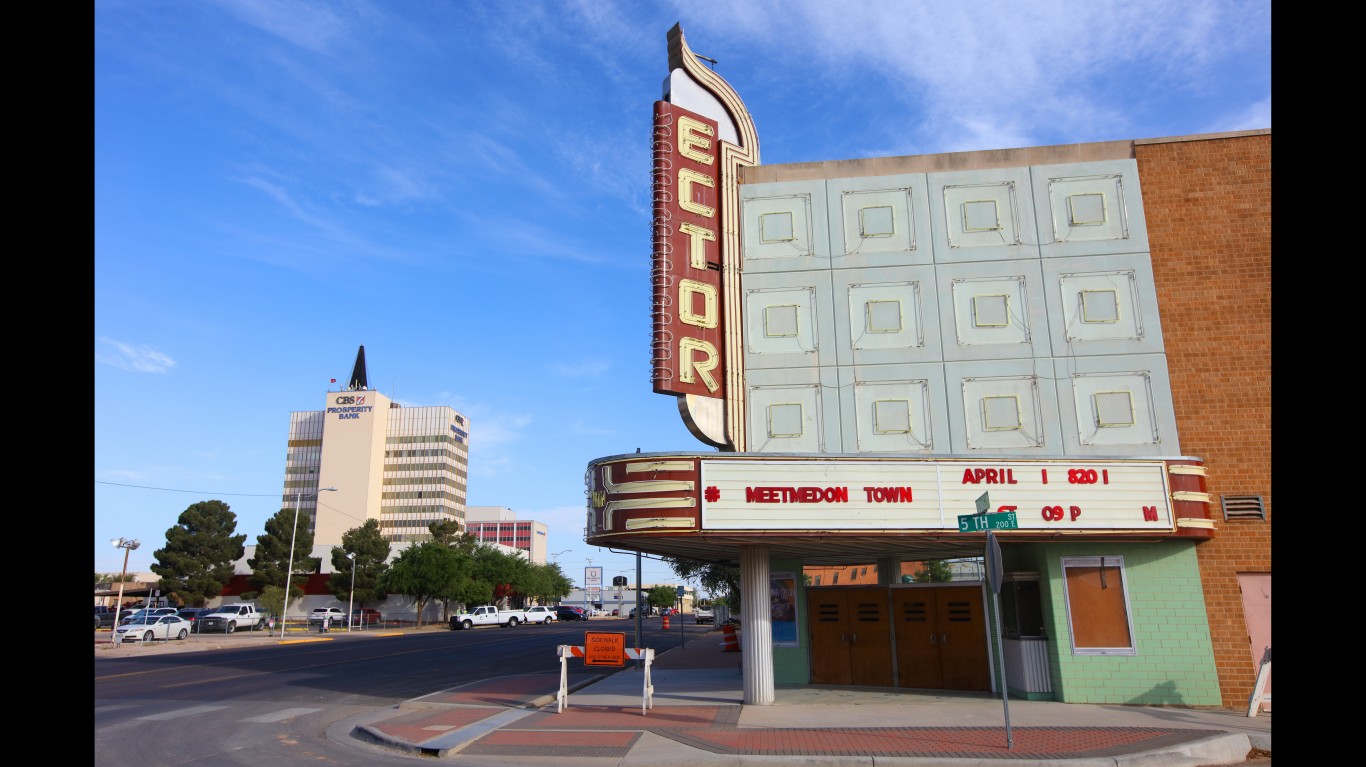
Texas: Odessa
> Traffic fatalities per 100,000 people: 30.6 (state: 13.1)
> Avg. commute time: 22 min. (state: 26.5 min.)
> Commuters driving to work: 91.7% (state: 90.4%)
> 2017 car thefts per 100,000 people: 336.1
See all stories featuring: Texas
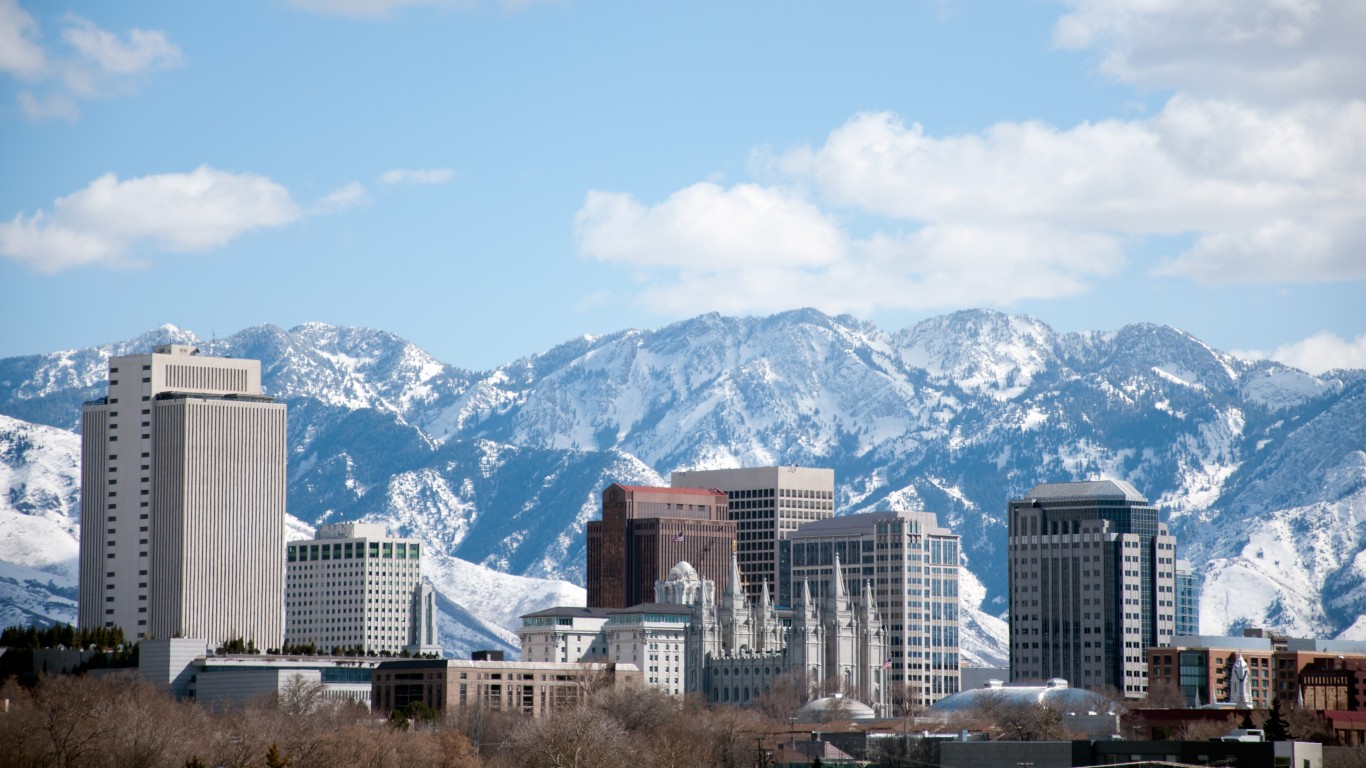
Utah: Salt Lake City
> Traffic fatalities per 100,000 people: 6.5 (state: 8.8)
> Avg. commute time: 22.4 min. (state: 22 min.)
> Commuters driving to work: 86.5% (state: 86.8%)
> 2017 car thefts per 100,000 people: 564.0
See all stories featuring: Utah
[in-text-ad-2]
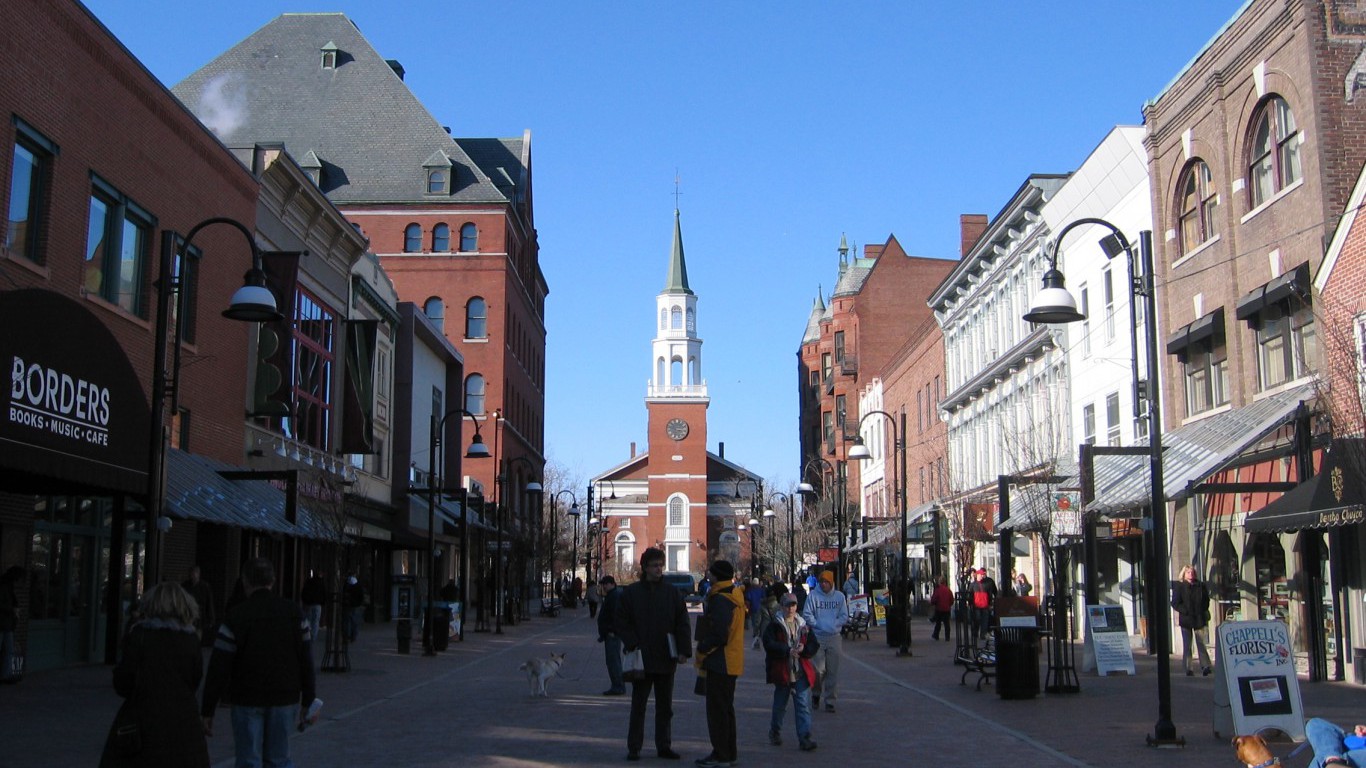
Vermont: Burlington-South Burlington
> Traffic fatalities per 100,000 people: 6.4 (state: 11.1)
> Avg. commute time: 22.4 min. (state: 23.2 min.)
> Commuters driving to work: 83.8% (state: 84.0%)
> 2017 car thefts per 100,000 people: 72.8
See all stories featuring: Vermont
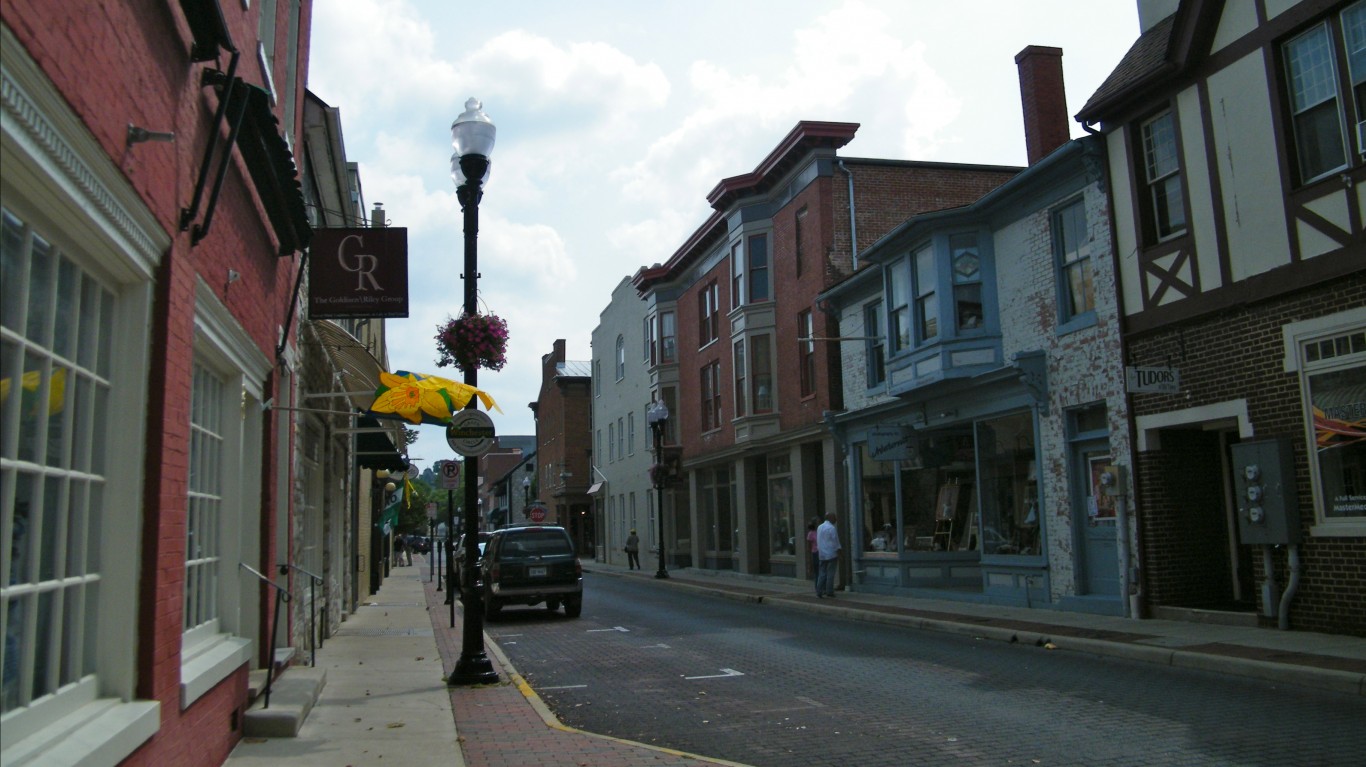
Virginia: Winchester
> Traffic fatalities per 100,000 people: 18.0 (state: 9.9)
> Avg. commute time: 30.7 min. (state: 28.6 min.)
> Commuters driving to work: 90.5% (state: 86.0%)
> 2017 car thefts per 100,000 people: 47.9
See all stories featuring: Virginia
[in-text-ad]
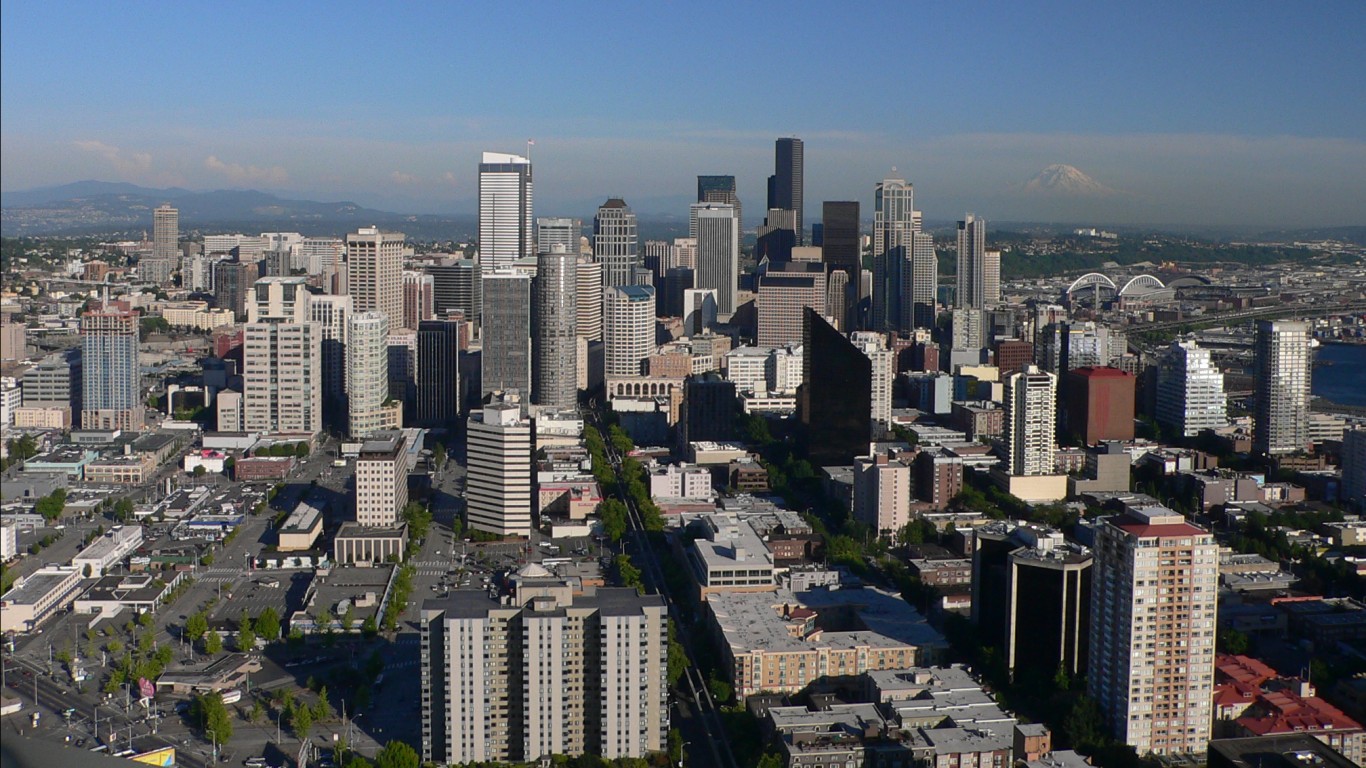
Washington: Seattle-Tacoma-Bellevue
> Traffic fatalities per 100,000 people: 5.4 (state: 7.6)
> Avg. commute time: 30.1 min. (state: 27.9 min.)
> Commuters driving to work: 78.1% (state: 81.9%)
> 2017 car thefts per 100,000 people: 494.9
See all stories featuring: Washington
 24/7 Wall St.
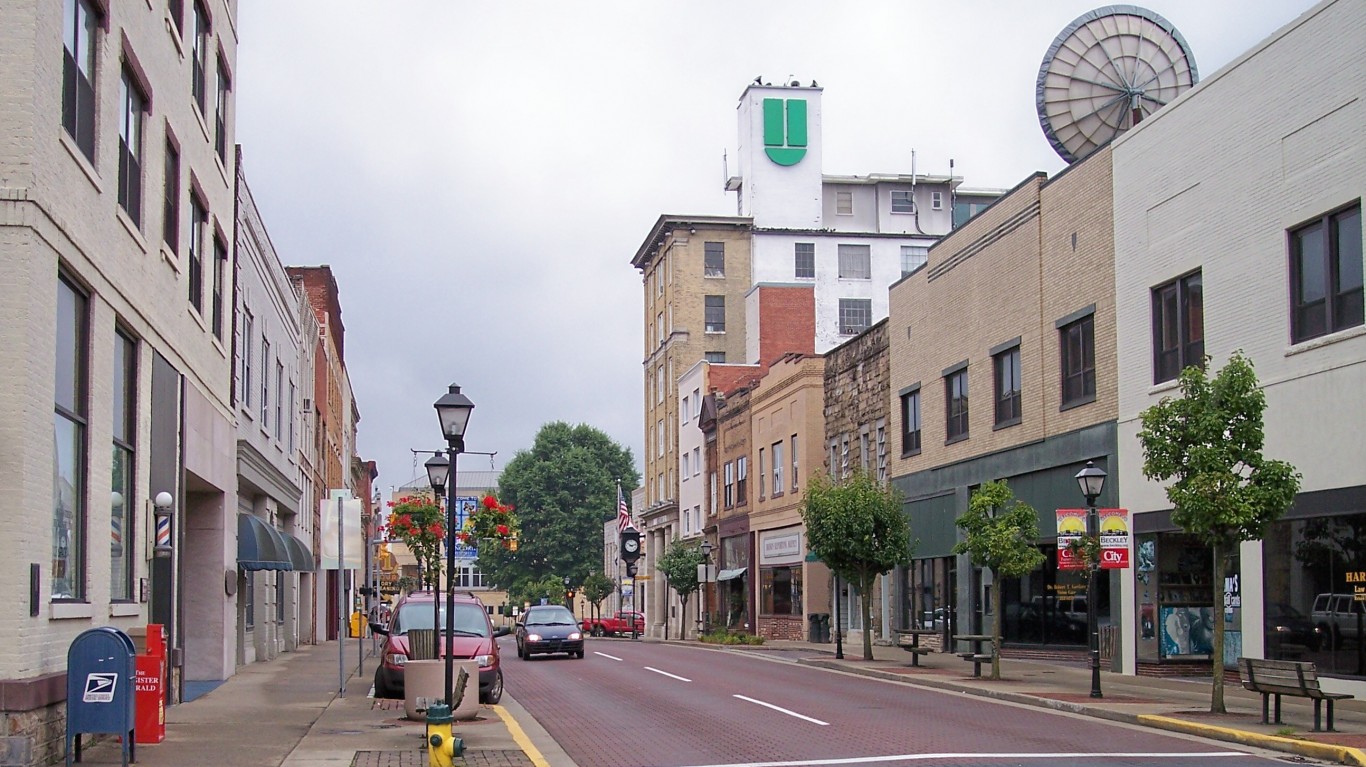
West Virginia: Beckley
> Traffic fatalities per 100,000 people: 17.7 (state: 16.7)
> Avg. commute time: 25.7 min. (state: 26 min.)
> Commuters driving to work: 93.5% (state: 91.8%)
> 2017 car thefts per 100,000 people: 90.3
See all stories featuring: West Virginia
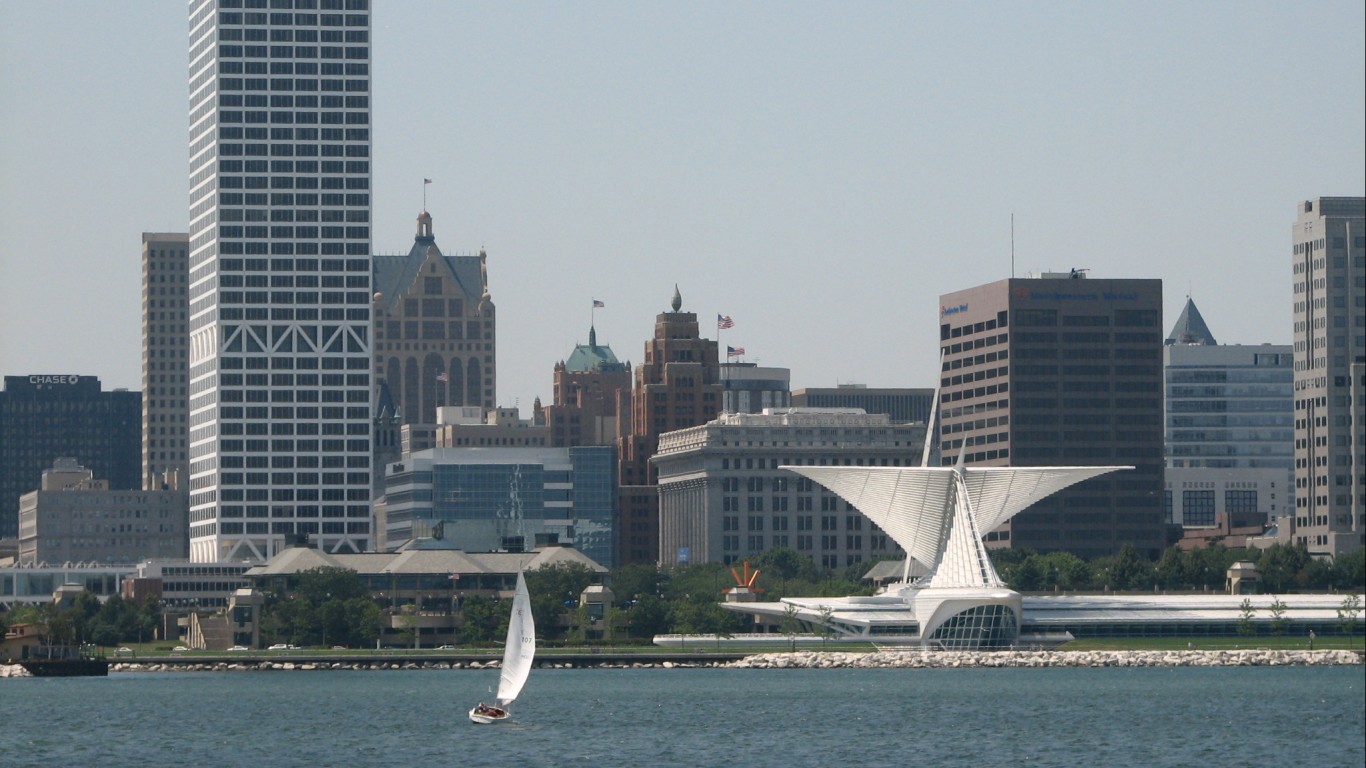
Wisconsin: Milwaukee-Waukesha-West Allis
> Traffic fatalities per 100,000 people: 7.9 (state: 10.6)
> Avg. commute time: 23.1 min. (state: 22.2 min.)
> Commuters driving to work: 88.4% (state: 88.8%)
> 2017 car thefts per 100,000 people: 413.4
See all stories featuring: Wisconsin
[in-text-ad-2]
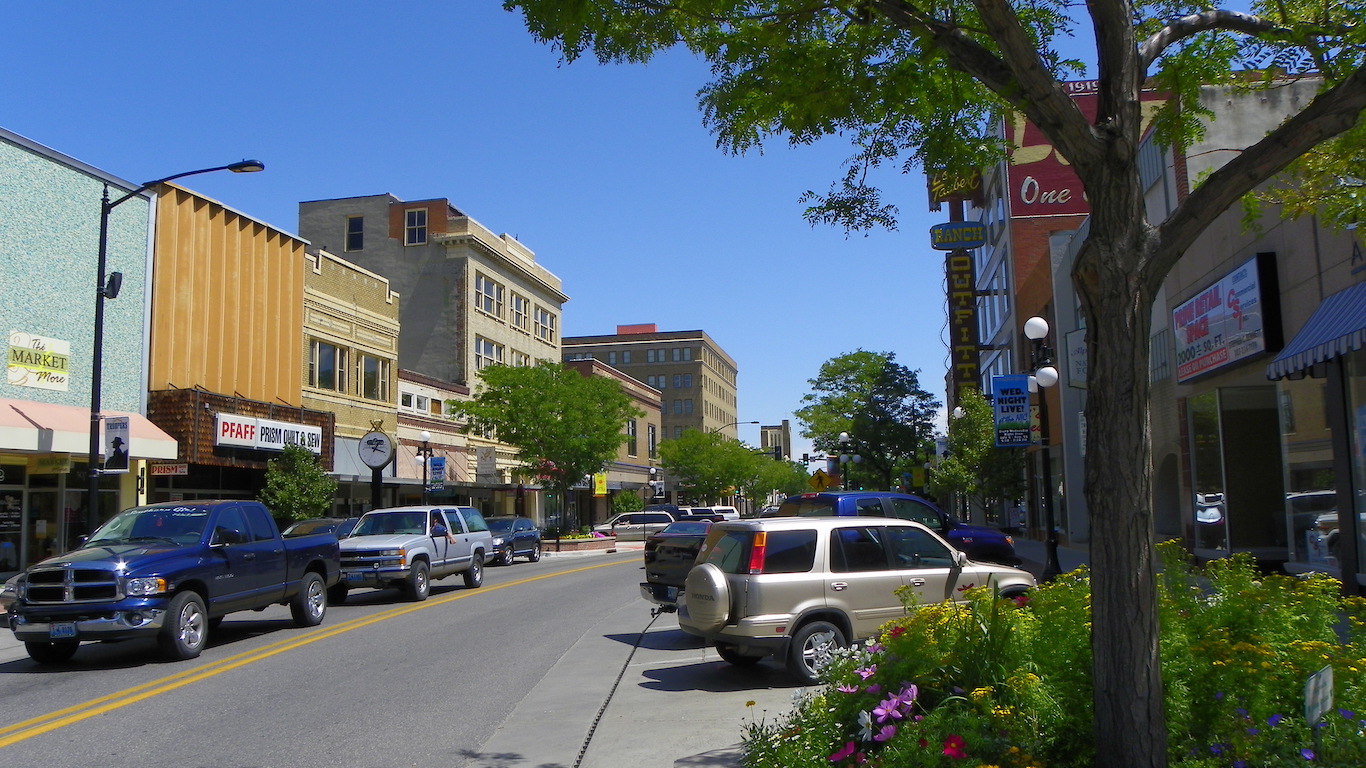
Wyoming: Casper
> Traffic fatalities per 100,000 people: 22.6 (state: 21.2)
> Avg. commute time: 17.2 min. (state: 17.6 min.)
> Commuters driving to work: N/A (state: 88.1%)
> 2017 car thefts per 100,000 people: 142.1
See all stories featuring: Wyoming
It’s Your Money, Your Future—Own It (sponsor)
Are you ahead, or behind on retirement? For families with more than $500,000 saved for retirement, finding a financial advisor who puts your interest first can be the difference, and today it’s easier than ever. SmartAsset’s free tool matches you with up to three fiduciary financial advisors who serve your area in minutes. Each advisor has been carefully vetted and must act in your best interests. Start your search now.
If you’ve saved and built a substantial nest egg for you and your family, don’t delay; get started right here and help your retirement dreams become a retirement reality.
Thank you for reading! Have some feedback for us?
Contact the 24/7 Wall St. editorial team.
Latest from 24/7


Our expert who first called NVIDIA in 2009 is predicting 2025 will see a historic AI breakthrough.
You can follow him investing $500,000 of his own money on our top AI stocks for free.