
Around 40,000 Americans died in motor vehicle crashes in the United States last year. That preliminary estimate comes from the National Safety Council, a public safety and health nonprofit. While fatal accidents have become far less common in the United States over the last few decades thanks to improved regulations and safety features, they remain one of the leading causes of death, particularly for younger people.
To rank the safest and most dangerous states to drive in the United States, 24/7 Wall St. calculated the number of motor vehicle fatalities per 100,000 residents in 2018, based on accident figures from the National Safety Council and population estimate from the U.S. Census Bureau’s Population Estimates Program.
The rate of motor vehicle fatalities across the country is about 12 per 100,000 Americans, but that rate varies a great deal nationwide, from less than 5 per 100,000 in one state to over 20 per 100,000 in several others. The difference in the likelihood of dying from a car crash depends on a variety of conditions, including seat belt use, speed limits, drunk driving rates, and weather.
The types of road in a given state also make a major difference in whether a crash is an inconvenience or a life-threatening incident. While some of America’s cities are among the worst places to drive, fatal accidents are much more likely to occur in sparsely populated areas where speeds tend to be faster than in urban areas where speeds are slower. This fact likely helps explain why states like New Jersey and Rhode Island, which are two of the most densely-populated U.S. states, have among the fewest motor vehicle fatalities per capita, and why rural states like Montana and Wyoming have among the highest death rates.
Click here to see the states with the most dangerous roads.
Methodology
To rank the safest and most dangerous states to drive in the United States, 24/7 Wall St. reviewed roadway motor vehicle fatality totals for 2018 collected by the National Safety Council from state Department of Transportation offices. The deaths recorded are only those that occur within 30 days of the accident. To determine the 2018 motor vehicle fatalities per 100,000 people, 24/7 Wall St. divided the number of fatalities by the July 2018 population estimate from the U.S. Census Bureau’s Population Estimates Program. The share of motor vehicle occupant fatalities who were not restrained by a seat belt at the time of the accident and the share of fatal motor vehicle crash deaths are from the Insurance Institute for Highway Safety and are for 2017.

50. New York
> Motor vehicle fatalities per 100,000: 4.47
> 2018 motor vehicle fatalities: 873 (15th most)
> Pct. fatalities not wearing seat belt: 29.0% (3rd lowest)
> Pct. of fatal crashes on rural roads: 44.0% (18th lowest)
See all stories featuring: New York
[in-text-ad]

49. Massachusetts
> Motor vehicle fatalities per 100,000: 5.17
> 2018 motor vehicle fatalities: 357 (19th fewest)
> Pct. fatalities not wearing seat belt: 44.0% (22nd lowest)
> Pct. of fatal crashes on rural roads: 4.0% (the lowest)
See all stories featuring: Massachusetts
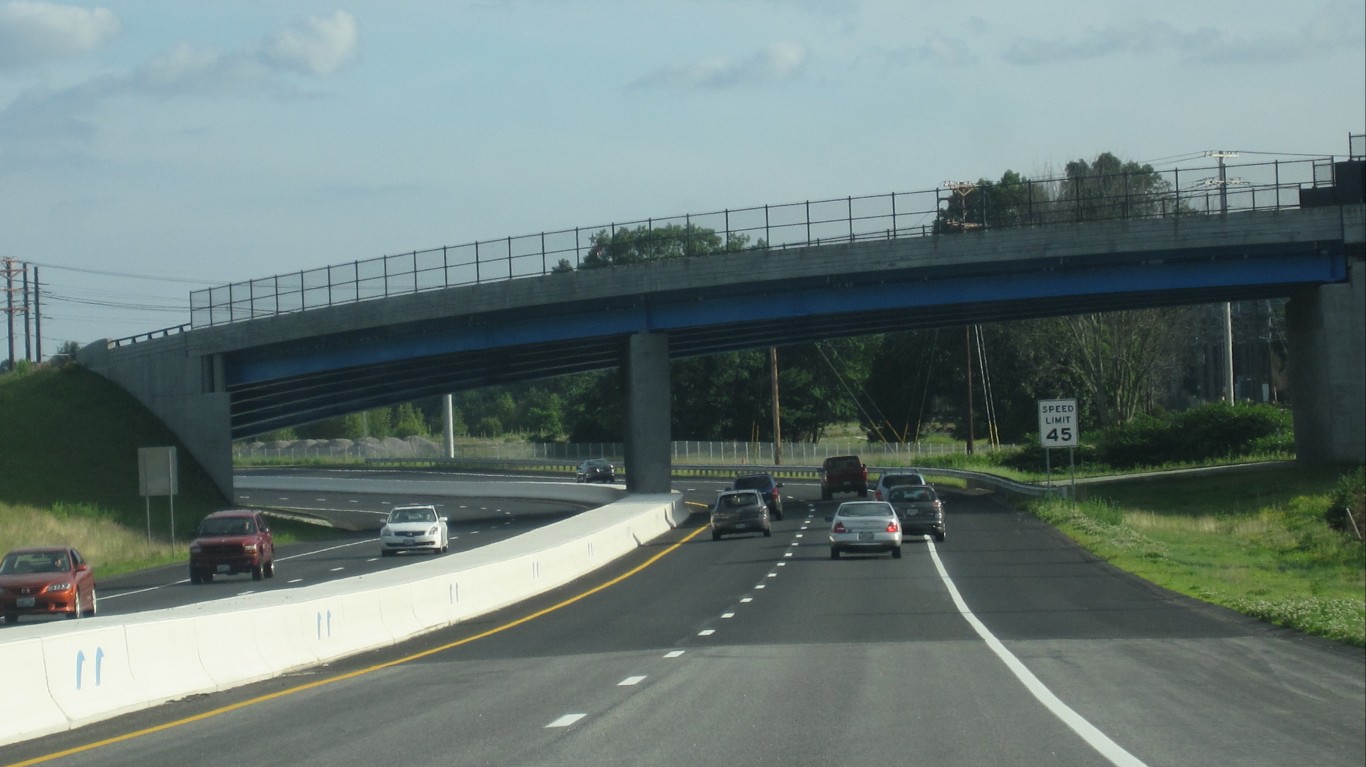
48. Rhode Island
> Motor vehicle fatalities per 100,000: 5.58
> 2018 motor vehicle fatalities: 59 (the fewest)
> Pct. fatalities not wearing seat belt: 50.0% (17th highest)
> Pct. of fatal crashes on rural roads: 20.0% (4th lowest)
See all stories featuring: Rhode Island

47. New Jersey
> Motor vehicle fatalities per 100,000: 6.34
> 2018 motor vehicle fatalities: 565 (24th most)
> Pct. fatalities not wearing seat belt: 44.0% (22nd lowest)
> Pct. of fatal crashes on rural roads: 14.0% (3rd lowest)
See all stories featuring: New Jersey
[in-text-ad-2]

46. Minnesota
> Motor vehicle fatalities per 100,000: 6.81
> 2018 motor vehicle fatalities: 382 (20th fewest)
> Pct. fatalities not wearing seat belt: 29.0% (3rd lowest)
> Pct. of fatal crashes on rural roads: 59.0% (24th highest)
See all stories featuring: Minnesota

45. Washington
> Motor vehicle fatalities per 100,000: 7.18
> 2018 motor vehicle fatalities: 541 (25th most)
> Pct. fatalities not wearing seat belt: 33.0% (6th lowest)
> Pct. of fatal crashes on rural roads: 44.0% (18th lowest)
See all stories featuring: Washington
[in-text-ad]
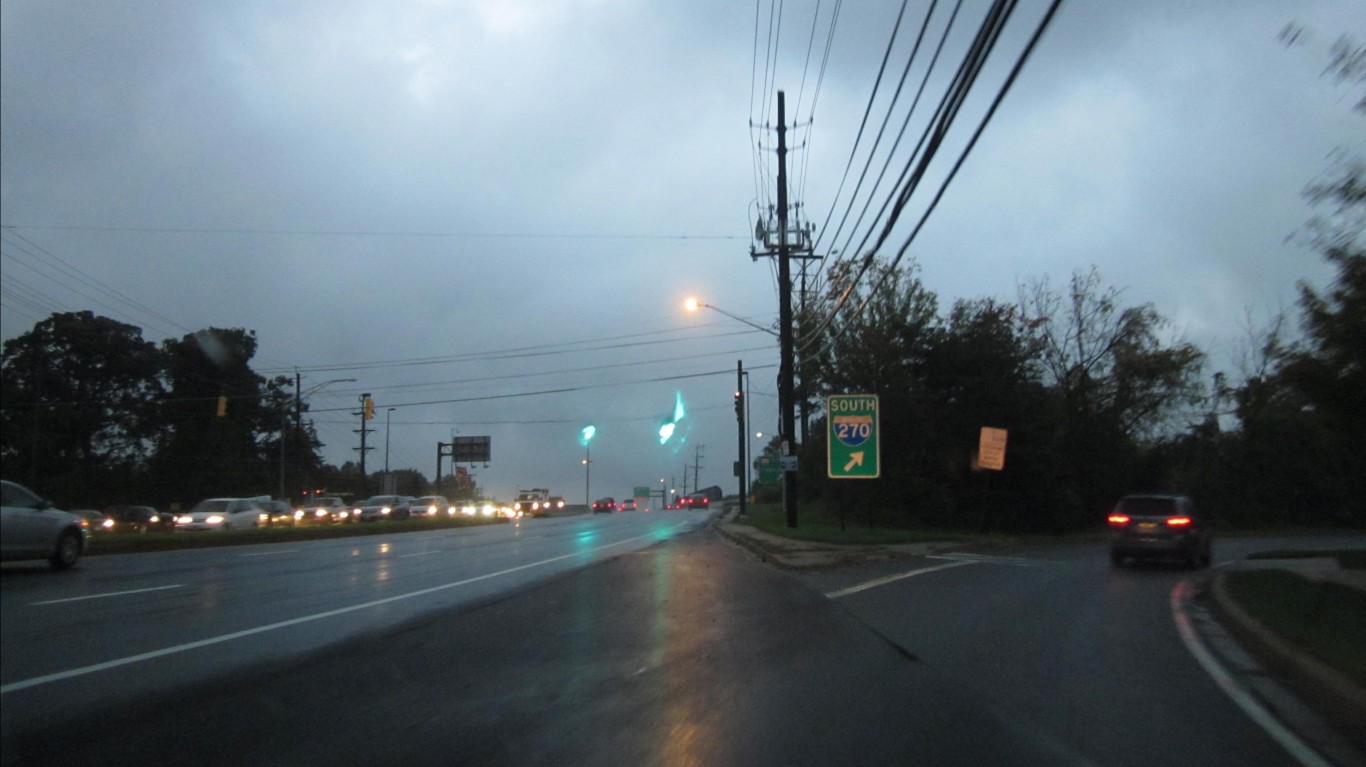
44. Maryland
> Motor vehicle fatalities per 100,000: 8.06
> 2018 motor vehicle fatalities: 487 (24th fewest)
> Pct. fatalities not wearing seat belt: 39.0% (12th lowest)
> Pct. of fatal crashes on rural roads: 21.0% (6th lowest)
See all stories featuring: Maryland

43. Illinois
> Motor vehicle fatalities per 100,000: 8.23
> 2018 motor vehicle fatalities: 1,048 (8th most)
> Pct. fatalities not wearing seat belt: 38.0% (10th lowest)
> Pct. of fatal crashes on rural roads: 40.0% (12th lowest)
See all stories featuring: Illinois

42. Hawaii
> Motor vehicle fatalities per 100,000: 8.24
> 2018 motor vehicle fatalities: 117 (7th fewest)
> Pct. fatalities not wearing seat belt: 35.0% (7th lowest)
> Pct. of fatal crashes on rural roads: 21.0% (6th lowest)
See all stories featuring: Hawaii
[in-text-ad-2]

41. Connecticut
> Motor vehicle fatalities per 100,000: 8.31
> 2018 motor vehicle fatalities: 297 (16th fewest)
> Pct. fatalities not wearing seat belt: 37.0% (8th lowest)
> Pct. of fatal crashes on rural roads: 13.0% (2nd lowest)
See all stories featuring: Connecticut

40. Utah
> Motor vehicle fatalities per 100,000: 8.35
> 2018 motor vehicle fatalities: 264 (14th fewest)
> Pct. fatalities not wearing seat belt: 44.0% (22nd lowest)
> Pct. of fatal crashes on rural roads: 43.0% (14th lowest)
See all stories featuring: Utah
[in-text-ad]

39. Ohio
> Motor vehicle fatalities per 100,000: 9.16
> 2018 motor vehicle fatalities: 1,071 (7th most)
> Pct. fatalities not wearing seat belt: 47.0% (24th highest)
> Pct. of fatal crashes on rural roads: 45.0% (20th lowest)
See all stories featuring: Ohio

38. California
> Motor vehicle fatalities per 100,000: 9.23
> 2018 motor vehicle fatalities: 3,651 (the most)
> Pct. fatalities not wearing seat belt: 30.0% (5th lowest)
> Pct. of fatal crashes on rural roads: 42.0% (13th lowest)
See all stories featuring: California

37. Maine
> Motor vehicle fatalities per 100,000: 9.49
> 2018 motor vehicle fatalities: 127 (8th fewest)
> Pct. fatalities not wearing seat belt: 50.0% (17th highest)
> Pct. of fatal crashes on rural roads: 81.0% (6th highest)
See all stories featuring: Maine
[in-text-ad-2]

36. Virginia
> Motor vehicle fatalities per 100,000: 9.59
> 2018 motor vehicle fatalities: 817 (17th most)
> Pct. fatalities not wearing seat belt: 58.0% (8th highest)
> Pct. of fatal crashes on rural roads: 63.0% (17th highest)
See all stories featuring: Virginia

35. Michigan
> Motor vehicle fatalities per 100,000: 9.62
> 2018 motor vehicle fatalities: 962 (12th most)
> Pct. fatalities not wearing seat belt: 30.0% (5th lowest)
> Pct. of fatal crashes on rural roads: 40.0% (12th lowest)
See all stories featuring: Michigan
[in-text-ad]

34. Pennsylvania
> Motor vehicle fatalities per 100,000: 9.71
> 2018 motor vehicle fatalities: 1,244 (6th most)
> Pct. fatalities not wearing seat belt: 53.0% (13th highest)
> Pct. of fatal crashes on rural roads: 54.0% (22nd lowest)
See all stories featuring: Pennsylvania

33. Wisconsin
> Motor vehicle fatalities per 100,000: 9.93
> 2018 motor vehicle fatalities: 577 (23rd most)
> Pct. fatalities not wearing seat belt: 43.0% (17th lowest)
> Pct. of fatal crashes on rural roads: 67.0% (13th highest)
See all stories featuring: Wisconsin

32. Iowa
> Motor vehicle fatalities per 100,000: 10.11
> 2018 motor vehicle fatalities: 319 (17th fewest)
> Pct. fatalities not wearing seat belt: 38.0% (10th lowest)
> Pct. of fatal crashes on rural roads: 76.0% (9th highest)
See all stories featuring: Iowa
[in-text-ad-2]

31. New Hampshire
> Motor vehicle fatalities per 100,000: 10.76
> 2018 motor vehicle fatalities: 146 (10th fewest)
> Pct. fatalities not wearing seat belt: 72.0% (the highest)
> Pct. of fatal crashes on rural roads: 55.0% (23rd lowest)
See all stories featuring: New Hampshire

30. Alaska
> Motor vehicle fatalities per 100,000: 10.85
> 2018 motor vehicle fatalities: 80 (3rd fewest)
> Pct. fatalities not wearing seat belt: 64.0% (4th highest)
> Pct. of fatal crashes on rural roads: 63.0% (17th highest)
See all stories featuring: Alaska
[in-text-ad]

29. Vermont
> Motor vehicle fatalities per 100,000: 10.86
> 2018 motor vehicle fatalities: 68 (2nd fewest)
> Pct. fatalities not wearing seat belt: 44.0% (22nd lowest)
> Pct. of fatal crashes on rural roads: 84.0% (5th highest)
See all stories featuring: Vermont

28. Nevada
> Motor vehicle fatalities per 100,000: 10.91
> 2018 motor vehicle fatalities: 331 (18th fewest)
> Pct. fatalities not wearing seat belt: 47.0% (24th highest)
> Pct. of fatal crashes on rural roads: 29.0% (7th lowest)
See all stories featuring: Nevada

27. Colorado
> Motor vehicle fatalities per 100,000: 10.96
> 2018 motor vehicle fatalities: 624 (22nd most)
> Pct. fatalities not wearing seat belt: 51.0% (14th highest)
> Pct. of fatal crashes on rural roads: 44.0% (18th lowest)
See all stories featuring: Colorado
[in-text-ad-2]

26. Oregon
> Motor vehicle fatalities per 100,000: 11.17
> 2018 motor vehicle fatalities: 468 (23rd fewest)
> Pct. fatalities not wearing seat belt: 22.0% (the lowest)
> Pct. of fatal crashes on rural roads: 69.0% (12th highest)
See all stories featuring: Oregon

25. Delaware
> Motor vehicle fatalities per 100,000: 11.48
> 2018 motor vehicle fatalities: 111 (6th fewest)
> Pct. fatalities not wearing seat belt: 42.0% (13th lowest)
> Pct. of fatal crashes on rural roads: 58.0% (25th highest)
See all stories featuring: Delaware
[in-text-ad]
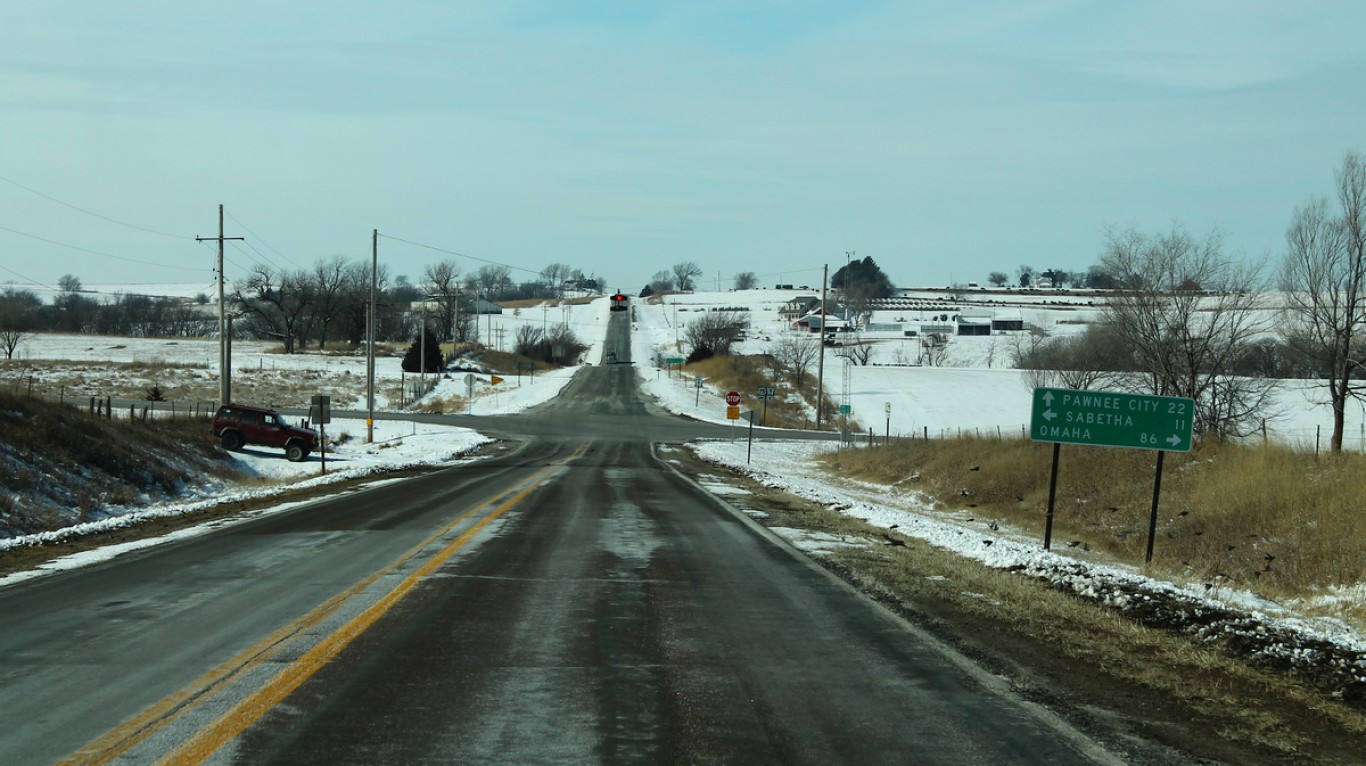
24. Nebraska
> Motor vehicle fatalities per 100,000: 11.92
> 2018 motor vehicle fatalities: 230 (12th fewest)
> Pct. fatalities not wearing seat belt: 51.0% (14th highest)
> Pct. of fatal crashes on rural roads: 76.0% (9th highest)
See all stories featuring: Nebraska

23. Texas
> Motor vehicle fatalities per 100,000: 12.53
> 2018 motor vehicle fatalities: 3,597 (2nd most)
> Pct. fatalities not wearing seat belt: 39.0% (12th lowest)
> Pct. of fatal crashes on rural roads: 39.0% (10th lowest)
See all stories featuring: Texas

22. Indiana
> Motor vehicle fatalities per 100,000: 12.84
> 2018 motor vehicle fatalities: 859 (16th most)
> Pct. fatalities not wearing seat belt: 43.0% (17th lowest)
> Pct. of fatal crashes on rural roads: 66.0% (15th highest)
See all stories featuring: Indiana
[in-text-ad-2]

21. Idaho
> Motor vehicle fatalities per 100,000: 13.28
> 2018 motor vehicle fatalities: 233 (13th fewest)
> Pct. fatalities not wearing seat belt: 59.0% (7th highest)
> Pct. of fatal crashes on rural roads: 77.0% (8th highest)
See all stories featuring: Idaho

20. North Dakota
> Motor vehicle fatalities per 100,000: 13.68
> 2018 motor vehicle fatalities: 104 (4th fewest)
> Pct. fatalities not wearing seat belt: 62.0% (6th highest)
> Pct. of fatal crashes on rural roads: 94.0% (2nd highest)
See all stories featuring: North Dakota
[in-text-ad]
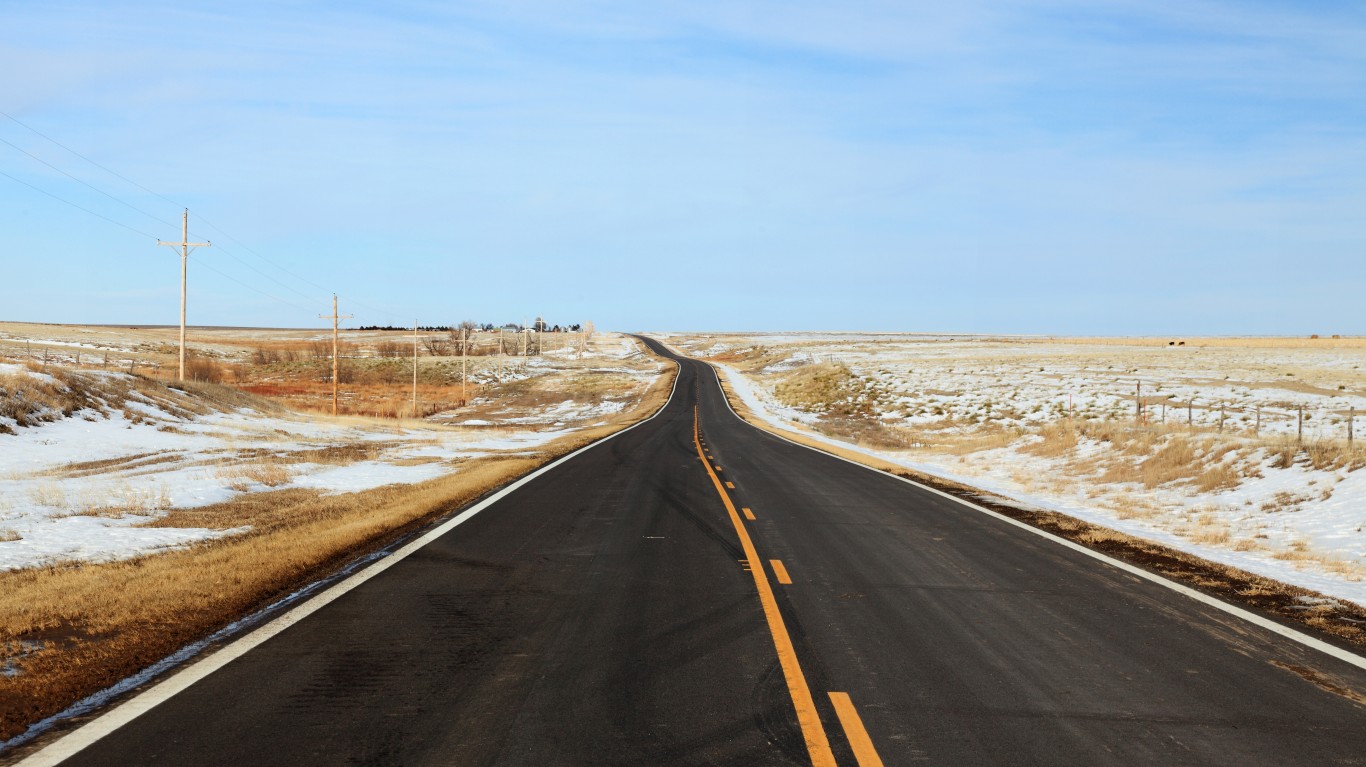
19. Kansas
> Motor vehicle fatalities per 100,000: 13.88
> 2018 motor vehicle fatalities: 404 (22nd fewest)
> Pct. fatalities not wearing seat belt: 48.0% (21st highest)
> Pct. of fatal crashes on rural roads: 67.0% (13th highest)
See all stories featuring: Kansas

18. North Carolina
> Motor vehicle fatalities per 100,000: 14.03
> 2018 motor vehicle fatalities: 1,457 (5th most)
> Pct. fatalities not wearing seat belt: 43.0% (17th lowest)
> Pct. of fatal crashes on rural roads: 62.0% (20th highest)
See all stories featuring: North Carolina

17. Arizona
> Motor vehicle fatalities per 100,000: 14.13
> 2018 motor vehicle fatalities: 1,013 (11th most)
> Pct. fatalities not wearing seat belt: 48.0% (21st highest)
> Pct. of fatal crashes on rural roads: 35.0% (8th lowest)
See all stories featuring: Arizona
[in-text-ad-2]

16. Georgia
> Motor vehicle fatalities per 100,000: 14.23
> 2018 motor vehicle fatalities: 1,497 (4th most)
> Pct. fatalities not wearing seat belt: 45.0% (23rd lowest)
> Pct. of fatal crashes on rural roads: 39.0% (10th lowest)
See all stories featuring: Georgia

15. South Dakota
> Motor vehicle fatalities per 100,000: 14.62
> 2018 motor vehicle fatalities: 129 (9th fewest)
> Pct. fatalities not wearing seat belt: 72.0% (the highest)
> Pct. of fatal crashes on rural roads: 89.0% (3rd highest)
See all stories featuring: South Dakota
[in-text-ad]

14. Missouri
> Motor vehicle fatalities per 100,000: 14.97
> 2018 motor vehicle fatalities: 917 (14th most)
> Pct. fatalities not wearing seat belt: 58.0% (8th highest)
> Pct. of fatal crashes on rural roads: 58.0% (25th highest)
See all stories featuring: Missouri

13. Tennessee
> Motor vehicle fatalities per 100,000: 15.47
> 2018 motor vehicle fatalities: 1,047 (9th most)
> Pct. fatalities not wearing seat belt: 46.0% (25th lowest)
> Pct. of fatal crashes on rural roads: 45.0% (20th lowest)
See all stories featuring: Tennessee

12. Florida
> Motor vehicle fatalities per 100,000: 15.61
> 2018 motor vehicle fatalities: 3,325 (3rd most)
> Pct. fatalities not wearing seat belt: 44.0% (22nd lowest)
> Pct. of fatal crashes on rural roads: 44.0% (18th lowest)
See all stories featuring: Florida
[in-text-ad-2]

11. Oklahoma
> Motor vehicle fatalities per 100,000: 15.90
> 2018 motor vehicle fatalities: 627 (21st most)
> Pct. fatalities not wearing seat belt: 48.0% (21st highest)
> Pct. of fatal crashes on rural roads: 62.0% (20th highest)
See all stories featuring: Oklahoma

10. Kentucky
> Motor vehicle fatalities per 100,000: 16.14
> 2018 motor vehicle fatalities: 721 (19th most)
> Pct. fatalities not wearing seat belt: 54.0% (11th highest)
> Pct. of fatal crashes on rural roads: 73.0% (11th highest)
See all stories featuring: Kentucky
[in-text-ad]
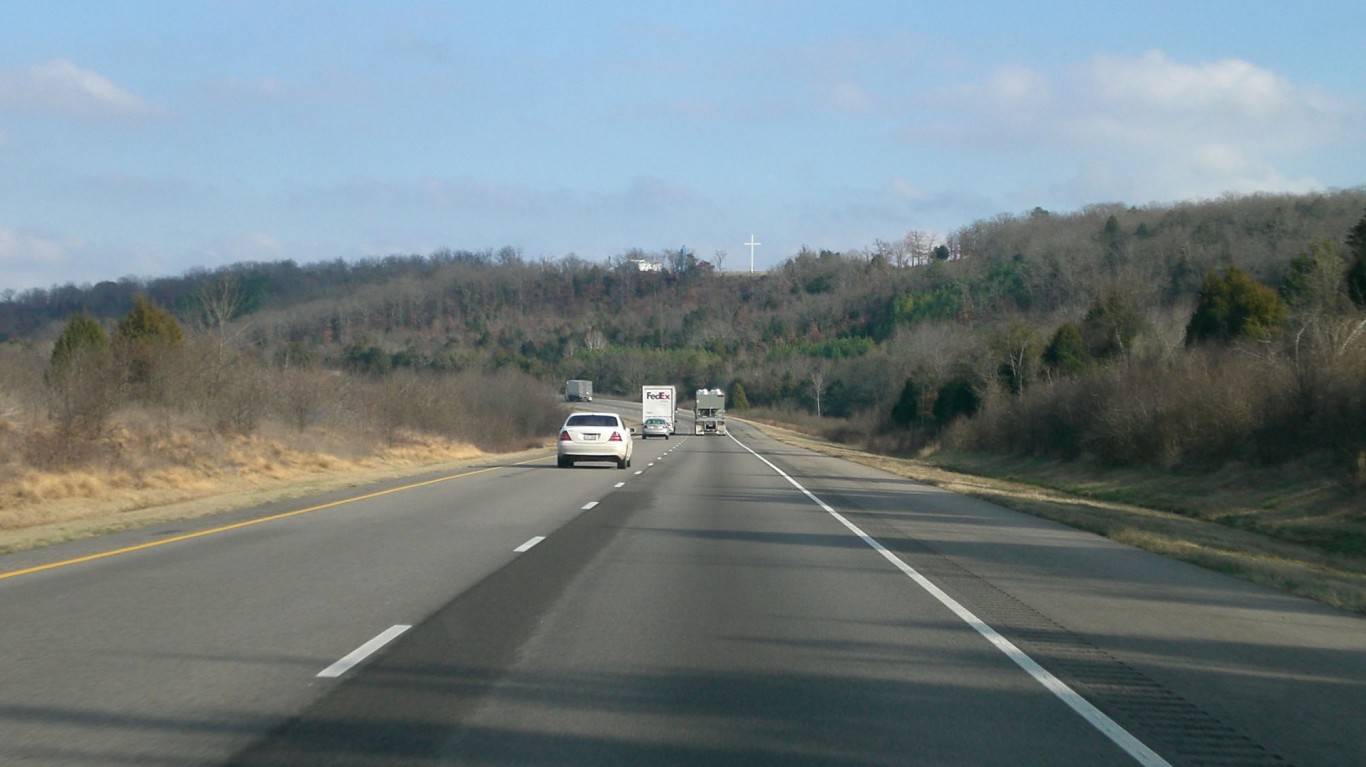
9. Arkansas
> Motor vehicle fatalities per 100,000: 16.23
> 2018 motor vehicle fatalities: 489 (25th fewest)
> Pct. fatalities not wearing seat belt: 49.0% (20th highest)
> Pct. of fatal crashes on rural roads: 66.0% (15th highest)
See all stories featuring: Arkansas

8. West Virginia
> Motor vehicle fatalities per 100,000: 16.34
> 2018 motor vehicle fatalities: 295 (15th fewest)
> Pct. fatalities not wearing seat belt: 43.0% (17th lowest)
> Pct. of fatal crashes on rural roads: 63.0% (17th highest)
See all stories featuring: West Virginia

7. Louisiana
> Motor vehicle fatalities per 100,000: 16.67
> 2018 motor vehicle fatalities: 777 (18th most)
> Pct. fatalities not wearing seat belt: 46.0% (25th lowest)
> Pct. of fatal crashes on rural roads: 49.0% (21st lowest)
See all stories featuring: Louisiana
[in-text-ad-2]

6. Montana
> Motor vehicle fatalities per 100,000: 17.13
> 2018 motor vehicle fatalities: 182 (11th fewest)
> Pct. fatalities not wearing seat belt: 64.0% (4th highest)
> Pct. of fatal crashes on rural roads: 89.0% (3rd highest)
See all stories featuring: Montana

5. New Mexico
> Motor vehicle fatalities per 100,000: 18.47
> 2018 motor vehicle fatalities: 387 (21st fewest)
> Pct. fatalities not wearing seat belt: 51.0% (14th highest)
> Pct. of fatal crashes on rural roads: 56.0% (24th lowest)
See all stories featuring: New Mexico
[in-text-ad]

4. Wyoming
> Motor vehicle fatalities per 100,000: 19.21
> 2018 motor vehicle fatalities: 111 (6th fewest)
> Pct. fatalities not wearing seat belt: 68.0% (3rd highest)
> Pct. of fatal crashes on rural roads: 81.0% (6th highest)
See all stories featuring: Wyoming

3. Alabama
> Motor vehicle fatalities per 100,000: 19.39
> 2018 motor vehicle fatalities: 948 (13th most)
> Pct. fatalities not wearing seat belt: 54.0% (11th highest)
> Pct. of fatal crashes on rural roads: 62.0% (20th highest)
See all stories featuring: Alabama

2. South Carolina
> Motor vehicle fatalities per 100,000: 20.34
> 2018 motor vehicle fatalities: 1,034 (10th most)
> Pct. fatalities not wearing seat belt: 50.0% (17th highest)
> Pct. of fatal crashes on rural roads: 60.0% (23rd highest)
See all stories featuring: South Carolina
[in-text-ad-2]
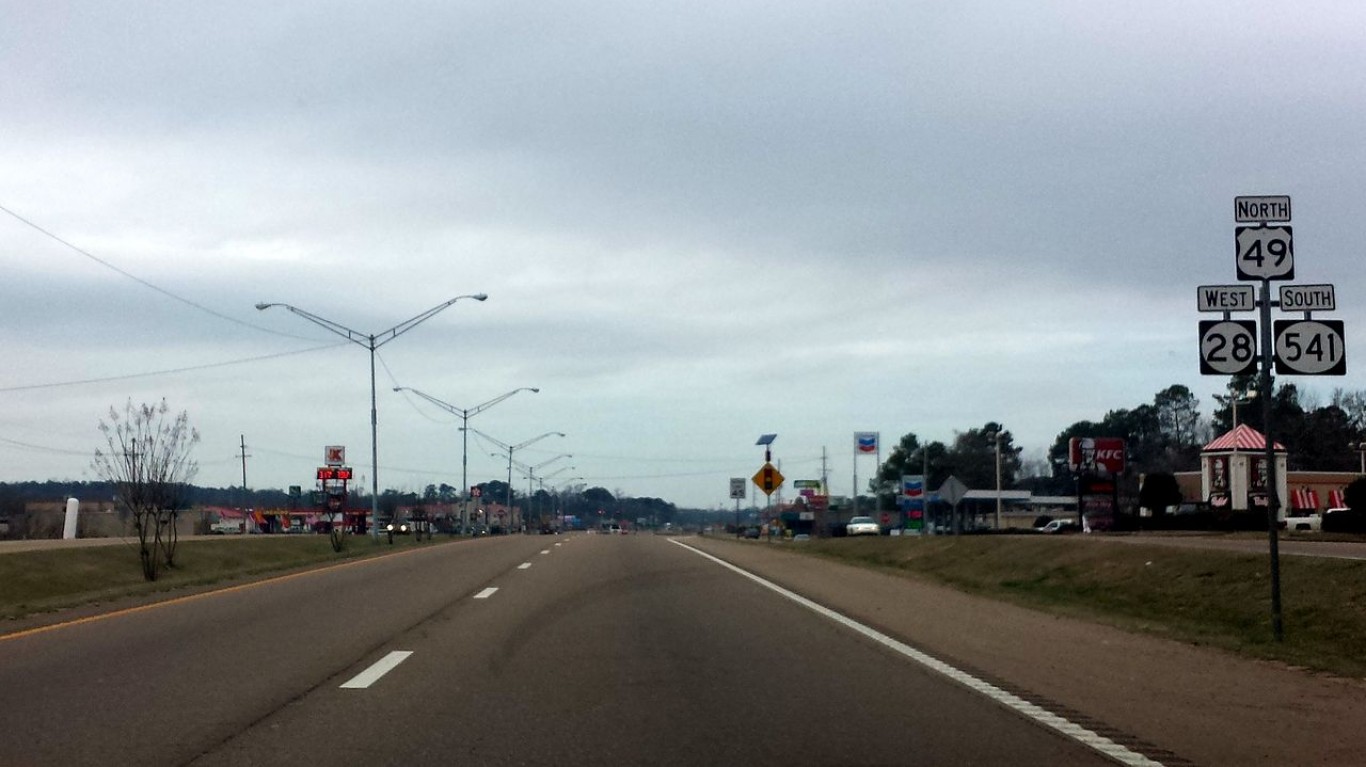
1. Mississippi
> Motor vehicle fatalities per 100,000: 21.20
> 2018 motor vehicle fatalities: 633 (20th most)
> Pct. fatalities not wearing seat belt: 55.0% (10th highest)
> Pct. of fatal crashes on rural roads: 98.0% (the highest)
See all stories featuring: Mississippi
Want to Retire Early? Start Here (Sponsor)
Want retirement to come a few years earlier than you’d planned? Or are you ready to retire now, but want an extra set of eyes on your finances?
Now you can speak with up to 3 financial experts in your area for FREE. By simply clicking here you can begin to match with financial professionals who can help you build your plan to retire early. And the best part? The first conversation with them is free.
Click here to match with up to 3 financial pros who would be excited to help you make financial decisions.
Thank you for reading! Have some feedback for us?
Contact the 24/7 Wall St. editorial team.
 24/7 Wall St.
 24/7 Wall St.
 24/7 Wall St.
 24/7 Wall St.

