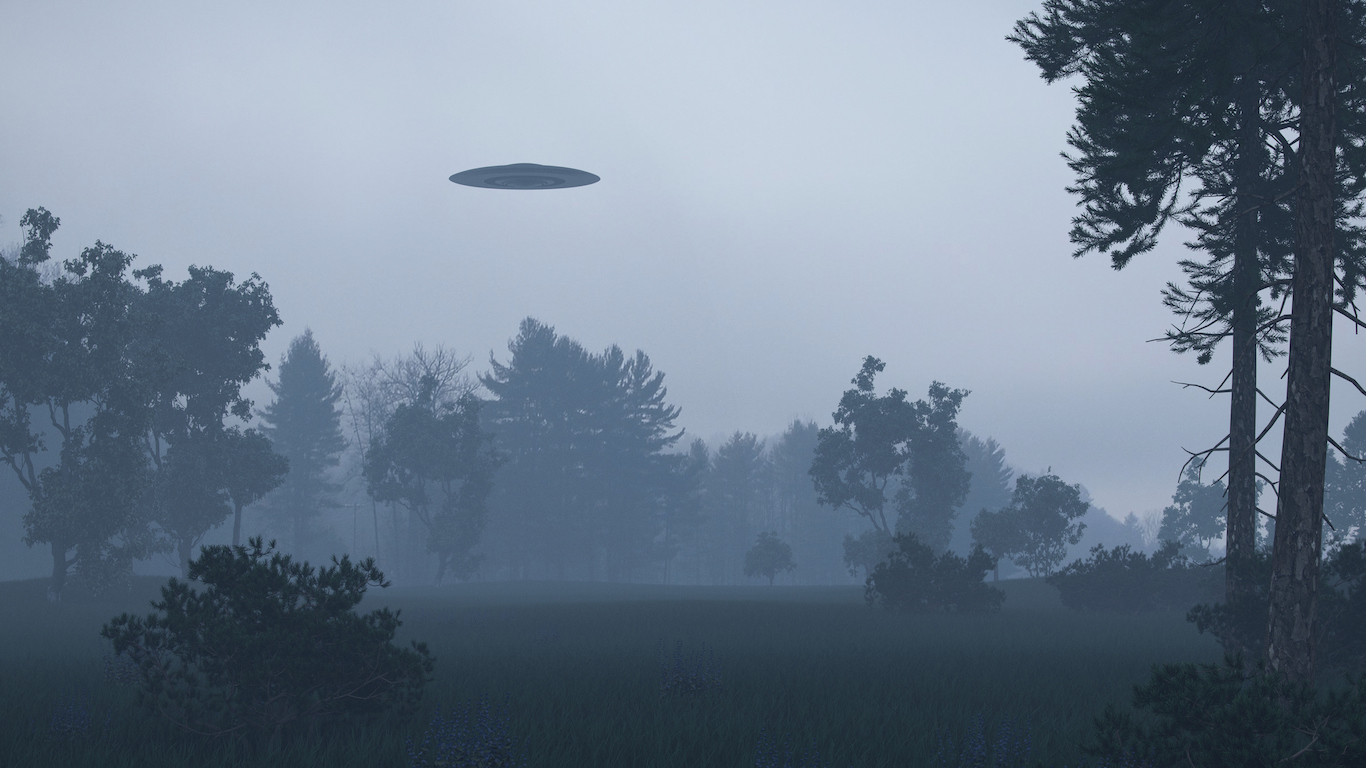
UFOs, or unidentified flying objects, have stirred our imagination for generations.
Sightings of these alleged interstellar visitors to Earth have been chronicled throughout history. However, the mania for UFOs shifted into hyperdrive in 1947, when flying saucer enthusiasts believed the remains of an otherworldly spacecraft, and even the corpse of an alien, were discovered in Roswell, New Mexico. The U.S. government said in 1994 that the remains were debris from a neoprene balloon used in a top-secret government surveillance project.
Many people who report a UFO sighting have reported the object without the use of viewing apparatus such as a telescope. Weather, among other variables, can trick an observer into thinking he or she has seen something unusual. There are thousands of UFO sightings reported every year, including several made by airline pilots and astronauts. Many sightings are compiled by the National UFO Reporting Center, which disseminates what it calls credible UFO reports.
UFO reporting levels vary by state. In states with cold winters, sightings increase dramatically during summer months, when more residents are spending their leisure time outdoors. The five states with the most reported UFO sightings per 100,000 people are all northern states, and three of them — Vermont, New Hampshire, and Maine — are located in New England. By comparison, UFO reports don’t fluctuate much during the year in southern states, where weather and daylight conditions don’t vary as much.
Click here to see states with the most UFO sightings
Methodology
To determine the states with the most UFO sightings, 24/7 Wall St. reviewed 2001-2015 sightings per 100,000 people with data from Cheryl Costa’s “UFO Sightings Desk Reference: United States of America 2001-2015: Unidentified Flying Objects Frequency–Distribution–Shapes.” 2001-2015 total sightings also came from the same source. Sightings per 100,000 was calculated using the 2001-2015 raw sightings figures and the 2017 American Consumer Survey 1-Year population estimates. Population density figures were calculated using 2017 population estimates and 2010 land area in square miles — both from the U.S. Census Bureau. The share of households without internet is from the 2017 U.S. Census Bureau’s American Consumer Survey. One of the reasons reports of UFO sightings surged at the turn of the last century was the significant increase in broadband internet access made reporting considerably easier.

50. Mississippi
> 2001-2015 sightings per 100K: 21.3
> Total sightings: 636 (10th fewest)
> Population per sq. mile: 64 (19th fewest)
> Households without internet: 23.1% (the highest)
See all stories featuring: Mississippi
[in-text-ad]

49. Louisiana
> 2001-2015 sightings per 100K: 23.3
> Total sightings: 1,090 (18th fewest)
> Population per sq. mile: 108 (24th most)
> Households without internet: 20.7% (2nd highest)
See all stories featuring: Louisiana

48. Georgia
> 2001-2015 sightings per 100K: 24.5
> Total sightings: 2,550 (17th most)
> Population per sq. mile: 181 (17th most)
> Households without internet: 14.2% (18th highest)
See all stories featuring: Georgia
47. Texas
> 2001-2015 sightings per 100K: 24.9
> Total sightings: 7,058 (3rd most)
> Population per sq. mile: 108 (25th most)
> Households without internet: 14.0% (19th highest)
See all stories featuring: Texas
[in-text-ad-2]
46. Alabama
> 2001-2015 sightings per 100K: 25.1
> Total sightings: 1,224 (21st fewest)
> Population per sq. mile: 96 (24th fewest)
> Households without internet: 18.6% (6th highest)
See all stories featuring: Alabama

45. New York
> 2001-2015 sightings per 100K: 25.9
> Total sightings: 5,141 (6th most)
> Population per sq. mile: 421 (7th most)
> Households without internet: 13.5% (25th highest)
See all stories featuring: New York
[in-text-ad]

44. Maryland
> 2001-2015 sightings per 100K: 27.2
> Total sightings: 1,646 (24th most)
> Population per sq. mile: 623 (5th most)
> Households without internet: 10.0% (7th lowest)
See all stories featuring: Maryland

43. Virginia
> 2001-2015 sightings per 100K: 27.7
> Total sightings: 2,348 (18th most)
> Population per sq. mile: 214 (14th most)
> Households without internet: 12.1% (15th lowest)
See all stories featuring: Virginia

42. North Dakota
> 2001-2015 sightings per 100K: 28.2
> Total sightings: 213 (the fewest)
> Population per sq. mile: 11 (4th fewest)
> Households without internet: 12.7% (20th lowest)
See all stories featuring: North Dakota
[in-text-ad-2]

41. New Jersey
> 2001-2015 sightings per 100K: 28.5
> Total sightings: 2,567 (16th most)
> Population per sq. mile: 1,225 (the most)
> Households without internet: 10.6% (9th lowest)
See all stories featuring: New Jersey
40. Tennessee
> 2001-2015 sightings per 100K: 31.6
> Total sightings: 2,125 (20th most)
> Population per sq. mile: 163 (20th most)
> Households without internet: 17.7% (8th highest)
See all stories featuring: Tennessee
[in-text-ad]

39. Massachusetts
> 2001-2015 sightings per 100K: 32.2
> Total sightings: 2,208 (19th most)
> Population per sq. mile: 879 (3rd most)
> Households without internet: 10.9% (11th lowest)
See all stories featuring: Massachusetts

38. North Carolina
> 2001-2015 sightings per 100K: 32.7
> Total sightings: 3,359 (11th most)
> Population per sq. mile: 211 (15th most)
> Households without internet: 15.2% (14th highest)
See all stories featuring: North Carolina

37. Minnesota
> 2001-2015 sightings per 100K: 32.7
> Total sightings: 1,825 (23rd most)
> Population per sq. mile: 70 (21st fewest)
> Households without internet: 10.8% (10th lowest)
See all stories featuring: Minnesota
[in-text-ad-2]

36. Illinois
> 2001-2015 sightings per 100K: 32.7
> Total sightings: 4,191 (8th most)
> Population per sq. mile: 231 (12th most)
> Households without internet: 13.3% (25th lowest)
See all stories featuring: Illinois

35. Arkansas
> 2001-2015 sightings per 100K: 33.1
> Total sightings: 995 (16th fewest)
> Population per sq. mile: 58 (17th fewest)
> Households without internet: 20.5% (3rd highest)
See all stories featuring: Arkansas
[in-text-ad]

34. South Dakota
> 2001-2015 sightings per 100K: 33.2
> Total sightings: 289 (2nd fewest)
> Population per sq. mile: 11 (5th fewest)
> Households without internet: 15.7% (11th highest)
See all stories featuring: South Dakota

33. Delaware
> 2001-2015 sightings per 100K: 34.3
> Total sightings: 330 (3rd fewest)
> Population per sq. mile: 494 (6th most)
> Households without internet: 9.8% (5th lowest)
See all stories featuring: Delaware

32. Nebraska
> 2001-2015 sightings per 100K: 34.4
> Total sightings: 660 (11th fewest)
> Population per sq. mile: 25 (8th fewest)
> Households without internet: 12.9% (21st lowest)
See all stories featuring: Nebraska
[in-text-ad-2]

31. Wisconsin
> 2001-2015 sightings per 100K: 34.5
> Total sightings: 1,998 (21st most)
> Population per sq. mile: 107 (25th fewest)
> Households without internet: 13.5% (24th highest)
See all stories featuring: Wisconsin

30. Ohio
> 2001-2015 sightings per 100K: 35.3
> Total sightings: 4,115 (10th most)
> Population per sq. mile: 285 (10th most)
> Households without internet: 13.9% (21st highest)
See all stories featuring: Ohio
[in-text-ad]

29. Kentucky
> 2001-2015 sightings per 100K: 35.6
> Total sightings: 1,587 (25th most)
> Population per sq. mile: 113 (22nd most)
> Households without internet: 17.8% (7th highest)
See all stories featuring: Kentucky

28. Oklahoma
> 2001-2015 sightings per 100K: 35.8
> Total sightings: 1,408 (23rd fewest)
> Population per sq. mile: 57 (16th fewest)
> Households without internet: 17.3% (9th highest)
See all stories featuring: Oklahoma
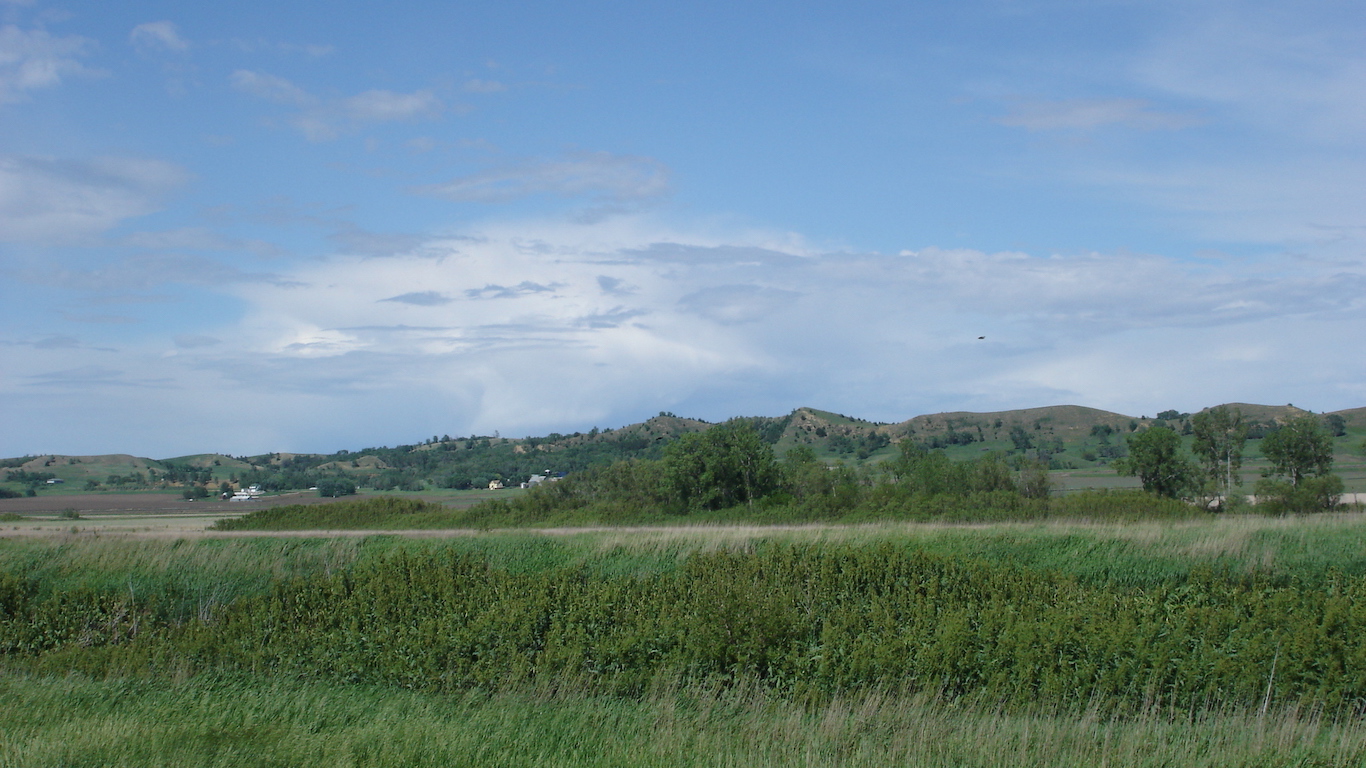
27. Iowa
> 2001-2015 sightings per 100K: 36.8
> Total sightings: 1,158 (20th fewest)
> Population per sq. mile: 56 (15th fewest)
> Households without internet: 14.4% (17th highest)
See all stories featuring: Iowa
[in-text-ad-2]

26. South Carolina
> 2001-2015 sightings per 100K: 37.0
> Total sightings: 1,859 (22nd most)
> Population per sq. mile: 167 (19th most)
> Households without internet: 16.9% (10th highest)
See all stories featuring: South Carolina

25. Florida
> 2001-2015 sightings per 100K: 37.1
> Total sightings: 7,787 (2nd most)
> Population per sq. mile: 391 (8th most)
> Households without internet: 12.6% (19th lowest)
See all stories featuring: Florida
[in-text-ad]

24. Utah
> 2001-2015 sightings per 100K: 37.3
> Total sightings: 1,158 (20th fewest)
> Population per sq. mile: 38 (11th fewest)
> Households without internet: 7.5% (the lowest)
See all stories featuring: Utah

23. Kansas
> 2001-2015 sightings per 100K: 37.3
> Total sightings: 1,088 (17th fewest)
> Population per sq. mile: 36 (10th fewest)
> Households without internet: 13.6% (23rd highest)
See all stories featuring: Kansas

22. Hawaii
> 2001-2015 sightings per 100K: 37.7
> Total sightings: 538 (8th fewest)
> Population per sq. mile: 222 (13th most)
> Households without internet: 12.1% (17th lowest)
See all stories featuring: Hawaii
[in-text-ad-2]

21. California
> 2001-2015 sightings per 100K: 40.1
> Total sightings: 15,836 (the most)
> Population per sq. mile: 254 (11th most)
> Households without internet: 9.8% (6th lowest)
See all stories featuring: California

20. Pennsylvania
> 2001-2015 sightings per 100K: 40.4
> Total sightings: 5,176 (5th most)
> Population per sq. mile: 286 (9th most)
> Households without internet: 15.5% (13th highest)
See all stories featuring: Pennsylvania
[in-text-ad]

19. Connecticut
> 2001-2015 sightings per 100K: 41.2
> Total sightings: 1,478 (24th fewest)
> Population per sq. mile: 741 (4th most)
> Households without internet: 11.6% (12th lowest)
See all stories featuring: Connecticut

18. Michigan
> 2001-2015 sightings per 100K: 41.8
> Total sightings: 4,160 (9th most)
> Population per sq. mile: 176 (18th most)
> Households without internet: 13.9% (22nd highest)
See all stories featuring: Michigan

17. Indiana
> 2001-2015 sightings per 100K: 43.5
> Total sightings: 2,897 (15th most)
> Population per sq. mile: 186 (16th most)
> Households without internet: 15.5% (12th highest)
See all stories featuring: Indiana
[in-text-ad-2]

16. West Virginia
> 2001-2015 sightings per 100K: 45.2
> Total sightings: 821 (12th fewest)
> Population per sq. mile: 76 (22nd fewest)
> Households without internet: 19.9% (5th highest)
See all stories featuring: West Virginia

15. Missouri
> 2001-2015 sightings per 100K: 47.5
> Total sightings: 2,902 (14th most)
> Population per sq. mile: 89 (23rd fewest)
> Households without internet: 15.1% (16th highest)
See all stories featuring: Missouri
[in-text-ad]

14. Rhode Island
> 2001-2015 sightings per 100K: 49.3
> Total sightings: 522 (7th fewest)
> Population per sq. mile: 1,025 (2nd most)
> Households without internet: 12.1% (16th lowest)
See all stories featuring: Rhode Island

13. Nevada
> 2001-2015 sightings per 100K: 52.8
> Total sightings: 1,583 (25th fewest)
> Population per sq. mile: 27 (9th fewest)
> Households without internet: 13.0% (22nd lowest)
See all stories featuring: Nevada

12. Colorado
> 2001-2015 sightings per 100K: 57.0
> Total sightings: 3,197 (12th most)
> Population per sq. mile: 54 (14th fewest)
> Households without internet: 9.0% (4th lowest)
See all stories featuring: Colorado
[in-text-ad-2]
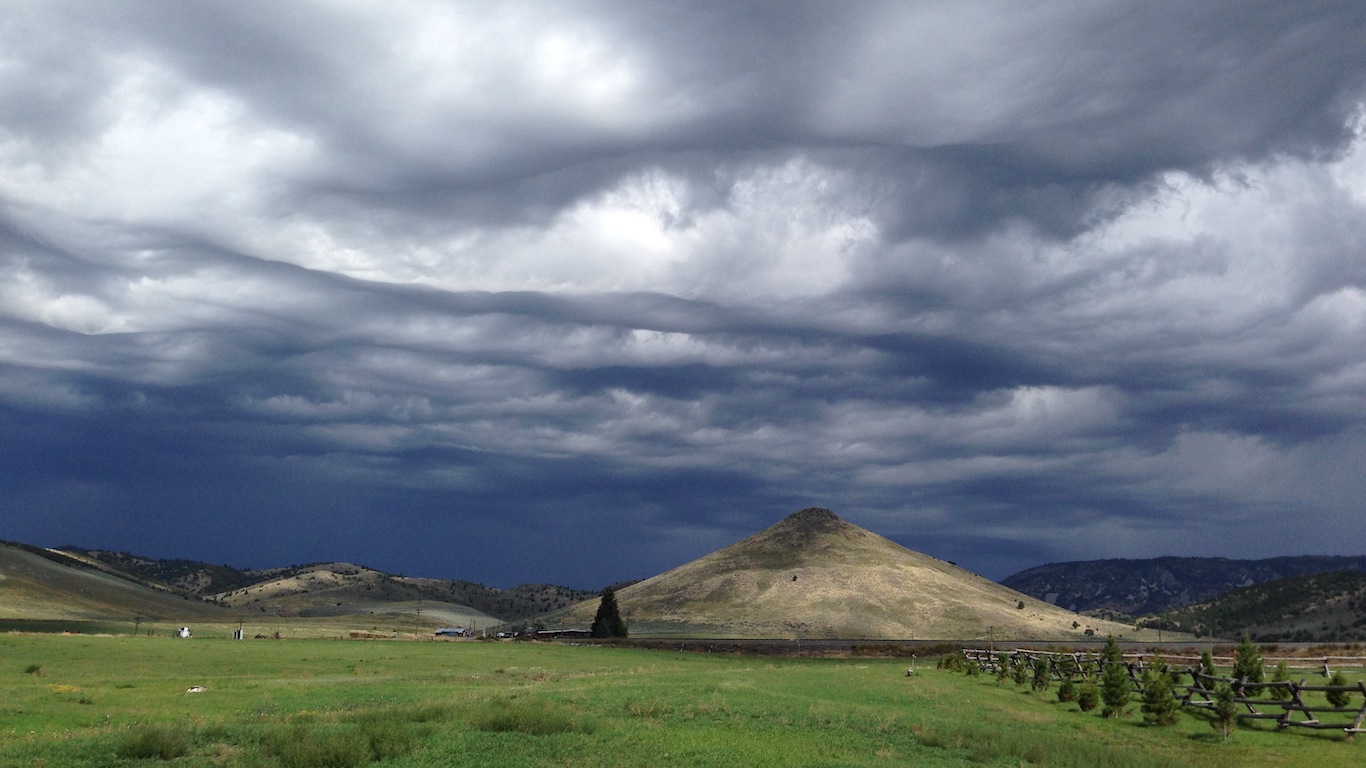
11. Idaho
> 2001-2015 sightings per 100K: 57.0
> Total sightings: 979 (15th fewest)
> Population per sq. mile: 21 (7th fewest)
> Households without internet: 14.0% (20th highest)
See all stories featuring: Idaho

10. Wyoming
> 2001-2015 sightings per 100K: 58.2
> Total sightings: 337 (4th fewest)
> Population per sq. mile: 6 (2nd fewest)
> Households without internet: 12.2% (18th lowest)
See all stories featuring: Wyoming
[in-text-ad]

9. Montana
> 2001-2015 sightings per 100K: 58.7
> Total sightings: 617 (9th fewest)
> Population per sq. mile: 7 (3rd fewest)
> Households without internet: 15.2% (15th highest)
See all stories featuring: Montana

8. Alaska
> 2001-2015 sightings per 100K: 64.1
> Total sightings: 474 (5th fewest)
> Population per sq. mile: 1 (the fewest)
> Households without internet: 11.6% (13th lowest)
See all stories featuring: Alaska

7. New Mexico
> 2001-2015 sightings per 100K: 67.1
> Total sightings: 1,402 (22nd fewest)
> Population per sq. mile: 17 (6th fewest)
> Households without internet: 20.0% (4th highest)
See all stories featuring: New Mexico
[in-text-ad-2]
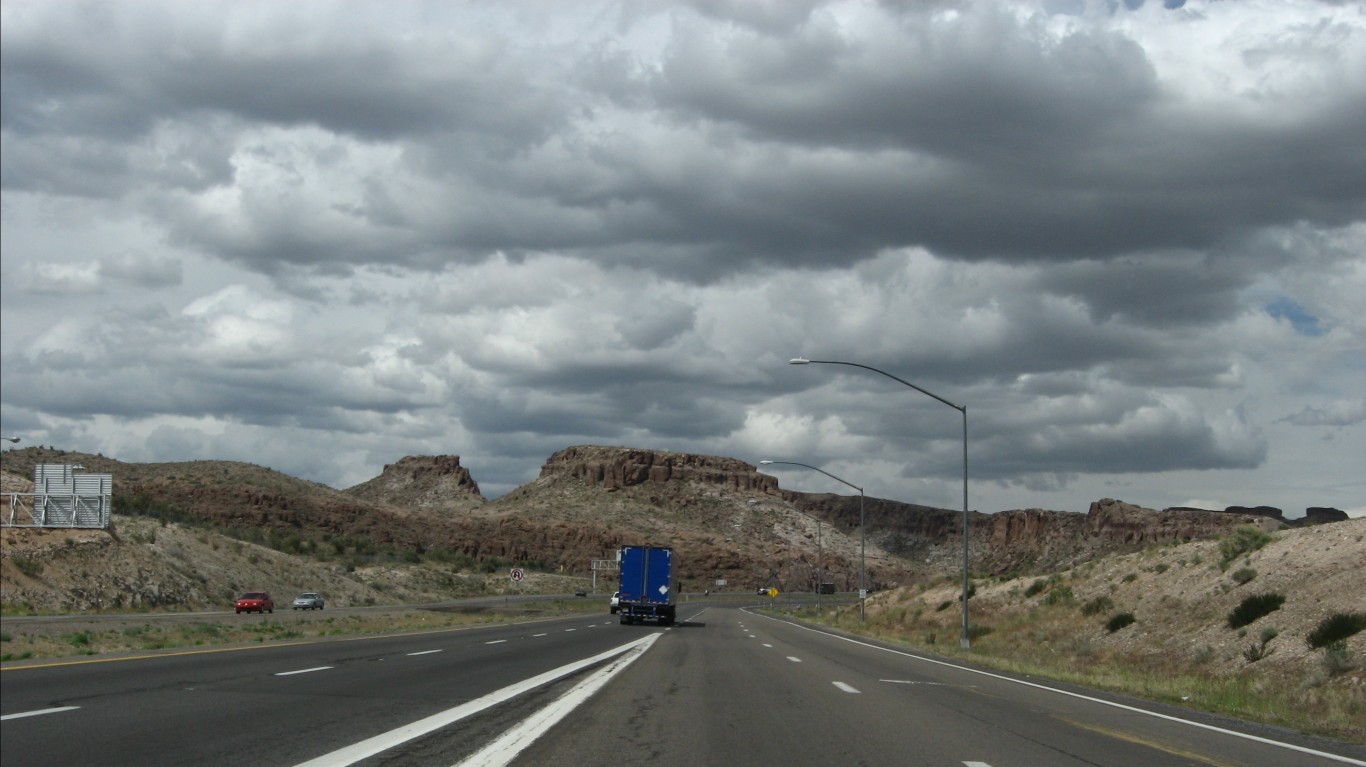
6. Arizona
> 2001-2015 sightings per 100K: 67.4
> Total sightings: 4,726 (7th most)
> Population per sq. mile: 62 (18th fewest)
> Households without internet: 11.7% (14th lowest)
See all stories featuring: Arizona

5. New Hampshire
> 2001-2015 sightings per 100K: 69.4
> Total sightings: 932 (13th fewest)
> Population per sq. mile: 150 (21st most)
> Households without internet: 8.5% (3rd lowest)
See all stories featuring: New Hampshire
[in-text-ad]

4. Washington
> 2001-2015 sightings per 100K: 70.6
> Total sightings: 5,226 (4th most)
> Population per sq. mile: 111 (23rd most)
> Households without internet: 8.4% (2nd lowest)
See all stories featuring: Washington

3. Maine
> 2001-2015 sightings per 100K: 71.0
> Total sightings: 949 (14th fewest)
> Population per sq. mile: 43 (13th fewest)
> Households without internet: 13.2% (24th lowest)
See all stories featuring: Maine

2. Oregon
> 2001-2015 sightings per 100K: 72.7
> Total sightings: 3,013 (13th most)
> Population per sq. mile: 43 (12th fewest)
> Households without internet: 10.2% (8th lowest)
See all stories featuring: Oregon
[in-text-ad-2]

1. Vermont
> 2001-2015 sightings per 100K: 80.8
> Total sightings: 504 (6th fewest)
> Population per sq. mile: 68 (20th fewest)
> Households without internet: 13.0% (23rd lowest)
See all stories featuring: Vermont
Travel Cards Are Getting Too Good To Ignore (sponsored)
Credit card companies are pulling out all the stops, with the issuers are offering insane travel rewards and perks.
We’re talking huge sign-up bonuses, points on every purchase, and benefits like lounge access, travel credits, and free hotel nights. For travelers, these rewards can add up to thousands of dollars in flights, upgrades, and luxury experiences every year.
It’s like getting paid to travel — and it’s available to qualified borrowers who know where to look.
We’ve rounded up some of the best travel credit cards on the market. Click here to see the list. Don’t miss these offers — they won’t be this good forever.
Thank you for reading! Have some feedback for us?
Contact the 24/7 Wall St. editorial team.
 24/7 Wall St.
 24/7 Wall St.
 24/7 Wall St.
 24/7 Wall St.
 24/7 Wall St.


