
Americans have a global reputation for unhealthy eating habits that have led to a national obesity rate of nearly 40%. The situation seems to only be getting worse.
Healthy eating was at its lowest level in 2016, the latest year for which data is available. About 63.3% of U.S. adults reported eating healthy all day the previous day, surpassing the previous low of 67.7% in 2010, according to a Gallup poll. This meant an increase of more than 10 million American adults with poor diets.
Gallup asked tens of thousands of Americans in 189 communities in all 50 states, “Did you eat healthy all day yesterday?” And the answers varied from city to city. 24/7 Tempo reviewed the cities with the highest shares of residents reporting unhealthy eating habits.
Of the 40 cities with the highest share of residents eating unhealthy diets, all but four are either in the South or the Midwest. In the metro area with the worst diet in the nation only slightly more than half of adult residents reported healthy eating. By contrast, in the region with the best diet 75.3% of adults said they are eating healthy.
With information on nutritious foods only a click away, it’s not hard to find examples of what to eat in order to be healthy. Most people already know fruits and vegetables are preferable and junk food should be avoided. For somewhat of a balance, here are several healthy versions of old-school unhealthy snacks.
But eating decisions are impacted by other factors, including money and availability of healthy food options. More than half of the 40 metro areas where people have the worst eating habits have more fast-food restaurants per 100,000 people than the national average of 73 per 100,000 people.
Income may partly explain eating choices. Produce and high-quality meat tend to be more expensive than cheeseburgers and fries, which are among the unhealthiest items in every fast-food chain. The median household income in 33 of the 40 cities with the worst diets is lower than the national median of $60,366 annually. In addition, in just over half of the 40 cities a higher share of households receives food stamps than across the United States as a whole.
In the metro areas where residents reported eating unhealthy, poor health outcomes are a lot more common than in the rest of the United States as a whole. Take obesity, for example. All but three of the 40 cities with the worst diets have a greater adult obesity rate than the national average.
Click here to see the 40 cities with the worst diets.
To identify the 40 cities with the worst diets, 24/7 Tempo reviewed the metro areas where less than 60% of adults reported eating a healthy diet all day, according to Gallup and Sharecare’s 2016 Community Rankings for Healthy Eating report. Population and median household income data was obtained from the U.S. Census Bureau’s 2017 American Community Survey. Obesity rates and percentage of adults reporting fair or poor health came from the 2019 County Health Rankings & Roadmaps, a Robert Wood Johnson Foundation and the University of Wisconsin Population Health Institute joint program.

40. Provo-Orem, Utah
> Adults who do not eat healthy: 40.1%
> Fast-food restaurants: 66.9 per 100,000 people
> Adult obesity rate: 25.4%
> Median household income: $70,196
> Adults who report poor or fair health: 11.9%
> Population: 617,678
[in-text-ad]
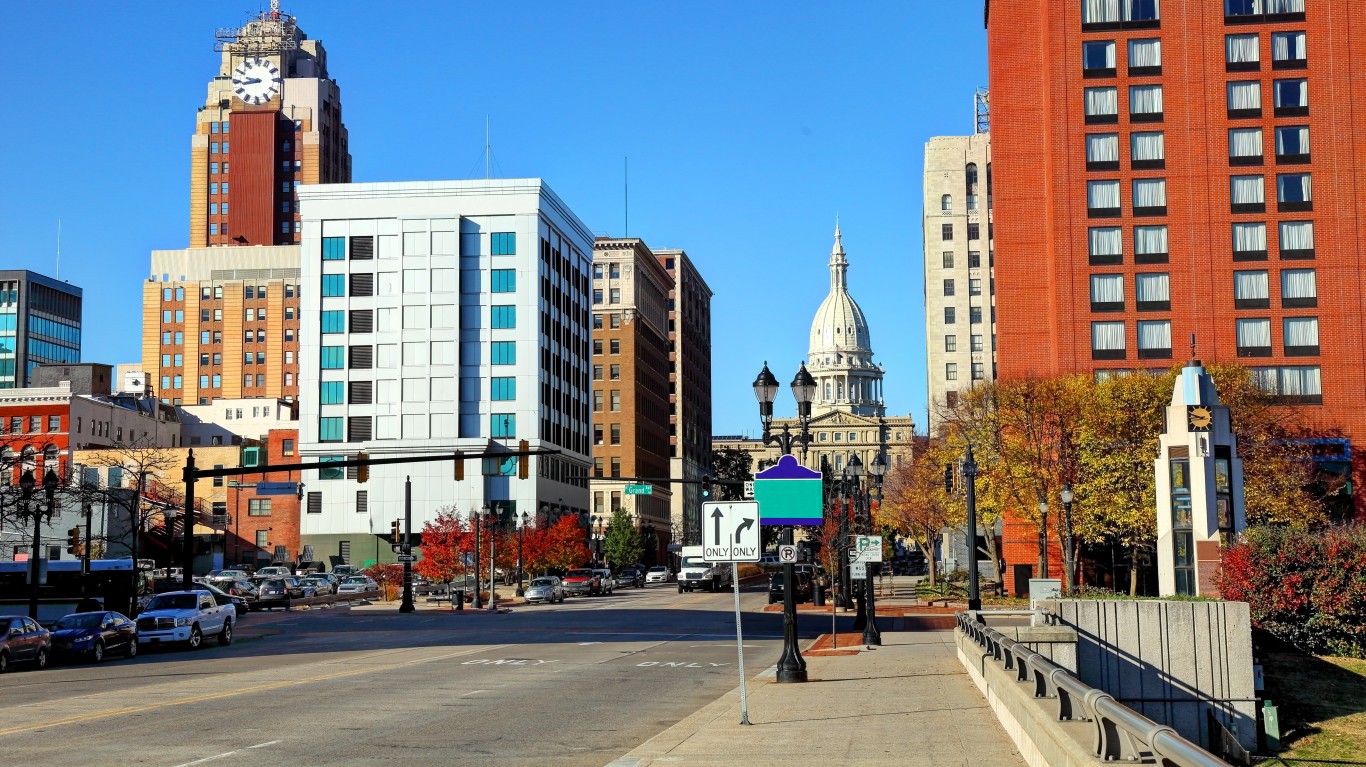
39. Lansing-East Lansing, Michigan
> Adults who do not eat healthy: 40.1%
> Fast-food restaurants: 73.1 per 100,000 people
> Adult obesity rate: 32.9%
> Median household income: $56,440
> Adults who report poor or fair health: 15.9%
> Population: 477,656
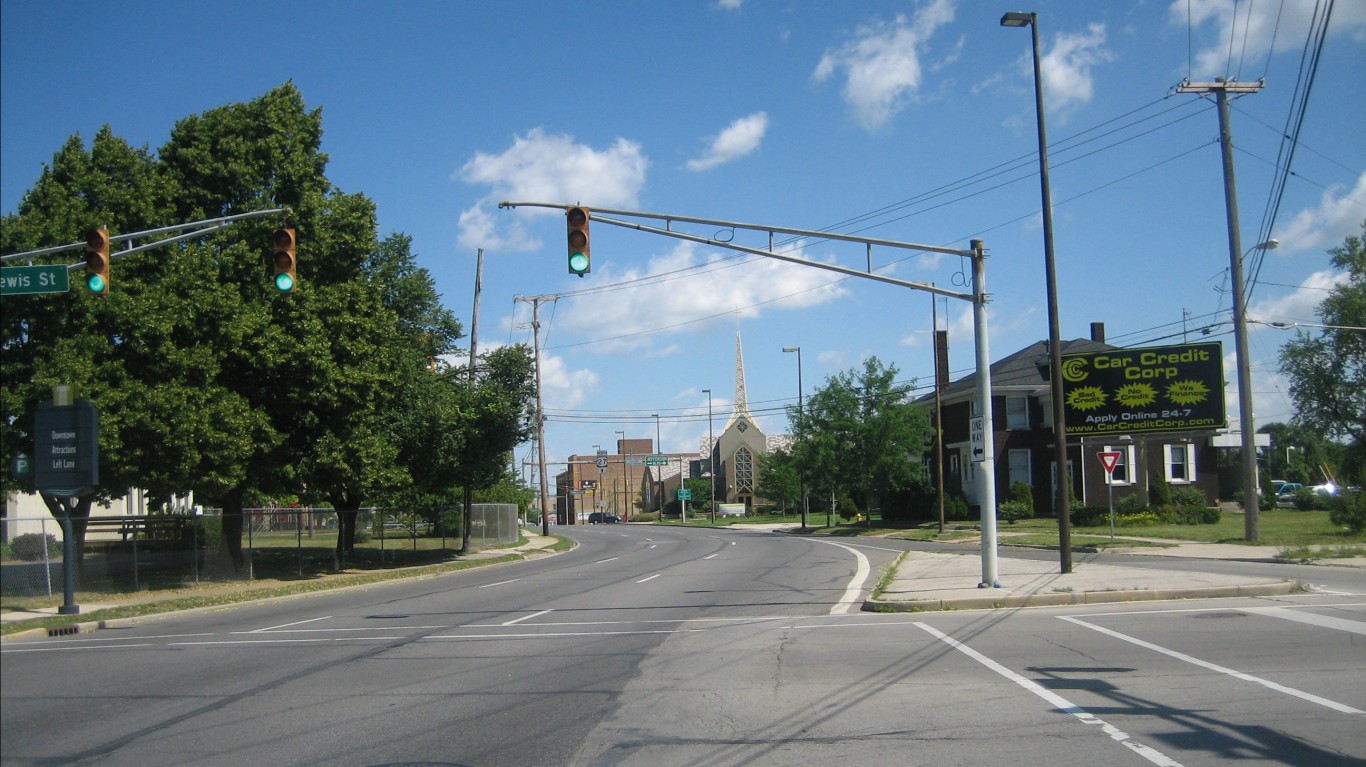
38. Fort Wayne, Indiana
> Adults who do not eat healthy: 40.1%
> Fast-food restaurants: 64.9 per 100,000 people
> Adult obesity rate: 31.8%
> Median household income: $52,908
> Adults who report poor or fair health: 14.5%
> Population: 434,617

37. Baton Rouge, Louisiana
> Adults who do not eat healthy: 40.2%
> Fast-food restaurants: 76.5 per 100,000 people
> Adult obesity rate: 33.2%
> Median household income: $57,401
> Adults who report poor or fair health: 18.8%
> Population: 834,159
[in-text-ad-2]

36. Toledo, Ohio
> Adults who do not eat healthy: 40.2%
> Fast-food restaurants: 88.1 per 100,000 people
> Adult obesity rate: 33.9%
> Median household income: $50,389
> Adults who report poor or fair health: 17.4%
> Population: 603,668

35. Beaumont-Port Arthur, Texas
> Adults who do not eat healthy: 40.3%
> Fast-food restaurants: 64.4 per 100,000 people
> Adult obesity rate: 33.7%
> Median household income: $49,875
> Adults who report poor or fair health: 17.6%
> Population: 411,339
[in-text-ad]

34. Akron, Ohio
> Adults who do not eat healthy: 40.3%
> Fast-food restaurants: 84.2 per 100,000 people
> Adult obesity rate: 29.4%
> Median household income: $56,106
> Adults who report poor or fair health: 15.2%
> Population: 703,505

33. Chico, California
> Adults who do not eat healthy: 40.4%
> Fast-food restaurants: 68.9 per 100,000 people
> Adult obesity rate: 25.4%
> Median household income: $49,061
> Adults who report poor or fair health: 16.3%
> Population: 229,294

32. Flint, Michigan
> Adults who do not eat healthy: 40.5%
> Fast-food restaurants: 77.8 per 100,000 people
> Adult obesity rate: 32.4%
> Median household income: $46,298
> Adults who report poor or fair health: 19.9%
> Population: 407,385
[in-text-ad-2]

31. Huntsville, Alabama
> Adults who do not eat healthy: 40.5%
> Fast-food restaurants: 84.5 per 100,000 people
> Adult obesity rate: 32.2%
> Median household income: $61,331
> Adults who report poor or fair health: 15.5%
> Population: 455,448

30. Binghamton, New York
> Adults who do not eat healthy: 40.6%
> Fast-food restaurants: 73.9 per 100,000 people
> Adult obesity rate: 29.2%
> Median household income: $50,545
> Adults who report poor or fair health: 16.8%
> Population: 242,217
[in-text-ad]

29. Richmond, Virginia
> Adults who do not eat healthy: 40.6%
> Fast-food restaurants: 72.1 per 100,000 people
> Adult obesity rate: 29.9%
> Median household income: $67,633
> Adults who report poor or fair health: 15.2%
> Population: 1,301,540

28. Knoxville, Tennessee
> Adults who do not eat healthy: 40.7%
> Fast-food restaurants: 75.5 per 100,000 people
> Adult obesity rate: 32.3%
> Median household income: $51,848
> Adults who report poor or fair health: 18.8%
> Population: 877,874

27. Nashville-Davidson–Murfreesboro–Franklin, Tennessee
> Adults who do not eat healthy: 41.0%
> Fast-food restaurants: 79.7 per 100,000 people
> Adult obesity rate: 31.7%
> Median household income: $63,939
> Adults who report poor or fair health: 16.4%
> Population: 1,904,226
[in-text-ad-2]

26. Lincoln, Nebraska
> Adults who do not eat healthy: 41.2%
> Fast-food restaurants: 93.2 per 100,000 people
> Adult obesity rate: 27.7%
> Median household income: $60,057
> Adults who report poor or fair health: 11.1%
> Population: 331,592

25. Columbus, Ohio
> Adults who do not eat healthy: 41.3%
> Fast-food restaurants: 80.9 per 100,000 people
> Adult obesity rate: 30.0%
> Median household income: $63,764
> Adults who report poor or fair health: 15.1%
> Population: 2,078,725
[in-text-ad]

24. Tallahassee, Florida
> Adults who do not eat healthy: 41.3%
> Fast-food restaurants: 75.8 per 100,000 people
> Adult obesity rate: 31.5%
> Median household income: $50,825
> Adults who report poor or fair health: 16.1%
> Population: 385,473

23. Omaha-Council Bluffs, Nebraska-Iowa
> Adults who do not eat healthy: 41.4%
> Fast-food restaurants: 69.3 per 100,000 people
> Adult obesity rate: 31.0%
> Median household income: $65,619
> Adults who report poor or fair health: 13.7%
> Population: 934,184

22. Columbia, South Carolina
> Adults who do not eat healthy: 41.5%
> Fast-food restaurants: 72.6 per 100,000 people
> Adult obesity rate: 32.7%
> Median household income: $54,480
> Adults who report poor or fair health: 16.3%
> Population: 825,004
[in-text-ad-2]

21. Erie, Pennsylvania
> Adults who do not eat healthy: 41.5%
> Fast-food restaurants: 69.2 per 100,000 people
> Adult obesity rate: 33.6%
> Median household income: $50,614
> Adults who report poor or fair health: 15.0%
> Population: 274,541

20. Indianapolis-Carmel-Anderson, Indiana
> Adults who do not eat healthy: 41.5%
> Fast-food restaurants: 78.3 per 100,000 people
> Adult obesity rate: 31.5%
> Median household income: $59,566
> Adults who report poor or fair health: 15.5%
> Population: 2,027,059
[in-text-ad]

19. Killeen-Temple, Texas
> Adults who do not eat healthy: 41.6%
> Fast-food restaurants: 63.7 per 100,000 people
> Adult obesity rate: 31.8%
> Median household income: $53,303
> Adults who report poor or fair health: 18.7%
> Population: 442,693

18. Jackson, Mississippi
> Adults who do not eat healthy: 41.8%
> Fast-food restaurants: 93.6 per 100,000 people
> Adult obesity rate: 36.1%
> Median household income: $52,434
> Adults who report poor or fair health: 19.5%
> Population: 578,794

17. Canton-Massillon, Ohio
> Adults who do not eat healthy: 41.9%
> Fast-food restaurants: 85.0 per 100,000 people
> Adult obesity rate: 32.5%
> Median household income: $51,198
> Adults who report poor or fair health: 16.4%
> Population: 399,927
[in-text-ad-2]

16. Lafayette, Louisiana
> Adults who do not eat healthy: 42.0%
> Fast-food restaurants: 70.6 per 100,000 people
> Adult obesity rate: 34.9%
> Median household income: $47,848
> Adults who report poor or fair health: 18.9%
> Population: 491,558

15. Oklahoma City, Oklahoma
> Adults who do not eat healthy: 42.2%
> Fast-food restaurants: 79.4 per 100,000 people
> Adult obesity rate: 32.1%
> Median household income: $56,260
> Adults who report poor or fair health: 16.4%
> Population: 1,383,737
[in-text-ad]

14. Shreveport-Bossier City, Louisiana
> Adults who do not eat healthy: 42.3%
> Fast-food restaurants: 80.1 per 100,000 people
> Adult obesity rate: 37.3%
> Median household income: $38,627
> Adults who report poor or fair health: 19.6%
> Population: 440,933
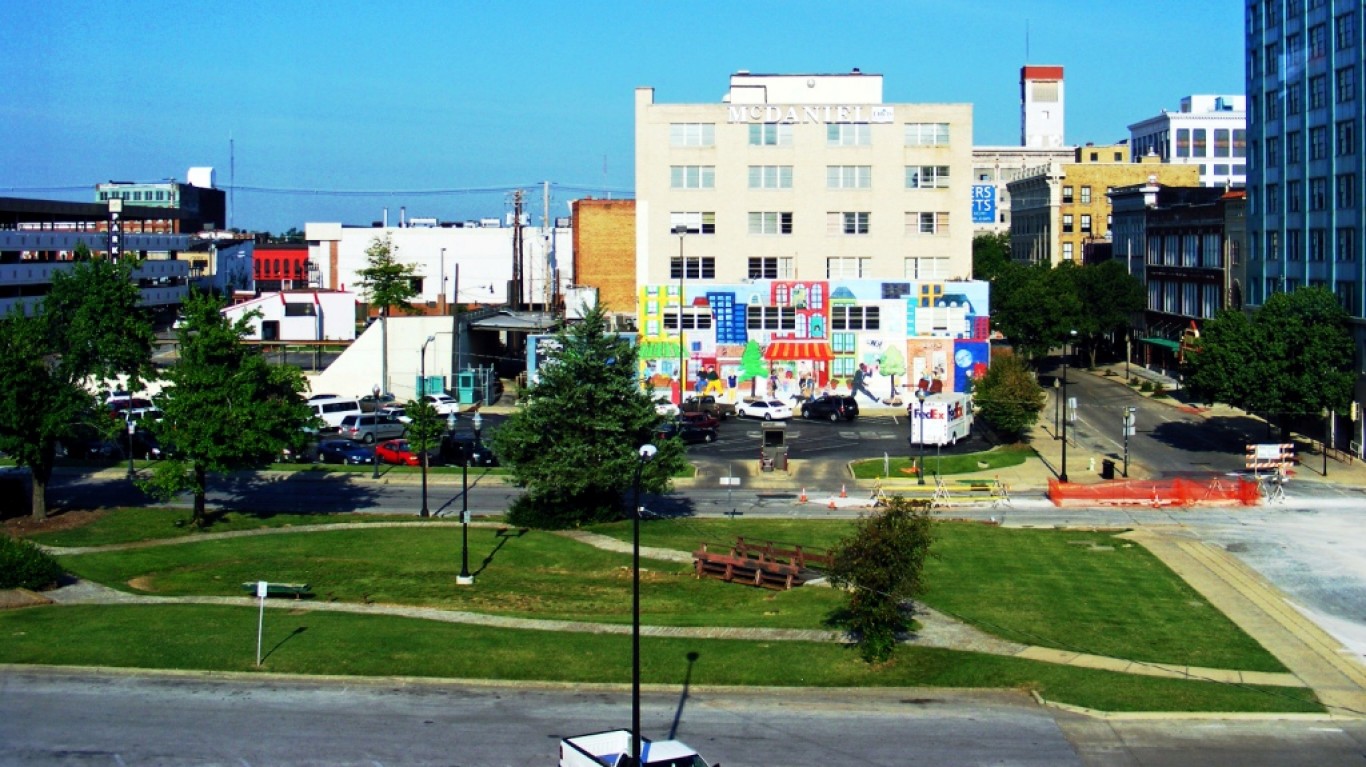
13. Springfield, Missouri
> Adults who do not eat healthy: 42.3%
> Fast-food restaurants: 75.6 per 100,000 people
> Adult obesity rate: 34.8%
> Median household income: $48,151
> Adults who report poor or fair health: 19.0%
> Population: 461,469

12. Montgomery, Alabama
> Adults who do not eat healthy: 42.5%
> Fast-food restaurants: 80.8 per 100,000 people
> Adult obesity rate: 36.9%
> Median household income: $49,123
> Adults who report poor or fair health: 20.6%
> Population: 373,889
[in-text-ad-2]

11. Augusta-Richmond County, Georgia-South Carolina
> Adults who do not eat healthy: 42.6%
> Fast-food restaurants: 67.8 per 100,000 people
> Adult obesity rate: 31.8%
> Median household income: $50,492
> Adults who report poor or fair health: 18.1%
> Population: 600,600

10. Tulsa, Oklahoma
> Adults who do not eat healthy: 42.8%
> Fast-food restaurants: 74.4 per 100,000 people
> Adult obesity rate: 31.2%
> Median household income: $52,275
> Adults who report poor or fair health: 16.1%
> Population: 990,773
[in-text-ad]

9. Little Rock-North Little Rock-Conway, Arkansas
> Adults who do not eat healthy: 42.9%
> Fast-food restaurants: 76.0 per 100,000 people
> Adult obesity rate: 34.4%
> Median household income: $53,173
> Adults who report poor or fair health: 19.0%
> Population: 738,082
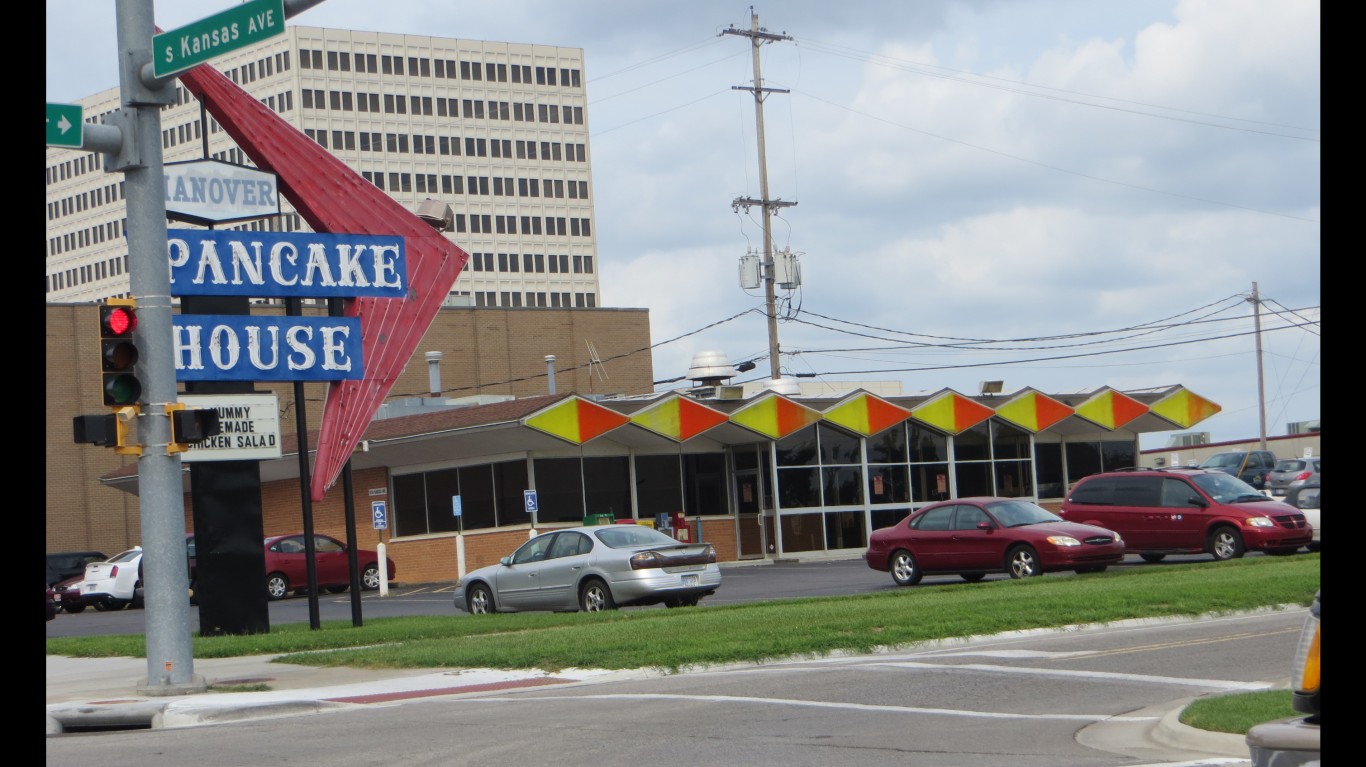
8. Topeka, Kansas
> Adults who do not eat healthy: 43.0%
> Fast-food restaurants: 78.1 per 100,000 people
> Adult obesity rate: 35.7%
> Median household income: $56,834
> Adults who report poor or fair health: 14.4%
> Population: 233,149

7. Wichita, Kansas
> Adults who do not eat healthy: 43.1%
> Fast-food restaurants: 85.5 per 100,000 people
> Adult obesity rate: 33.9%
> Median household income: $54,432
> Adults who report poor or fair health: 14.8%
> Population: 646,542
[in-text-ad-2]

6. Lexington-Fayette, Kentucky
> Adults who do not eat healthy: 43.1%
> Fast-food restaurants: 85.2 per 100,000 people
> Adult obesity rate: 30.0%
> Median household income: $58,069
> Adults who report poor or fair health: 18.2%
> Population: 512,650

5. Clarksville, Tennessee-Kentucky
> Adults who do not eat healthy: 43.3%
> Fast-food restaurants: 64.1 per 100,000 people
> Adult obesity rate: 33.4%
> Median household income: $54,667
> Adults who report poor or fair health: 20.3%
> Population: 285,602
[in-text-ad]

4. Hickory-Lenoir-Morganton, North Carolina
> Adults who do not eat healthy: 43.6%
> Fast-food restaurants: 70.7 per 100,000 people
> Adult obesity rate: 31.8%
> Median household income: $48,079
> Adults who report poor or fair health: 17.5%
> Population: 366,534

3. Cincinnati, Ohio
> Adults who do not eat healthy: 43.7%
> Fast-food restaurants: 73.2 per 100,000 people
> Adult obesity rate: 31.7%
> Median household income: $61,653
> Adults who report poor or fair health: 15.5%
> Population: 2,180,746
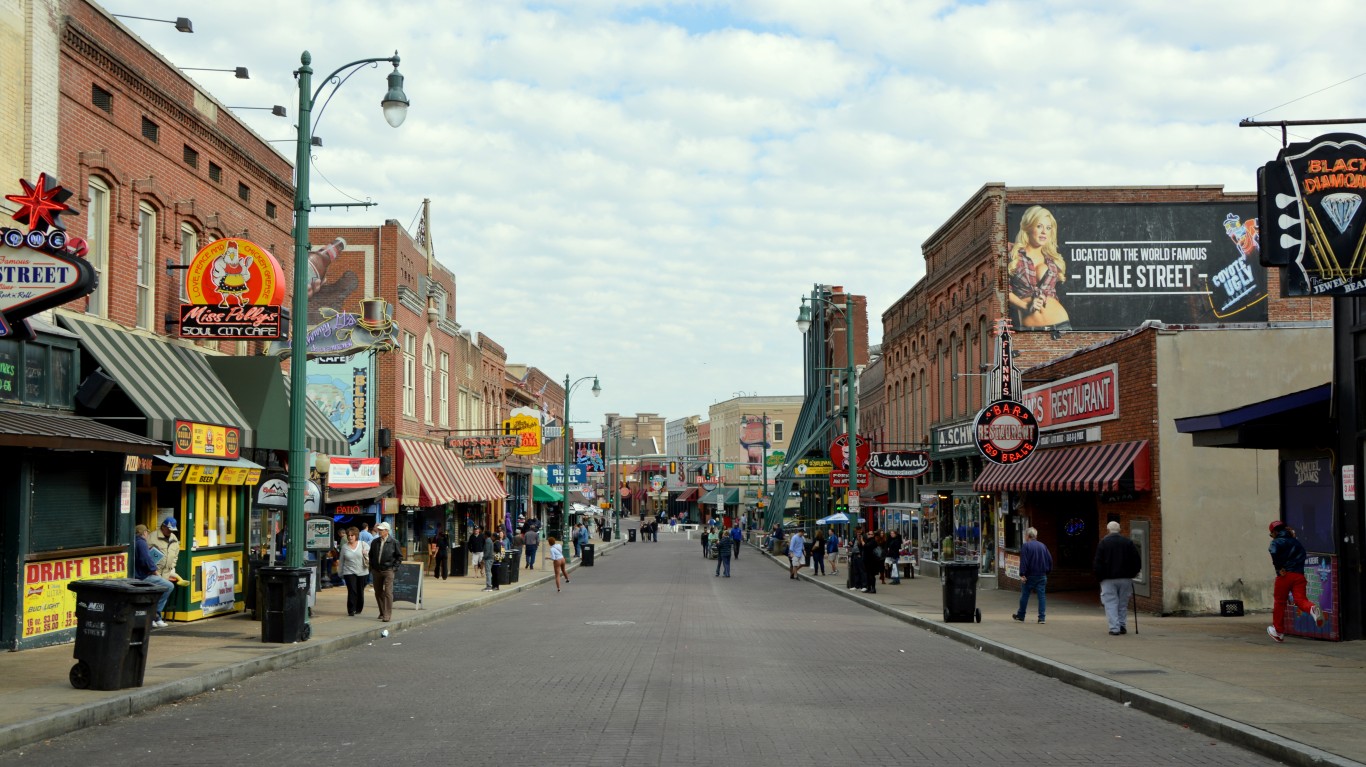
2. Memphis, Tennessee
> Adults who do not eat healthy: 44.1%
> Fast-food restaurants: 72.0 per 100,000 people
> Adult obesity rate: 35.1%
> Median household income: $50,984
> Adults who report poor or fair health: 19.4%
> Population: 1,346,626
[in-text-ad-2]
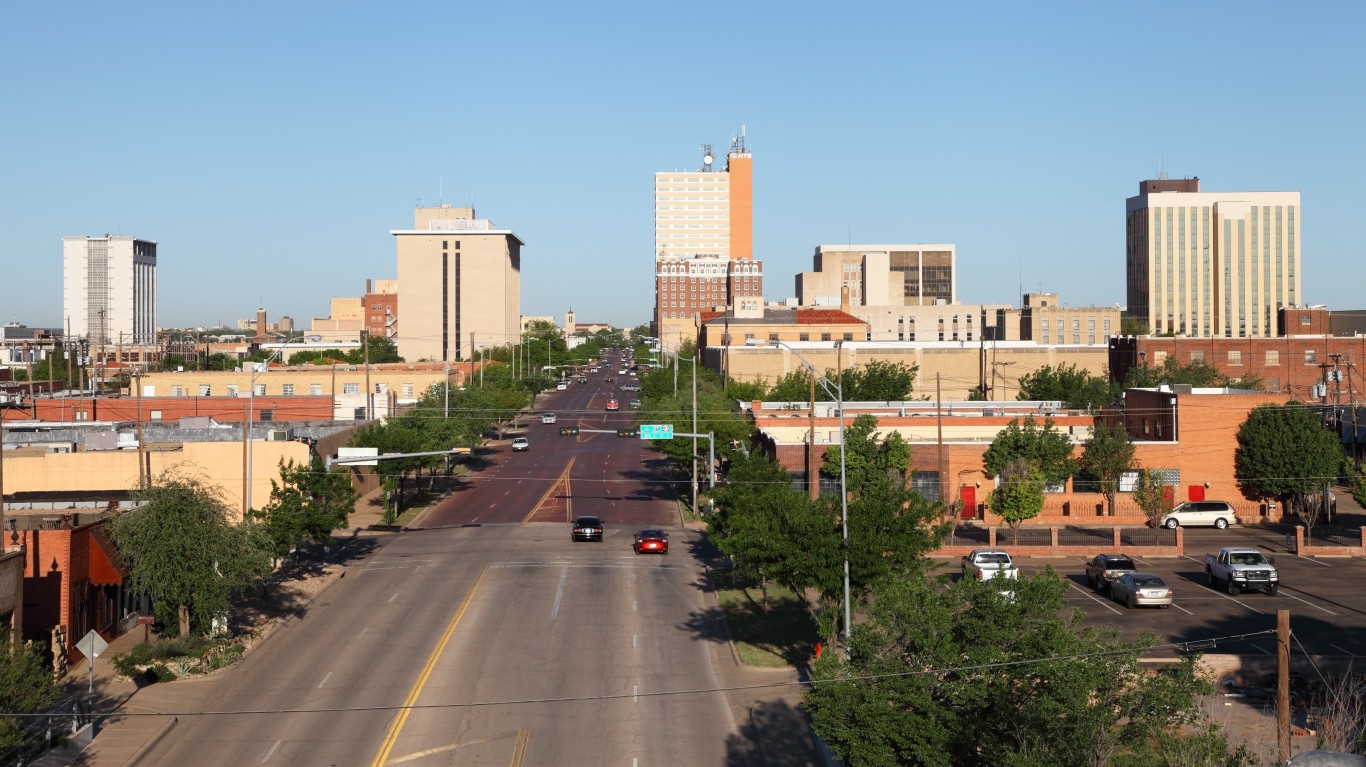
1. Lubbock, Texas
> Adults who do not eat healthy: 46.2%
> Fast-food restaurants: 85.2 per 100,000 people
> Adult obesity rate: 32.2%
> Median household income: $47,276
> Adults who report poor or fair health: 18.0%
> Population: 318,011
The #1 Thing to Do Before You Claim Social Security (Sponsor)
Choosing the right (or wrong) time to claim Social Security can dramatically change your retirement. So, before making one of the biggest decisions of your financial life, it’s a smart idea to get an extra set of eyes on your complete financial situation.
A financial advisor can help you decide the right Social Security option for you and your family. Finding a qualified financial advisor doesn’t have to be hard. SmartAsset’s free tool matches you with up to three financial advisors who serve your area, and you can interview your advisor matches at no cost to decide which one is right for you.
Click here to match with up to 3 financial pros who would be excited to help you optimize your Social Security outcomes.
Have questions about retirement or personal finance? Email us at [email protected]!
By emailing your questions to 24/7 Wall St., you agree to have them published anonymously on a673b.bigscoots-temp.com.
By submitting your story, you understand and agree that we may use your story, or versions of it, in all media and platforms, including via third parties.
Thank you for reading! Have some feedback for us?
Contact the 24/7 Wall St. editorial team.
 24/7 Wall St.
 24/7 Wall St.
 24/7 Wall St.
 24/7 Wall St.
 24/7 Wall St.


