Special Report
Most Dangerous City in Every State
Published:
Last Updated:

The U.S. violent crime rate has been falling for years and currently stands at nearly its lowest point in decades. According to the FBI, over 1.2 million violent crimes — which include aggravated assualt, rape, robbery, and murder — were committed in the United States in 2017, or 383 incidents for every 100,000 people. As recently as 1991, there were over 1.9 million violent crimes in the United States, or 758 incidents per 100,000 people.
Crime is a local issue, however, and rates of violence vary considerably across the country. Generally, violence is about twice as common in metropolitan areas and cities than it is in more rural areas. Indeed, in nearly every state, there is at least one city where the violence is far more common than it is nationwide. In some cities, violence is so common that the multi-decade high national violent crime rate of 1991 is preferable in comparison.
24/7 Wall St. reviewed violent crime rates in the nearly 2,000 cities and towns tracked by the FBI to identify the most dangerous city in each state. Only cities with populations of at least 20,000 were considered. Hawaii is the only state where no city tracked by the FBI has a higher crime rate than the state as a whole.
Crime is often more common in poorer areas with limited economic opportunities. The vast majority of cities on this list have higher poverty and unemployment rates than the state as a whole.
While there are some states where no city has a higher violent crime rate than the U.S. as a whole, most do. Some of the cities on this list are located in metro areas where violent crime rates have spiked in recent years. In cities with high rates of violence, other non-violent crimes like burglary and motor vehicle theft also tend to be common. The cities on this list are often also the same cities with the highest property crime rate in the state.
Click here to see the most dangerous city in every state
To identify the most dangerous city in each state, 24/7 Wall St. examined the FBI’s 2017 Uniform Crime Report, extracting violent crime data for all U.S. cities with populations of 20,000 or more. We examined each state’s figures for murder, nonnegligent manslaughter, rape, robbery, and aggravated assault, offenses that comprise the violent crime category. We also reviewed FBI figures for burglaries, larceny, motor vehicle thefts, and arson, all classified as property crimes. Annual unemployment rates for each city and state came from U.S. Bureau of Labor Statistics figures for 2018. Data on poverty rates, median household income, and educational attainment rates came from the U.S. Census Bureau’s American Community Survey 5-Year Estimates for 2013-2017.

Alabama: Anniston
> 2017 violent crimes per 100,000 people: 3,434 (state: 524)
> Number of violent crimes in 2017: 754 (3.0% of state total)
> Poverty rate: 29.5% (state: 18.0%)
> Annual unemployment: 5.6% (state: 3.9%)
There were 3,434 violent crimes — a category comprising rape, robbery, aggrevated assault, and murder — for every 100,000 people in Aniston, Alabama, by far the highest violent crime rate in the state and the highest of any major city. For reference, Alabama’s violent crime rate is 524 per 100,000 and the U.S. rate is 383 per 100,000.
Crime rates are typically higher in poorer areas, and a large share of Anniston residents are financially insecure. Nearly 20% of the city’s 22,000 residents live below the poverty line, well above the state poverty rate of 18.0% and the nationwide rate of 14.6%.
[in-text-ad]

Alaska: Anchorage
> 2017 violent crimes per 100,000 people: 1,203 (state: 829)
> Number of violent crimes in 2017: 3,564 (58.1% of state total)
> Poverty rate: 8.1% (state: 10.2%)
> Annual unemployment: 5.5% (state: 6.6%)
Alaska is the most dangerous state in the country, with 829 violent crimes for 100,000 residents — more than double the national violent crime rate of 383 per 100,000. Alaska’s high violent crime rate is mostly attributable to violence in Anchorage, the most dangerous city in the state. There were 1,203 violent crimes per 100,000 people in the city in 2017. Nearly half of the 62 murders and more than half of the 4,257 aggravated assaults in Alaska in 2017 were committed in Anchorage.
Property crime is also more common in Anchorage than any other city in the state. There were 5,416 burglaries, larcenies, and motor vehicle thefts for every 100,000 people in the city in 2017. Meanwhile, the state property crime rate was 575 per 100,000 people.

Arizona: Tucson
> 2017 violent crimes per 100,000 people: 802 (state: 508)
> Number of violent crimes in 2017: 4,268 (12.0% of state total)
> Poverty rate: 24.1% (state: 17.0%)
> Annual unemployment: 4.7% (state: 4.8%)
Tucson, Arizona’s second most populous city, is the most dangerous city in the state. There were 802 violent crimes for every 100,000 city residents in 2017, well above the state violent crime rate of 508 per 100,000.
As is typically the case, aggravated assault was the most common violent crime in Tucson. There were 431 aggravated assaults per 100,000 city residents in 2017, more than quadruple the 106 per 100,000 state rate.
Arkansas: Pine Bluff
> 2017 violent crimes per 100,000 people: 1,847 (state: 555)
> Number of violent crimes in 2017: 795 (4.8% of state total)
> Poverty rate: 30.4% (state: 18.1%)
> Annual unemployment: 6.0% (state: 3.7%)
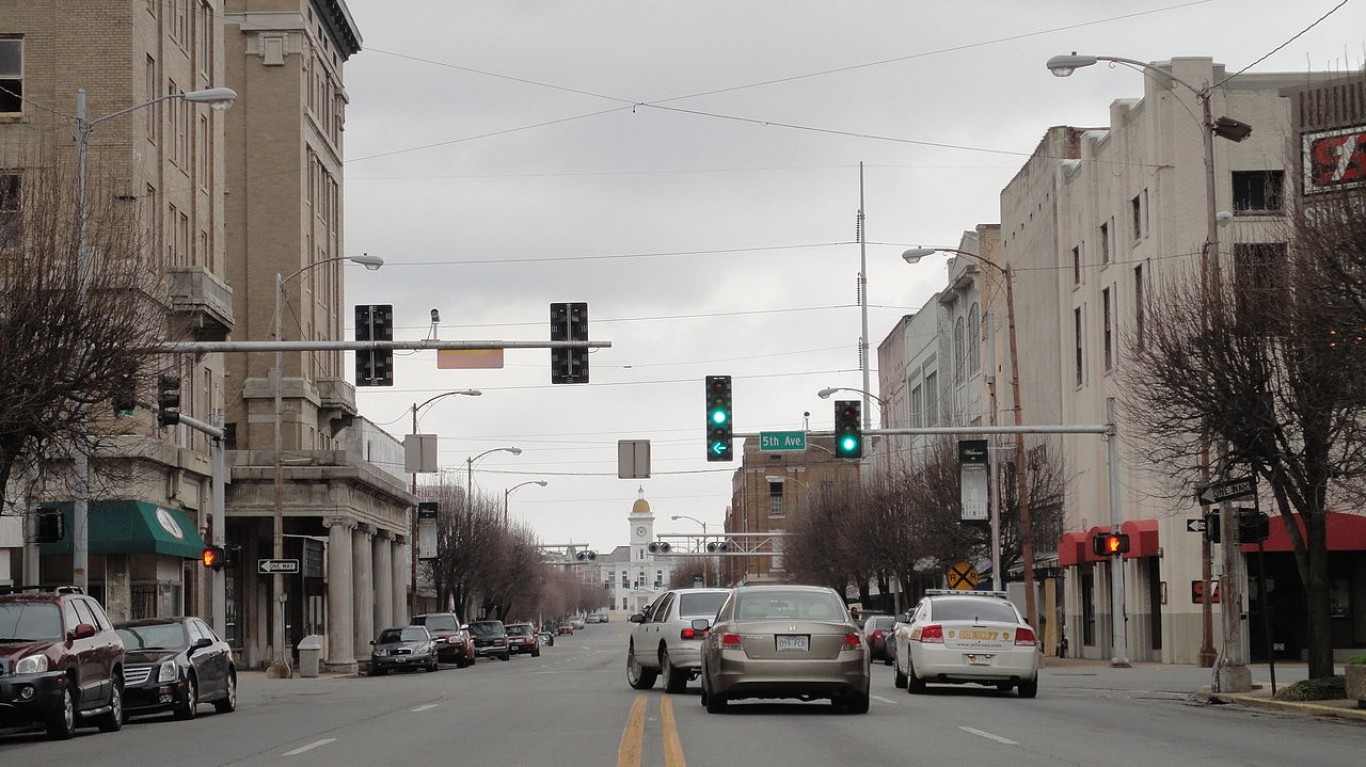
Pine Bluff is the most dangerous city in Arkansas and one of the most dangerous cities in the United States. There were 1,847 violent crimes per 100,000 people in the city in 2017, more than triple the state violent crime rate.
Crime tends to be more common in poor areas, and in Pine Bluff, 30.4% of the population lives below the poverty line compared with a poverty rate of 18.1% across Arkansas.
[in-text-ad-2]

California: Stockton
> 2017 violent crimes per 100,000 people: 1,415 (state: 449)
> Number of violent crimes in 2017: 4,379 (2.5% of state total)
> Poverty rate: 22.4% (state: 15.1%)
> Annual unemployment: 6.9% (state: 4.2%)
Of the hundreds of cities in California, Stockton has the highest violent crime rate. Driven largely by aggravated assault and robbery, there were 1,415 violent crimes per 100,000 people in Stockton in 2017. For reference, California’s violent crime rate is 449 per 100,000.
If current trends continue, Stockton will likely remain the most dangerous city in the state. Recent figures released by the Stockton Police Department reveal a 13% increase in violent crime in the city from the same period in 2018.
Colorado: Pueblo
> 2017 violent crimes per 100,000 people: 1,053 (state: 368)
> Number of violent crimes in 2017: 1,167 (5.7% of state total)
> Poverty rate: 24.4% (state: 11.5%)
> Annual unemployment: 5.3% (state: 3.3%)
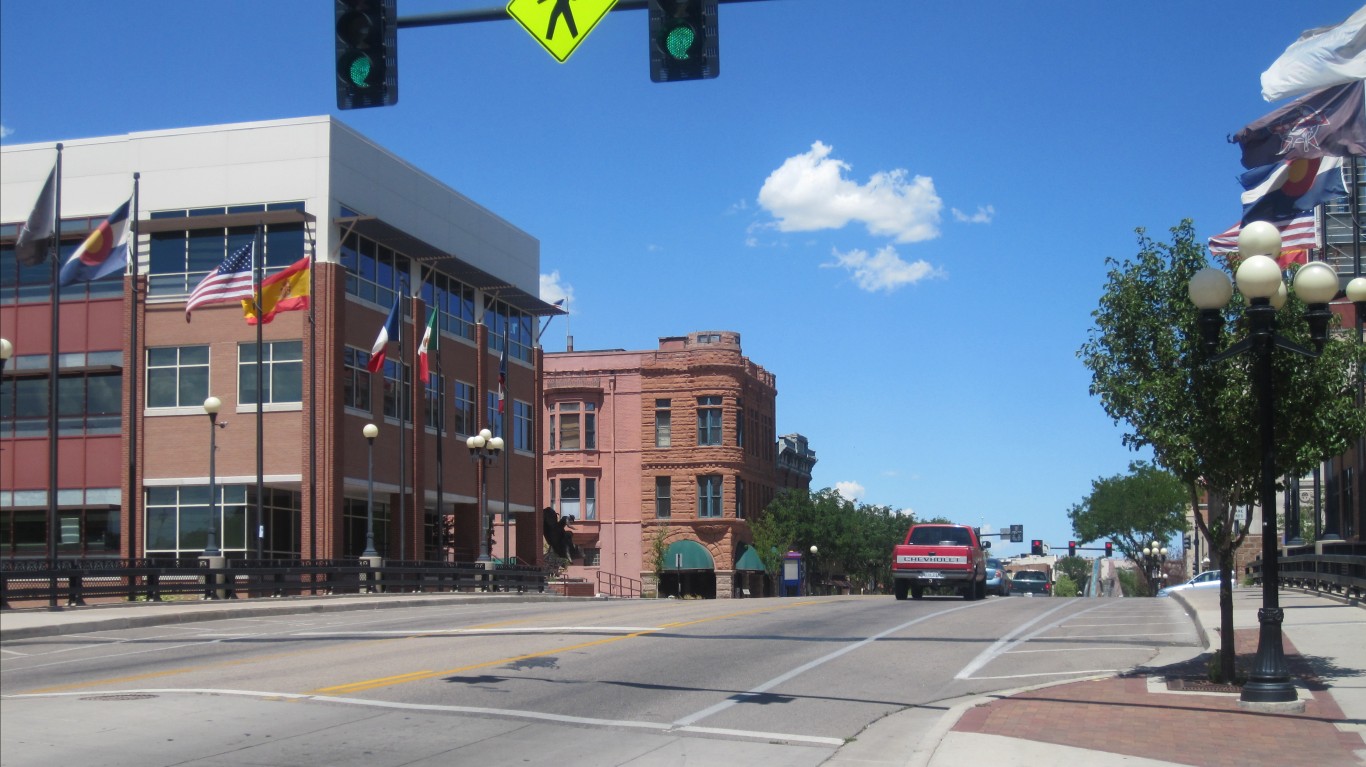
The central Colorado city of Pueblo is by far the most dangerous city in the state. The city’s violent crime rate of 1,053 incidents per 100,000 people is more than 50% greater than the violent crime rate in Denver of 676 per 100,000, which is the second highest violent crime rate in the state.
Crime tends to be more concentrated in poor areas — and not only is Pueblo the most dangerous city in Colorado, but it is also the poorest. Pueblo’s 24.4% poverty rate is more than double the 11.5% state poverty rate.
[in-text-ad]

Connecticut: Hartford
> 2017 violent crimes per 100,000 people: 1,093 (state: 228)
> Number of violent crimes in 2017: 1,343 (16.4% of state total)
> Poverty rate: 30.5% (state: 10.1%)
> Annual unemployment: 7.0% (state: 4.1%)
Overall, Connecticut is a relatively safe state, with a violent crime rate of 228 incidents per 100,000 people compared with a national violent crime rate of 383 per 100,000. Not all parts of the state are as safe, however. Hartford, the state capital, is the only city in Connecticut where there were over 1,000 violent crimes for every 100,000 people in 2017. Other cities in the state where violent crime is more concentrated than in the state as a whole include Bridgeport, New Haven, and Waterbury.

Delaware: Wilmington
> 2017 violent crimes per 100,000 people: 1,596 (state: 453)
> Number of violent crimes in 2017: 1,142 (26.2% of state total)
> Poverty rate: 27.0% (state: 12.1%)
> Annual unemployment: 5.3% (state: 3.8%)
Wilmington is the most populous city in Delaware — and far and away the most dangerous. Over a quarter of the 4,361 violent crimes reported in Delaware in 2017 were committed in Wilmington. There were 1,596 violent crimes for every 100,000 people in Wilmington in 2017, well more than double the violent crime rate of 693 incidents per 100,000 in Dover, the state’s second most dangerous city.

Florida: Riviera Beach
> 2017 violent crimes per 100,000 people: 1,370 (state: 408)
> Number of violent crimes in 2017: 473 (0.6% of state total)
> Poverty rate: 22.4% (state: 15.5%)
> Annual unemployment: 4.4% (state: 3.6%)
Riviera Beach, a city just north of West Palm Beach on the Atlantic coast, is the most dangerous city in Florida. The city’s violent crime rate of 1,370 incidents per 100,000 people is well above the statewide violent crime rate of 408 incidents per 100,000 residents.
Property crimes like burglary and motor vehicle theft are also relatively common in the city. There were 4,054 reported property crimes per 100,000 people in Riviera Beach in 2017, compared with a statewide property crime rate of 2,512 per 100,000.
[in-text-ad-2]
Georgia: East Point
> 2017 violent crimes per 100,000 people: 1,307 (state: 357)
> Number of violent crimes in 2017: 467 (1.3% of state total)
> Poverty rate: 24.8% (state: 16.9%)
> Annual unemployment: 5.4% (state: 3.9%)
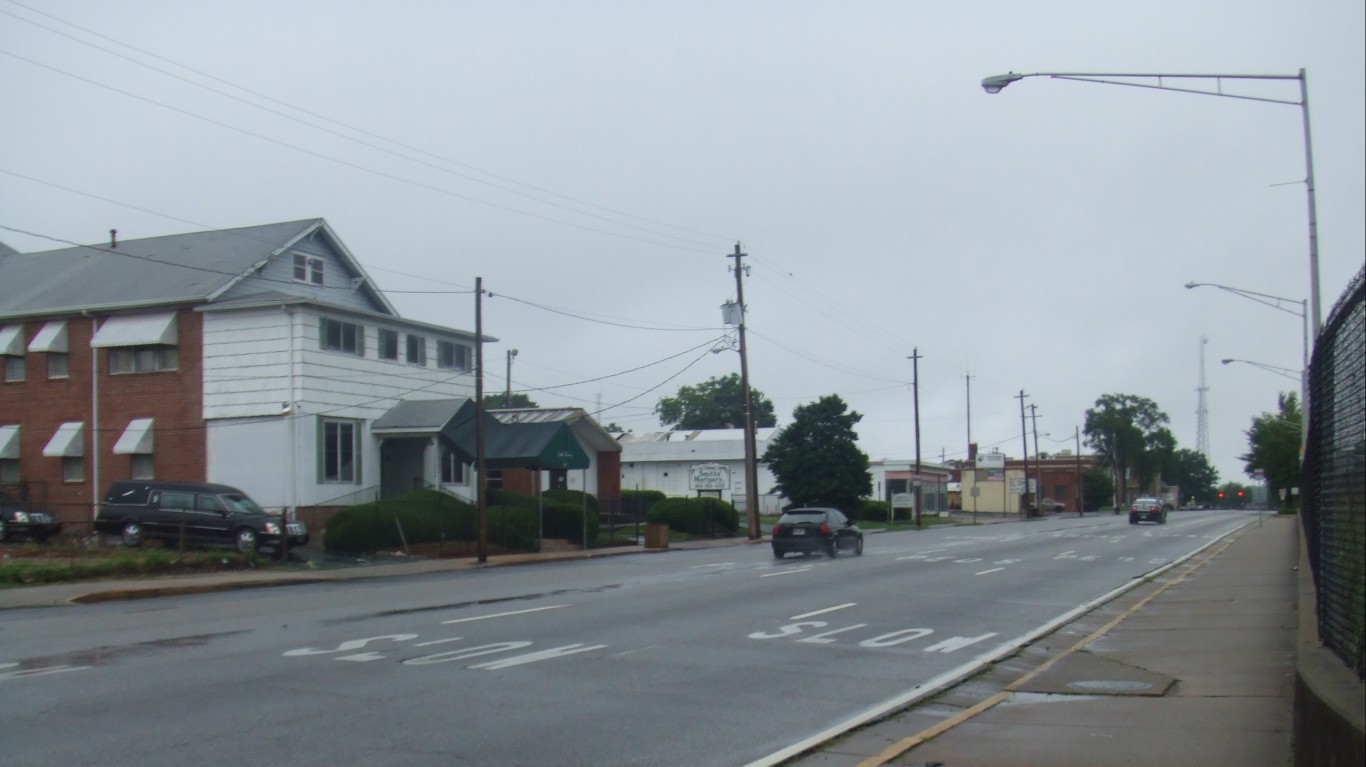
East Point, a small city just outside of Atlanta, is the most dangerous city in Georgia. The city’s violent crime rate of 1,307 per 100,000 is more than triple the statewide rate of 357 per 100,000. While violent crimes like robbery and rape are more common in East Point than any other city in the state, the city’s property crime rate is even more discouraging. Driven largely by larceny and burglary, there were 11,572 property crimes for every 100,000 people in the city in 2017, the highest property crime rate in the state and second highest in the nation. For reference, the national property crime rate is 2,362 per 100,000.

Hawaii: Honolulu
> 2017 violent crimes per 100,000 people: 246 (state: 251)
> Number of violent crimes in 2017: 2,440 (68.2% of state total)
> Poverty rate: 11.6% (state: 10.3%)
> Annual unemployment: N/A (state: 2.4%)
Honolulu is the only city in Hawaii for which the FBI tracks violent crime. As a result, it ranks as the most dangerous city in the state by default only. In fact, Honolulu is safer than the state as a whole. There were 246 violent crimes for every 100,000 people in Honolulu in 2017 compared with 251 violent crimes per 100,000 people statewide. For reference, the U.S. violent crime rate is 383 per 100,000.
[in-text-ad]

Idaho: Pocatello
> 2017 violent crimes per 100,000 people: 443 (state: 226)
> Number of violent crimes in 2017: 243 (6.3% of state total)
> Poverty rate: 20.2% (state: 14.5%)
> Annual unemployment: 2.7% (state: 2.8%)
Idaho is one of the safest states in the country with an annual violent crime rate of only 226 incidents per 100,000 people. Even in Pocatello, the most dangerous city in the state, there were 443 violent crimes per 100,000 residents in 2017, only slightly higher than the national violent crime rate of 383 per 100,000.
Pocatello is located in southern Idaho, less than 100 miles from Rexburg, the safest city in the state. There were just 38 violent crimes per 100,000 people in Rexburg in 2017.

Illinois: East St. Louis
> 2017 violent crimes per 100,000 people: 2,752 (state: 439)
> Number of violent crimes in 2017: 741 (1.3% of state total)
> Poverty rate: 43.1% (state: 13.5%)
> Annual unemployment: 8.3% (state: 4.3%)
East St. Louis is far and away the most dangerous city in Illinois and one of the most dangerous cities in the United States. There were 2,752 violent crimes in East St. Louis for every 100,000 people in 2017 — far more than the violent crime rate of 1,741 per 100,000 in Danville, the state’s second most dangerous city. Though Chicago is frequently in the national spotlight for violence, its violent crime rate of 1,099 per 100,000 pales in comparison with that of East St. Louis.
East St. Louis is directly across the Mississippi River from St. Louis, the most dangerous city in Missouri.

Indiana: Indianapolis
> 2017 violent crimes per 100,000 people: 1,334 (state: 399)
> Number of violent crimes in 2017: 11,616 (43.7% of state total)
> Poverty rate: 20.1% (state: 14.6%)
> Annual unemployment: 3.5% (state: 3.4%)
Indianapolis is the most populous, and most dangerous, city in Indiana. Nearly 44% of all violent crimes in the state were committed in the capital city. Robberies are especially common — as over half of the 6,600 reported robberies in Indiana in 2017 were committed in Indianapolis.
Earlier this year, Indianapolis Mayor Joe Hogsett introduced the Gun Crime Intelligence Program, designed to keep repeat offenders of firearm-related crimes off the streets. The program’s efficacy remains to be seen.
[in-text-ad-2]

Iowa: Clinton
> 2017 violent crimes per 100,000 people: 1,155 (state: 293)
> Number of violent crimes in 2017: 295 (3.2% of state total)
> Poverty rate: 16.0% (state: 12.0%)
> Annual unemployment: 3.4% (state: 2.5%)
Clinton is the only city in Iowa with a violent crime of over 1,000 incidents per 100,000 people. Overall, violent crime is about four times more common in Clinton than it is across Iowa as a whole. The violent crime rate in Clinton is driven almost entirely by aggravated assaults, of which there were 242 in the city in 2017. Despite ranking as the most dangerous city in the state, Clinton is one of eight Iowa cities tracked by the FBI to report no murders in 2017.

Kansas: Wichita
> 2017 violent crimes per 100,000 people: 1,022 (state: 413)
> Number of violent crimes in 2017: 3,998 (33.2% of state total)
> Poverty rate: 16.9% (state: 12.8%)
> Annual unemployment: 3.9% (state: 3.4%)
Wichita is the most dangerous city in Kansas by a wide margin. There were 1,022 violent crimes for every 100,000 people in the city in 2017 — more than double the state violent crime rate of 413 per 100,000 and well above the rate of 751 per 100,000 in Junction City, the second most dangerous city in the state.
Property crime is also more common in Wichita than any other city in Kansas. More than one in every four property crimes and nearly a third of violent crimes in Kansas in 2017 were committed in Wichita.
[in-text-ad]

Kentucky: Louisville
> 2017 violent crimes per 100,000 people: 647 (state: 226)
> Number of violent crimes in 2017: 4,428 (44.0% of state total)
> Poverty rate: 16.7% (state: 18.3%)
> Annual unemployment: N/A (state: 4.3%)
With 226 violent crimes for every 100,000 people in 2017, Kentucky is one of the safest states in the country. Nationwide, there were 383 violent crimes per 100,000 people in 2017. The most dangerous city in the state, Louisville, is one of the few Kentucky cities with a higher violent crime rate than the U.S. as a whole. Driven largely by aggravated assault, Louisville’s violent crime rate is 647 per 100,000. Additionally, 41.4% of the 263 reported homicides in Kentucky in 2017 were reported in Louisville.

Louisiana: Monroe
> 2017 violent crimes per 100,000 people: 2,225 (state: 557)
> Number of violent crimes in 2017: 1,098 (4.2% of state total)
> Poverty rate: 34.8% (state: 19.6%)
> Annual unemployment: 6.2% (state: 4.9%)
Monroe is the most dangerous city in a relatively dangerous state. There were 557 violent crimes for every 100,000 people in Louisiana in 2017, more than in all but three other states. In Monroe, a small city in northern Louisiana, there were 2,225 violent crimes for every 100,000 people in 2017 — nearly four times the statewide violent crime rate and well above the rate of 1,487 per 100,000 in Hammond, the second most dangerous city in the state.
Crime rates tend to be higher in low-income areas, and in Monroe, more than one-in-three residents live below the poverty line.

Maine: Biddeford
> 2017 violent crimes per 100,000 people: 360 (state: 121)
> Number of violent crimes in 2017: 77 (4.8% of state total)
> Poverty rate: 17.0% (state: 12.9%)
> Annual unemployment: 3.1% (state: 3.4%)
With a violent crime rate of 121 incidents per 100,000 people, Maine is the safest state in the country. Even in Biddeford, the most dangerous city in the state, violent crime is less common than it is nationwide. There were 360 violent crimes for every 100,000 residents in the city in 2017 compared with a national violent crime rate of 383 per 100,000. Despite ranking as the most dangerous city in the state, there were no murders in Biddeford in 2017.
[in-text-ad-2]

Maryland: Baltimore
> 2017 violent crimes per 100,000 people: 2,027 (state: 500)
> Number of violent crimes in 2017: 12,430 (41.1% of state total)
> Poverty rate: 22.4% (state: 9.7%)
> Annual unemployment: 5.7% (state: 3.9%)
Baltimore is by far the most dangerous city in Maryland. Baltimore is also the most populous city in the state, and 41.1% of all violent crimes reported in Maryland in 2017 were committed in the city. The city’s violent crime rate of 2,027 incidents per 100,000 people is more than double the rate of 971 per 100,000 in Salisbury, the second most dangerous city in the state.
Homicide is a particularly glaring problem in Baltimore. Though Baltimore does not even rank among the 25 largest U.S. cities by population, it reported 342 murders in 2017, the most of any city after Chicago. For reference, New York, a city home to 14 times as many people as Baltimore, reported 292 murders in 2017.

Massachusetts: Holyoke
> 2017 violent crimes per 100,000 people: 1,083 (state: 358)
> Number of violent crimes in 2017: 438 (1.8% of state total)
> Poverty rate: 28.6% (state: 11.1%)
> Annual unemployment: 5.5% (state: 3.3%)
With a violent crime rate of 1,083 per 100,000 people, Holyoke is the most dangerous city in Massachusetts. Crime tends to be more common in poorer areas, and many Holyoke residents are facing serious financial hardship. The city’s poverty rate of 28.6% is nearly the highest of any city in the state and well more than double the poverty rate of 11.1% across Massachusetts.
[in-text-ad]

Michigan: Detroit
> 2017 violent crimes per 100,000 people: 2,057 (state: 450)
> Number of violent crimes in 2017: 13,796 (30.8% of state total)
> Poverty rate: 37.9% (state: 15.6%)
> Annual unemployment: 9.0% (state: 4.1%)
Detroit’s violent crime rate is the highest of any city in Michigan and more than quadruple the statewide violent crime rate of 450 incidents per 100,000 people. Also the most populous city in the state, Detroit reported 267 murders, or 47% of all murders in the state in 2017.
Crime is often more common in areas with limited economic opportunity, and the Detroit job market is one of the worst in the country. The city’s annual unemployment rate is 9.0%, more than double the 4.1% statewide unemployment rate.

Minnesota: Minneapolis
> 2017 violent crimes per 100,000 people: 1,101 (state: 238)
> Number of violent crimes in 2017: 4,614 (34.7% of state total)
> Poverty rate: 20.7% (state: 10.5%)
> Annual unemployment: 2.5% (state: 2.9%)
Minneapolis has the highest violent crime rate of any Minnesota city by a wide margin. There were 1,101 violent crimes reported in the city in 2017 — more than four times the statewide violent crime rate and well above the rate of 651 per 100,000 in neighboring St. Paul, the second most dangerous city in Minnesota. Additionally, 37.2% of the 113 murders reported in Minnesota in 2017 were committed in Minneapolis.

Mississippi: Meridian
> 2017 violent crimes per 100,000 people: 500 (state: 286)
> Number of violent crimes in 2017: 194 (2.3% of state total)
> Poverty rate: 29.7% (state: 21.5%)
> Annual unemployment: 5.3% (state: 4.8%)
Mississippi has a relatively low violent crime rate. The rate 286 violent crimes per 100,000 people in the state compares with the national rate of 383 incidents per 100,000. Its most dangerous city — Meridian — ranks lower than 434 other U.S. cities, with a violent crime rate of 500 reported incidents per 100,000 per year.
Poverty conditions often are worse in higher-crime neighborhoods, and Meridian, located in the eastern part of the state, has a poverty rate of nearly 30%, compared with the already high statewide rate of 21.5%.
[in-text-ad-2]

Missouri: St. Louis
> 2017 violent crimes per 100,000 people: 2,082 (state: 530)
> Number of violent crimes in 2017: 6,461 (19.9% of state total)
> Poverty rate: 25.0% (state: 14.6%)
> Annual unemployment: 3.8% (state: 3.2%)
St. Louis is the most dangerous city in Missouri and one of the most dangerous cities in the United States. The city’s violent crime rate of 2,082 incidents per 100,000 people is more than triple the statewide rate of 530 per 100,000. There were 205 murders in St. Louis in 2017 — 55 more than there were in Kansas City, a city with over 170,000 more people than St. Louis.
Crime is often concentrated in poor areas and one in every four St. Louis residents live below the poverty line, compared with 14.6% of people living in poverty in Missouri.

Montana: Helena
> 2017 violent crimes per 100,000 people: 685 (state: 377)
> Number of violent crimes in 2017: 217 (5.5% of state total)
> Poverty rate: 15.6% (state: 14.4%)
> Annual unemployment: 3.1% (state: 3.7%)
Helena’s violent crime rate of 685 incidents per 100,000 people is the highest of any city tracked by the FBI in Montana. Across the state as a whole, there were 377 violent crimes for every 100,000 people in 2017. As is typically the case, aggravated assault was the most common type of violent crime in Montana’s capital city in 2017. Of the 217 violent crimes committed in Helena that year, 137 were aggravated assaults. There was only one murder in the city in 2017.
[in-text-ad]

Nebraska: Omaha
> 2017 violent crimes per 100,000 people: 647 (state: 306)
> Number of violent crimes in 2017: 2,909 (49.5% of state total)
> Poverty rate: 15.1% (state: 12.0%)
> Annual unemployment: 3.1% (state: 2.8%)
Of Nebraska’s three major cities, Norfolk and Bellevue have very low violent crime rates, less than 150 per 100,000 each. Omaha, by far the state’s largest urban area, has a violent crime rate of nearly 650 incidents per 100,000 people. While high poverty and high unemployment are frequently common in places with high crime, Omaha’s poverty rate and unemployment rate are both close to the national figures.

Nevada: North Las Vegas
> 2017 violent crimes per 100,000 people: 1,015 (state: 556)
> Number of violent crimes in 2017: 2,461 (14.8% of state total)
> Poverty rate: 15.1% (state: 14.2%)
> Annual unemployment: 5.3% (state: 4.6%)
There were 1,015 violent crimes for every 100,000 people in North Las Vegas in 2017, nearly double the violent crime rate of 556 per 100,000 across the state as a whole. The high overall violent crime rate in the city is driven largely by robberies and aggravated assaults.
Crime rates are often higher in areas with limited economic opportunity. In North Las Vegas, the annual unemployment rate is 5.3%, the highest of any Nevada city tracked by the FBI.

New Hampshire: Manchester
> 2017 violent crimes per 100,000 people: 673 (state: 199)
> Number of violent crimes in 2017: 745 (27.9% of state total)
> Poverty rate: 14.9% (state: 8.1%)
> Annual unemployment: 2.6% (state: 2.5%)
New Hampshire’s violent crime rate of 199 incidents per 100,000 people is among the lowest of any state in the country. Not all parts of the state are especially safe, however. In Manchester, there were 673 violent crimes for every 100,000 people in 2017, well above the national violent crime rate of 383 per 100,000. There were only 14 murders reported in New Hampshire in 2017. Two of them were committed in Manchester.
[in-text-ad-2]

New Jersey: Camden
> 2017 violent crimes per 100,000 people: 1,968 (state: 229)
> Number of violent crimes in 2017: 1,462 (7.1% of state total)
> Poverty rate: 37.4% (state: 10.7%)
> Annual unemployment: 8.9% (state: 4.1%)
Like several other Northeastern states, New Jersey is a low-crime state with some relatively dangerous cities. There were 229 violent crimes for every 100,000 people in New Jersey in 2017, well below the national violent crime rate of 383 per 100,000. In Camden, a small city just across the Delaware River from Philadelphia, violence is much more common. There were 1,968 violent crimes for every 100,000 people in Camden in 2017, by far the highest violent crime rate of any city in the state.
Crime is often concentrated in areas with limited economic opportunity. Camden’s 8.9% annual unemployment rate is the highest of any city in New Jersey and more than double the 4.1% state unemployment rate

New Mexico: Gallup
> 2017 violent crimes per 100,000 people: 1,543 (state: 783)
> Number of violent crimes in 2017: 352 (2.2% of state total)
> Poverty rate: 29.9% (state: 20.6%)
> Annual unemployment: . (state: 4.9%)
New Mexico has the worst state violent crime rate in the contiguous United States, at 783 incidents per 100,000 people. Several of the state’s major cities, including Albuquerque, have violent crime rates well in excess of 1,000 incidents per 100,000 people, but Gallup’s is the highest at 1,543 per 100,000. In total, there were 352 cases of murder, rape, assault, and robbery in the city in 2017, the fifth most of any U.S. city with a population under 25,000.
[in-text-ad]
New York: Newburgh Town
> 2017 violent crimes per 100,000 people: 1,236 (state: 357)
> Number of violent crimes in 2017: 24 (0.0% of state total)
> Poverty rate: 31.2% (state: 15.1%)
> Annual unemployment: 5.2% (state: 4.1%)
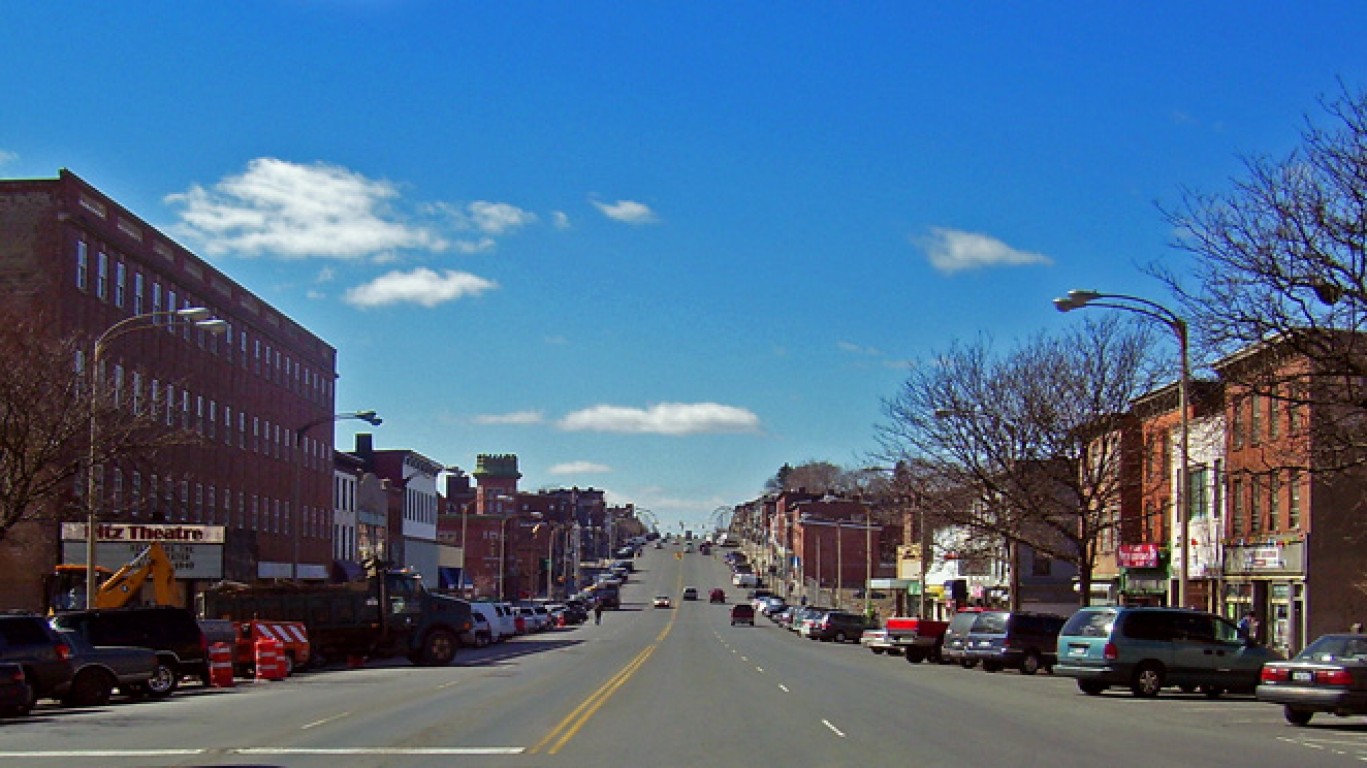
Newburgh, a small town about 60 miles north of Manhattan, has the highest violent crime rate in New York state. There were 1,236 violent crimes in Newburgh for every 100,000 people in 2017, more than triple the state violent crime rate of 357 per 100,000. Crime is often concentrated in lower-income areas, and in Newburgh, 31.2% of the population lives below the poverty line, more than double the poverty rate of 15.1% across the state.

North Carolina: N/A
> 2017 violent crimes per 100,000 people: N/A (state: 364)
> Number of violent crimes in 2017: N/A
> Poverty rate: (state: 16.1%)
> Annual unemployment: N/A (state: 3.9%)
Due to inconsistent reporting practices regarding incidents of rape, complete violent crime statistics are not available for cities in North Carolina. There were 591 reported homicides in North Carolina in 2017. Of them, about 15% were committed in Charlotte-Mecklenburg — the most populous city in the state. Across the state as a whole, aggravated assault is the most commonly reported violent crime, as it is nationwide. Of the 37,364 total violent crimes in North Carolina in 2017, 66.1% were aggravated assault.
North Dakota: Fargo
> 2017 violent crimes per 100,000 people: 403 (state: 281)
> Number of violent crimes in 2017: 497 (23.4% of state total)
> Poverty rate: 13.9% (state: 11.0%)
> Annual unemployment: 2.3% (state: 2.6%)
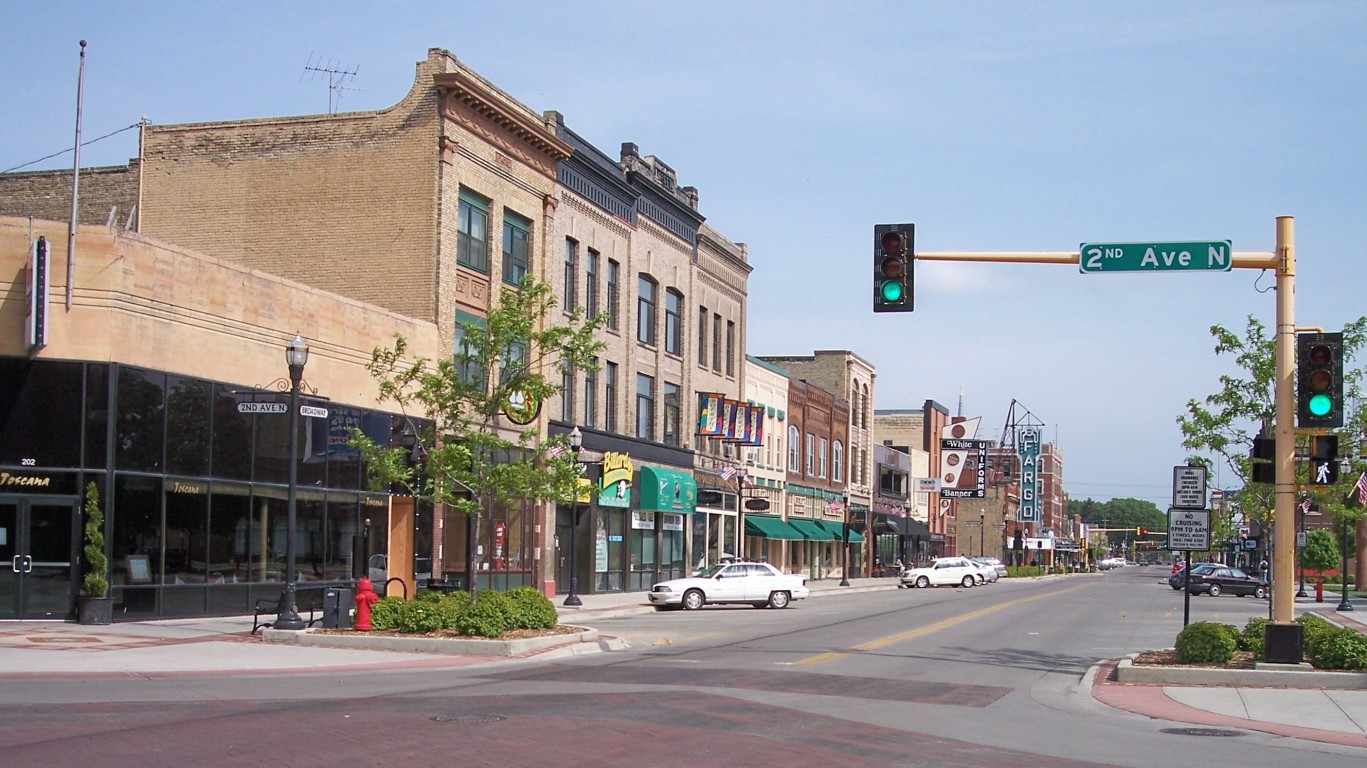
With a violent crime rate of 281 incidents per 100,000 people, North Dakota is one of the safest states in the country. Fargo, located in eastern North Dakota, is the only city in the state where violence is more common than it is nationwide. There were 403 violent crimes in Fargo for every 100,000 people in 2017, slightly higher than the national violent crime rate of 383 incidents per 100,000. As is the case nationwide, aggravated assault is the most commonly reported violent crime in Fargo.
[in-text-ad-2]

Ohio: Cleveland
> 2017 violent crimes per 100,000 people: 1,557 (state: 297)
> Number of violent crimes in 2017: 5,999 (17.3% of state total)
> Poverty rate: 35.2% (state: 14.9%)
> Annual unemployment: 6.5% (state: 4.6%)
Cleveland is by far the most dangerous city in Ohio. There were a total of 5,999 violent crimes reported in the city in 2017. Meanwhile, in Columbus, a city with a population more than double that of Cleveland, there were 4,478 crimes reported the same year. Cleveland’s violent crime rate of 1,557 incidents per 100,000 people is more than five times the violent crime rate of 297 per 100,000 statewide.
Crime is often concentrated in lower-income areas, and Cleveland is one of the poorest cities in the country. Cleveland’s 35.2% poverty rate is more than double the poverty rates of 14.9% statewide and 14.6% nationwide.
Oklahoma: Shawnee
> 2017 violent crimes per 100,000 people: 1,223 (state: 456)
> Number of violent crimes in 2017: 388 (2.2% of state total)
> Poverty rate: 21.1% (state: 16.2%)
> Annual unemployment: 3.9% (state: 3.4%)
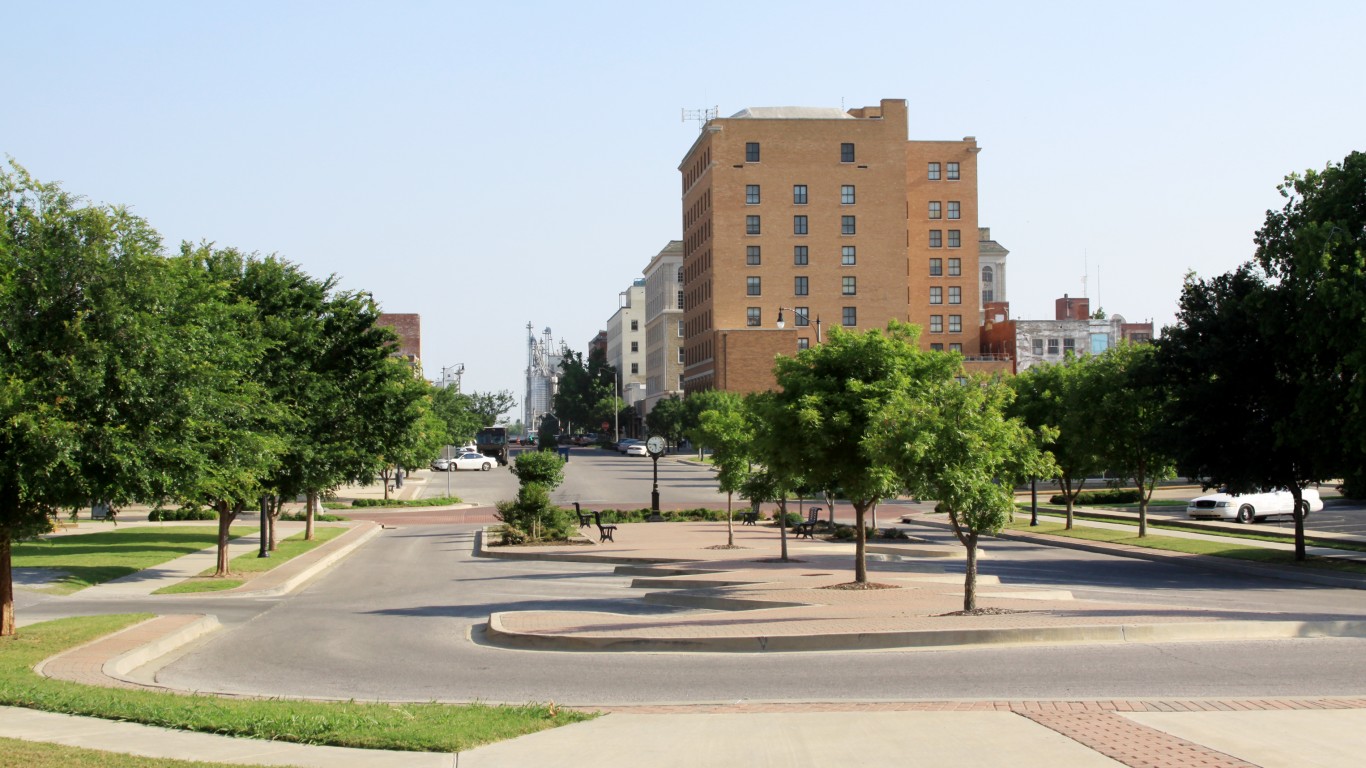
Oklahoma has three major cities with violent crime rates in excess of 1,000 incidents per 100,000 residents. All three — Tulsa, Muskogee, and Shawnee — are within 75 miles of each other in the eastern part of the state. Shawnee had the highest rate in 2017, at 1,223 reported violent crimes per 100,000 residents.
Low-income cities tend to have higher crime rates, and in Shawnee, the typical household has an annual income of $38,471, nearly $20,000 below the national median.
[in-text-ad]

Oregon: Portland
> 2017 violent crimes per 100,000 people: 516 (state: 282)
> Number of violent crimes in 2017: 3,349 (28.7% of state total)
> Poverty rate: 16.2% (state: 14.9%)
> Annual unemployment: 3.6% (state: 4.2%)
Oregon is a relatively safe state with a violent crime rate of 282 per 100,000. Portland, the most dangerous city in the state, is one of only a handful of Oregon cities where violence is more common than it is nationwide. There were 516 violent crimes for every 100,000 people in Portland in 2017, compared with a national violent crime rate of 383 per 100,000.
Portland is also the most populous city in the state. Of the 11,674 violent crimes reported in Oregon in 2017, 28.7% were committed in Portland.

Pennsylvania: McKeesport
> 2017 violent crimes per 100,000 people: 2,125 (state: 313)
> Number of violent crimes in 2017: 445 (1.1% of state total)
> Poverty rate: 33.1% (state: 13.1%)
> Annual unemployment: N/A (state: 4.3%)
McKeesport is by far the most dangerous city in Pennsylvania and one of the most dangerous cities in the United States. There were 2,125 violent crimes for every 100,000 people in McKeesport in 2017, nearly seven times the statewide violent crime rate and well above the violent crime rate of 1,610 per 100,000 in Chester, the second most dangerous city in the state.
Crime is often concentrated in lower-income areas, and McKeesport is one of the poorest cities in the country. The city’s 33.1% poverty rate is more than double the 13.1% state poverty rate and the 14.6% national rate.

Rhode Island: Providence
> 2017 violent crimes per 100,000 people: 534 (state: 232)
> Number of violent crimes in 2017: 960 (39.0% of state total)
> Poverty rate: 26.9% (state: 13.4%)
> Annual unemployment: 5.1% (state: 4.1%)
Providence, Rhode Island, has a rich history of crime of all kinds, largely due to the organized crime’s substantial presence in the city for decades. Today, the state capital and largest city continues to have the highest violent crime rate in Rhode Island. Although, its rate of 534 incidents per 100,000 residents is relatively low compared with most states’ most violent city.
[in-text-ad-2]
South Carolina: Myrtle Beach
> 2017 violent crimes per 100,000 people: 1,577 (state: 506)
> Number of violent crimes in 2017: 523 (2.1% of state total)
> Poverty rate: 23.8% (state: 16.6%)
> Annual unemployment: 4.8% (state: 3.4%)
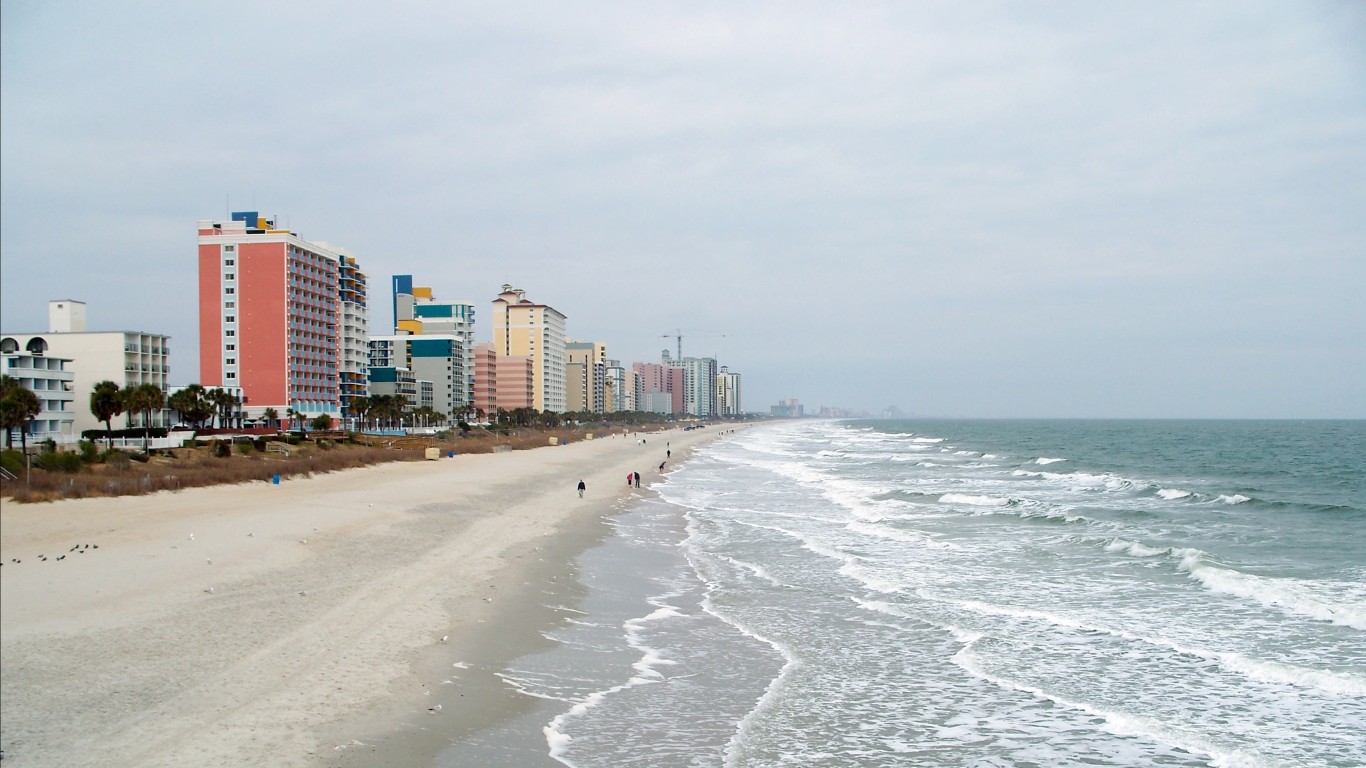
The violent crime rate of 1,577 incidents per 100,000 people in Myrtle Beach is the highest of any city in South Carolina and more than triple the violent crime rate of 506 per 100,000 across the state as a whole. In addition to violence, property crimes are also relatively common in Myrtle Beach. There were 13,058 property crimes like motor vehicle theft and burglary for every 100,000 people in the city in 2017, more than four times the property crime rate of 3,196 per 100,000 in South Carolina and the highest of any major U.S. city.

South Dakota: Rapid City
> 2017 violent crimes per 100,000 people: 640 (state: 434)
> Number of violent crimes in 2017: 480 (12.7% of state total)
> Poverty rate: 16.3% (state: 13.9%)
> Annual unemployment: 3.1% (state: 3.0%)
Rapid City is the most dangerous city in South Dakota. There were 640 violent crimes for every 100,000 residents in 2017, compared with the state violent crime rate of 434 per 100,000 and the national violent crime rate of 383 per 100,000. Though it is not the largest city in the state by population, Rapid City had more murders than any other South Dakota city in 2017. Of the 25 homicides reported in South Dakota in 2017, six were committed in Rapid City.
[in-text-ad]

Tennessee: Memphis
> 2017 violent crimes per 100,000 people: 2,003 (state: 652)
> Number of violent crimes in 2017: 13,077 (29.9% of state total)
> Poverty rate: 26.9% (state: 16.7%)
> Annual unemployment: 4.6% (state: 3.5%)
Tennessee is one of the most dangerous states in the country. There were 652 violent crimes for every 100,000 residents in 2017, compared with the national violent crime rate of 383 per 100,000. Tennessee’s violent crime rate is driven up largely by violence in Memphis, the most dangerous city in the state. Nearly 30% of the nearly 43,755 violent crimes in the state in 2017 were committed in Memphis. Memphis’s violent crime rate of 2,003 incidents per 100,000 people is nearly double the violent crime rate of 1,138 per 100,000 in Nashville, the state’s second most dangerous city.

Texas: Texarkana
> 2017 violent crimes per 100,000 people: 1,262 (state: 439)
> Number of violent crimes in 2017: 478 (0.4% of state total)
> Poverty rate: 24.9% (state: 16.0%)
> Annual unemployment: 4.9% (state: 3.9%)
Along with Houston and Beaumont, Texarkana is one of only three Texas cities with a violent crime rate of over 1,000 incidents per 100,000 people. Texarkana’s violent crime rate of 1,262 per 100,000 is the highest in the state — nearly triple the 439 per 100,000 state violent crime rate. Crime rates are often higher in poor areas. In Texarkana, about one in every four residents live below the poverty line, well above the 16.0% state poverty rate.

Utah: South Salt Lake
> 2017 violent crimes per 100,000 people: 947 (state: 239)
> Number of violent crimes in 2017: 235 (3.2% of state total)
> Poverty rate: 22.5% (state: 11.0%)
> Annual unemployment: N/A (state: 3.1%)
Utah’s violent crime rate is relatively low, but the violent crime rate in South Salt Lake was nearly two and a half times the national violent crime rate. The city’s high rate of sexual assault is particularly troubling. In 2017, there were 44 reported rapes in the city. Per capita, the city had the sixth highest rate of rape of any U.S. city with a population of at least 20,000.
[in-text-ad-2]
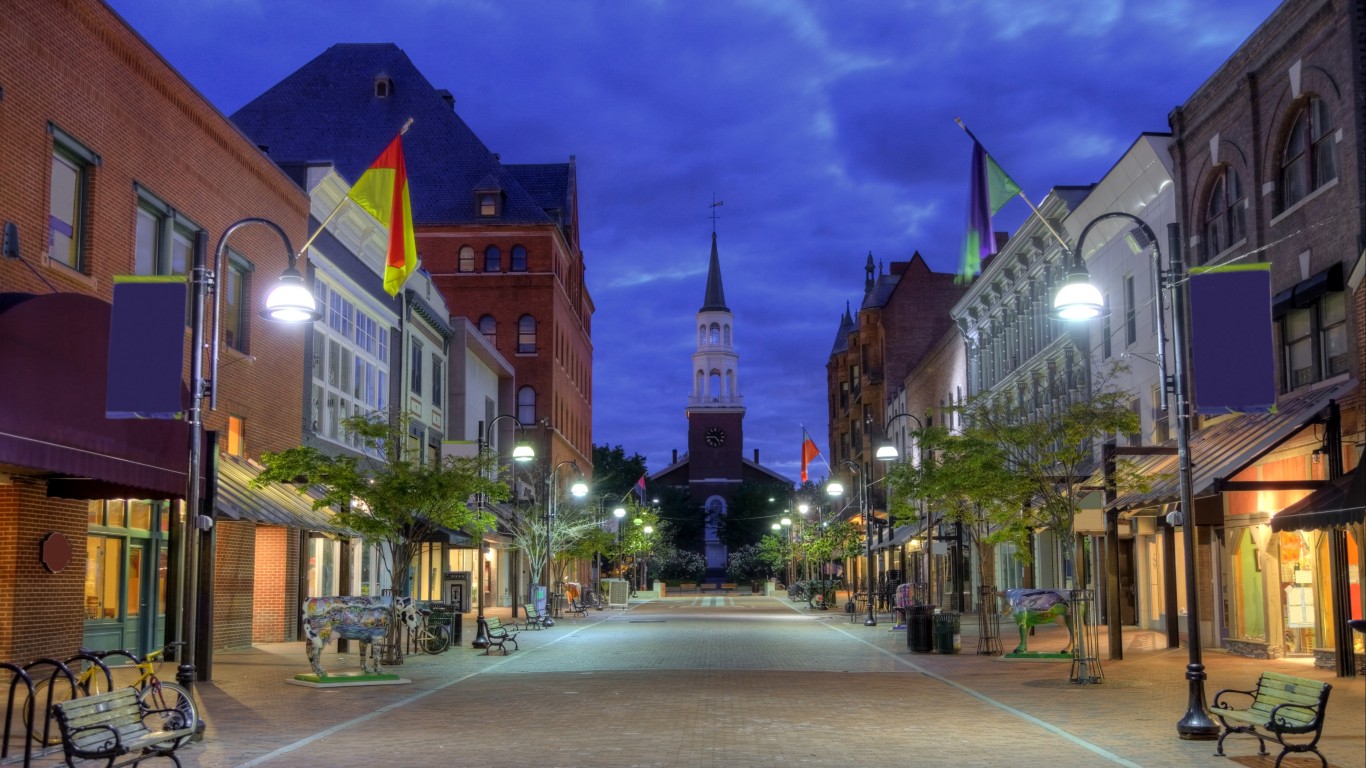
Vermont: Burlington
> 2017 violent crimes per 100,000 people: 313 (state: 166)
> Number of violent crimes in 2017: 132 (12.8% of state total)
> Poverty rate: 24.4% (state: 11.4%)
> Annual unemployment: 2.3% (state: 2.7%)
With a violent crime rate of just 166 incidents per 100,000 people, Vermont is one of the safest states in the country. Even in Burlington, the most dangerous city in the state, violence is less common than it is nationwide. There were just 313 violent crimes reported in Burlington for every 100,000 people in 2017, well below the national rate of 383 per 100,000.
Violence tends to be less common in areas with high levels of economic opportunity. In Burlington, just 2.3% of the labor force was unemployed in 2018 compared with a national unemployment rate of 3.9%.
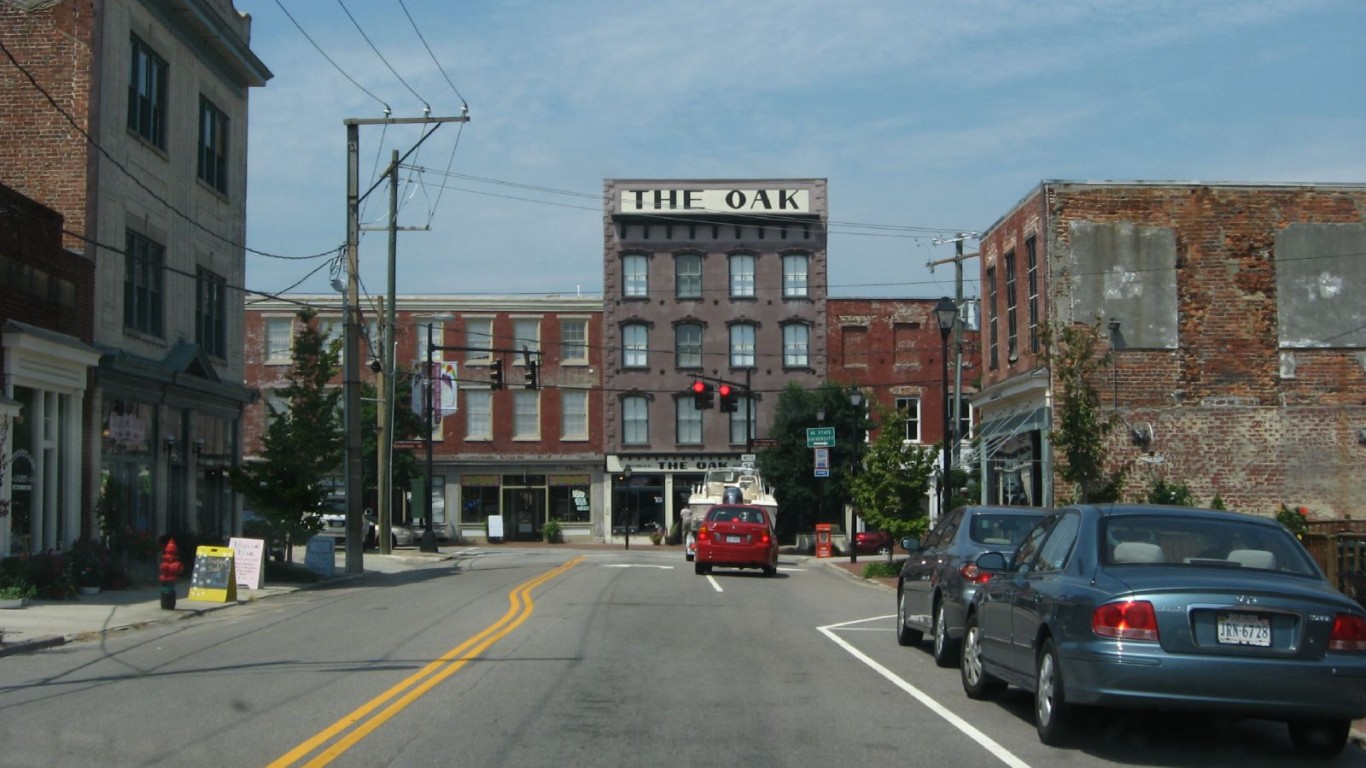
Virginia: Petersburg
> 2017 violent crimes per 100,000 people: 794 (state: 208)
> Number of violent crimes in 2017: 252 (1.4% of state total)
> Poverty rate: 27.6% (state: 11.2%)
> Annual unemployment: 6.1% (state: 3.0%)
While the relationship between crime and economic conditions is complicated, some evidence suggests that there is a direct connection between unemployment and crime. Petersburg, Virginia’s most violent major city, has an annual unemployment rate of 6.1%, well above the national 2018 rate of 3.9%, and the highest jobless rate among Virginia’s 24 cities with a population of 20,000 or more.
[in-text-ad]

Washington: Tacoma
> 2017 violent crimes per 100,000 people: 814 (state: 304)
> Number of violent crimes in 2017: 1,737 (7.7% of state total)
> Poverty rate: 17.0% (state: 12.2%)
> Annual unemployment: 5.5% (state: 4.5%)
Tacoma is a city of about 213,000 people just south of Seattle. There were 814 violent crimes for every 100,000 people in Tacoma in 2017, more than double the violent crime rate of 304 per 100,000 across Washington as a whole. As is the case nationwide, aggravated assault is the most commonly reported violent crime in Tacoma. In Seattle, the most populous city in the state, the violent crime rate is also relatively high, at 633 incidents per 100,000 people.
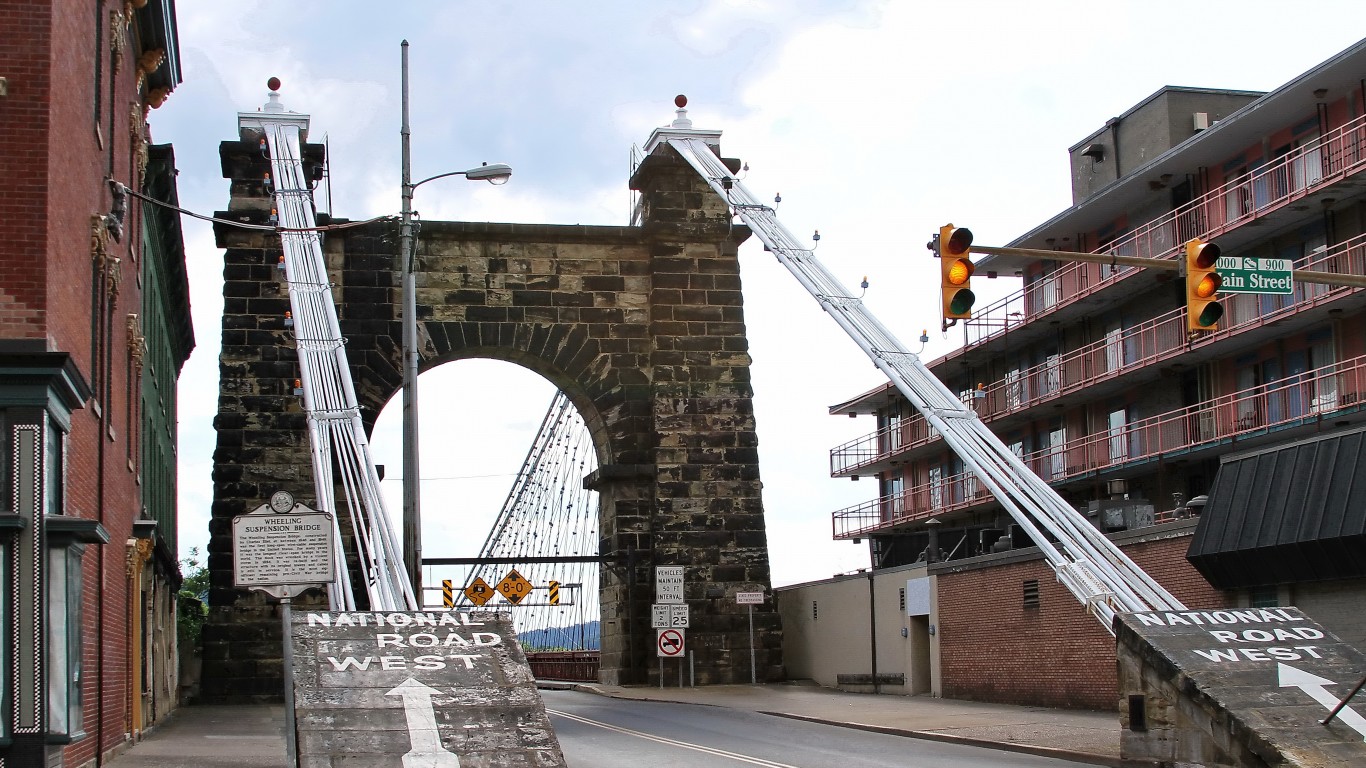
West Virginia: Wheeling
> 2017 violent crimes per 100,000 people: 1,221 (state: 351)
> Number of violent crimes in 2017: 332 (5.2% of state total)
> Poverty rate: 15.5% (state: 17.8%)
> Annual unemployment: 4.9% (state: 5.3%)
Wheeling is one of West Virginia’s northernmost cities, approximately 45 miles southwest of Pittsburgh. There were 332 reported incidents of violent crime in 2017, or 1,221 violent crimes per 100,000 people, more than three times the national rate and the highest among cities in the state with a population of 20,000 or more. While the city’s violent crime rate is high, its property crime rate of 2,147 incidents per 100,000 people is below the national property crime rate.

Wisconsin: Milwaukee
> 2017 violent crimes per 100,000 people: 1,597 (state: 320)
> Number of violent crimes in 2017: 9,507 (51.3% of state total)
> Poverty rate: 27.4% (state: 12.3%)
> Annual unemployment: 4.0% (state: 3.0%)
With over 2,900 reported cases of robbery in 2018, Milwaukee nudged the state’s robbery rate alone to 490 incidents per 100,000 people, over five times the national robbery rate. The city’s high robbery rate contributes to its overall violent crime rate, which is the highest in the state and 20th highest among major cities nationwide. Milwaukee’s 1,597 incidents of violent crime per 100,000 people in 2017 was more than double that of any other city in Wisconsin.
[in-text-ad-2]

Wyoming: Rock Springs
> 2017 violent crimes per 100,000 people: 465 (state: 238)
> Number of violent crimes in 2017: 111 (8.1% of state total)
> Poverty rate: 11.8% (state: 11.1%)
> Annual unemployment: N/A (state: 4.1%)
Wyoming has the 10th lowest violent crime rate in the country, at 238 reported incidents per 100,000 people, compared with a national violent crime rate of 383 incidents per 100,000. The city with the highest violent crime rate in the state, Rock Springs, has a violent crime rate of 465 incidents per 100,000 people, not much higher than the national rate. In each of the remaining four cities in Wyoming tracked by the FBI, the violent crime rate is below the national rate.
Start by taking a quick retirement quiz from SmartAsset that will match you with up to 3 financial advisors that serve your area and beyond in 5 minutes, or less.
Each advisor has been vetted by SmartAsset and is held to a fiduciary standard to act in your best interests.
Here’s how it works:
1. Answer SmartAsset advisor match quiz
2. Review your pre-screened matches at your leisure. Check out the advisors’ profiles.
3. Speak with advisors at no cost to you. Have an introductory call on the phone or introduction in person and choose whom to work with in the future
Thank you for reading! Have some feedback for us?
Contact the 24/7 Wall St. editorial team.