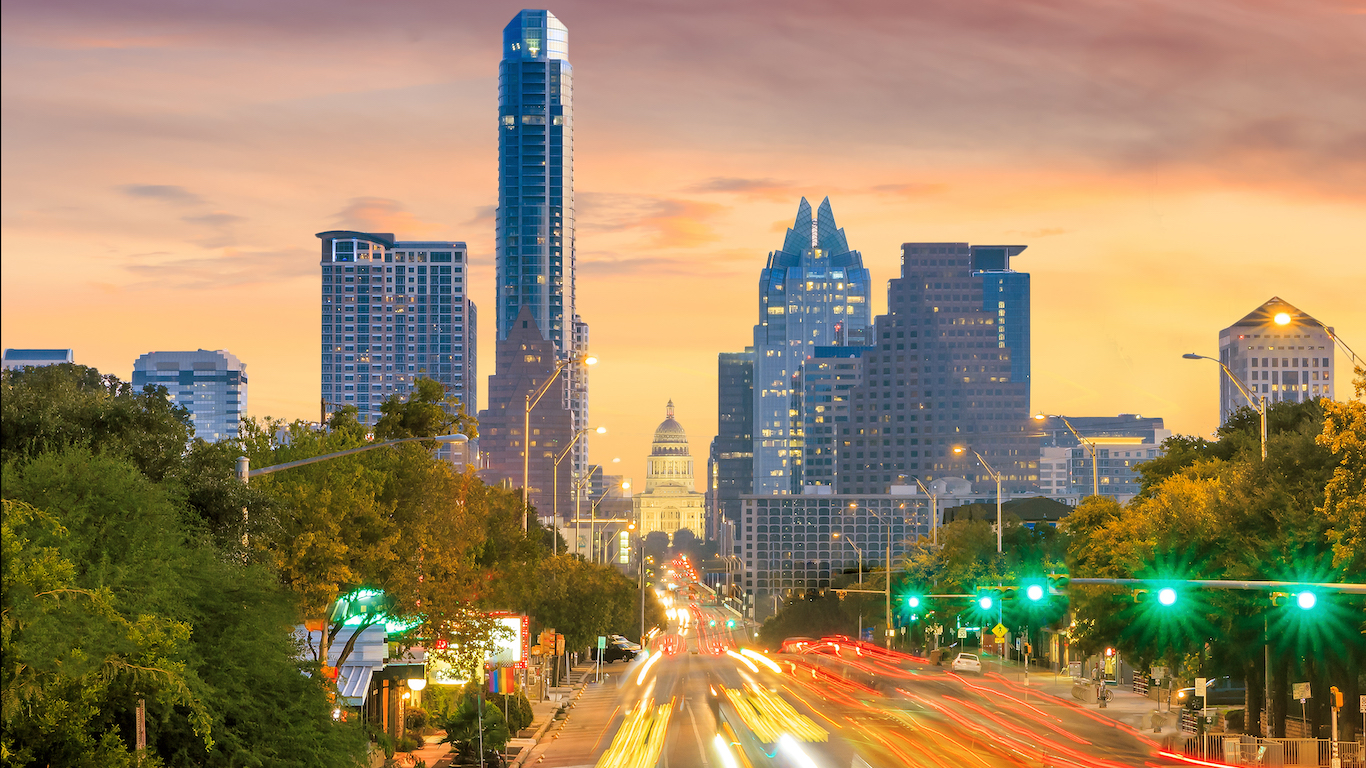
U.S. population growth hit an 80-year low of 0.6% year-over-year in 2018. The slowdown in growth — an already familiar phenomenon in some of the world’s most economically advanced countries — is largely attributable to a declining birthrate.
Slowing population growth is a national phenomenon, however some American cities are bucking broader trend — growing at an annual rate more than triple the comparable U.S. growth rate.
24/7 Wall St. reviewed population change from July 1, 2010 to July 1, 2018 in all U.S. metropolitan areas to identify the fastest growing metro areas in the United States.
While the reasons people move to an area boil down to independent decisions, conditions in many cities on this list offer some more general answers as to why an area might be more attractive than others.
While the aging U.S. population is leading to slowing population growth nationwide, in many of the cities on this list — particularly those in the Sun Belt — inbound migration of retirement-age Americans is largely driving growth. Indeed, climate is often the most important factor for older Americans who decide to relocate, and some of these cities rank among those with the best weather.
Not all cities on this list are retirement destinations. A healthy economy and strong job market can make any city appealing to potential new residents and those looking to start families. In all but four cities on this list, the annual unemployment rate is lower than or equal to the 3.9% national rate. Several of these cities have booming job markets, adding jobs at a faster rate than any other city in their state.
Click here to see America’s fastest growing cities
To determine the fastest growing U.S. cities, 24/7 Wall St. reviewed population change between July 2010 and July 2018 (the latest available data) in every U.S. metro area with data from the U.S. Census Bureau’s Population Estimates Program. Figures on each component of population growth — births, deaths, and international and domestic migration — also came from this report and are from April 2010 to July 2018. Employment change between 2010 and 2018 came from the Bureau of Labor Statistics’ Quarterly Census of Employment and Wages. 2018 unemployment rates came from the Bureau of Labor Statistics’ Local Area Unemployment Statistics. Median household income, poverty rate, SNAP recipiency rate, and demographic data are five-year averages from the U.S. Census Bureau’s 2017 American Community Survey.

25. Fort Collins, CO
> 2010-2018 pop. growth: +16.7% (50,068)
> 2018 unemployment: 3.1%
> 2010-2018 employment change: +24.6% (+31,121)
> Median household income: $64,980
Colorado is one of the fastest growing states in the country by population. In the last eight years, the state’s population ballooned by 12.8%. Due to both a faster natural growth rate — more births than deaths — and positive net migration, the northern Colorado city of Fort Collins is growing even faster. Between 2010 and 2018, the number of people living in Fort Collins climbed by over 50,000, a 16.7% population increase.
[in-text-ad]
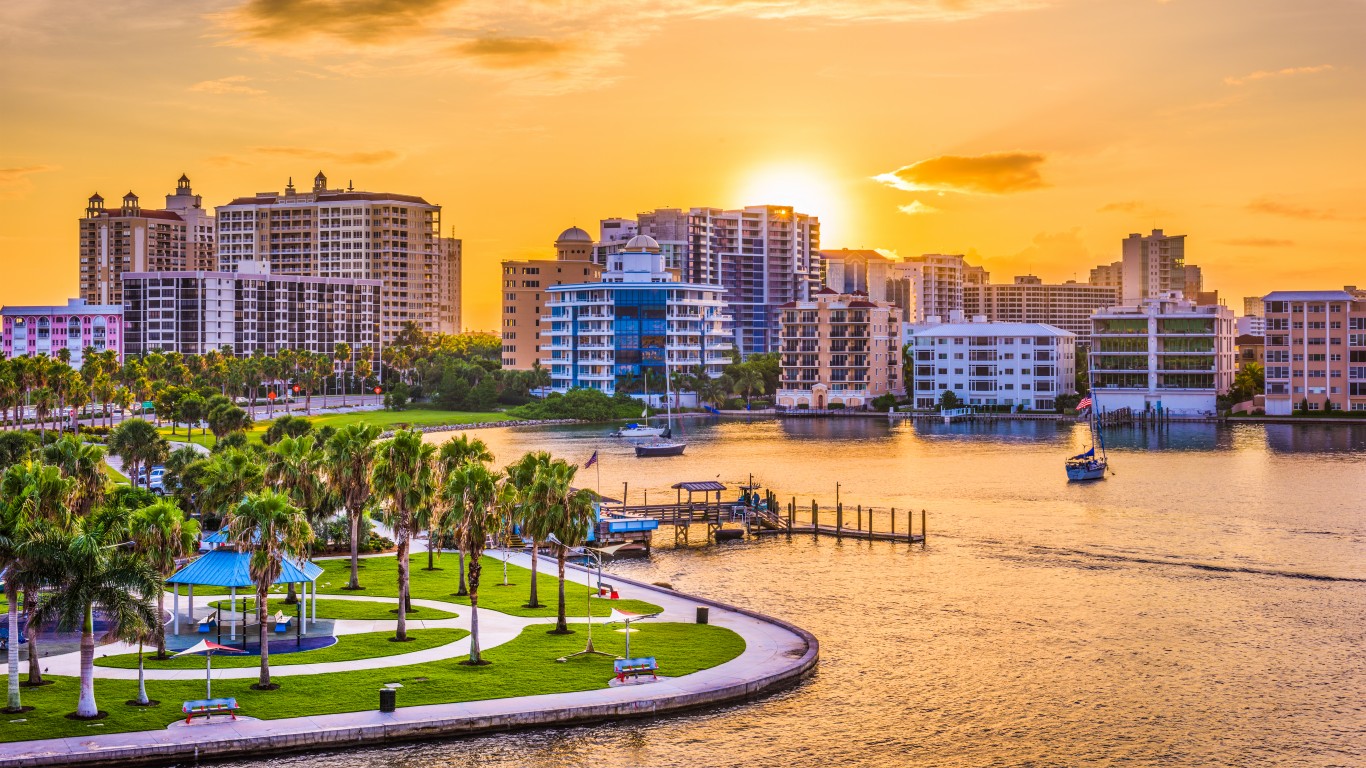
24. North Port-Sarasota-Bradenton, FL
> 2010-2018 pop. growth: +16.8% (118,209)
> 2018 unemployment: 3.3%
> 2010-2018 employment change: +23.2% (+54,113)
> Median household income: $54,473
The North Port-Sarasota-Bradenton metro area is one of only a handful on this list where the number of deaths outnumbered the number of births over the last eight years. Still, enough new residents moved to the metro area than moved out that its population expanded by 16.8% between 2010 and 2018. Sarasota is one of seven Florida metro areas to rank on this list. As the U.S. population ages, retirement age Americans are flocking to warmer climates in the Sun Belt. Over 30% of the metro area residents are age 65 and older, more than double the 14.9% share of Americans.
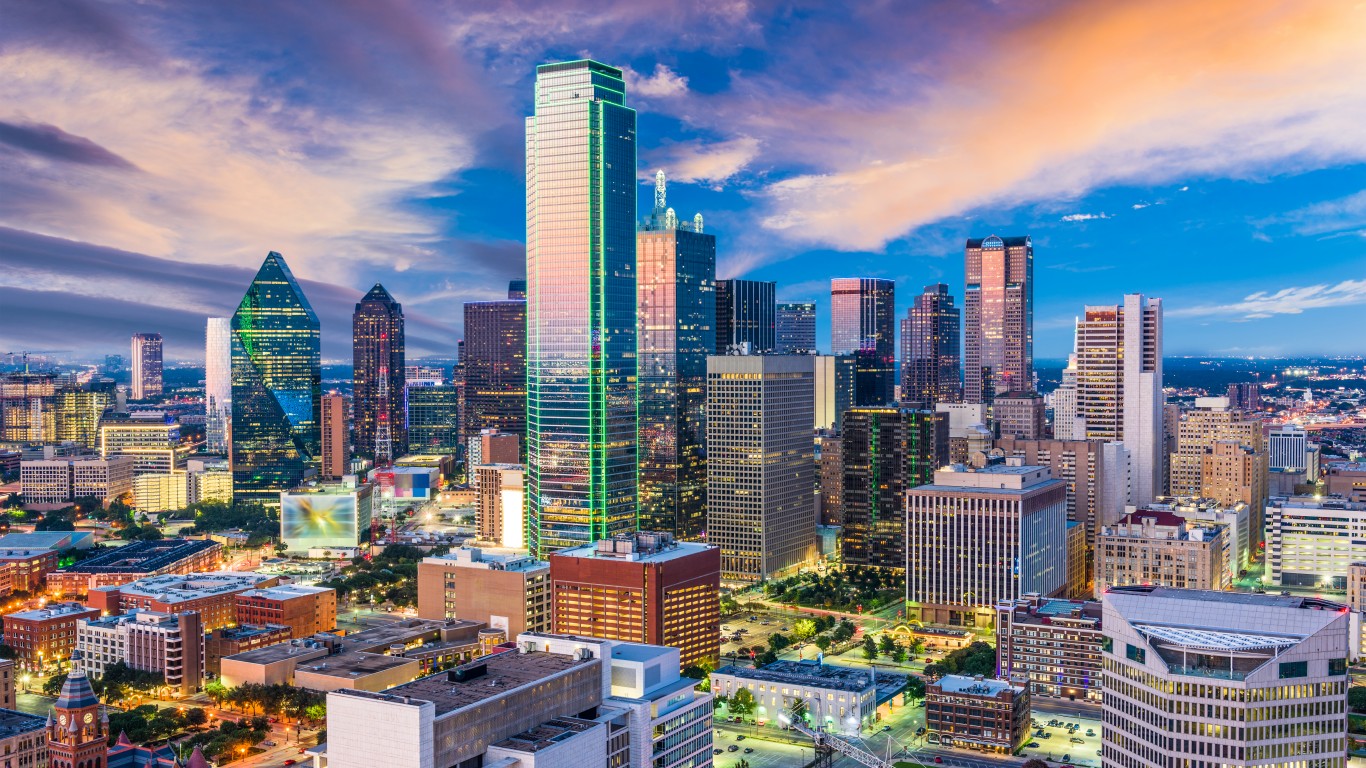
23. Dallas-Fort Worth-Arlington, TX
> 2010-2018 pop. growth: +16.9% (1.1 million)
> 2018 unemployment: 3.6%
> 2010-2018 employment change: +23.1% (+647,463)
> Median household income: $63,870
There are over a million more people living in the Dallas-Fort Worth metro area today than there were as recently as 2010. There were over 400,000 more births than deaths and over 600,000 more people moved to the metro area than left over the last eight years, contributing to a 16.9% population growth.
Cities with strong economies are more attractive to potential new residents and young families. The Dallas metro area added nearly 650,000 new jobs since 2010, and just 3.6% of metro area workers are unemployed, below the 3.9% national unemployment rate.

22. San Antonio-New Braunfels, TX
> 2010-2018 pop. growth: +17.0% (364,998)
> 2018 unemployment: 3.4%
> 2010-2018 employment change: +20.6% (+170,621)
> Median household income: $56,495
Texas is one of the fastest growing states in the country by population. The Lone Star State’s population growth rate of 13.7% in the last eight years was more than double the 5.8% national population growth rate.
San Antonio-New Braunfels is one of half a dozen Texas metro areas to rank among America’s fastest growing cities. Due both to natural increase — the number of births less the number of deaths — and migration, there are about 365,000 more people living in San Antonio-New Braunfels than there were in 2010, a 17.0% increase.
[in-text-ad-2]
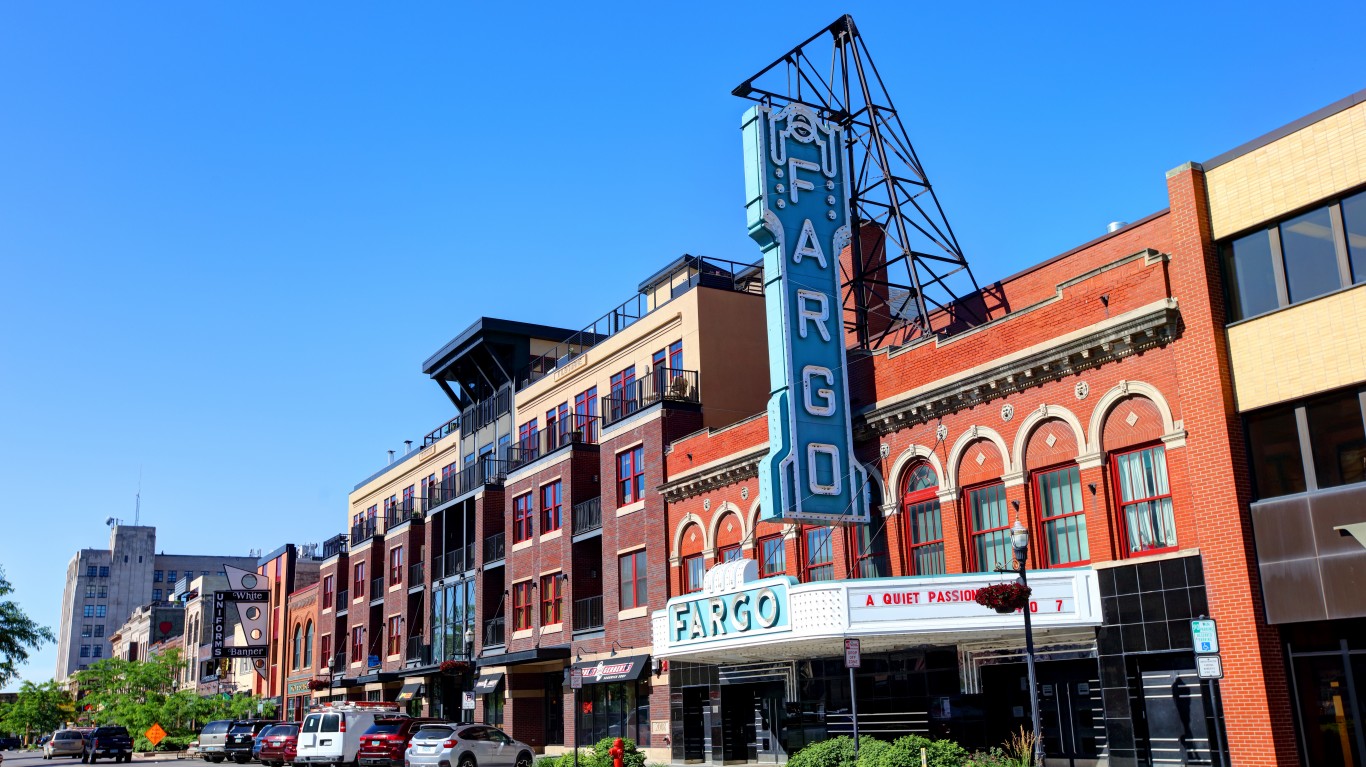
21. Fargo, ND-MN
> 2010-2018 pop. growth: +17.2% (36,021)
> 2018 unemployment: 2.9%
> 2010-2018 employment change: +16.1% (+18,946)
> Median household income: $59,074
Fargo is the only metro area in the Midwest to rank among the fastest growing cities in the United States. Due to both a greater number of births than deaths and a net influx of over 20,000 new residents, Fargo is now home to over 36,000 more residents than it was eight years ago, a 17.2% population growth.
Job growth has more or less kept pace with the growing population. There are 16.1% more jobs in Fargo today than there were in 2010, and the metro area’s 2.9% unemployment rate is considerably lower than the 3.9% national unemployment rate.
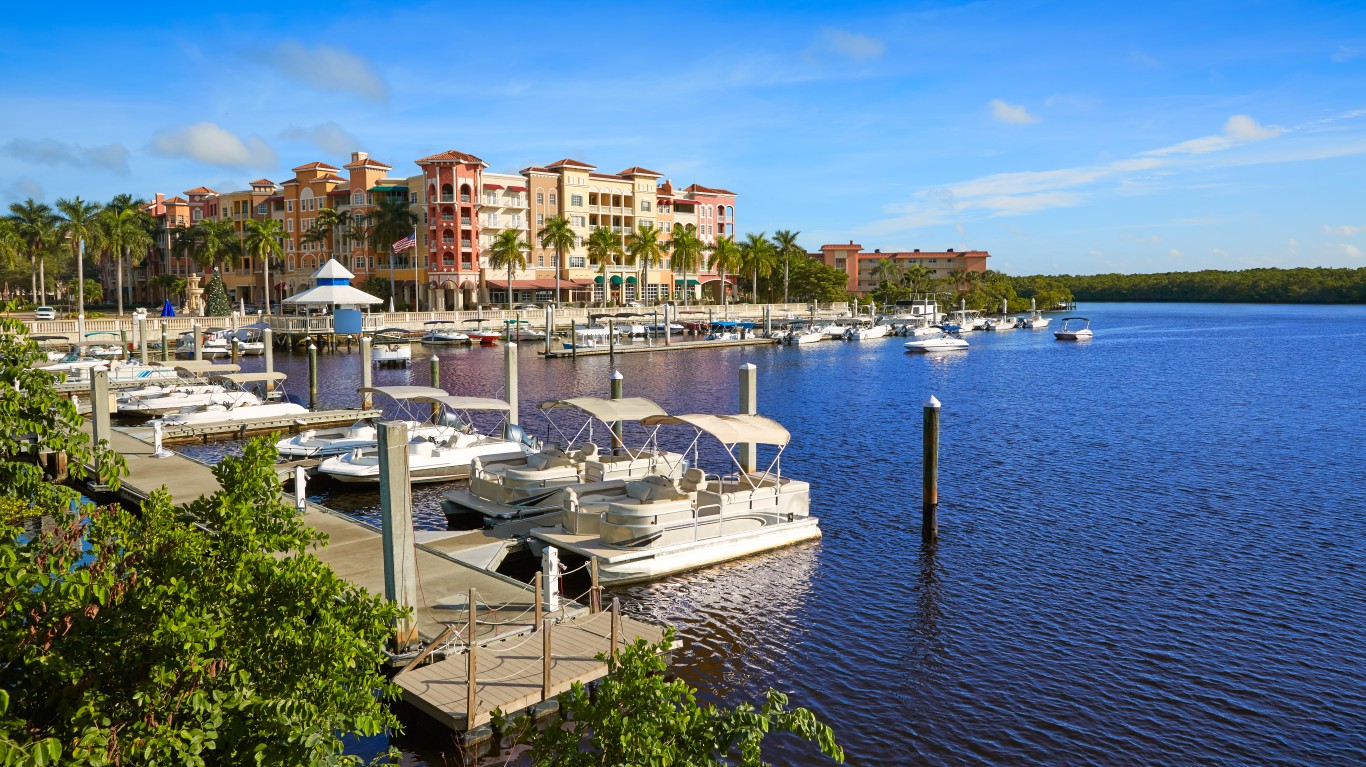
20. Naples-Immokalee-Marco Island, FL
> 2010-2018 pop. growth: +17.3% (55,893)
> 2018 unemployment: 3.1%
> 2010-2018 employment change: +27.9% (+31,148)
> Median household income: $62,407
With a net addition of nearly 56,000 new residents over the last eight years, Naples is the sixth fastest growing metro area in Florida and the 20th fastest growing nationwide. The bulk of the metro area’s 17.3% population growth came through net migration, as over 50,000 more people moved to the metro area than left in the last eight years.
As the U.S. population ages, metro areas like Naples are popular destinations for retired Americans. In Naples, 30.2% of the population are 65 or older, more than double the 14.9% share of the total U.S. population.
[in-text-ad]
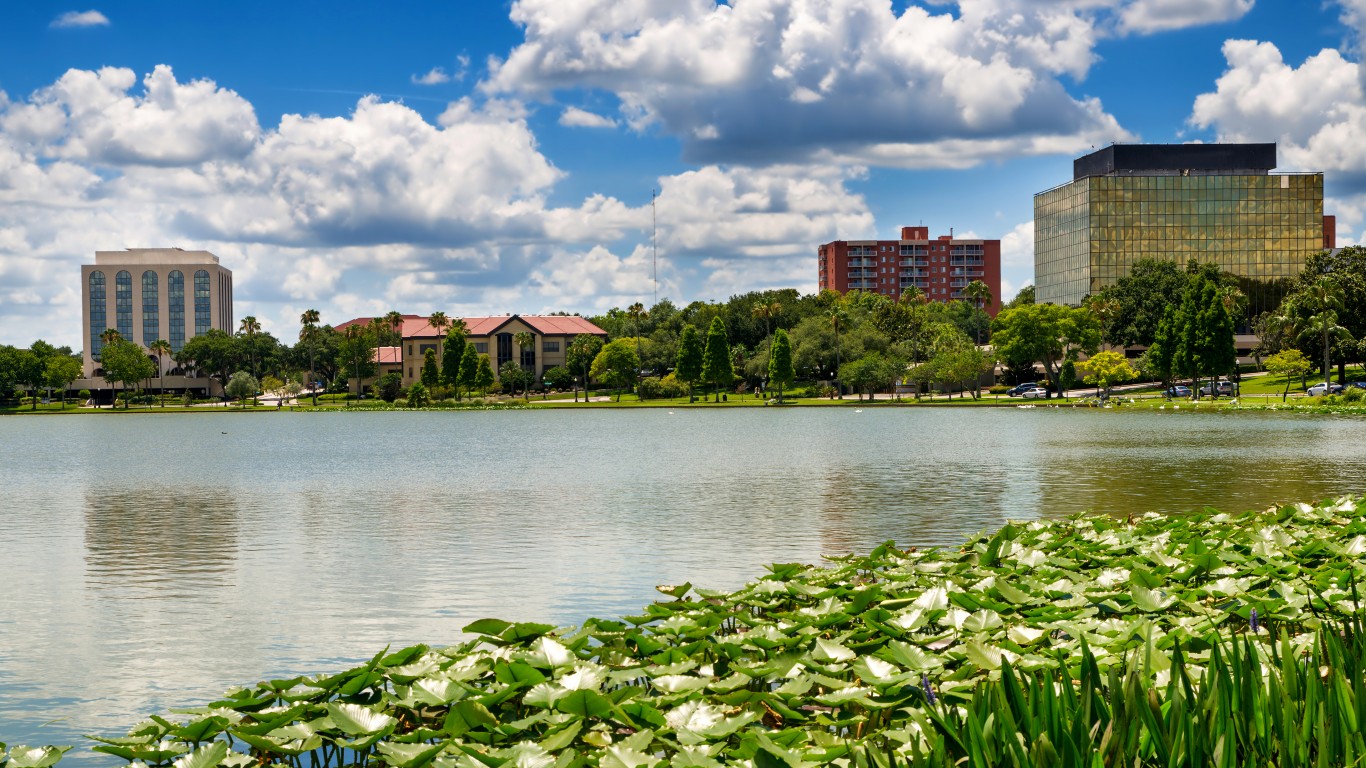
19. Lakeland-Winter Haven, FL
> 2010-2018 pop. growth: +17.4% (104,881)
> 2018 unemployment: 3.9%
> 2010-2018 employment change: +13.5% (+25,570)
> Median household income: $45,988
Due mostly to new residents moving in, there are nearly 105,000 more people living in Florida’s Lakeland-Winter Haven metro area now than there were in 2010. The metro area has much in common with other fast growing metro areas, including a warm climate, strong job growth, and relatively safe streets. The violent crime rate in the Lakeland metro area is just 285 incidents per 100,000 residents, well below the national violent crime rate 383 incidents per 100,000.
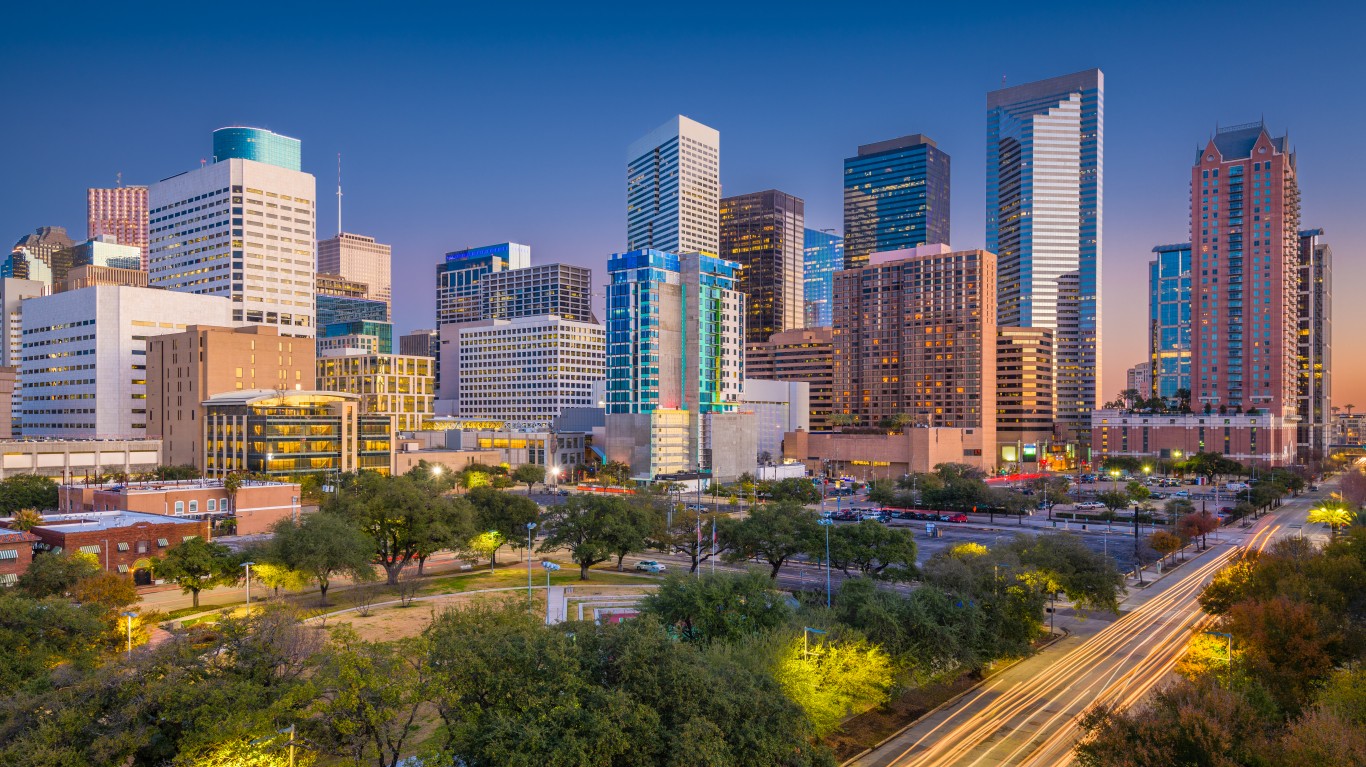
18. Houston-The Woodlands-Sugar Land, TX
> 2010-2018 pop. growth: +17.7% (1.0 million)
> 2018 unemployment: 4.2%
> 2010-2018 employment change: +17.1% (+423,166)
> Median household income: $62,922
Along with Dallas-Fort Worth, Houston is one of only two metro areas now home to over a million more people than compared to 2010. Largely due to the population growth, the Houston metro area is now the fifth most populous metro area in the country, up from the sixth most populous in 2010.
The metro area’s staggering 17.7% population growth since 2010 is due primarily to new residents moving in from other parts of the country and the world, but also in no small part to a births out numbering deaths.
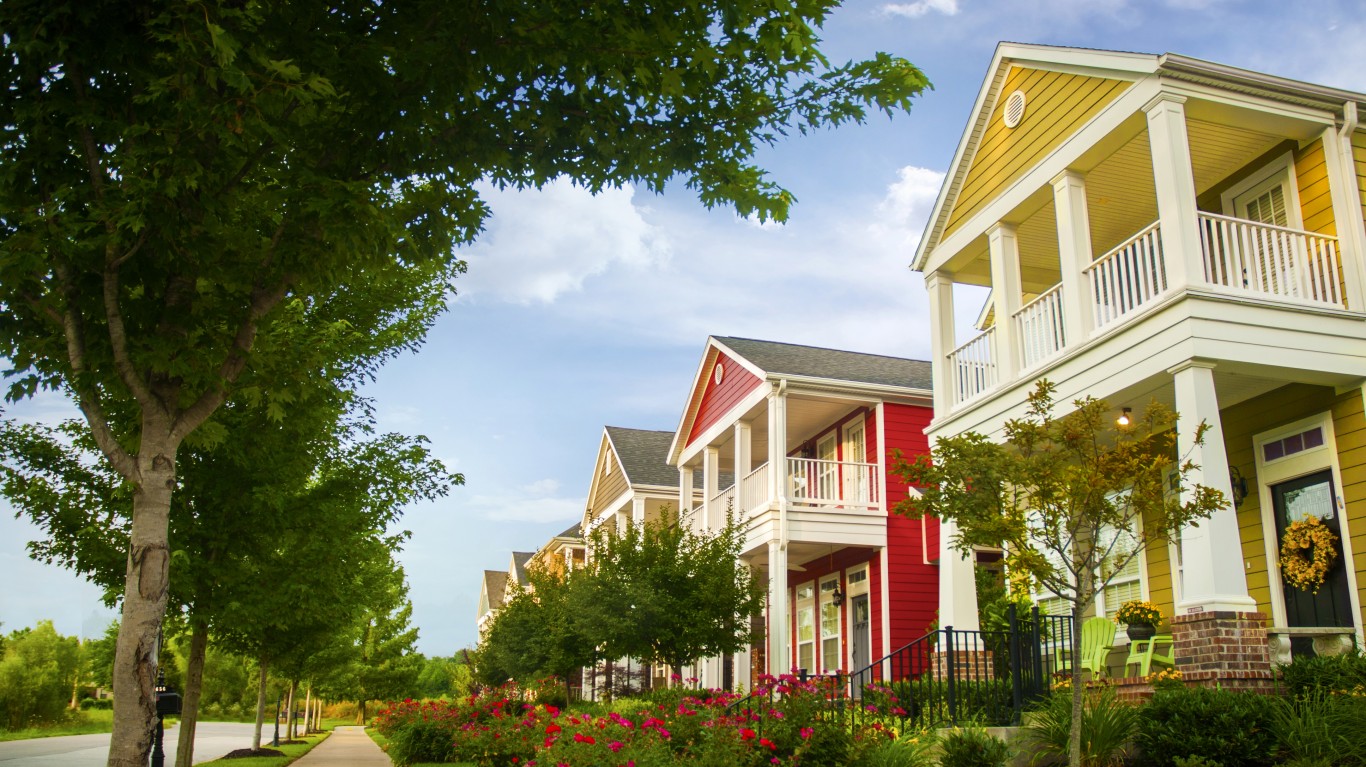
17. Fayetteville-Springdale-Rogers, AR-MO
> 2010-2018 pop. growth: +18.0% (83,754)
> 2018 unemployment: 3.1%
> 2010-2018 employment change: +22.3% (+42,537)
> Median household income: $52,551
Arkansas is not an especially fast growing state in terms of population, and Fayetteville is the only metro area in the state to rank among the fastest growing cities in the country. Over the last eight years, the metro area’s population grew by 18.0%, well above both the 5.8% national population growth and the 3.1% statewide population growth. Population growth in the Fayetteville metro area is attributable to both births outnumbering deaths and more people moving in than moving out.
[in-text-ad-2]
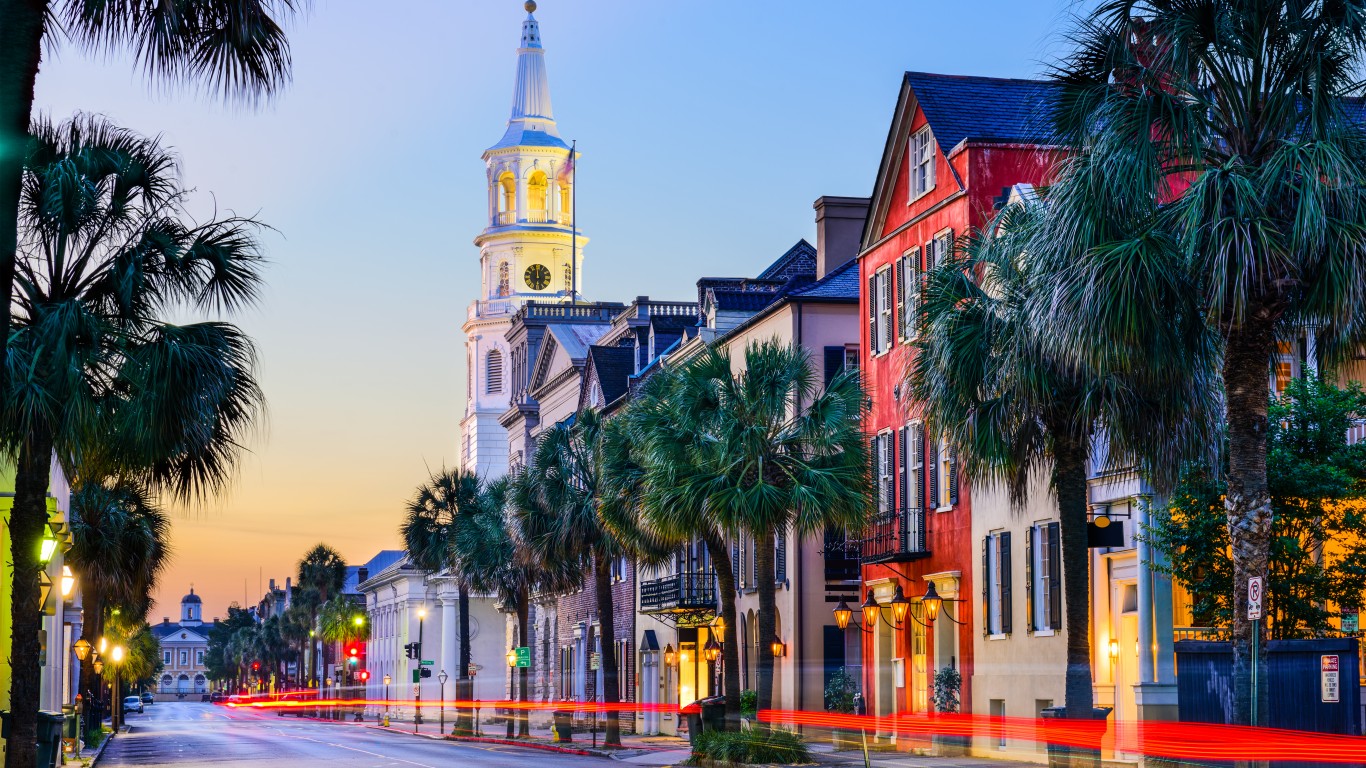
16. Charleston-North Charleston, SC
> 2010-2018 pop. growth: +18.0% (120,203)
> 2018 unemployment: 2.8%
> 2010-2018 employment change: +23.1% (+62,046)
> Median household income: $57,666
Nearly 90,000 more people moved to the Charleston metro area than left between 2010 and 2018. Including the natural population change — number of births less the number of deaths — the metro area’s population grew by 18.0% over the last eight years, the second largest growth of any South Carolina metro area and the 16th largest nationwide.
Americans often move for job or career opportunities, and the number of jobs in the Charleston metro area increased by 23.1% in the last eight years, nearly double the U.S. rate. Currently, just 2.8% of the metro area’s labor force is unemployed, compared to a 3.9% U.S. unemployment rate.
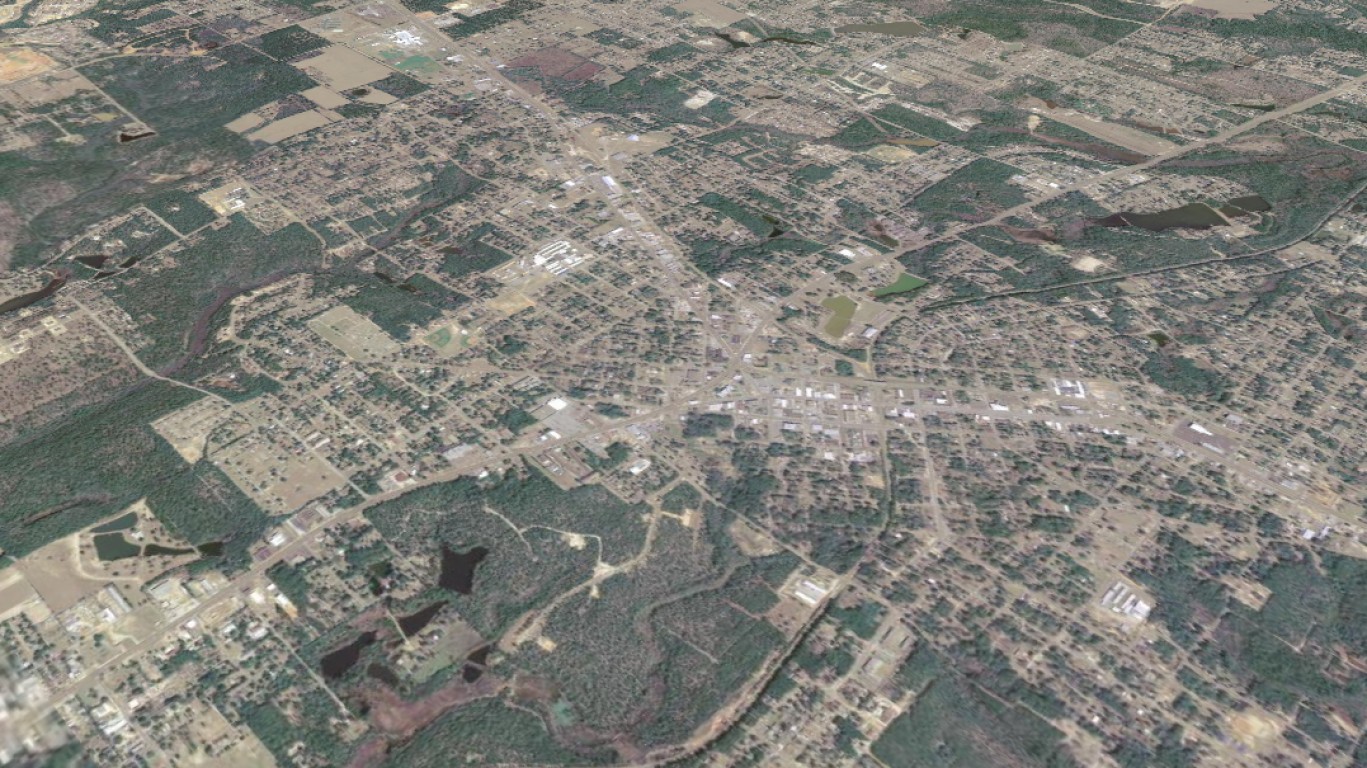
15. Crestview-Fort Walton Beach-Destin, FL
> 2010-2018 pop. growth: +18.1% (42,718)
> 2018 unemployment: 3.0%
> 2010-2018 employment change: +45.3% (+33,773)
> Median household income: $57,421
Crestview-Fort Walton Beach-Destin is a metro area of just under 300,000 in Florida’s panhandle. In the last eight years, the metro area’s population grew by 18.1%, well above Florida’s 13.0% growth rate and the U.S. 5.8% population growth over the same period. As is often the case in rapidly growing metro area, a natural population growth partially contributed to population growth in Crestview, but the change was primarily attributable to positive net migration.
[in-text-ad]
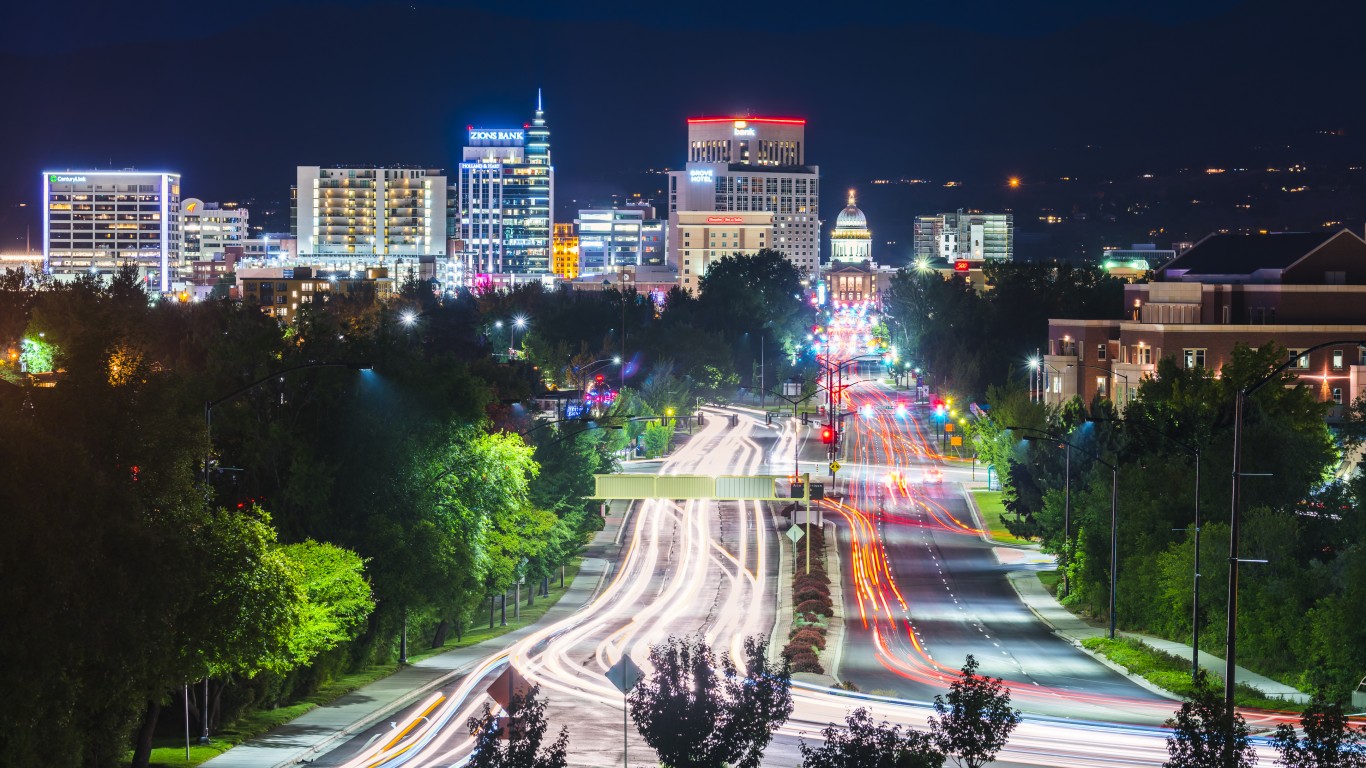
14. Boise City, ID
> 2010-2018 pop. growth: +18.2% (112,557)
> 2018 unemployment: 3.3%
> 2010-2018 employment change: +22.1% (+55,335)
> Median household income: $54,120
Boise City is the only metro area in Idaho and one of only four in the Western United States to rank on this list. Boise City is now home to 112,557 more people compared to eight years ago, an 18.2% population growth. Boise’s job market has also surged over the same period, with employment climbing 22.1% since 2010 and a metro area annual unemployment rate of 3.3%. Nationwide, employment grew by 12.5% in the last eight years and 3.9% of the labor force is unemployed.

13. Odessa, TX
> 2010-2018 pop. growth: +18.3% (25,041)
> 2018 unemployment: 2.7%
> 2010-2018 employment change: +19.8% (+11,722)
> Median household income: $59,528
Odessa, Texas, gained a net of over 25,000 more residents since 2010. The 18.3% eight-year population growth was the third largest in Texas and the 13th largest nationwide over that period. Unlike most cities on this list that grew primarily due to new residents moving in, the bulk of Odessa’s growth was attributable to natural change. Though positive net migration also contributed, there were over 13,000 more births than deaths in the west Texas metro area since 2010.
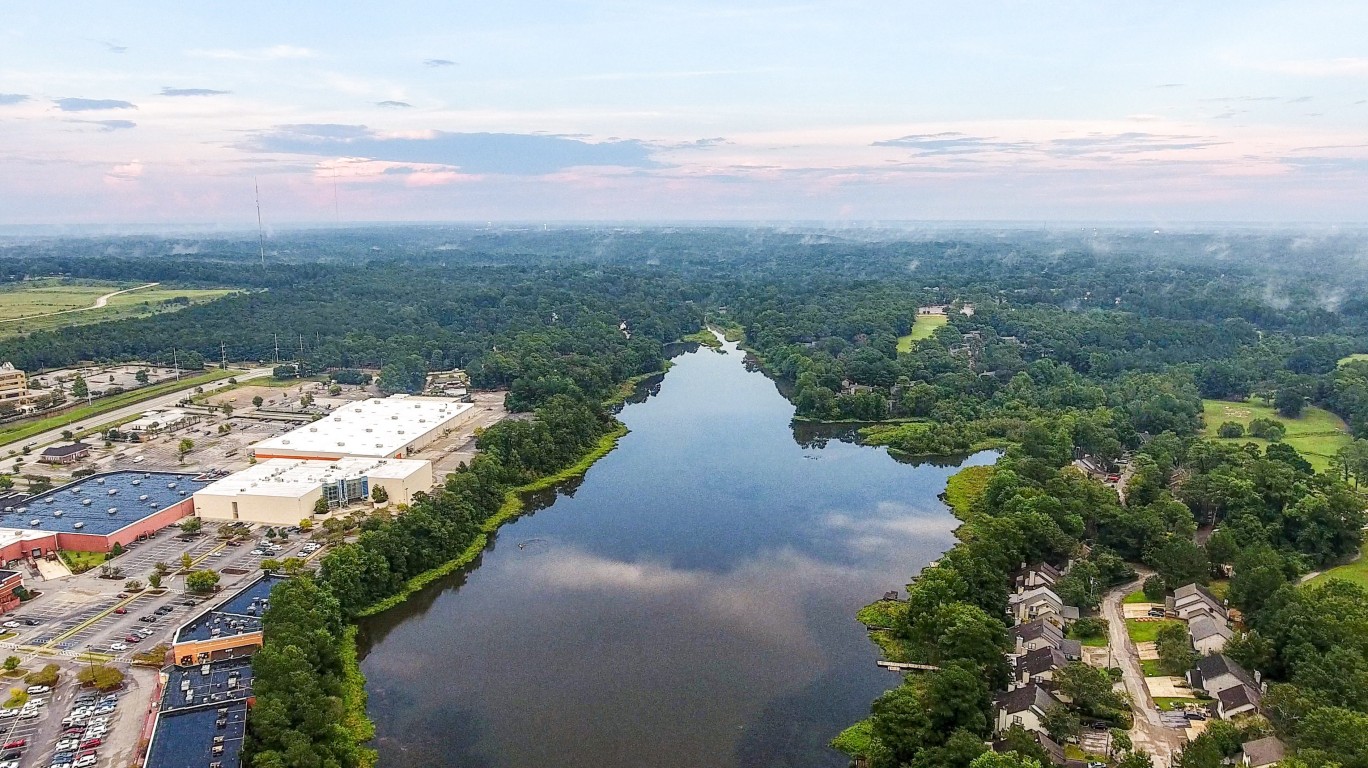
12. Daphne-Fairhope-Foley, AL
> 2010-2018 pop. growth: +19.1% (34,911)
> 2018 unemployment: 3.7%
> 2010-2018 employment change: +23.8% (+13,859)
> Median household income: $52,562
Of the 25 fastest growing American cities, 18 are located in the South, and Daphne-Fairhope-Foley is one of them. The only metro area in Alabama to make this list, the metro area’s population grew by 19.1% in the last eight years, compared to the state’s 2.1% population growth and the national 5.8% population growth. The vast majority — over 95% — of the metro area’s net population growth of 35,000 was from new residents moving in.
[in-text-ad-2]
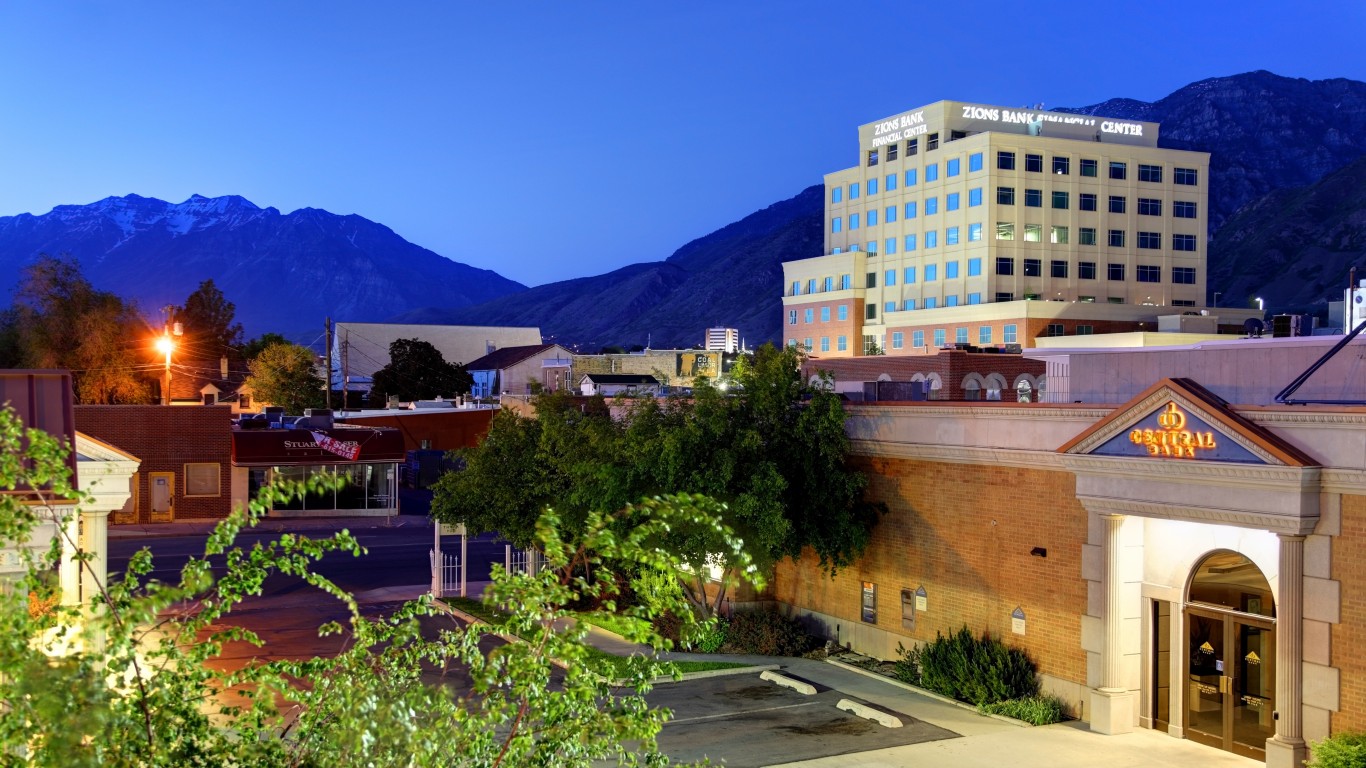
11. Provo-Orem, UT
> 2010-2018 pop. growth: +19.5% (103,511)
> 2018 unemployment: 2.8%
> 2010-2018 employment change: +40.6% (+67,593)
> Median household income: $66,742
Driven mostly by natural population growth — births out numbering deaths — Utah’s population grew by a staggering 13.9% over the last eight years, more than any other state. In Provo-Orem, a metro area less than 50 miles south of Salt Lake City, the population growth has been even more rapid. In the last eight years, the metro area added a net of 103,511 new residents, a 19.5% population growth. As was the case across Utah, the majority of the population increase in the Provo metro area was attributable to births vastly outnumbering deaths.
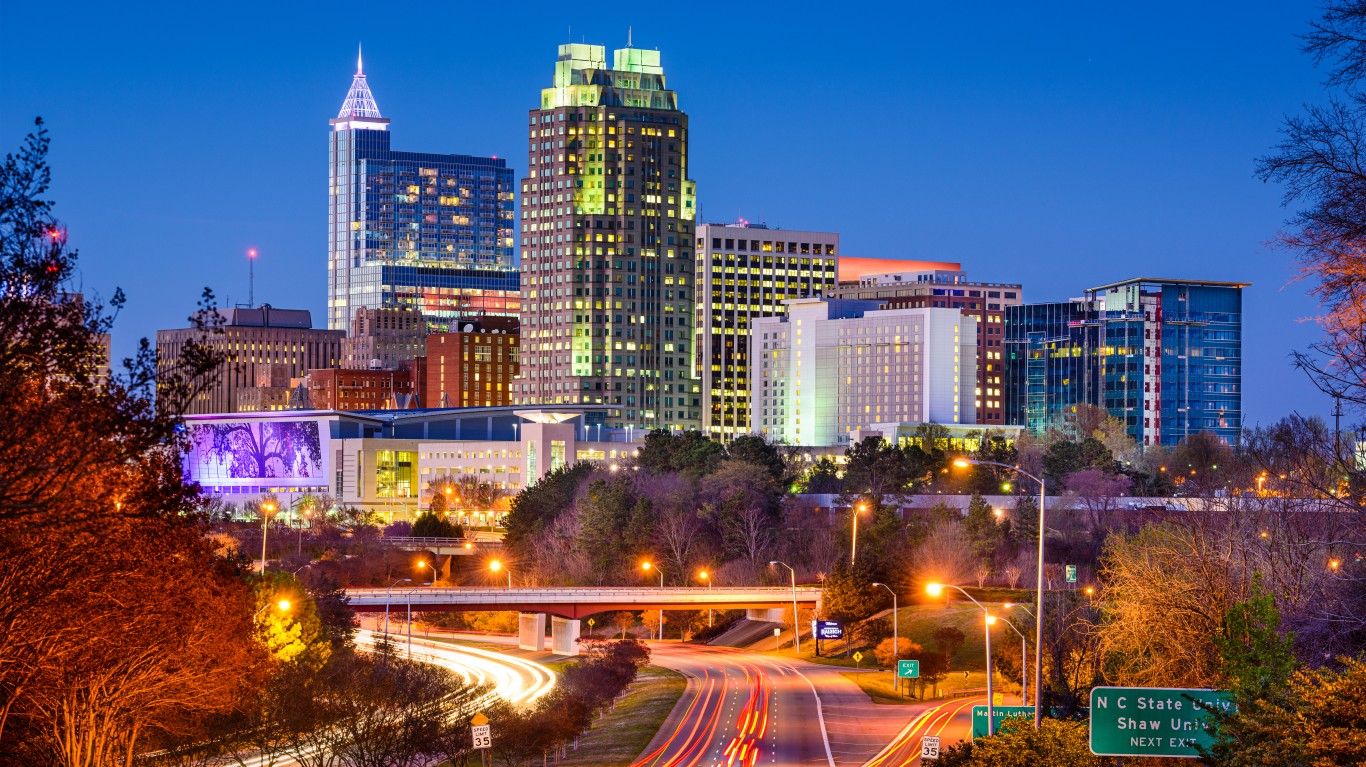
10. Raleigh, NC
> 2010-2018 pop. growth: +19.8% (225,159)
> 2018 unemployment: 3.7%
> 2010-2018 employment change: +24.7% (+119,635)
> Median household income: $68,870
The population of Raleigh, North Carolina, has grown by nearly 20% in the last eight years, more than any other metro area in the state. The increase was driven primarily by people moving into the city from other parts of the country and the world. The metro area’s job market handily kept pace with new residents looking for work. Between 2010 and 2018, the number of people working in Raleigh climbed by nearly 25% compared to 12.5% employment growth nationwide. Currently, the area’s unemployment rate stands at 3.7%, compared to 3.9% nationwide.
[in-text-ad]
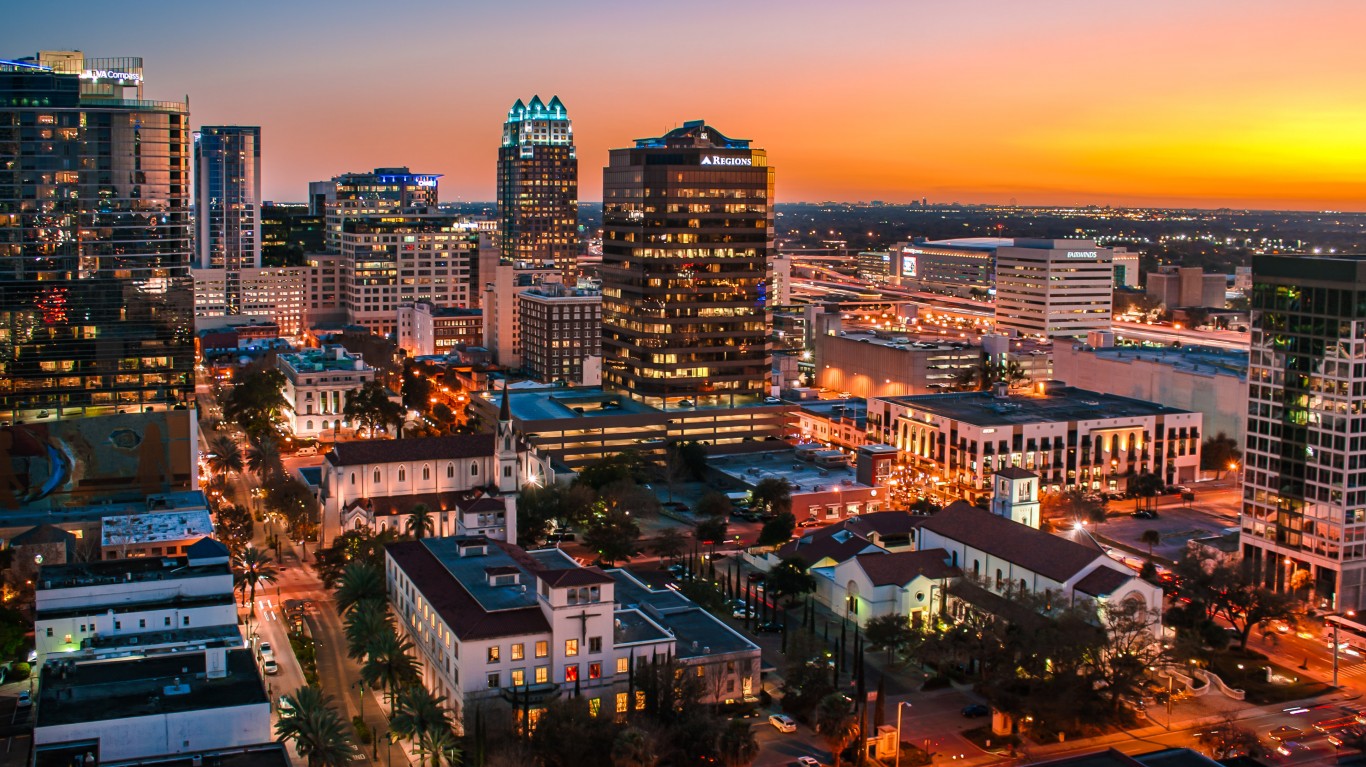
9. Orlando-Kissimmee-Sanford, FL
> 2010-2018 pop. growth: +20.3% (433,763)
> 2018 unemployment: 3.2%
> 2010-2018 employment change: +26.0% (+246,596)
> Median household income: $52,261
The Orlando metro area is one of only nine nationwide to a report a population surge of more than 20% between 2010 and 2018. The metro area reported about 93,000 more births than deaths in the last eight years and about 344,000 more people moving there than leaving.
Americans commonly choose to move for jobs and career opportunities, and Orlando’s economy appears strong as is its job market. There are nearly a quarter million more jobs in the metro area today than there were in 2010 and just 3.2% of the labor force is unemployed, well below the 3.9% national unemployment rate.
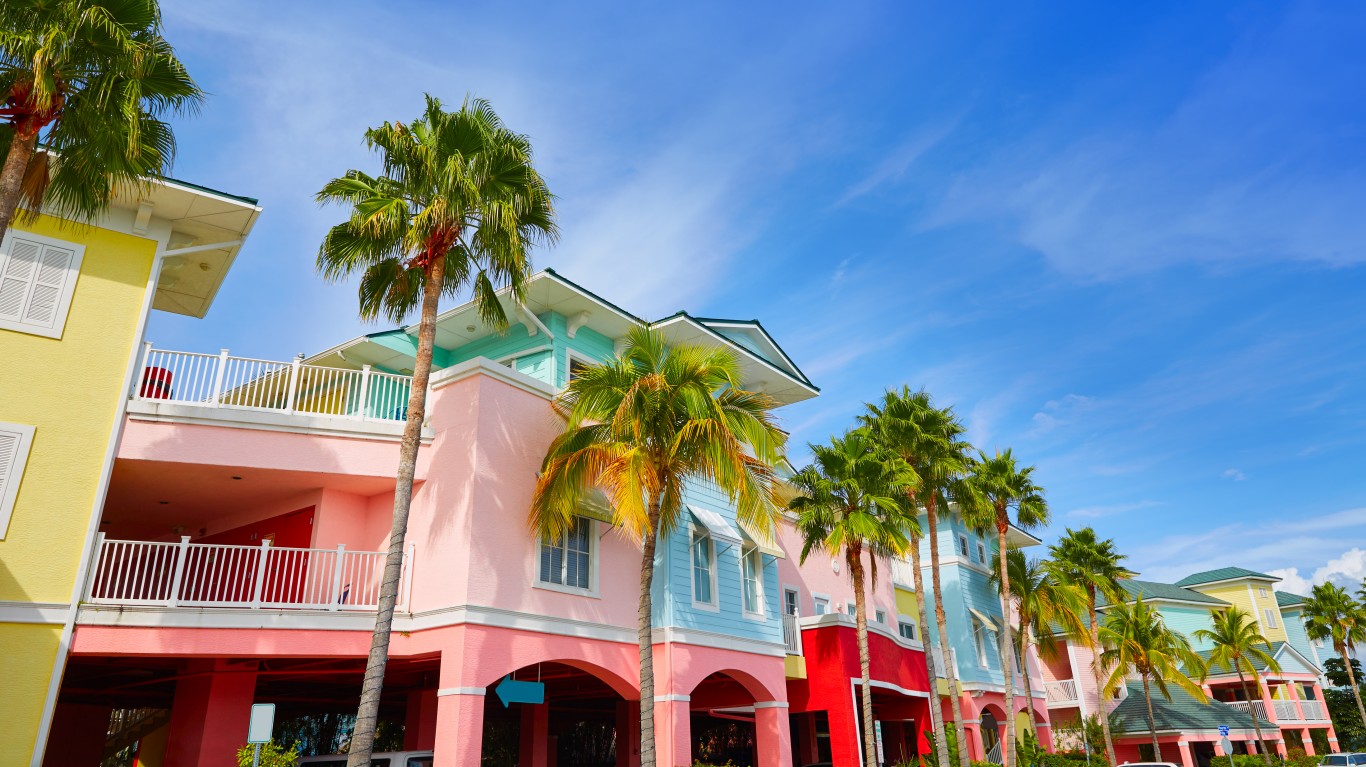
8. Cape Coral-Fort Myers, FL
> 2010-2018 pop. growth: +21.6% (134,156)
> 2018 unemployment: 3.3%
> 2010-2018 employment change: +32.6% (+62,668)
> Median household income: $52,052
Cape Coral-Fort Myers is now home to over three-quarters of a million people, up from 620,000 in 2010. The 21.6% population growth occurred despite more deaths than births recorded in the metro area over the last eight years. Many who moved into the metro area likely came for work. Over the last eight years, total employment climbed by 32.6% in the Cape Coral metro area, more than double the comparable 12.5% employment growth nationwide. The area’s unemployment rate stands at just 3.3%, below the 3.9% national unemployment rate.

7. Bend-Redmond, OR
> 2010-2018 pop. growth: +21.7% (34,253)
> 2018 unemployment: 5.2%
> 2010-2018 employment change: +36.0% (+21,154)
> Median household income: $59,152
Oregon’s population grew by 9.2% over the last eight years, well above the 5.8% national population growth rate. Though it is among the fastest growing states, Oregon is home to only one metro area on this list. In Bend-Redmond, the population grew by 21.7% between 2010 and 2018. As was the case across the state as a whole, population growth in Bend-Redmond was driven primarily by net migration as more people moved in than left.
[in-text-ad-2]

6. Greeley, CO
> 2010-2018 pop. growth: +23.6% (60,107)
> 2018 unemployment: 3.2%
> 2010-2018 employment change: +34.1% (+26,818)
> Median household income: $66,489
Greeley is the fastest growing metro area in Colorado and sixth fastest growing nationwide. There are over 60,000 more people living in Greeley today than there were eight years ago, a 23.6% increase. As is the case in most metro areas on this list, the change was driven primarily by net migration, as over 41,000 more people moved to Greeley than left since 2010.
Americans often move for jobs and career opportunities, and Greeley’s job market appears to be thriving. There are nearly 27,000 more jobs in the metro area now than there were in 2010, and the area’s unemployment rate stands at a lower than average 3.2%.
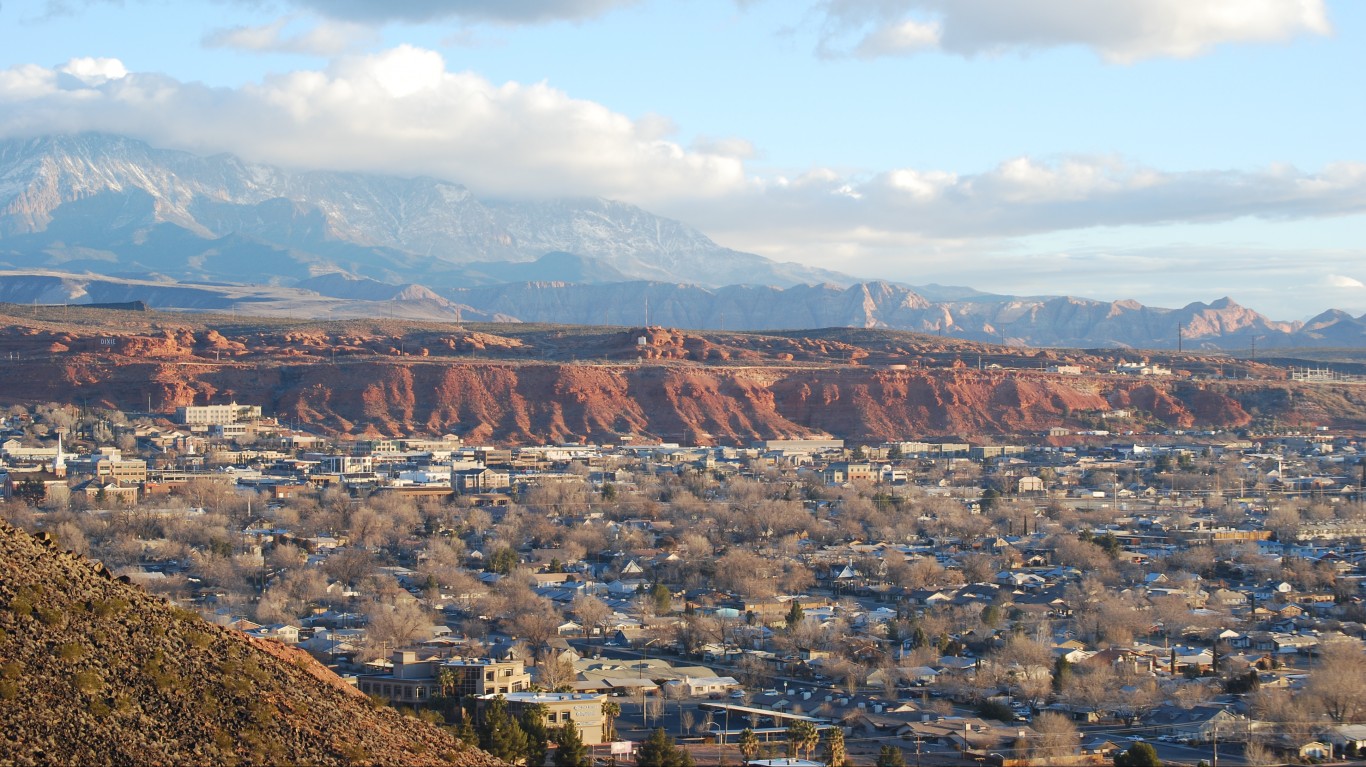
5. St. George, UT
> 2010-2018 pop. growth: +24.1% (33,308)
> 2018 unemployment: 3.4%
> 2010-2018 employment change: +39.2% (+17,726)
> Median household income: $55,175
St. George is the fastest growing city in the fastest growing state. Since 2010, St. George’s population has grown by 24.1%, compared to Utah’s 13.9% growth rate and the U.S. 5.8% population growth over the same period.
Across Utah, population growth is driven by births far outpacing deaths, but not in St. George. About 75% of the 33,308 net increase in population in the metro area was driven by people moving into the area. Americans often move for job opportunities, and overall employment in the metro area spiked by a staggering 39.2% in the last eight years.
[in-text-ad]

4. Austin-Round Rock, TX
> 2010-2018 pop. growth: +25.5% (440,788)
> 2018 unemployment: 3.0%
> 2010-2018 employment change: +29.8% (+226,252)
> Median household income: $69,717
Austin is one of only four U.S. metro areas to report greater than 25% population growth over the last eight years. Due largely to people moving to the central Texas metro area from other parts of the country and the world, Austin is home to 440,800 more people today than in 2010.
Austin’s thriving job market has likely been a draw for many new residents. Major employers in the metro area include tech giants like IBM, Amazon, and Apple. In the last eight years, total employment in the metro area climbed by nearly 30%, more than double the national employment growth over that time.
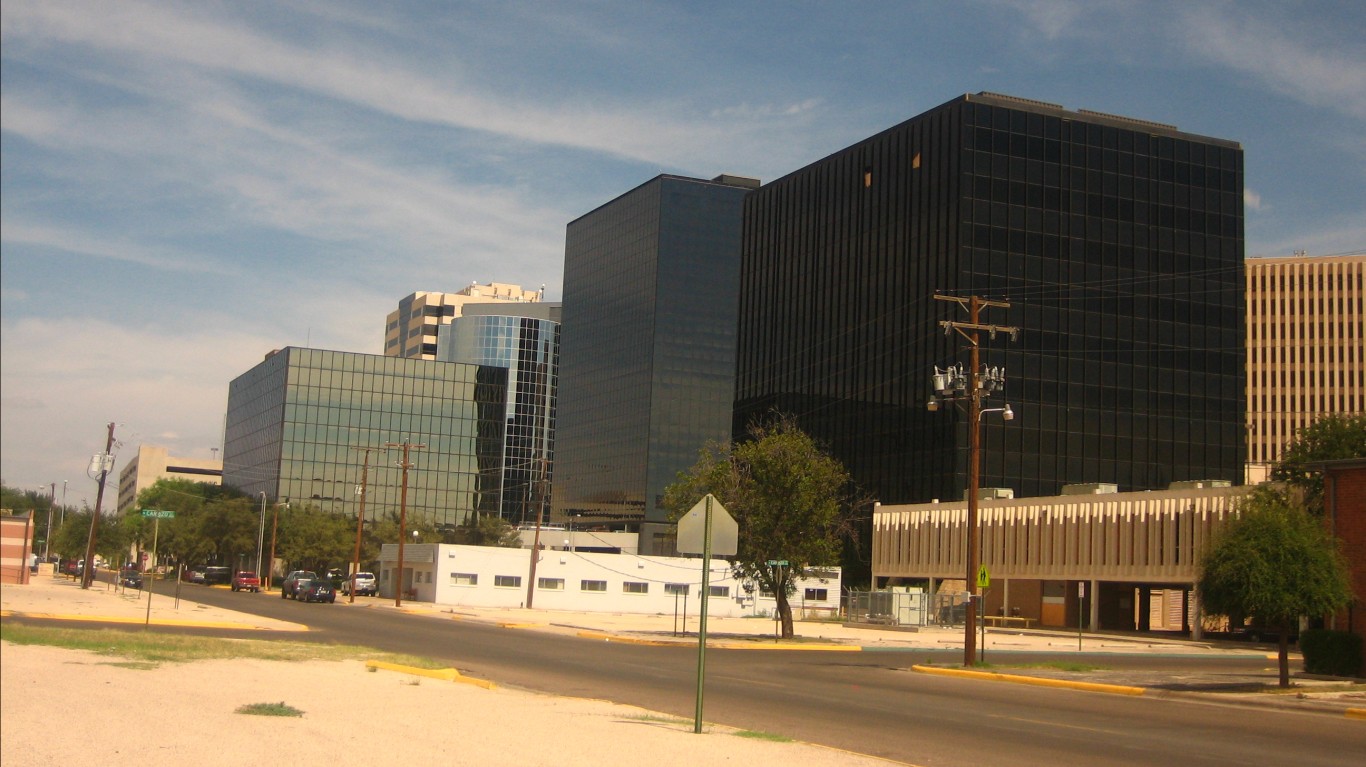
3. Midland, TX
> 2010-2018 pop. growth: +25.8% (36,537)
> 2018 unemployment: 2.2%
> 2010-2018 employment change: +36.4% (+24,507)
> Median household income: $75,570
Half a dozen Texas metro areas rank on this list, but none grew as fast as Midland. There are over 36,000 more people living in Midland today than there were in 2010, a 25.8% population growth.
A strong economy can be attractive to potential new residents and young families, and Midland’s 2.2% unemployment rate is among the lowest in the country and well below the 3.9% national rate. Many jobs in the area are also high paying, as the typical Midland household earns $75,570 a year, about $18,000 more than the typical American household.
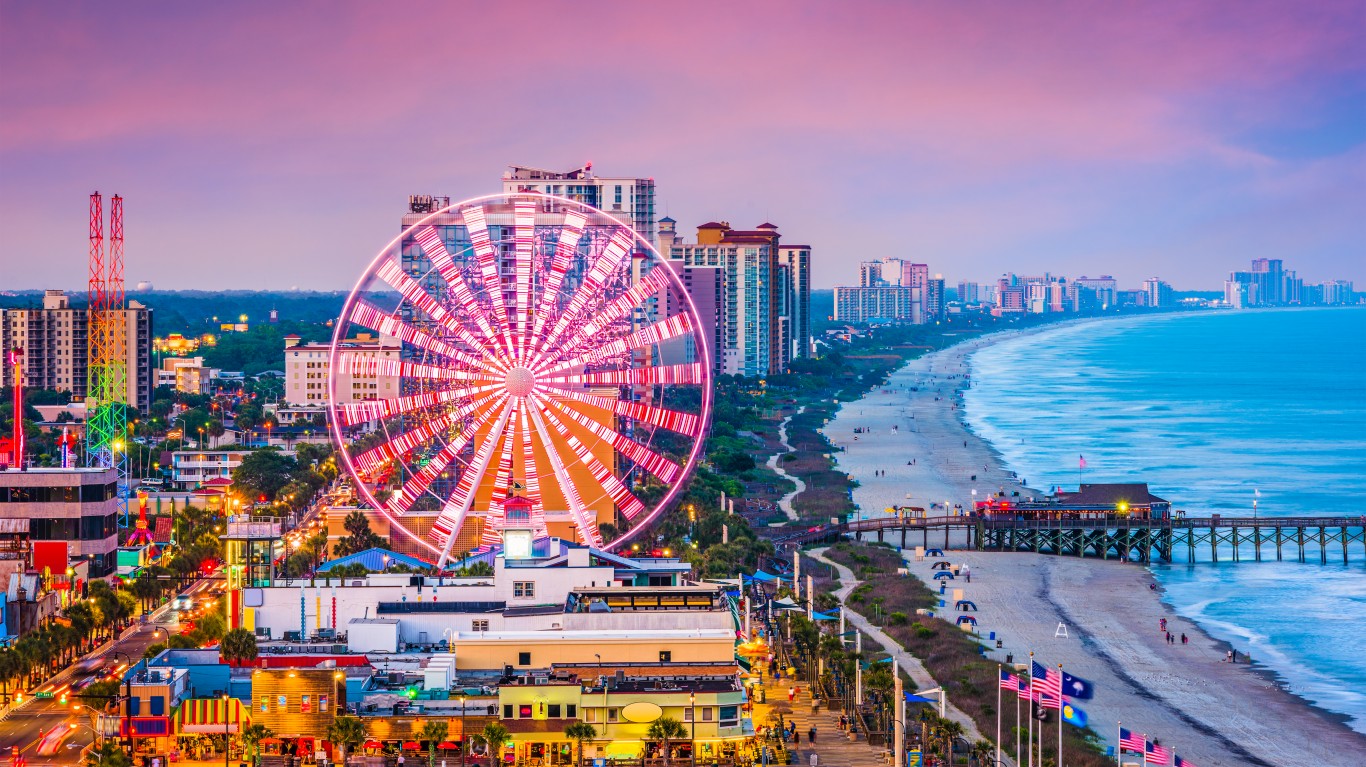
2. Myrtle Beach-Conway-North Myrtle Beach, SC-NC
> 2010-2018 pop. growth: +27.1% (102,569)
> 2018 unemployment: 5.0%
> 2010-2018 employment change: +50.5% (+53,329)
> Median household income: $47,732
Even though there were more deaths than births in Myrtle Beach over the last eight years, enough people moved to the metro area to record a near nation-leading population growth of 27.1%. Over 100,000 more people moved to the metro area than moved out between 2010 and 2018. Job growth in the metro area was even more staggering over the same period. There are now over 53,000 more people working in Myrtle Beach than there were in 2010, a 50.5% increase. Nationwide, employment grew by 12.5% over the same period.
[in-text-ad-2]

1. The Villages, FL
> 2010-2018 pop. growth: +36.6% (34,476)
> 2018 unemployment: 5.1%
> 2010-2018 employment change: +42.9% (+8,513)
> Median household income: $54,771
The Villages was initially conceived of in the 1960s as a planned retirement community for northerners looking to winter in a warmer climate. Today, with 50 golf courses and 2,500 clubs and activities, The Villages is a fulfillment of its founder’s vision. Over the last eight years, the number of people living in the metro area climbed by 36.6% — by far the largest population growth of any U.S. metro area.
As the U.S. population ages, increasingly more Americans are moving to metro areas in the Sun Belt, like The Villages. Over 54% of metro area residents are of retirement age, more than triple the 14.9% share of Americans.
Want to Retire Early? Start Here (Sponsor)
Want retirement to come a few years earlier than you’d planned? Or are you ready to retire now, but want an extra set of eyes on your finances?
Now you can speak with up to 3 financial experts in your area for FREE. By simply clicking here you can begin to match with financial professionals who can help you build your plan to retire early. And the best part? The first conversation with them is free.
Click here to match with up to 3 financial pros who would be excited to help you make financial decisions.
Thank you for reading! Have some feedback for us?
Contact the 24/7 Wall St. editorial team.
 24/7 Wall St.
 24/7 Wall St.
 24/7 Wall St.


