
Incomes climbed faster in 2017 for the typical American household than they have in years. The median household income of $60,336 in 2017 marked a 4.7% increase from the previous year — more than doubled the 2.1% inflation rate over the same period.
The 2017 median household income of $60,336 marks a historic high and generally means greater wealth and buying power than in recent years. Clearly, however, incomes are not even nationwide, and while some areas are undoubtedly poorer, in dozens of thriving American cities, the majority of households earn over 20% more than the national median.
24/7 Wall St. reviewed median household income data from the U.S. Census Bureau for 381 U.S. metro areas to identify the 25 richest American cities. Though spread across the country, from New England to Alaska, the cities on this list tend to have much in common.
The vast majority of these cities are home to a well-educated, highly skilled workforce. Nationwide, 32.0% of adults have a bachelor’s degree, and in all but a handful of cities on this list, the bachelor’s degree attainment rate is greater. Many of the cities on this list rank as the most educated city in their state.
With a wide talent pool to draw from, these cities are attractive places for major companies to do business, particularly those in the traditionally high-paying technology sector. Several cities on this list have near-nation leading concentrations of high-tech jobs. Being a magnet for major employers has the added benefit of reducing unemployment. In the majority of cities on this list, the unemployment rate in March was below the 3.8% national rate the same month.
Click here to see the 25 richest cities in America

25. Austin-Round Rock, TX
> Median household income: $73,800
> Households earning $200,000 or more: 9.7%
> Adults with a bachelor’s degree: 44.8%
> March 2019 unemployment: 2.7%
The typical household in the Austin-Round Rock metro area earns nearly $74,000 a year, about $13,500 more than the typical American household. Some of the largest employers in the metro area include high-paying tech companies such as Dell, IBM, Amazon, and Apple. Partially as a result, employment in traditionally higher paying-industries like information, and professional, scientific, and management is more concentrated in Austin than the vast majority of U.S. metro areas.
The unemployment rate in the Austin metro area stands at just 2.7%, well below the 3.8% national March unemployment rate — which itself is near historic lows.
[in-text-ad]

24. Midland, TX
> Median household income: $75,266
> Households earning $200,000 or more: 8.5%
> Adults with a bachelor’s degree: 27.6%
> March 2019 unemployment: 2.1%
Midland, Texas, is one of only 24 U.S. metro areas where most households earn at least $75,000 a year. Texas is by far the leading oil and natural gas producing state — and Midland is an oil city. Of the metro area’s labor force, 18.5% work in resource extraction, the largest share of any U.S. metro area and more than 10 times the industry’s 1.7% employment concentration nationwide. Energy tends to be a higher-paying field.
Midland sits on top of the Permian Basin, an expansive West Texas oil field that stretches about 300 miles long and 250 miles wide. With access to one of the largest oil fields in the United States, Midland is home to major operations of energy giants like Chevron, ConocoPhillips, and Halliurton.

23. New York-Newark-Jersey City, NY-NJ-PA
> Median household income: $75,368
> Households earning $200,000 or more: 13.2%
> Adults with a bachelor’s degree: 39.6%
> March 2019 unemployment: 3.9%
Home to over 20 million people, New York is by far the most populous metro area in the United States. With a median annual household income of $75,368, it is also one of the wealthiest. A significant 13.2% of households in the metro area earn at least $200,000 a year, a larger share than in all but six other metro areas nationwide. The high incomes are due in part to the city’s status as a global financial hub, home to high-paying employers in the finance industry, including firms like JPMorgan Chase, Citigroup, Morgan Stanley, and Goldman Sachs.
Income inequality is a bigger problem in New York than most other American cities. The poverty rate in metro area of 12.8% is higher than nearly every other city on this list.

22. San Diego-Carlsbad, CA
> Median household income: $76,207
> Households earning $200,000 or more: 10.9%
> Adults with a bachelor’s degree: 38.8%
> March 2019 unemployment: 3.7%
California is one of the most expensive states in the country, with goods and services costing 14.4% more on average than they do nationwide. In many parts of the state, incomes are high partially to offset the higher living expenses, and San Diego is one of eight California metro areas on this list.
The typical household in San Diego earns $76,207 a year, well above the state and national median annual household incomes of $71,805 and $60,336, respectively. Some of the largest employers in the city include higher-paying health care giants Sharp Healthcare, Kaiser Permanente, and Scripps Health.
[in-text-ad-2]

21. Denver-Aurora-Lakewood, CO
> Median household income: $76,643
> Households earning $200,000 or more: 9.5%
> Adults with a bachelor’s degree: 43.9%
> March 2019 unemployment: 2.9%
The typical household in the Denver metro area earns $76,643 a year, the second most of any city in the state and more than in all but 20 other cities nationwide. Incomes tend to increase with educational attainment, and in Denver, 43.9% of adults have a bachelor’s degree or higher, well above the 32.0% U.S. bachelor’s degree attainment rate.
Major employers in the area include a wide range of companies in high paying sectors like defense, finance, and technology. These companies include Charles Schwab, VMware, Oracle, Amazon, Boeing, and Lochkeed Martin.

20. Fairbanks, AK
> Median household income: $76,747
> Households earning $200,000 or more: 6.8%
> Adults with a bachelor’s degree: 29.6%
> March 2019 unemployment: 6.4%
The typical household in Fairbanks, Alaska, earns $76,747 a year. The metro area’s relative prosperity is underscored by the small share of residents facing serious financial hardship. Just 2.8% of Fairbanks households earn less than $10,000 a year, nearly the smallest share of any U.S. city and well below the 6.5% share U.S. households.
Both Fairbanks and Anchorage — the only two metro areas in Alaska — rank on this list. Alaska as a whole is a relatively high-income state, partially due to the state’s permanent fund, which every year pays all residents a share of the state’s revenue from oil.
[in-text-ad]

19. Minneapolis-St. Paul-Bloomington, MN-WI
> Median household income: $76,856
> Households earning $200,000 or more: 9.2%
> Adults with a bachelor’s degree: 41.7%
> March 2019 unemployment: 3.6%
Minneapolis-St. Paul is the only metro area in the Midwest to rank on this list. The typical Twin Cities household earns nearly $77,000 a year, about $16,500 more than the typical American household. Incomes tend to rise with educational attainment, and not only is Minneapolis one of the wealthiest metro areas in the country, but also it is one of the best educated. About 42% of adults in the metro area have a bachelor’s degree or higher, well above the 32% share of American adults nationwide with similar education. Several Fortune 500 companies, including 3M, Best Buy, and UnitedHealth Group, are headquartered in the metro area.
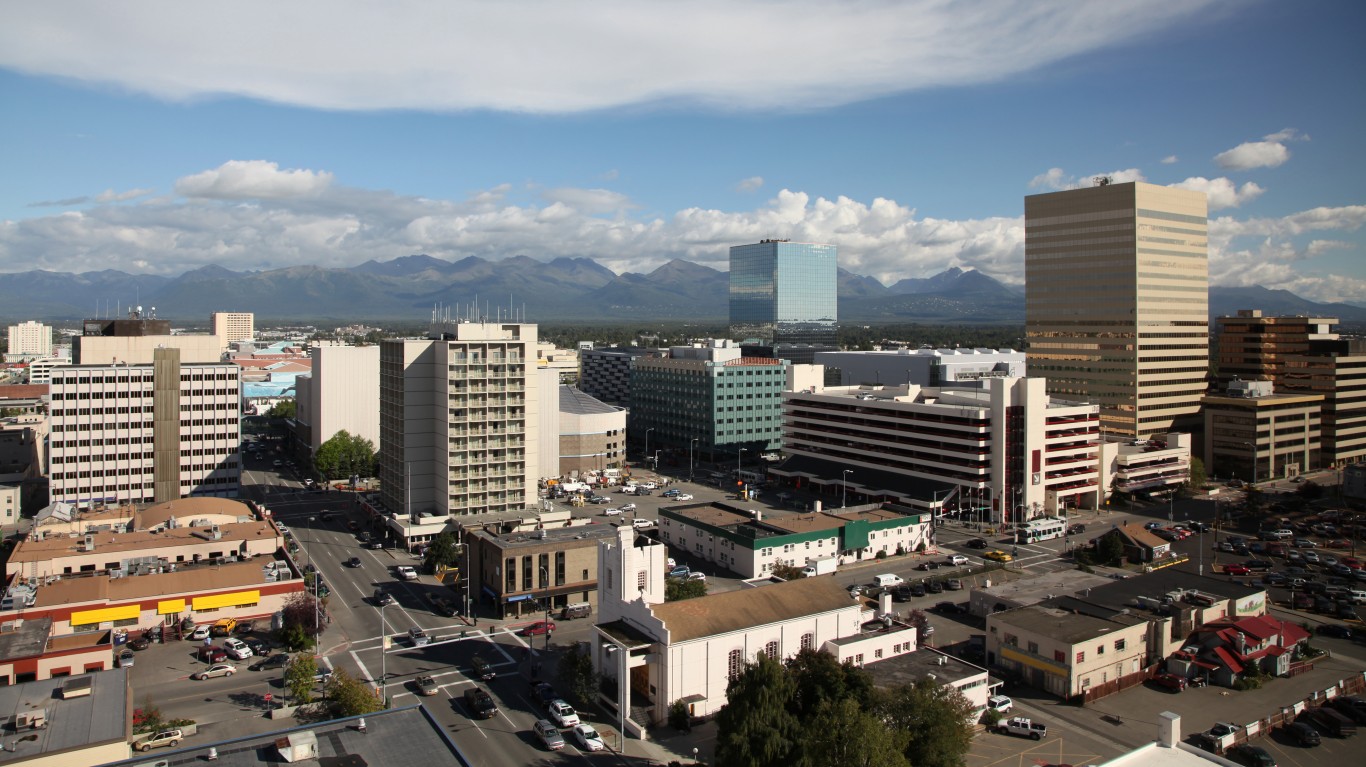
18. Anchorage, AK
> Median household income: $76,871
> Households earning $200,000 or more: 8.1%
> Adults with a bachelor’s degree: 31.6%
> March 2019 unemployment: 6.3%
The typical Anchorage household earns $76,871 a year, more than the median income in all but 17 other metro areas nationwide. Unlike nearly every other metro area on this list, Anchorage has a weak job market. As of March, 6.3% of the metro area’s labor force was unemployed, well above the 3.8% national jobless rate. The area’s higher than average incomes area are due in part to the Alaska Permanent Fund dividend paid to every resident annually. The payment amount fluctuates from year to year, and in 2018, eligible Alaskans each received $1,600.
The area’s high incomes are partially offset by a high cost of living. Goods and services are 9.2% more expensive in Anchorage than they are nationwide.

17. Vallejo-Fairfield, CA
> Median household income: $77,133
> Households earning $200,000 or more: 8.8%
> Adults with a bachelor’s degree: 26.6%
> March 2019 unemployment: 4.6%
Vallejo-Fairfield is one of several metro areas in California’s San Francisco Bay area to rank on this list. The typical metro area household earns $77,133 a year, about $17,000 more than the typical American household.
Unlike nearly every other city on this list, Vallejo-Fairfield residents are less likely to have a four-year college degree than the typical American. Just 26.6% of metro area adults have a bachelor’s degree compared to 32.0% of American adults. The lower than average bachelor’s degree attainment rate is likely related to the kinds of jobs in the area. For example, 9.3% of area employees work in construction, which often has fewer higher-education requirements. This share is a far larger share than in most cities and well above the 6.6% national concentration.
[in-text-ad-2]

16. Baltimore-Columbia-Towson, MD
> Median household income: $77,394
> Households earning $200,000 or more: 10.1%
> Adults with a bachelor’s degree: 39.5%
> March 2019 unemployment: 3.9%
With a median annual household income of $80,776, Maryland is the wealthiest state in the country. Wealth in the state is largely concentrated outside of major metropolitan areas, and even though Baltimore-Columbia-Towson ranks among the wealthiest cities in the country, its median household income of $77,294 is lower than the statewide median.
The high incomes in the Baltimore-Columbia-Towson metro area and other parts of Maryland are partially attributable to both public and private sector contractor jobs in nearby Washington D.C.

15. Manchester-Nashua, NH
> Median household income: $78,769
> Households earning $200,000 or more: 9.7%
> Adults with a bachelor’s degree: 37.6%
> March 2019 unemployment: 2.6%
Manchester-Nashua is the wealthiest metro area in New Hampshire and the third wealthiest in the broader New England region. The typical area household earns $78,769 a year, about $5,400 more than the typical household in the state and $18,400 more than the typical American household.
Contributing to the area’s high incomes is a favorable job market. Just 2.6% of the metro area’s labor force is unemployed, well below the 3.8% national unemployment rate.
[in-text-ad]
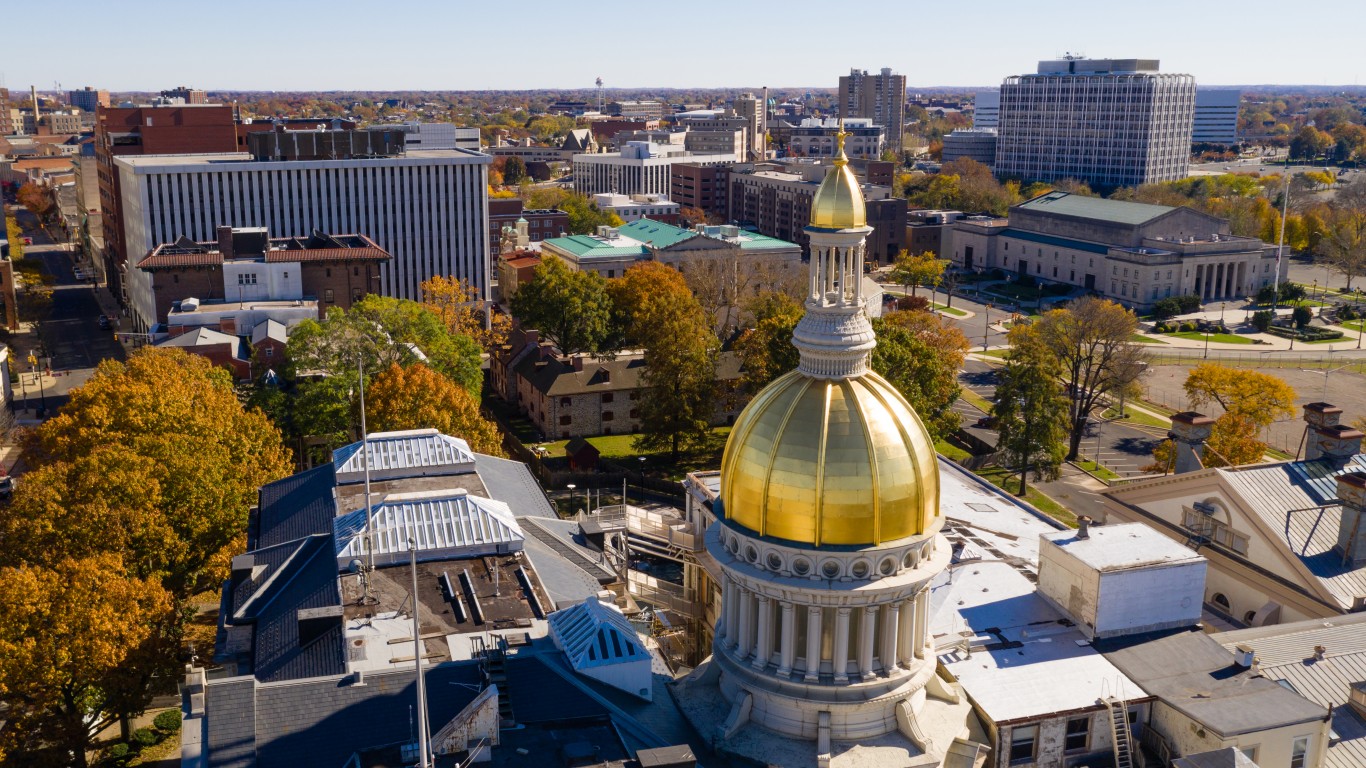
14. Trenton, NJ
> Median household income: $79,173
> Households earning $200,000 or more: 15.3%
> Adults with a bachelor’s degree: 43.9%
> March 2019 unemployment: 3.5%
Trenton, New Jersey’s capital, is the only metro area in the state to rank on this list. The typical household in the metro area earns $79,173 a year, about $19,000 more than the typical American household.
Like many metro areas on this list, Trenton is home to a well-educated labor force and has a favorable job market. Nearly 44% of adults in the metro area have a bachelor’s degree or higher compared to just 32% of American adults, and the city’s unemployment rate of 3.5% is well below the national unemployment rate of 3.8%.

13. Santa Cruz-Watsonville, CA
> Median household income: $79,705
> Households earning $200,000 or more: 15.6%
> Adults with a bachelor’s degree: 40.2%
> March 2019 unemployment: 6.9%
The typical household in Santa Cruz-Watsonville earns $79,705 a year, more than the median income in all but a dozen other metro areas nationwide. The metro area sits directly south of Silicon Valley and the San Francisco Bay, a region containing several other metro areas on this list.
The metro area’s high incomes are largely offset by the area’s high cost of living. Goods and services in the Santa Cruz metro area are about 25% more expensive than they are nationwide, on average. Accounting for cost of living, the typical household’s buying power is equal to about $63,900, only slightly more than the national median annual household income of $60,336.

12. Kahului-Wailuku-Lahaina, HI
> Median household income: $80,183
> Households earning $200,000 or more: 9.2%
> Adults with a bachelor’s degree: 27.0%
> March 2019 unemployment: 2.8%
Hawaii is a relatively high-income state, and both metro areas in Hawaii rank on this list. In Kahului-Wailuku-Lahaina, the typical household earns $80,183 a year, nearly $20,000 more than the typical American household.
Kahului-Wailuku-Lahaina has a strong job market. Just 2.8% of the area’s labor force is unemployed, well below the 3.8% national unemployment rate. Many of those jobs are in tourism, a major industry in the state. Of all workers in Kahului-Wailuku-Lahaina, 27.4% are employed in the entertainment, recreation, accomodation, and food services industry, nearly triple the industry’s 9.7% employment concentration nationwide.
[in-text-ad-2]
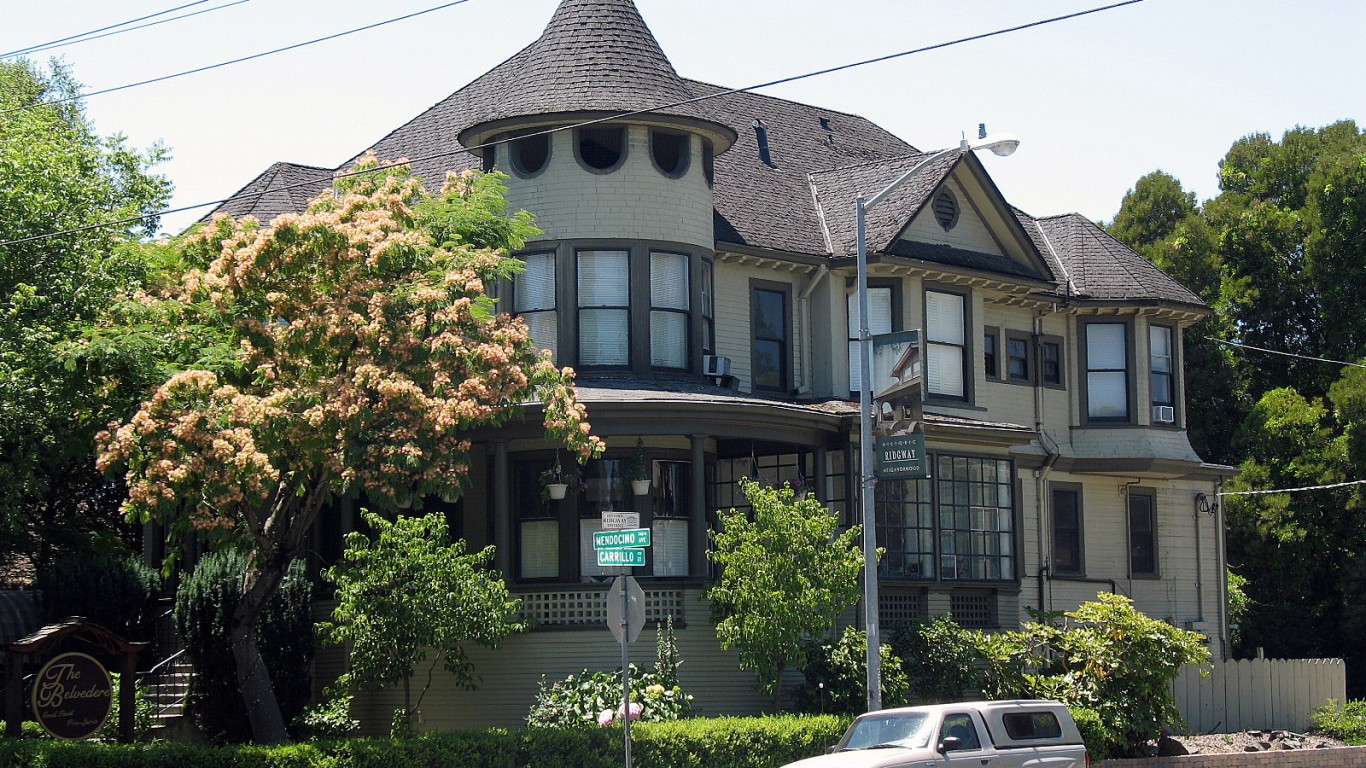
11. Santa Rosa, CA
> Median household income: $80,409
> Households earning $200,000 or more: 10.3%
> Adults with a bachelor’s degree: 35.8%
> March 2019 unemployment: 3.3%
Santa Rosa is a metro area of half a million people located about 50 miles north of San Francisco. Most households in the metro area earn over $80,000 a year, and one in every 10 households earns at least $200,000. Like most other high-income cities, Santa Rosa is expensive. The cost of goods and services is about 21% higher than average in Santa Rosa, and as a result, the buying power of the typical household income is only about $66,500, only marginally higher than the national median annual household income of $60,336.

10. Boulder, CO
> Median household income: $80,834
> Households earning $200,000 or more: 13.2%
> Adults with a bachelor’s degree: 63.2%
> March 2019 unemployment: 2.5%
Boulder is the wealthiest metropolitan area in Colorado and the 10th wealthiest nationwide. Most households in the metro area earn over $80,000 a year, and 13.7% of households earn at least $200,000 a year — a larger share than in all but six other metro areas nationwide.
Like many metro areas on this list, Boulder is home to a well-educated labor force and a favorable job market. Nearly two-thirds of adults in Boulder have a bachelor’s degree or higher compared to less than a third of American adults, and the city’s unemployment rate of 2.5% is well below the national unemployment rate of 3.8%. Major employers in the metro area include high-paying tech companies like Google and IBM.
[in-text-ad]

9. Urban Honolulu, HI
> Median household income: $81,284
> Households earning $200,000 or more: 10.6%
> Adults with a bachelor’s degree: 34.7%
> March 2019 unemployment: 2.7%
Urban Honolulu is the wealthiest metropolitan area in Hawaii and the ninth wealthiest nationwide. Most metro area households earn at least $81,000 a year, and more than one in every 10 households earn at least $200,000 a year. The area’s high incomes are reflected in the high property values. The typical home in the Honolulu area is worth $680,200, more than triple the value of the typical American home of $217,600.
Incomes are boosted by a healthy job market. Just 2.7% of area workers are unemployed, over a full percentage point below the 3.8% national unemployment rate — which itself is near a historic low.

8. California-Lexington Park, MD
> Median household income: $81,495
> Households earning $200,000 or more: 9.6%
> Adults with a bachelor’s degree: 31.8%
> March 2019 unemployment: 3.7%
California-Lexington Park, Maryland, is located at the end of a small peninsula between the Potomac River and the Chesapeake Bay, south of Washington D.C. It is the wealthiest metro area in the wealthiest state. The typical metro area household earns $81,495 a year, and the typical Maryland household earns $80,776, each well above the national median household income of $60,336. The area also lacks the kind of financial hardship that is much more common in the rest of the country. Only 3.2% of area households earn less than $10,000 a year, less than half the 6.5% comparable national share.
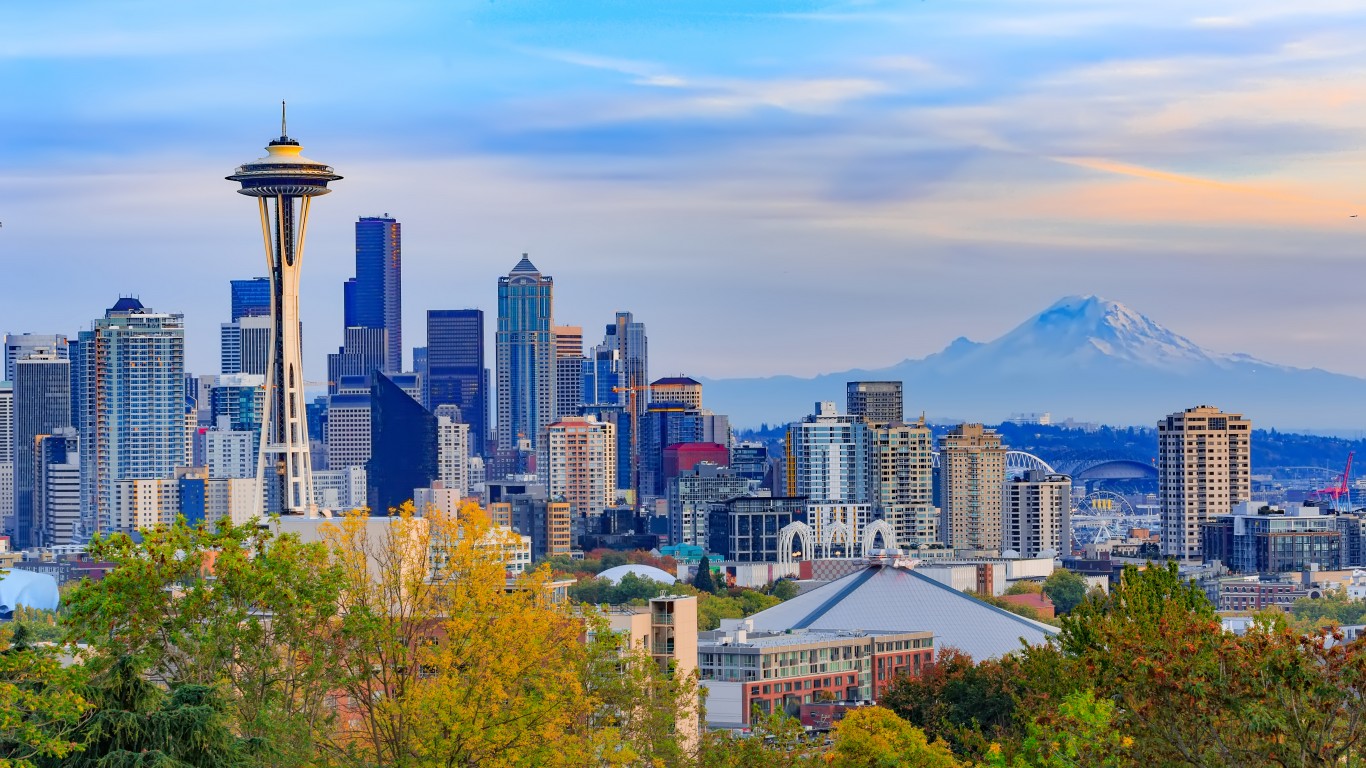
7. Seattle-Tacoma-Bellevue, WA
> Median household income: $82,133
> Households earning $200,000 or more: 12.0%
> Adults with a bachelor’s degree: 41.9%
> March 2019 unemployment: 4.1%
Seattle-Tacoma-Bellevue is the wealthiest metro area on the West Coast outside of California. Most households in the metro area earn at least $82,000 a year, and 12% of households earn at least $200,000 annually. The metro area is home to a well-educated workforce — nearly 42% of metro area adults have a bachelor’s degree or higher — and to a number of high-paying companies. The largest employers in the Seattle metro area include Amazon, Boeing, and Microsoft.
[in-text-ad-2]
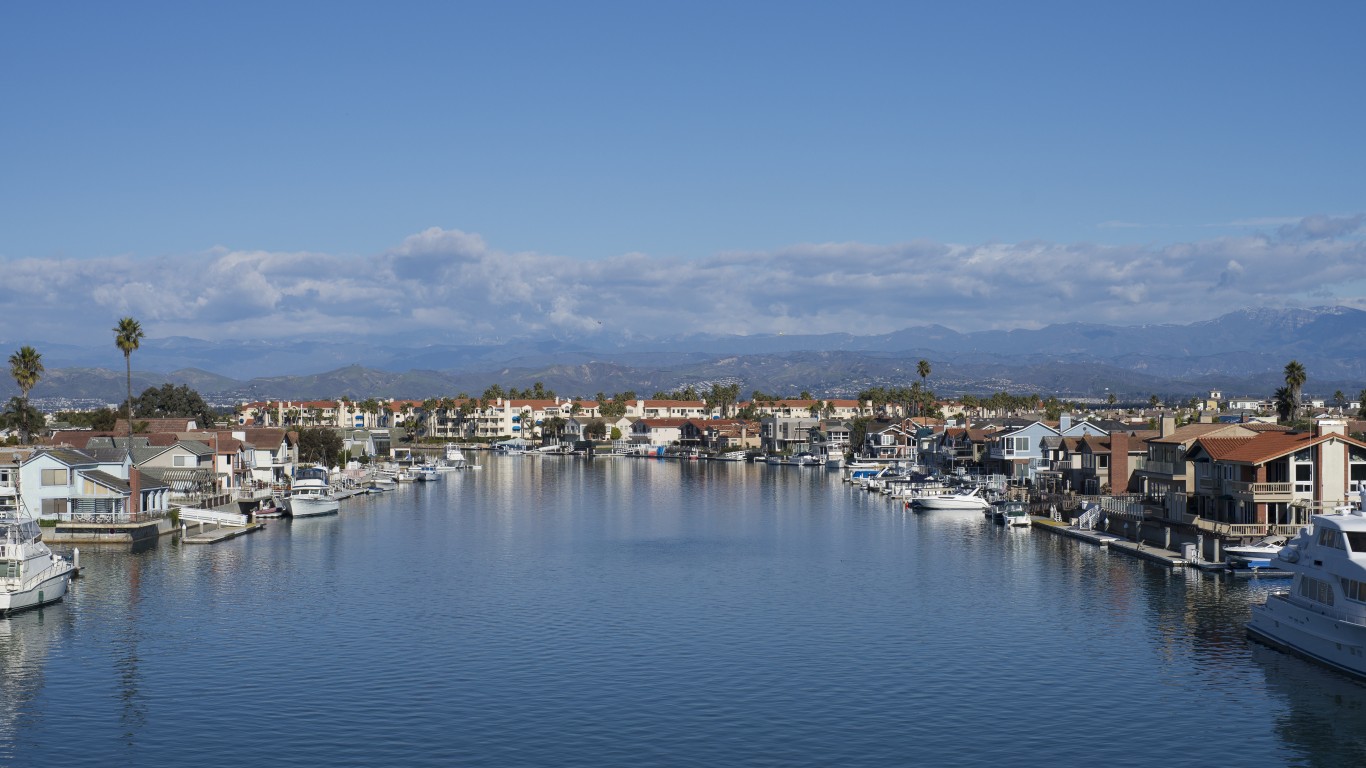
6. Oxnard-Thousand Oaks-Ventura, CA
> Median household income: $82,857
> Households earning $200,000 or more: 12.2%
> Adults with a bachelor’s degree: 33.4%
> March 2019 unemployment: 4.0%
Oxnard-Thousand Oaks-Ventura is a metro area of about 850,000 just north of Los Angeles. The typical household in the area makes nearly $83,000 a year, $22,500 more than the typical American household. Most homes in the metro area are worth over half a million dollars, making the area prohibitively expensive many lower-income Americans. Just 3.1% of households in the metro area earn less than $10,000 a year compared to 6.5% of households nationwide.

5. Boston-Cambridge-Newton, MA-NH
> Median household income: $85,691
> Households earning $200,000 or more: 14.6%
> Adults with a bachelor’s degree: 47.6%
> March 2019 unemployment: 2.7%
Boston is one of only five U.S. metro areas where most households earn at least $85,000 a year. Incomes tend to go up with educational attainment, and nearly half of all adults in the Boston metro area have a bachelor’s degree or higher. The well-educated population is partially attributable to the high concentration of colleges and universities. Post-secondary institutions in the metro area — which include Harvard, MIT, and Northeastern — awarded over 104,000 degrees in 2016 alone.
The metro area also has a strong job market, with an unemployment rate of just 2.7%. Major employers in and around Boston include General Electric, Massachusetts General Hospital, and government contractor, MITRE Corporation.
[in-text-ad]

4. Napa, CA
> Median household income: $86,562
> Households earning $200,000 or more: 12.4%
> Adults with a bachelor’s degree: 36.2%
> March 2019 unemployment: 3.5%
Napa is one of three California metro areas to rank among the five wealthiest American cities. A small city of less than 150,000, Napa is located just north of the San Francisco Bay — a region home to several other metro areas on this list. Most households in Napa earn at least $86,500 a year, and 12.4% of households earn at least $200,000.
Napa has global recognition as a wine-making region, and local wineries and the tourism they attract make a significant contribution to the economy. Of all workers in the area, 3.4% are employed in agriculture, double the 1.7% national concentration. Additionally, 13.7% of workers are employed in accommodation and food services, well above the 9.7% national share.
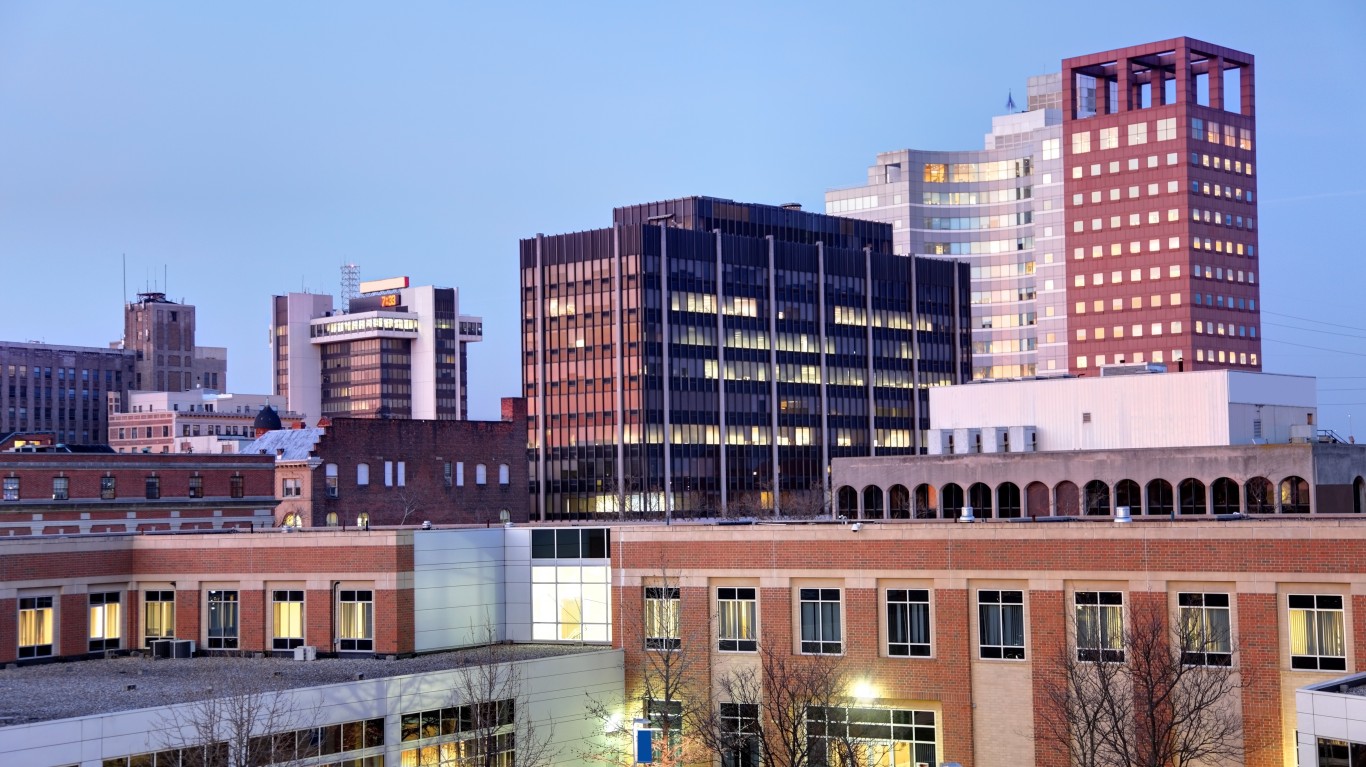
3. Bridgeport-Stamford-Norwalk, CT
> Median household income: $91,198
> Households earning $200,000 or more: 20.4%
> Adults with a bachelor’s degree: 47.1%
> March 2019 unemployment: 4.1%
Though Bridgeport proper is a relatively poor city, the broader Bridgeport-Stamford-Norwalk metro area is the wealthiest metro area in New England and the eastern United States. Bridgeport-Stamford-Norwalk is one of only three U.S. metro areas where most households earn over $90,000. Additionally, more than 20% metro area households earn at least $200,000 a year compared to just 6.9% of American households. Much of the metro area is within commuting distance of high paying jobs in and around New York City.

2. San Francisco-Oakland-Hayward, CA
> Median household income: $101,714
> Households earning $200,000 or more: 21.4%
> Adults with a bachelor’s degree: 49.3%
> March 2019 unemployment: 3.0%
San Francisco is one of only two U.S. metro areas where the majority of households earn over $100,000 a year. Incomes tend to rise with educational attainment, and San Francisco also has one of the best educated populations of metro areas in the country. Nearly half of all adults in the metro area have a bachelor’s degree or higher compared to 32.0% of adults nationwide.
Likely due in part to the city’s talent pool, San Francisco is a hub of high-paying employers offering high-skilled positions. Financial services companies Charles Schwab and Wells Fargo are both headquartered in the city, and tech giants like Dropbox, Facebook, Google, and Twitter are all within commuting distance. The city’s extremely high cost of living also relates to its high salaries. Goods and services cost, on average, 25% more in the metro area than across the country.
[in-text-ad-2]
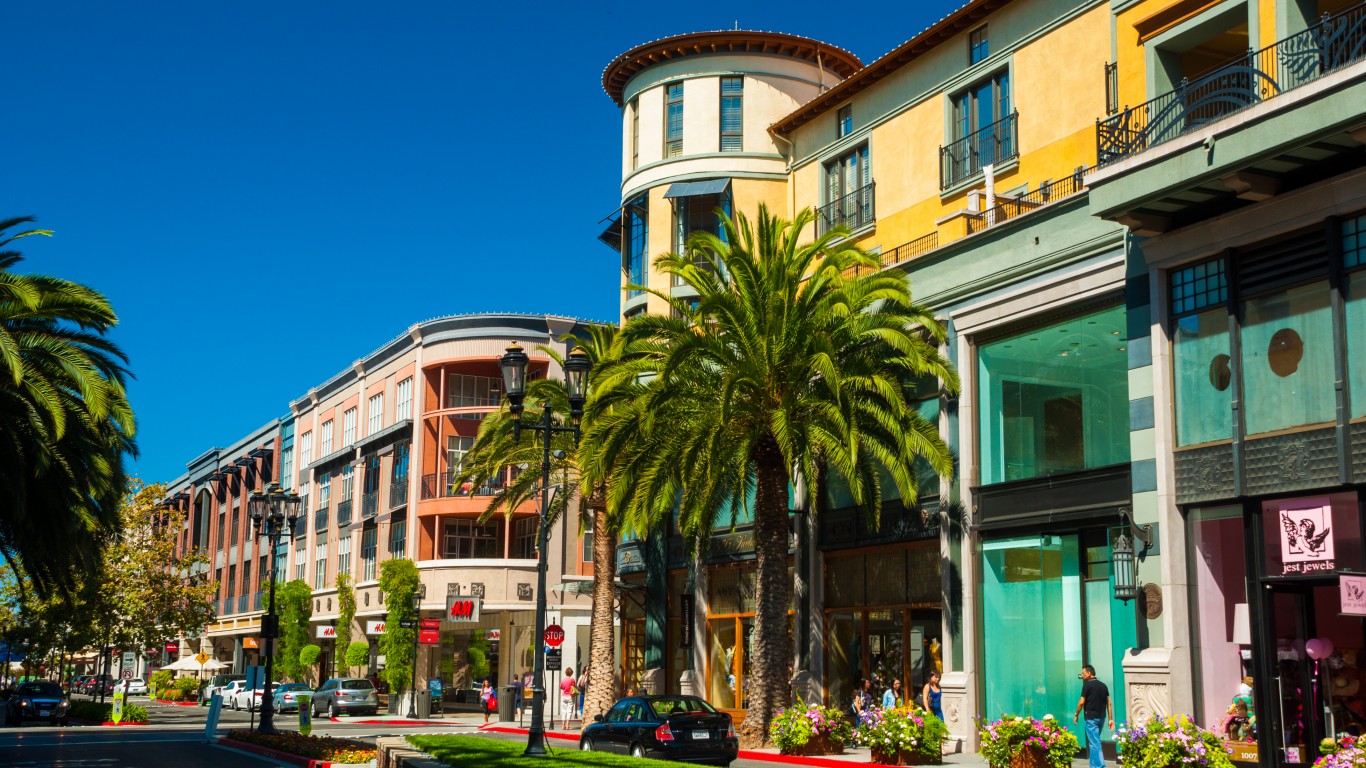
1. San Jose-Sunnyvale-Santa Clara, CA
> Median household income: $117,474
> Households earning $200,000 or more: 25.7%
> Adults with a bachelor’s degree: 50.8%
> March 2019 unemployment: 3.0%
San Jose-Sunnyvale-Santa Clara — commonly referred to as Silicon Valley — is far and away the wealthiest metro area in the United States. The typical area household earns $117,474 a year, at least $15,000 more than every other metro area and nearly double the $60,336 median annual household income nationwide. San Jose-Sunnyvale-Santa Clara is also the only U.S. metro area where one in every four households earns at least $200,000 a year.
The region earned its nickname because of the high concentrations of tech-startups in the area. Today, tech giants headquartered in the area like Facebook and Google are among the best-paying companies in the country.
Methodology
To determine the richest cities in America, 24/7 Wall St. reviewed median household income in 381 U.S. metro areas from the U.S. Census Bureau’s 2017 American Community Survey. We also reviewed cost of living-adjusted median household income using the city’s 2016 regional purchasing parity, obtained from the Bureau of Labor Statistics. Poverty rates, median home values, and educational attainment rates also came from the ACS. Unemployment rates are from the Bureau of Labor Statistics and are seasonally adjusted for March 2019, the most recent period for which data is available.
“The Next NVIDIA” Could Change Your Life
If you missed out on NVIDIA’s historic run, your chance to see life-changing profits from AI isn’t over.
The 24/7 Wall Street Analyst who first called NVIDIA’s AI-fueled rise in 2009 just published a brand-new research report named “The Next NVIDIA.”
Click here to download your FREE copy.
Thank you for reading! Have some feedback for us?
Contact the 24/7 Wall St. editorial team.
 24/7 Wall St.
 24/7 Wall St.

