
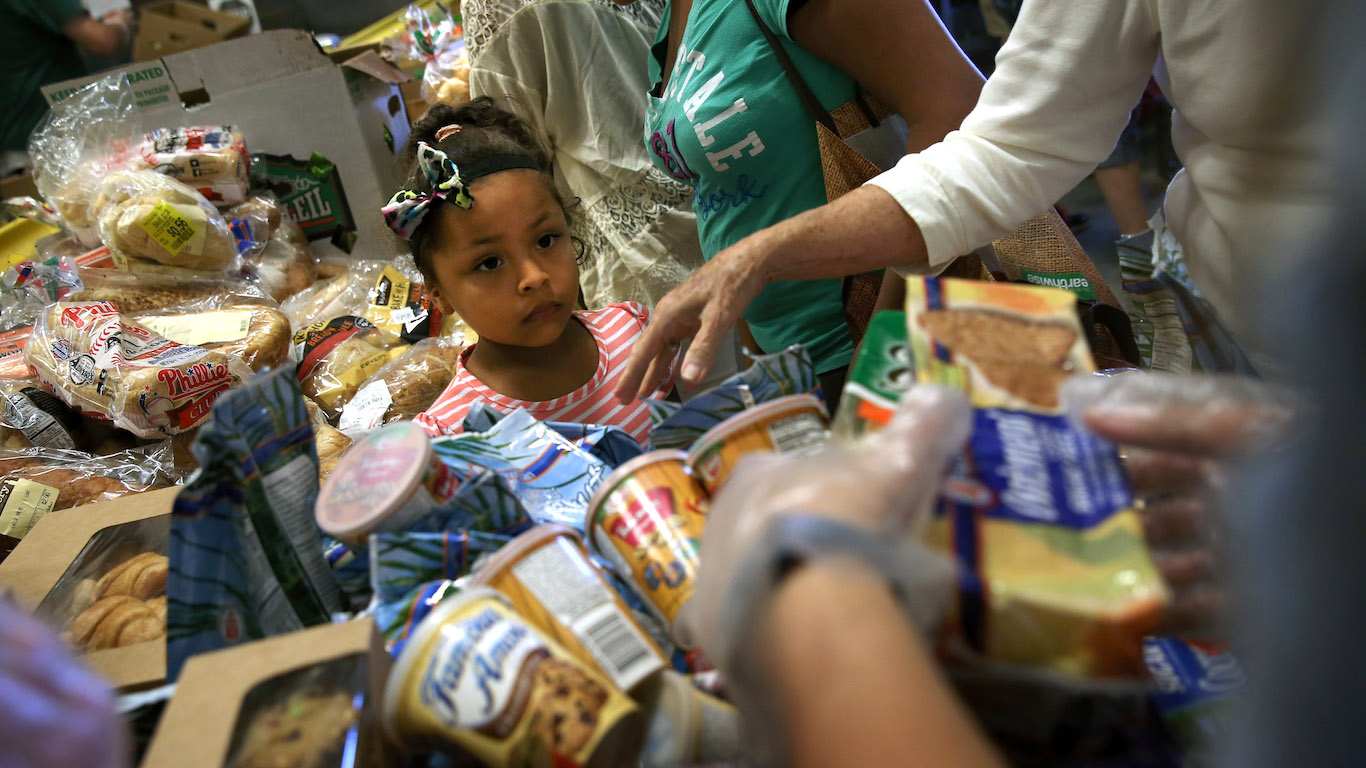
The United States is one of the most affluent nations on earth. Our agricultural resources are substantial, with over 1 billion acres of actively-used farm land. And yet an estimated one in eight American households face difficulties obtaining enough food to adequately feed the whole family over the course of the year.
Part of the reason for this lack of resources is the sheer amount of food wasted in this country. American consumers and retailers waste tens of billions of pounds of food annually. Over 40 million Americans struggle to afford food every day. As much as half of all food produced in the United States is wasted. The vast amount of wasted food in the United States — $162 billion a year — is especially tragic given that there are well over 40 million Americans who lack sufficient access to healthy, quality food. It is one of today’s biggest public health issues.
The U.S. Department of Agriculture measures the share of residents who live on low incomes and also lack access to nearby grocery stores and from that data derives the food insecurity rate. Food insecurity measures the share of households who report inconsistent access to adequate food..This could be caused by the scarcity of nearby stores — low access to food, and it can also be the result of poverty.
In all U.S. states, there is at least one county where over one in 10 residents do not have consistent access to the food they need on a daily basis. In some U.S. counties or county equivalents, more than one in three residents are at risk of going hungry. Across the country, 12.6% of residents receive nutritional assistance in the form of SNAP benefits, also known as food stamps. In the counties going hungry in every state, as many as 18% of residents rely on SNAP.
Food insecurity can be exacerbated by poverty and food deserts — places where there are relatively few if any food options. Many counties on this list are home to or overlap with American Indian reservations, which, due to unique business regulations, poor access to amenities, as well as housing challenges, have historically faced extreme rural poverty.
To determine the county going hungry in every state, 24/7 Wall St. reviewed data from the national food bank network Feeding America to determine the U.S. counties and county equivalents where the largest share of residents don’t get enough to eat.
Click here to see counties going hungry in every state

Alabama: Greene County
> County pop. with inconsistent access to food: 29.7% (2,540 people)
> State pop. with inconsistent access to food: 16.3% (795,760 people)
> County poverty rate: 38.8% (state: 16.9%)
> Households receiving SNAP benefits: 39.8%
> Households in rural areas: 100.0%
See all stories featuring: Alabama
[in-text-ad]
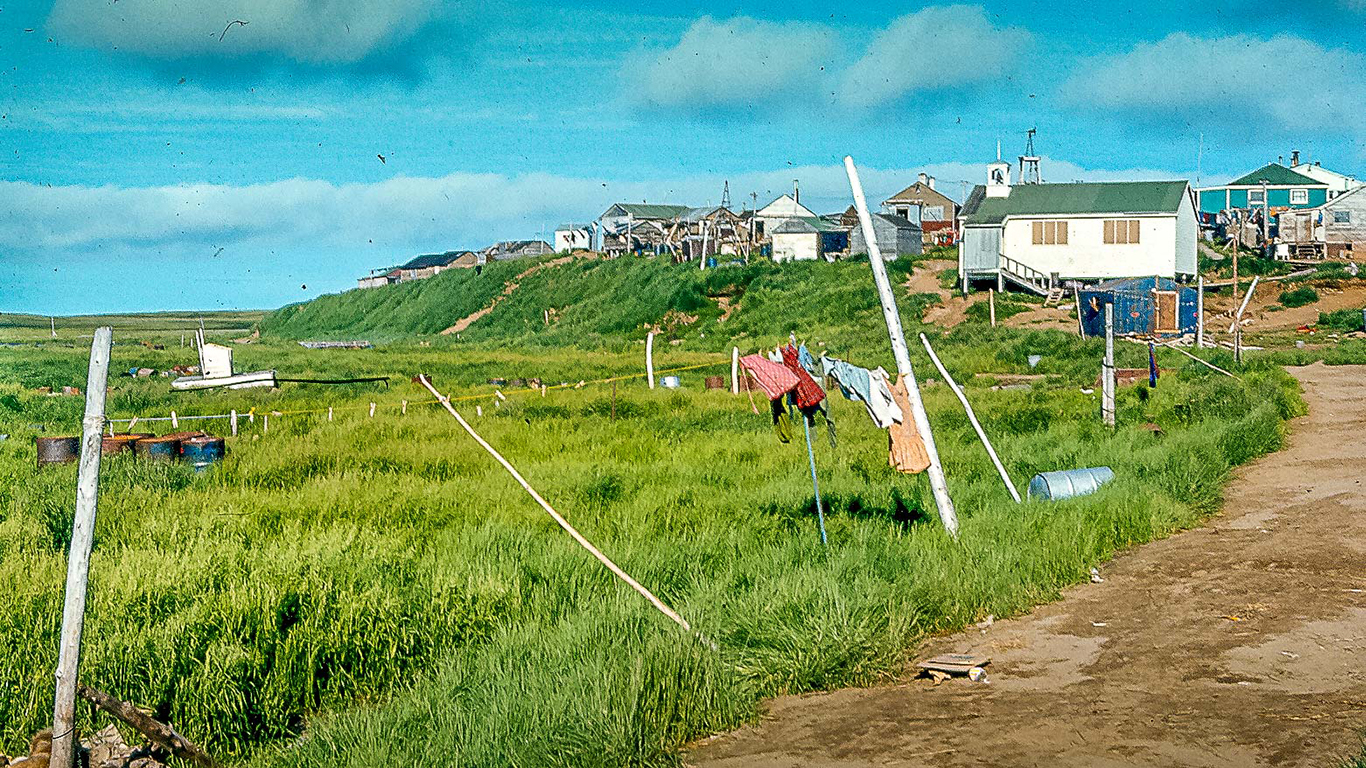
Alaska: Kusilvak Census Area
> County pop. with inconsistent access to food: 27.4% (2,230 people)
> State pop. with inconsistent access to food: 13.6% (100,310 people)
> County poverty rate: 39.1% (state: 11.1%)
> Households receiving SNAP benefits: 58.0%
> Households in rural areas: N/A
See all stories featuring: Alaska
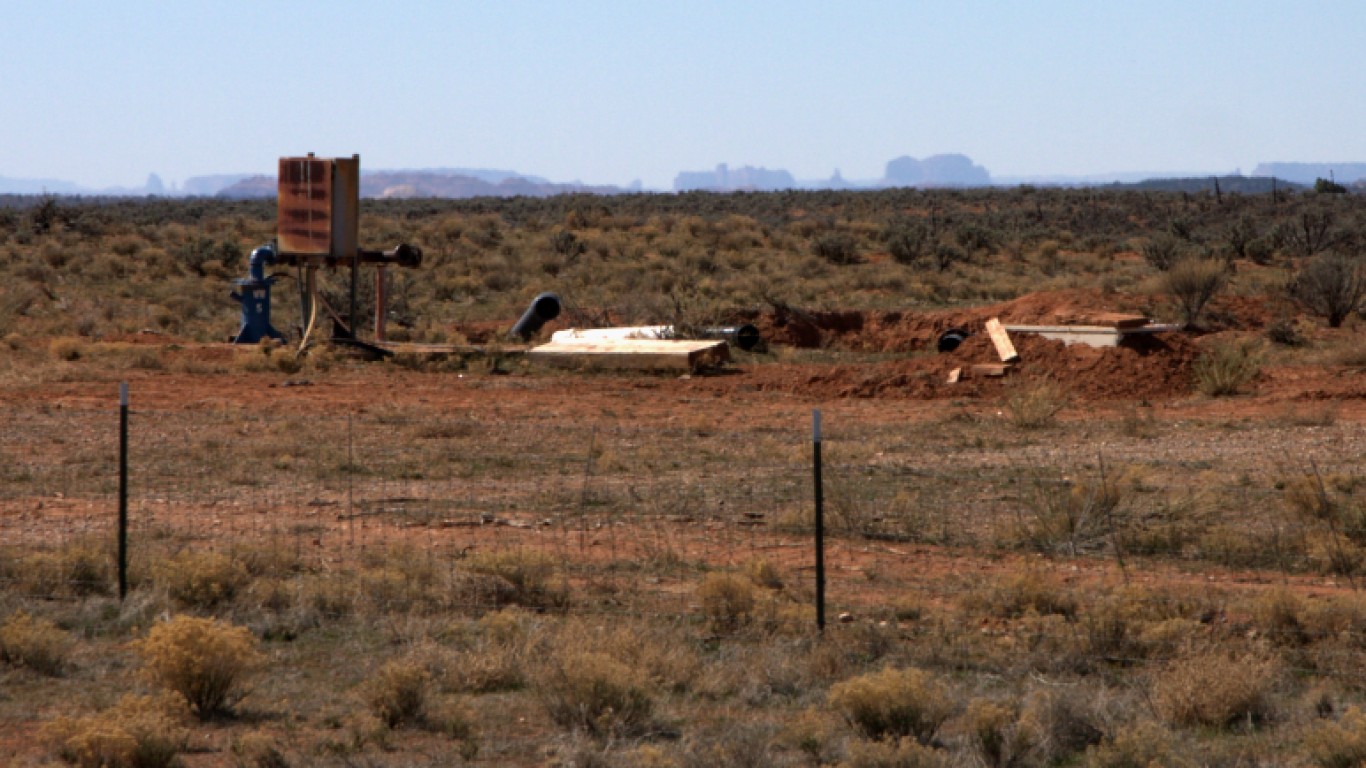
Arizona: Apache County
> County pop. with inconsistent access to food: 24.2% (17,330 people)
> State pop. with inconsistent access to food: 14.0% (979,170 people)
> County poverty rate: 35.9% (state: 14.9%)
> Households receiving SNAP benefits: 26.3%
> Households in rural areas: 78.2%
See all stories featuring: Arizona

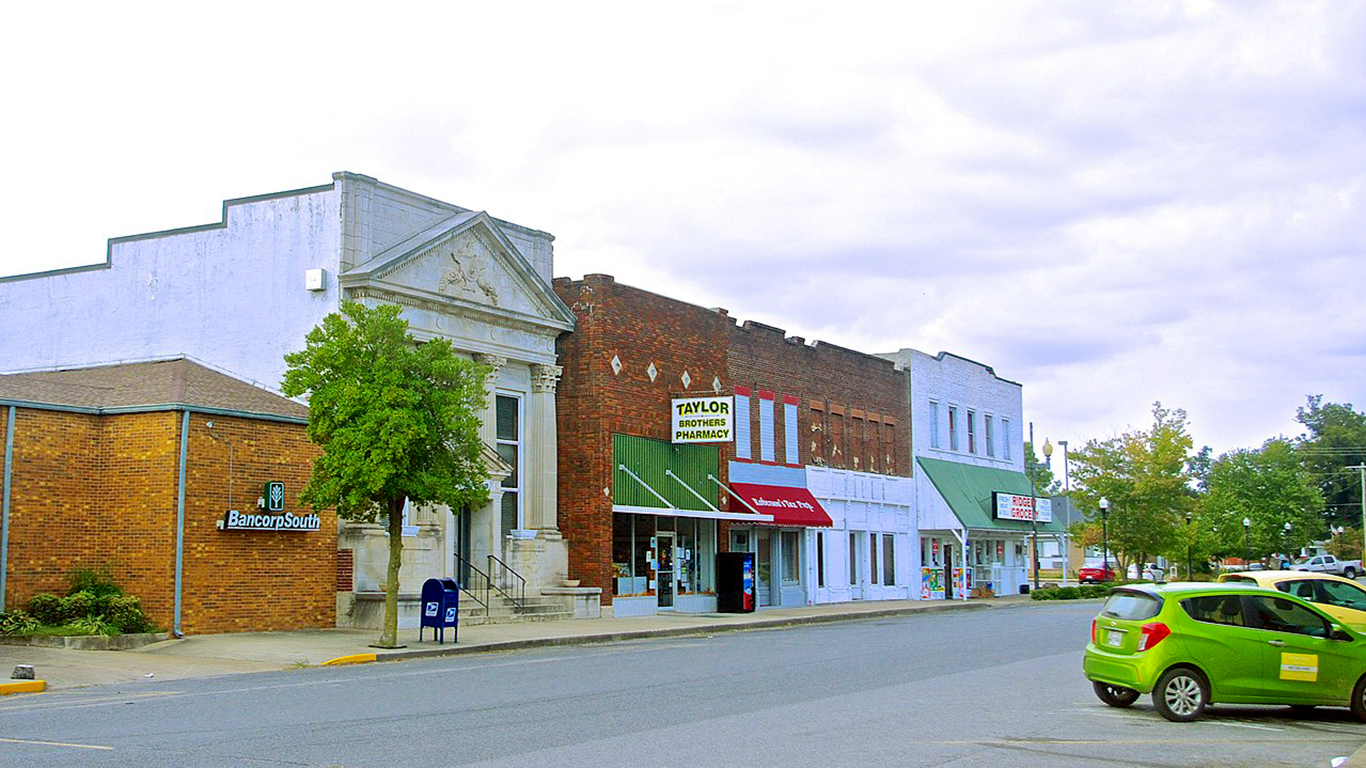
Arkansas: Phillips County
> County pop. with inconsistent access to food: 29.5% (5,750 people)
> State pop. with inconsistent access to food: 17.3% (518,960 people)
> County poverty rate: 33.0% (state: 16.4%)
> Households receiving SNAP benefits: 30.8%
> Households in rural areas: 49.0%
See all stories featuring: Arkansas
[in-text-ad-2]

California: Siskiyou County
> County pop. with inconsistent access to food: 16.9% (7,340 people)
> State pop. with inconsistent access to food: 11.0% (4,354,400 people)
> County poverty rate: 20.7% (state: 13.3%)
> Households receiving SNAP benefits: 12.1%
> Households in rural areas: 68.4%
See all stories featuring: California
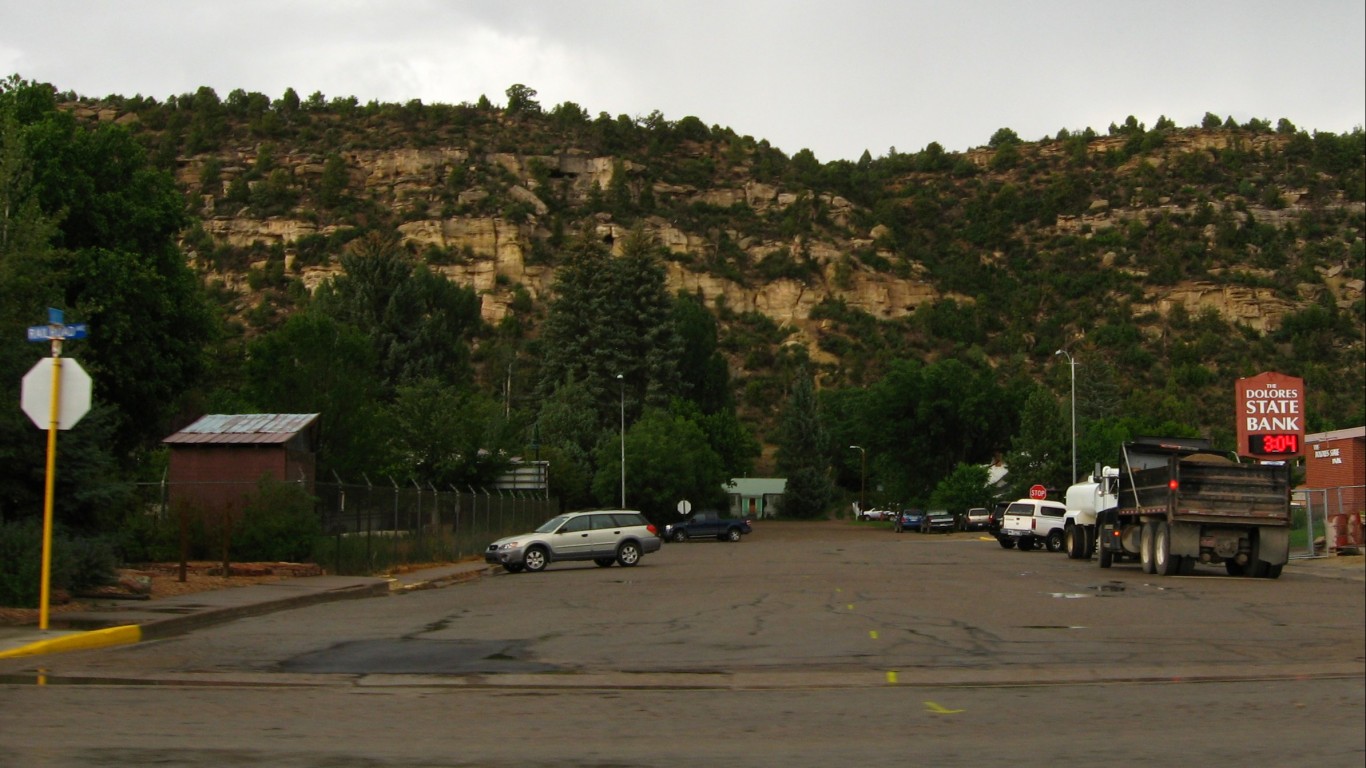
Colorado: Montezuma County
> County pop. with inconsistent access to food: 13.2% (3,410 people)
> State pop. with inconsistent access to food: 10.6% (596,150 people)
> County poverty rate: 16.8% (state: 10.3%)
> Households receiving SNAP benefits: 11.0%
> Households in rural areas: 68.7%
See all stories featuring: Colorado
[in-text-ad]
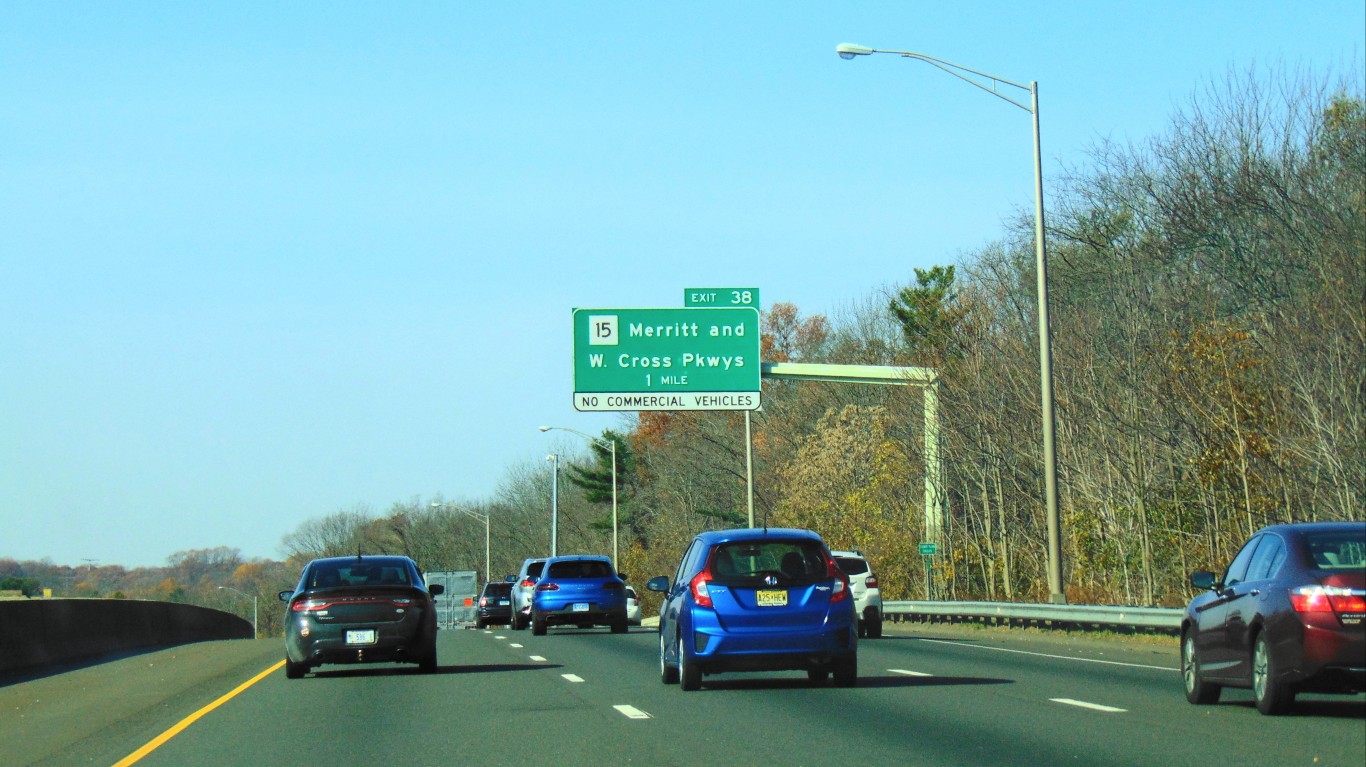
Connecticut: New Haven County
> County pop. with inconsistent access to food: 12.1% (104,190 people)
> State pop. with inconsistent access to food: 11.3% (406,810 people)
> County poverty rate: 12.1% (state: 9.6%)
> Households receiving SNAP benefits: 15.1%
> Households in rural areas: 3.3%
See all stories featuring: Connecticut

Delaware: Kent County
> County pop. with inconsistent access to food: 12.9% (22,400 people)
> State pop. with inconsistent access to food: 12.2% (117,320 people)
> County poverty rate: 13.0% (state: 13.6%)
> Households receiving SNAP benefits: 11.3%
> Households in rural areas: 27.2%
See all stories featuring: Delaware
Florida: Gadsden County
> County pop. with inconsistent access to food: 22.2% (10,260 people)
> State pop. with inconsistent access to food: 13.4% (2,806,770 people)
> County poverty rate: 24.4% (state: 14.0%)
> Households receiving SNAP benefits: 25.7%
> Households in rural areas: 68.5%
See all stories featuring: Florida
[in-text-ad-2]
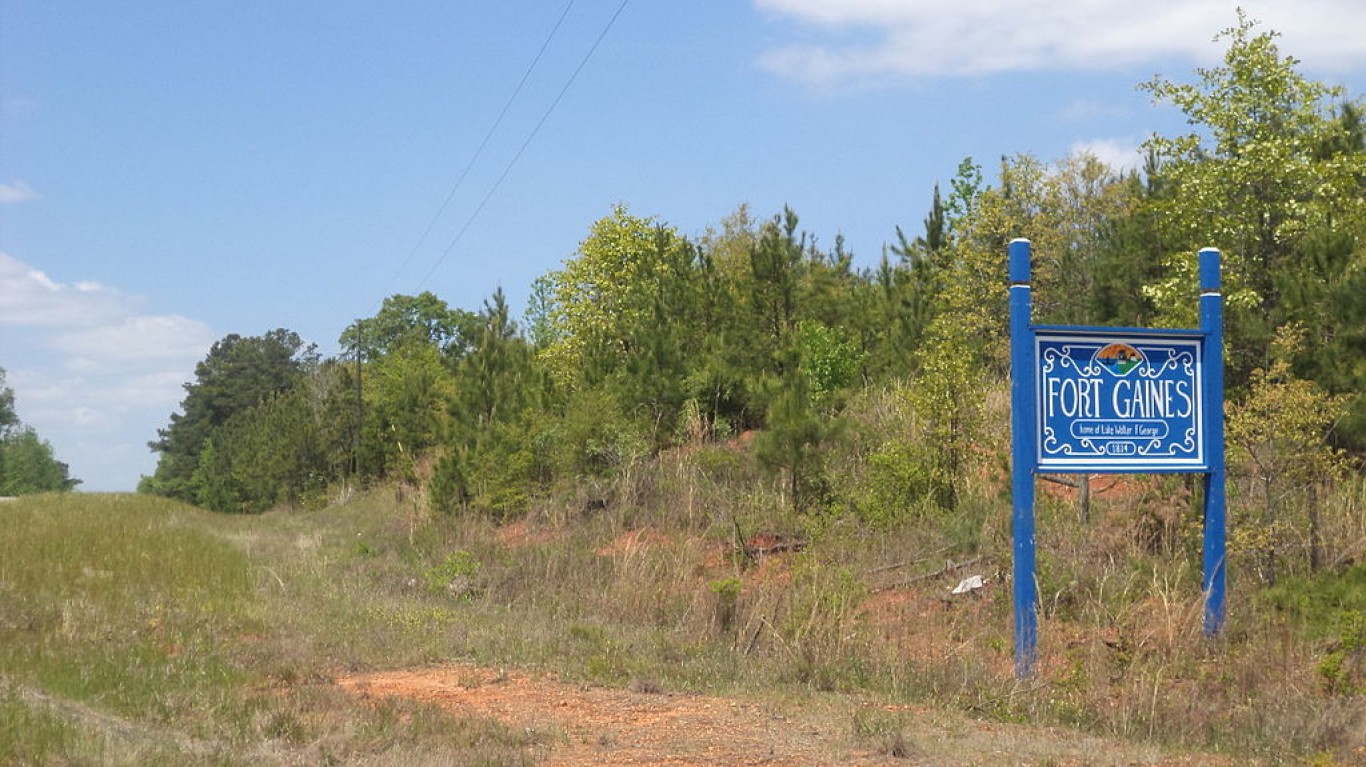
Georgia: Clay County
> County pop. with inconsistent access to food: 27.4% (830 people)
> State pop. with inconsistent access to food: 14.4% (1,501,680 people)
> County poverty rate: 41.4% (state: 14.9%)
> Households receiving SNAP benefits: 34.3%
> Households in rural areas: 100.0%
See all stories featuring: Georgia

Hawaii: Kalawao County
> County pop. with inconsistent access to food: 17.8% (20 people)
> State pop. with inconsistent access to food: 11.3% (161,270 people)
> County poverty rate: 12.7% (state: 9.5%)
> Households receiving SNAP benefits: 5.7%
> Households in rural areas: 100.0%
See all stories featuring: Hawaii
[in-text-ad]
Idaho: Madison County
> County pop. with inconsistent access to food: 19.0% (7,260 people)
> State pop. with inconsistent access to food: 12.3% (210,420 people)
> County poverty rate: 31.8% (state: 12.8%)
> Households receiving SNAP benefits: 22.9%
> Households in rural areas: 29.1%
See all stories featuring: Idaho
 24/7 Wall St.
Illinois: Alexander County
> County pop. with inconsistent access to food: 22.2% (1,500 people)
> State pop. with inconsistent access to food: 10.9% (1,395,970 people)
> County poverty rate: 33.4% (state: 12.6%)
> Households receiving SNAP benefits: 28.5%
> Households in rural areas: 56.4%
See all stories featuring: Illinois

Indiana: Marion County
> County pop. with inconsistent access to food: 17.4% (163,410 people)
> State pop. with inconsistent access to food: 13.3% (887,070 people)
> County poverty rate: 19.8% (state: 13.5%)
> Households receiving SNAP benefits: 21.1%
> Households in rural areas: 0.5%
See all stories featuring: Indiana
[in-text-ad-2]
Iowa: Story County
> County pop. with inconsistent access to food: 14.9% (14,280 people)
> State pop. with inconsistent access to food: 10.9% (341,890 people)
> County poverty rate: 22.0% (state: 10.7%)
> Households receiving SNAP benefits: 6.8%
> Households in rural areas: 17.1%
See all stories featuring: Iowa
Kansas: Riley County
> County pop. with inconsistent access to food: 17.5% (13,240 people)
> State pop. with inconsistent access to food: 12.7% (370,860 people)
> County poverty rate: 22.0% (state: 11.9%)
> Households receiving SNAP benefits: 5.5%
> Households in rural areas: 15.8%
See all stories featuring: Kansas
[in-text-ad]

Kentucky: Magoffin County
> County pop. with inconsistent access to food: 22.5% (2,880 people)
> State pop. with inconsistent access to food: 14.9% (662,360 people)
> County poverty rate: 28.6% (state: 17.2%)
> Households receiving SNAP benefits: 35.5%
> Households in rural areas: 100.0%
See all stories featuring: Kentucky

Louisiana: East Carroll Parish
> County pop. with inconsistent access to food: 33.1% (2,420 people)
> State pop. with inconsistent access to food: 16.5% (773,850 people)
> County poverty rate: 48.2% (state: 19.7%)
> Households receiving SNAP benefits: 31.5%
> Households in rural areas: 37.3%
See all stories featuring: Louisiana
Maine: Aroostook County
> County pop. with inconsistent access to food: 15.4% (10,620 people)
> State pop. with inconsistent access to food: 12.9% (172,650 people)
> County poverty rate: 17.5% (state: 11.1%)
> Households receiving SNAP benefits: 22.3%
> Households in rural areas: 82.5%
See all stories featuring: Maine
[in-text-ad-2]
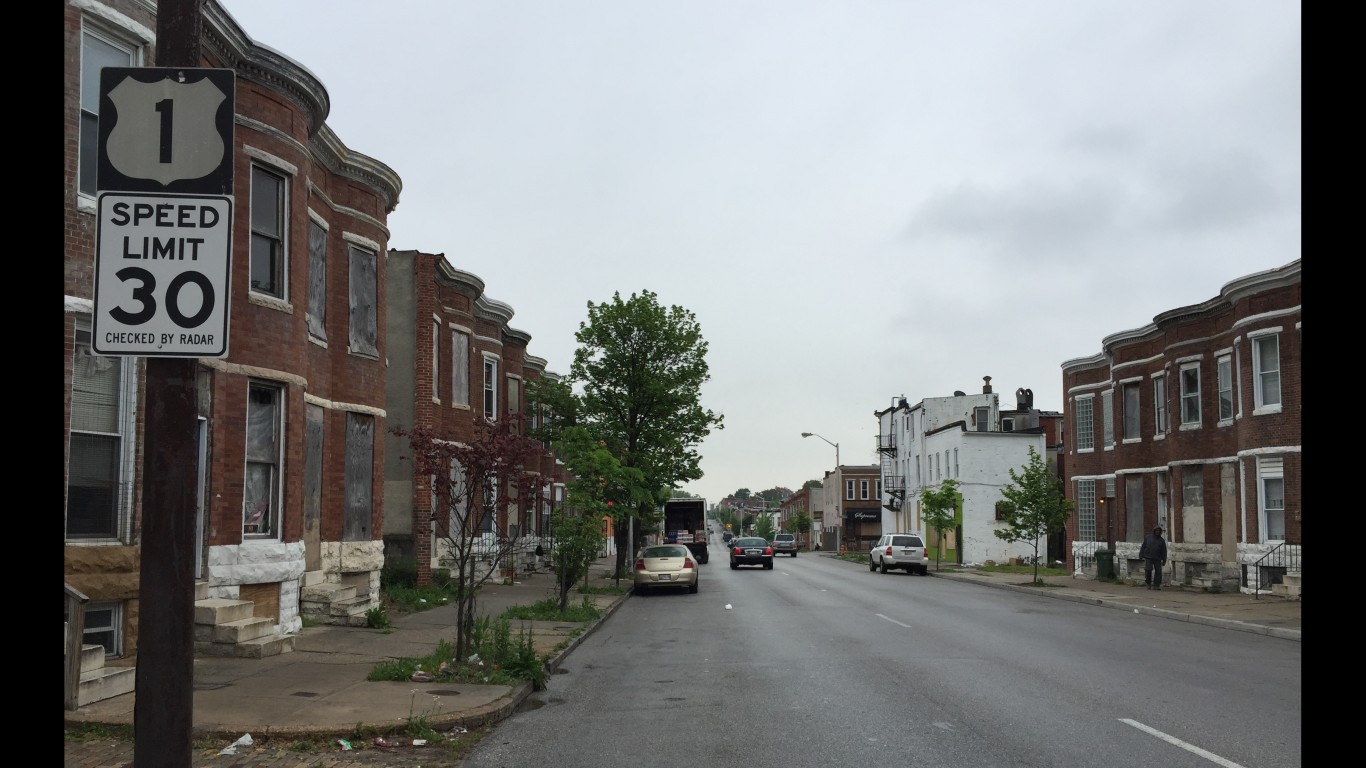
Maryland: Baltimore city
> County pop. with inconsistent access to food: 21.3% (131,860 people)
> State pop. with inconsistent access to food: 10.7% (650,200 people)
> County poverty rate: 22.4% (state: 9.3%)
> Households receiving SNAP benefits: 25.3%
> Households in rural areas: 0.0%
See all stories featuring: Maryland

Massachusetts: Suffolk County
> County pop. with inconsistent access to food: 13.7% (107,030 people)
> State pop. with inconsistent access to food: 9.0% (616,090 people)
> County poverty rate: 19.6% (state: 10.5%)
> Households receiving SNAP benefits: 18.7%
> Households in rural areas: 0.0%
See all stories featuring: Massachusetts
[in-text-ad]

Michigan: Wayne County
> County pop. with inconsistent access to food: 19.5% (344,440 people)
> State pop. with inconsistent access to food: 13.7% (1,369,250 people)
> County poverty rate: 23.7% (state: 14.2%)
> Households receiving SNAP benefits: 21.8%
> Households in rural areas: 0.6%
See all stories featuring: Michigan
 24/7 Wall St.
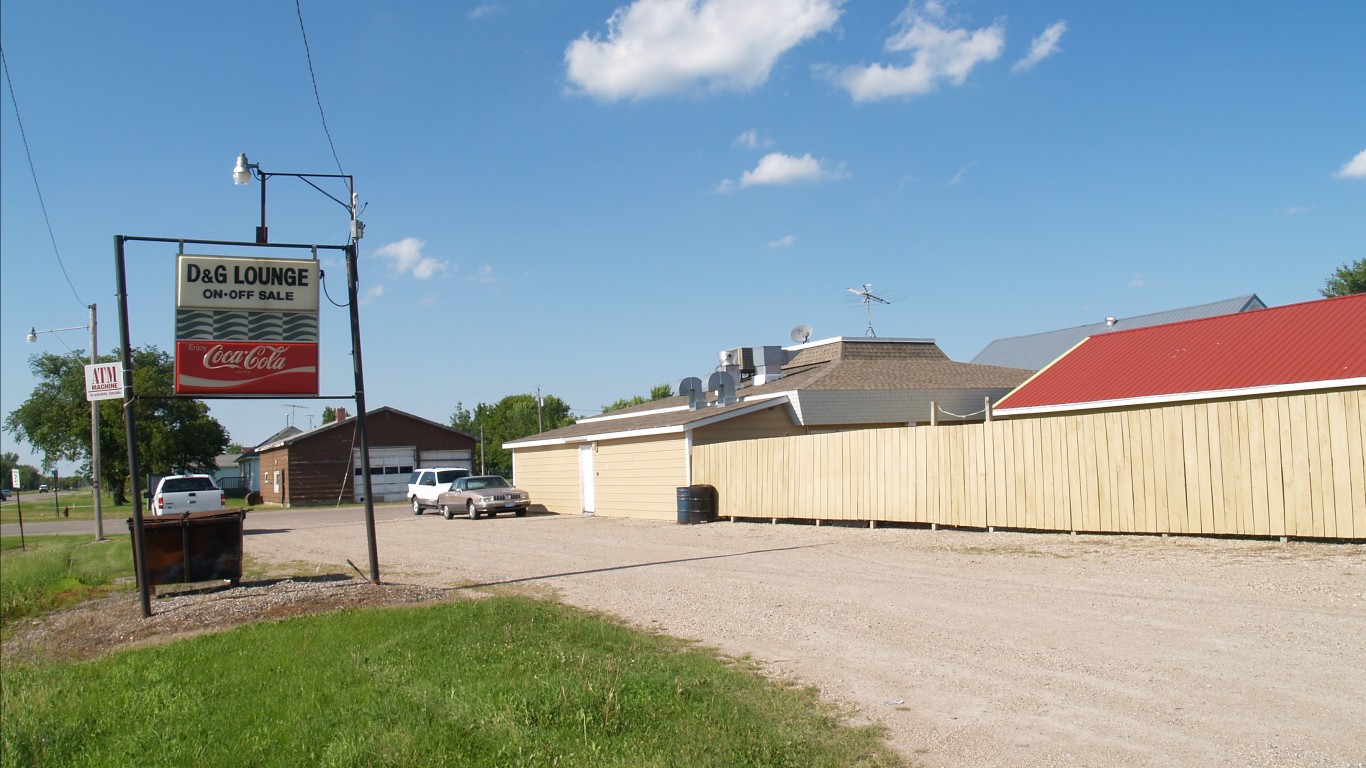
Minnesota: Mahnomen County
> County pop. with inconsistent access to food: 13.5% (740 people)
> State pop. with inconsistent access to food: 9.1% (504,760 people)
> County poverty rate: 22.7% (state: 9.5%)
> Households receiving SNAP benefits: 22.2%
> Households in rural areas: 100.0%
See all stories featuring: Minnesota

Mississippi: Jefferson County
> County pop. with inconsistent access to food: 36.3% (2,710 people)
> State pop. with inconsistent access to food: 19.2% (573,610 people)
> County poverty rate: 47.0% (state: 19.8%)
> Households receiving SNAP benefits: 33.7%
> Households in rural areas: 100.0%
See all stories featuring: Mississippi
[in-text-ad-2]

Missouri: St. Louis city
> County pop. with inconsistent access to food: 23.3% (73,300 people)
> State pop. with inconsistent access to food: 14.2% (865,400 people)
> County poverty rate: 25.0% (state: 13.4%)
> Households receiving SNAP benefits: 22.3%
> Households in rural areas: 0.0%
See all stories featuring: Missouri

Montana: Big Horn County
> County pop. with inconsistent access to food: 20.2% (2,690 people)
> State pop. with inconsistent access to food: 11.1% (116,120 people)
> County poverty rate: 26.8% (state: 12.5%)
> Households receiving SNAP benefits: 20.1%
> Households in rural areas: 69.3%
See all stories featuring: Montana
[in-text-ad]
Nebraska: Thurston County
> County pop. with inconsistent access to food: 18.6% (1,310 people)
> State pop. with inconsistent access to food: 11.6% (223,170 people)
> County poverty rate: 30.5% (state: 10.8%)
> Households receiving SNAP benefits: 21.7%
> Households in rural areas: 100.0%
See all stories featuring: Nebraska

Nevada: Mineral County
> County pop. with inconsistent access to food: 15.1% (670 people)
> State pop. with inconsistent access to food: 12.2% (365,160 people)
> County poverty rate: 20.3% (state: 13.0%)
> Households receiving SNAP benefits: 19.2%
> Households in rural areas: 34.2%
See all stories featuring: Nevada

New Hampshire: Coos County
> County pop. with inconsistent access to food: 11.3% (3,630 people)
> State pop. with inconsistent access to food: 9.1% (122,860 people)
> County poverty rate: 13.3% (state: 7.7%)
> Households receiving SNAP benefits: 25.0%
> Households in rural areas: 73.9%
See all stories featuring: New Hampshire
[in-text-ad-2]
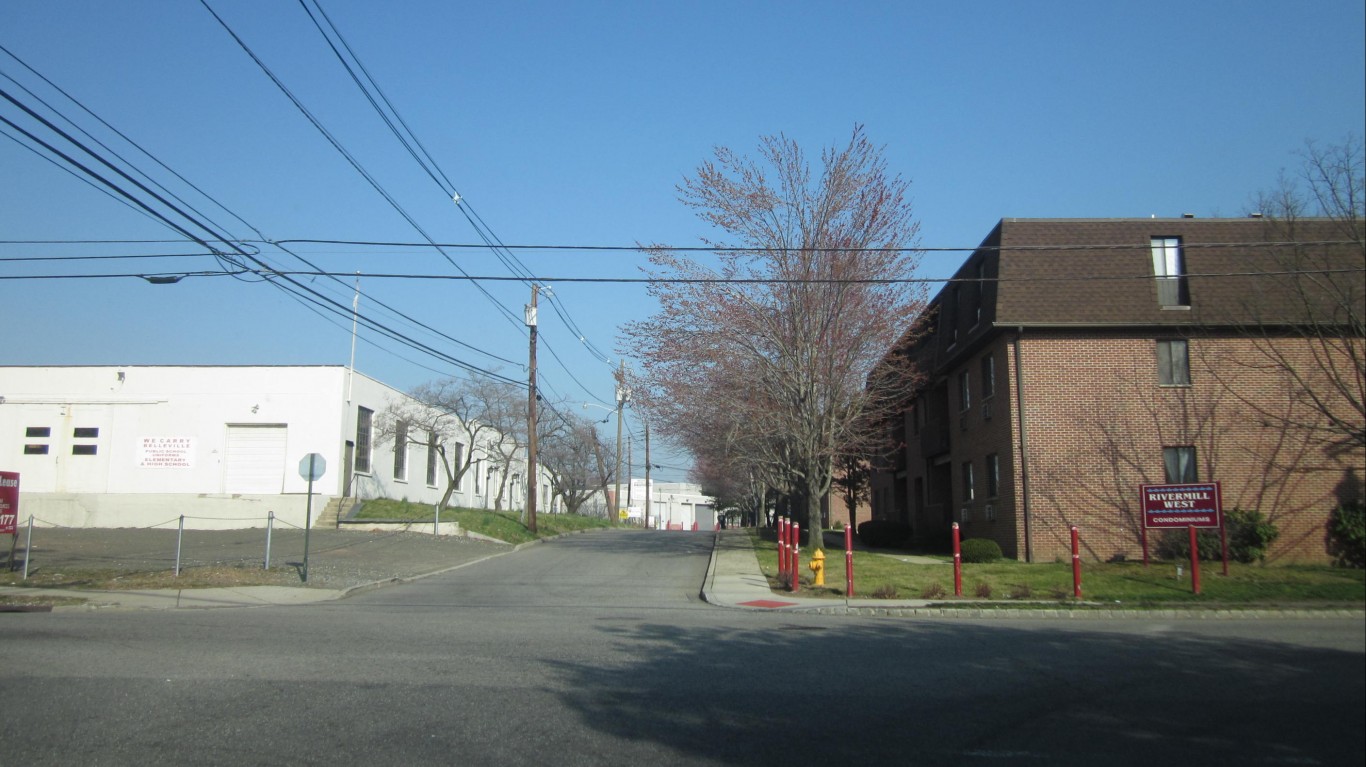
New Jersey: Essex County
> County pop. with inconsistent access to food: 16.3% (130,720 people)
> State pop. with inconsistent access to food: 9.6% (865,900 people)
> County poverty rate: 16.7% (state: 10.0%)
> Households receiving SNAP benefits: 15.4%
> Households in rural areas: 0.0%
See all stories featuring: New Jersey
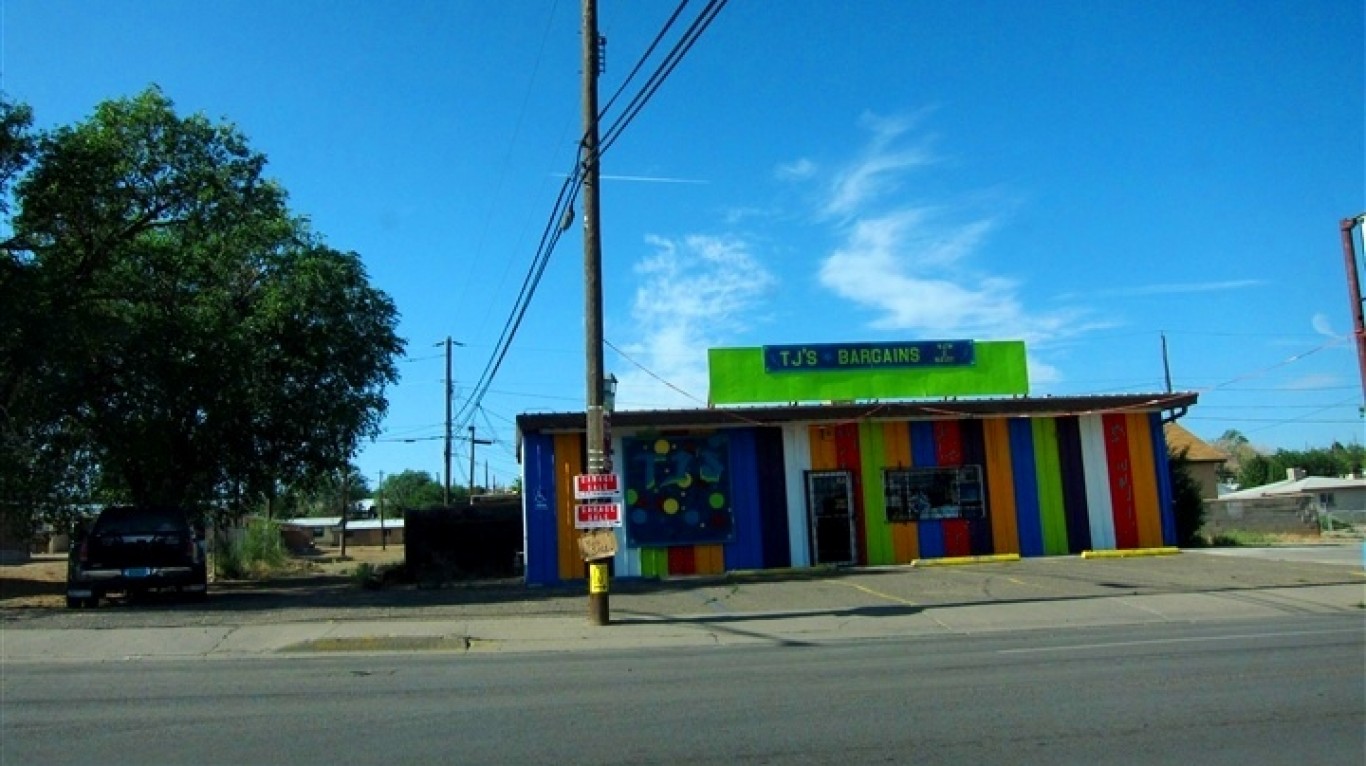
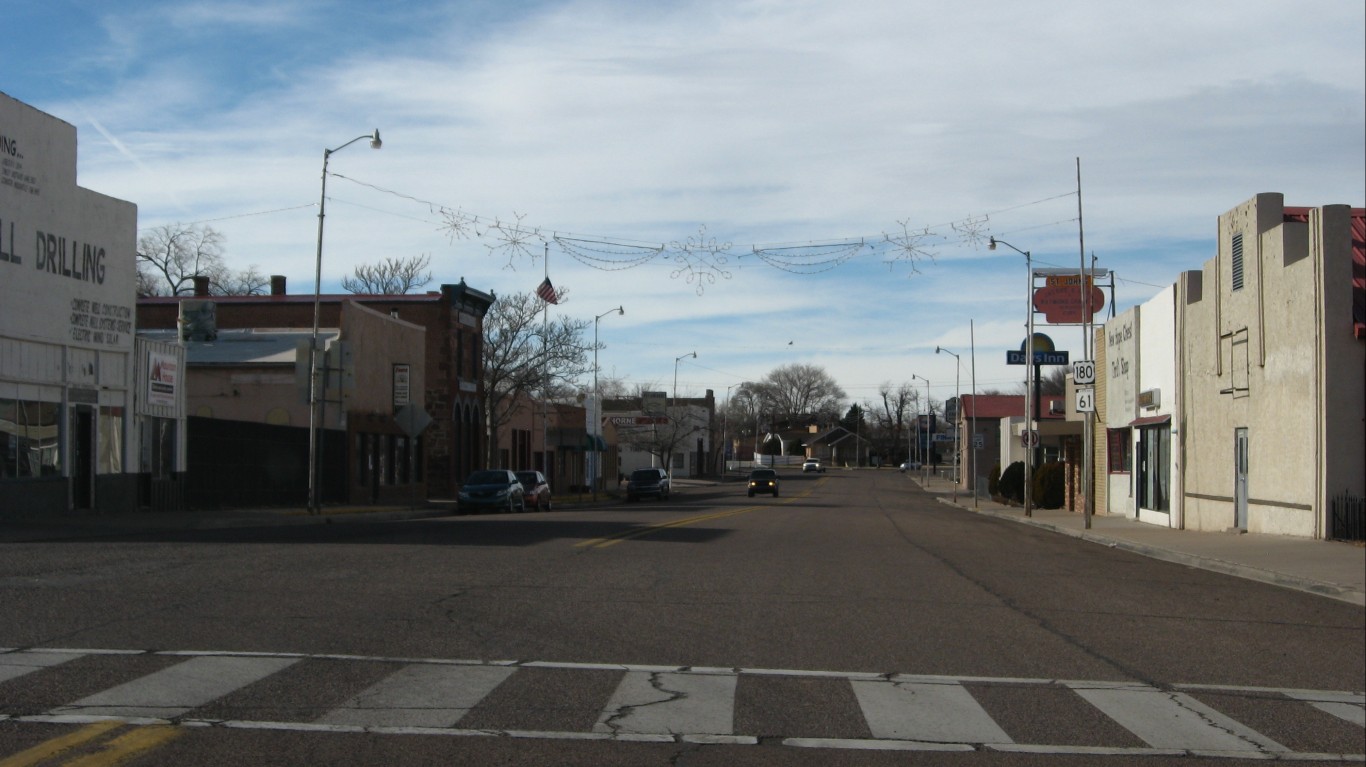
New Mexico: McKinley County
> County pop. with inconsistent access to food: 26.0% (18,920 people)
> State pop. with inconsistent access to food: 15.5% (324,000 people)
> County poverty rate: 37.5% (state: 19.7%)
> Households receiving SNAP benefits: 25.7%
> Households in rural areas: 59.3%
See all stories featuring: New Mexico
[in-text-ad]
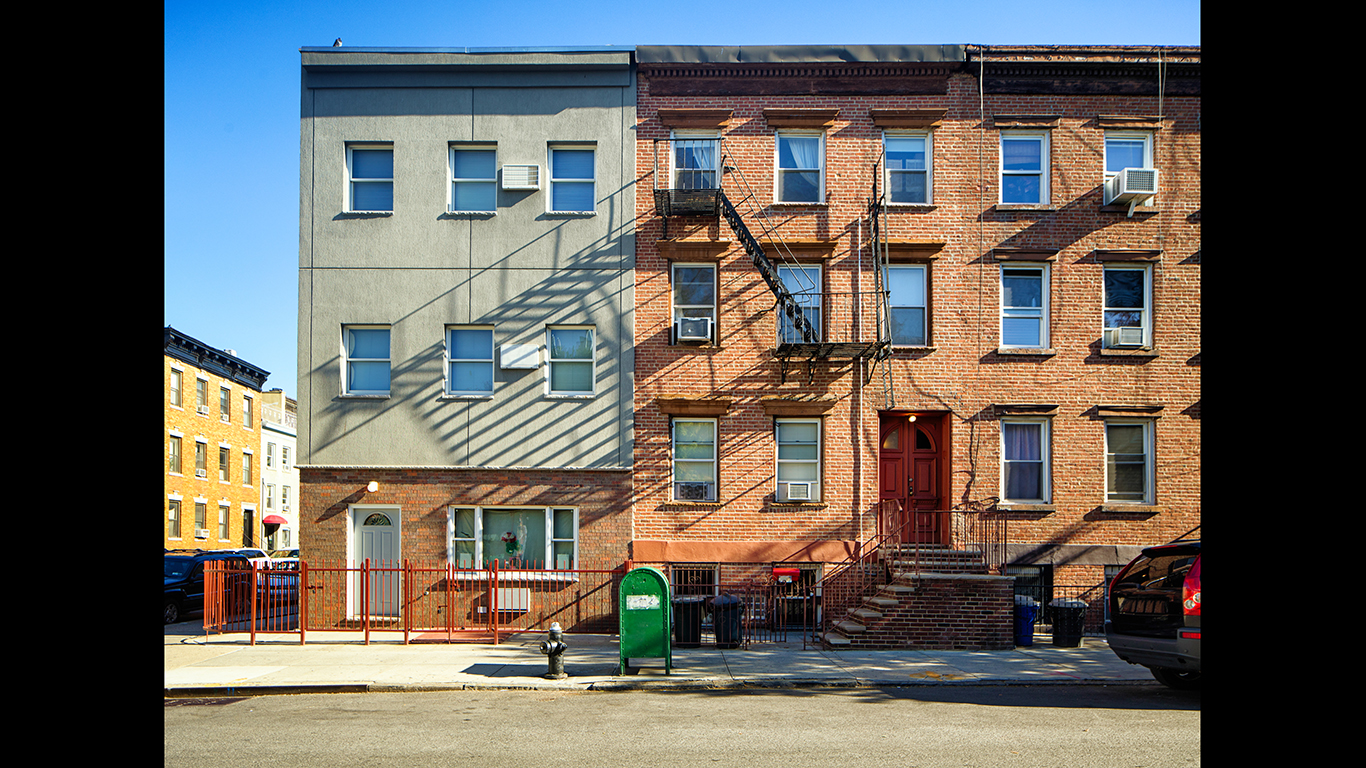
New York: Kings County
> County pop. with inconsistent access to food: 17.1% (451,740 people)
> State pop. with inconsistent access to food: 11.4% (2,261,250 people)
> County poverty rate: 21.9% (state: 14.1%)
> Households receiving SNAP benefits: 23.5%
> Households in rural areas: 0.0%
See all stories featuring: New York
 24/7 Wall St.
North Carolina: Edgecombe County
> County pop. with inconsistent access to food: 24.1% (13,000 people)
> State pop. with inconsistent access to food: 14.6% (1,503,050 people)
> County poverty rate: 24.6% (state: 14.7%)
> Households receiving SNAP benefits: 28.3%
> Households in rural areas: 44.2%
See all stories featuring: North Carolina
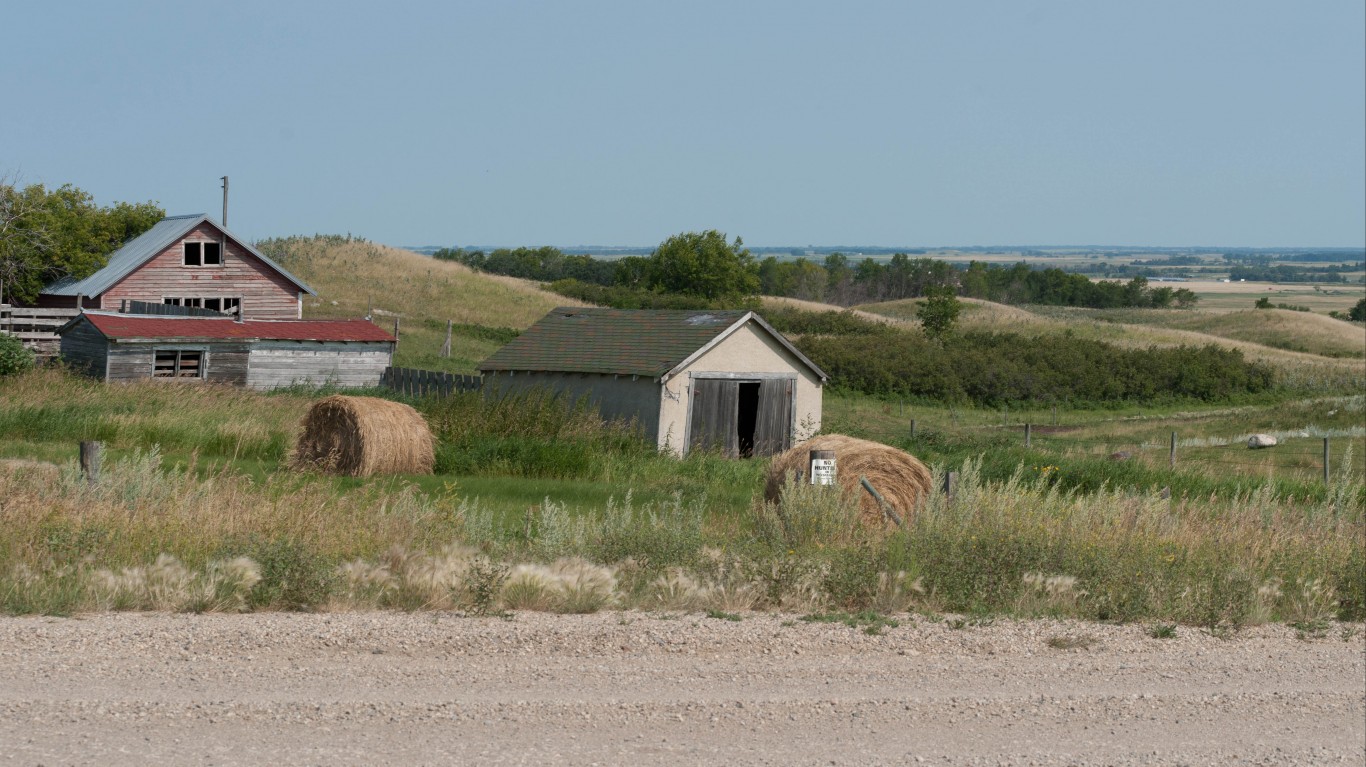
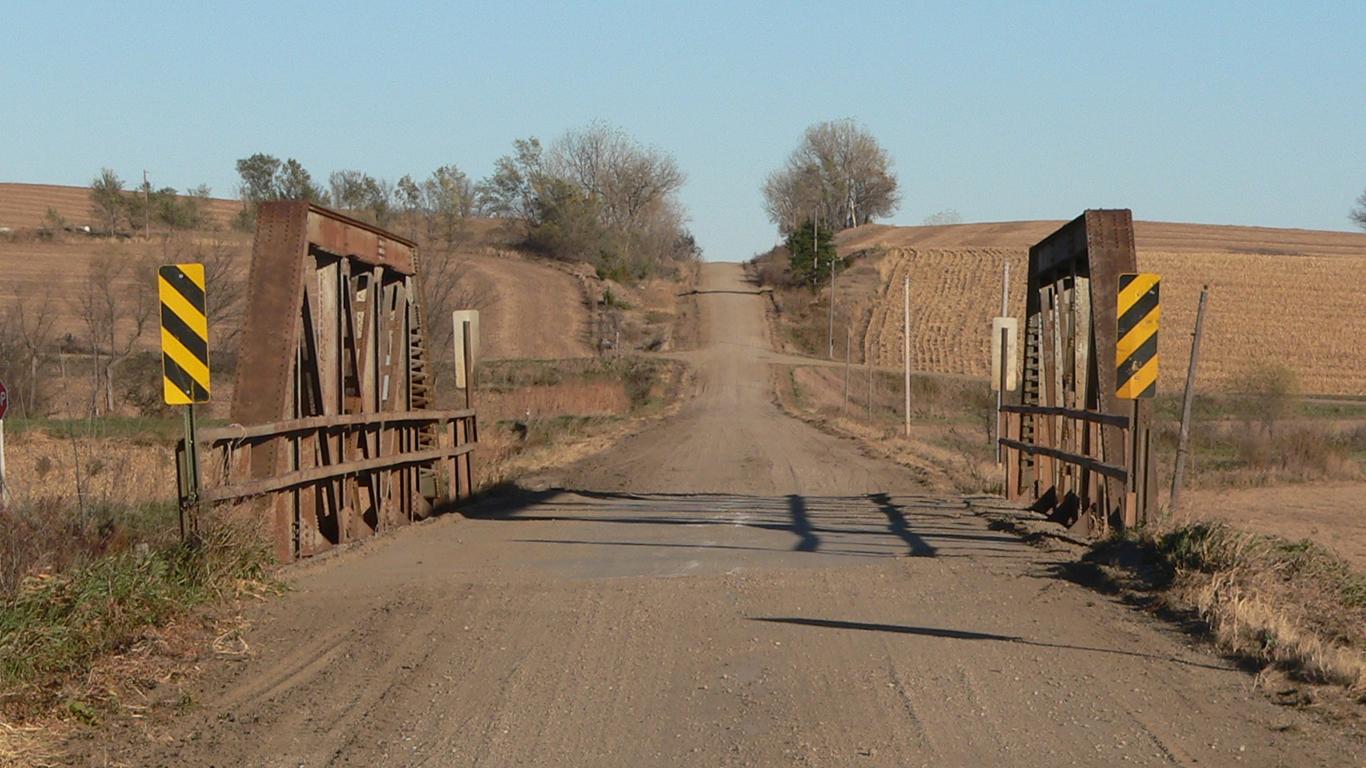
North Dakota: Rolette County
> County pop. with inconsistent access to food: 16.8% (2,460 people)
> State pop. with inconsistent access to food: 7.3% (54,930 people)
> County poverty rate: 32.4% (state: 10.3%)
> Households receiving SNAP benefits: 29.1%
> Households in rural areas: 100.0%
See all stories featuring: North Dakota
[in-text-ad-2]
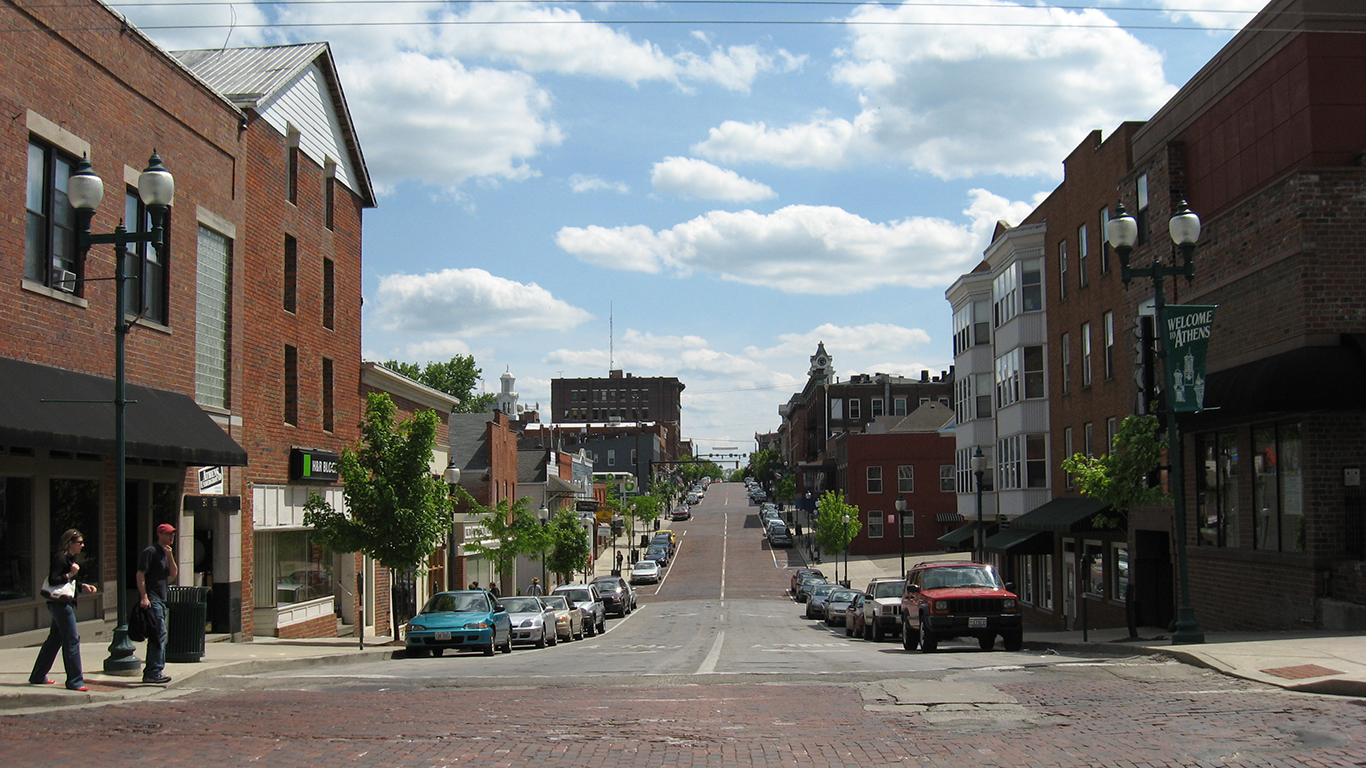
Ohio: Athens County
> County pop. with inconsistent access to food: 19.3% (12,680 people)
> State pop. with inconsistent access to food: 14.5% (1,691,910 people)
> County poverty rate: 30.2% (state: 14.0%)
> Households receiving SNAP benefits: 19.1%
> Households in rural areas: 49.3%
See all stories featuring: Ohio
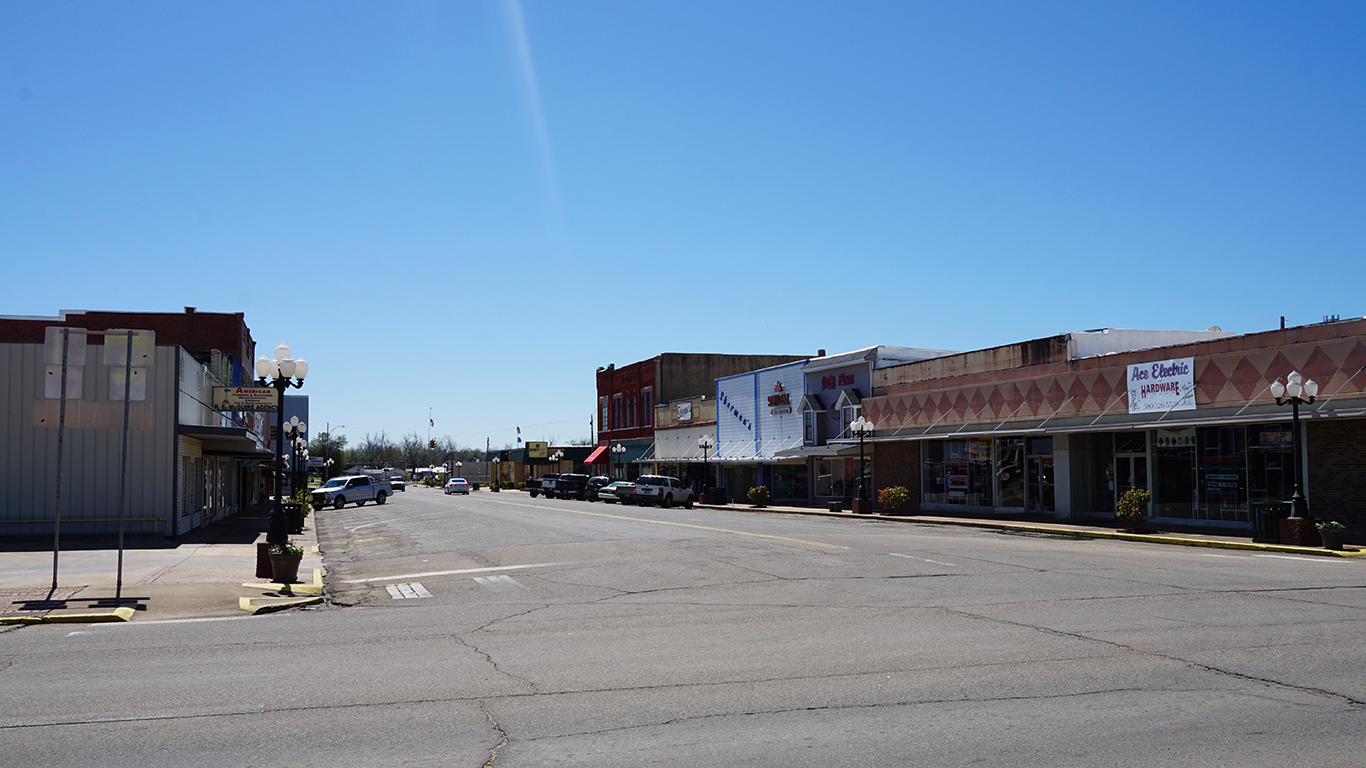
Oklahoma: Choctaw County
> County pop. with inconsistent access to food: 21.7% (3,240 people)
> State pop. with inconsistent access to food: 15.8% (621,370 people)
> County poverty rate: 31.0% (state: 15.8%)
> Households receiving SNAP benefits: 27.4%
> Households in rural areas: 67.1%
See all stories featuring: Oklahoma
[in-text-ad]
Oregon: Lake County
> County pop. with inconsistent access to food: 15.8% (1,230 people)
> State pop. with inconsistent access to food: 12.3% (510,080 people)
> County poverty rate: 20.0% (state: 13.2%)
> Households receiving SNAP benefits: 38.7%
> Households in rural areas: 65.5%
See all stories featuring: Oregon
 24/7 Wall St.
Pennsylvania: Philadelphia County
> County pop. with inconsistent access to food: 20.1% (314,820 people)
> State pop. with inconsistent access to food: 12.0% (1,534,710 people)
> County poverty rate: 25.8% (state: 12.5%)
> Households receiving SNAP benefits: 24.5%
> Households in rural areas: 0.0%
See all stories featuring: Pennsylvania
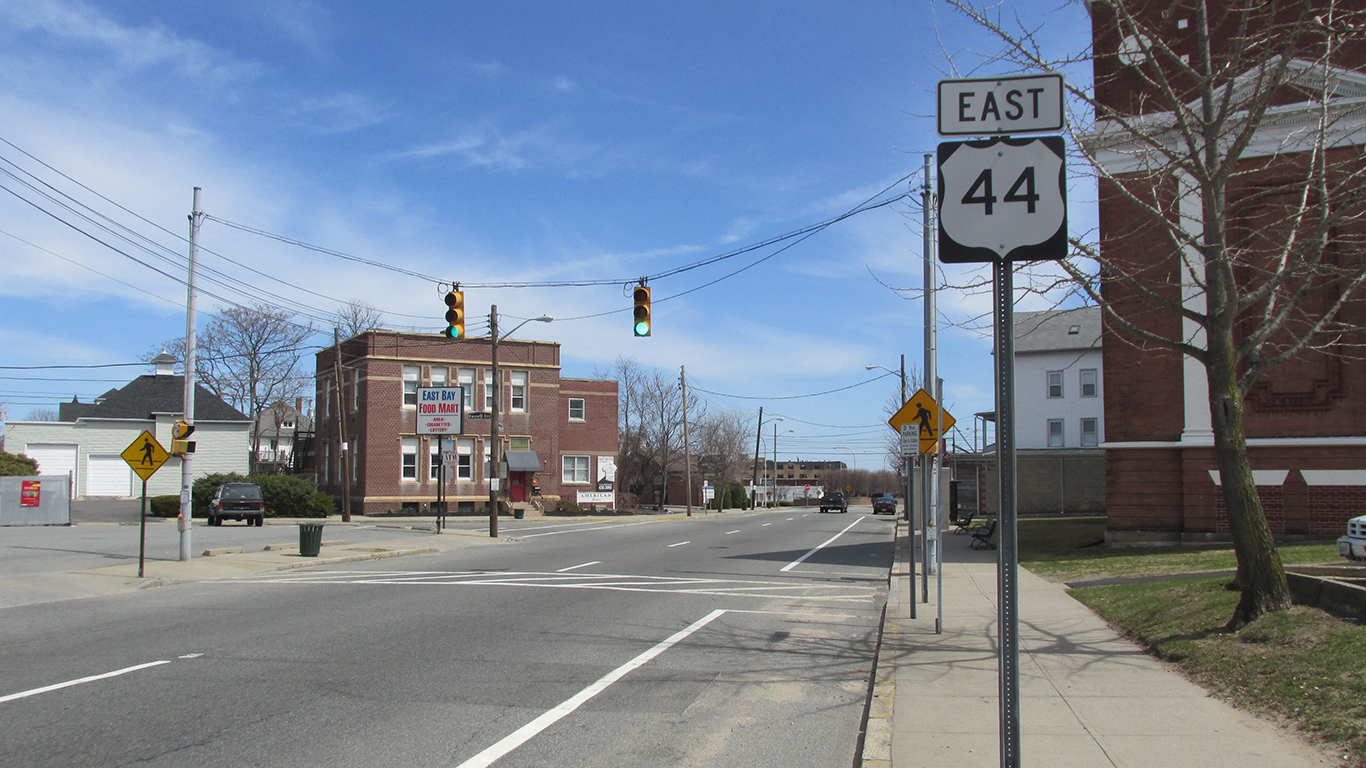
Rhode Island: Providence County
> County pop. with inconsistent access to food: 12.6% (79,720 people)
> State pop. with inconsistent access to food: 11.4% (120,590 people)
> County poverty rate: 16.7% (state: 11.6%)
> Households receiving SNAP benefits: 20.5%
> Households in rural areas: 5.1%
See all stories featuring: Rhode Island
[in-text-ad-2]

South Carolina: Allendale County
> County pop. with inconsistent access to food: 24.1% (2,270 people)
> State pop. with inconsistent access to food: 13.5% (679,990 people)
> County poverty rate: 30.4% (state: 15.4%)
> Households receiving SNAP benefits: 32.5%
> Households in rural areas: 65.1%
See all stories featuring: South Carolina
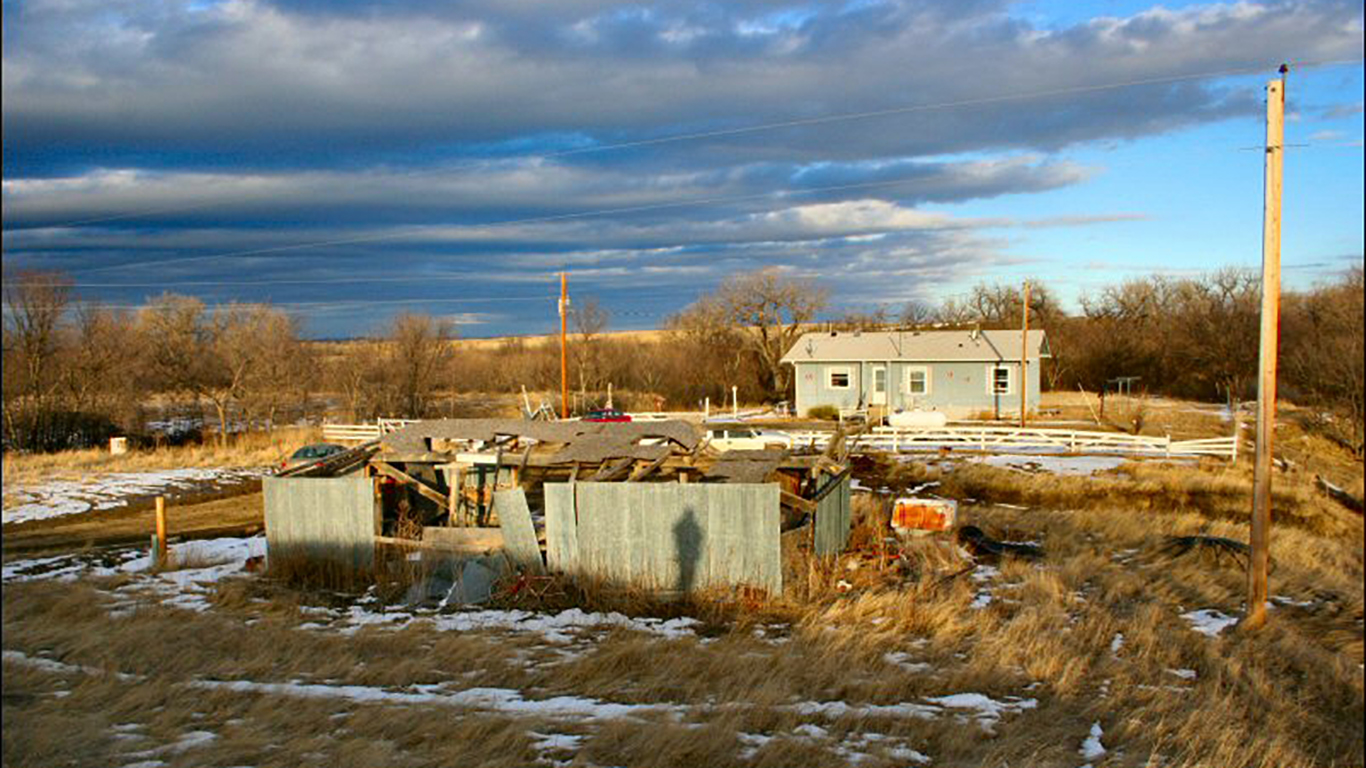
South Dakota: Oglala Lakota County
> County pop. with inconsistent access to food: 27.0% (3,860 people)
> State pop. with inconsistent access to food: 11.4% (99,190 people)
> County poverty rate: 51.9% (state: 13.0%)
> Households receiving SNAP benefits: 54.9%
> Households in rural areas: N/A
See all stories featuring: South Dakota
[in-text-ad]
Tennessee: Lake County
> County pop. with inconsistent access to food: 20.8% (1,580 people)
> State pop. with inconsistent access to food: 13.9% (934,310 people)
> County poverty rate: 29.9% (state: 15.0%)
> Households receiving SNAP benefits: 38.7%
> Households in rural areas: 100.0%
See all stories featuring: Tennessee
 24/7 Wall St.
Texas: San Augustine County
> County pop. with inconsistent access to food: 23.5% (1,970 people)
> State pop. with inconsistent access to food: 14.9% (4,217,470 people)
> County poverty rate: 24.4% (state: 14.7%)
> Households receiving SNAP benefits: 18.6%
> Households in rural areas: 100.0%
See all stories featuring: Texas
Utah: San Juan County
> County pop. with inconsistent access to food: 19.4% (2,950 people)
> State pop. with inconsistent access to food: 12.1% (373,850 people)
> County poverty rate: 28.4% (state: 9.7%)
> Households receiving SNAP benefits: 17.4%
> Households in rural areas: 81.5%
See all stories featuring: Utah
[in-text-ad-2]

Vermont: Essex County
> County pop. with inconsistent access to food: 13.1% (820 people)
> State pop. with inconsistent access to food: 11.9% (74,520 people)
> County poverty rate: 15.5% (state: 11.3%)
> Households receiving SNAP benefits: 15.4%
> Households in rural areas: 100.0%
See all stories featuring: Vermont
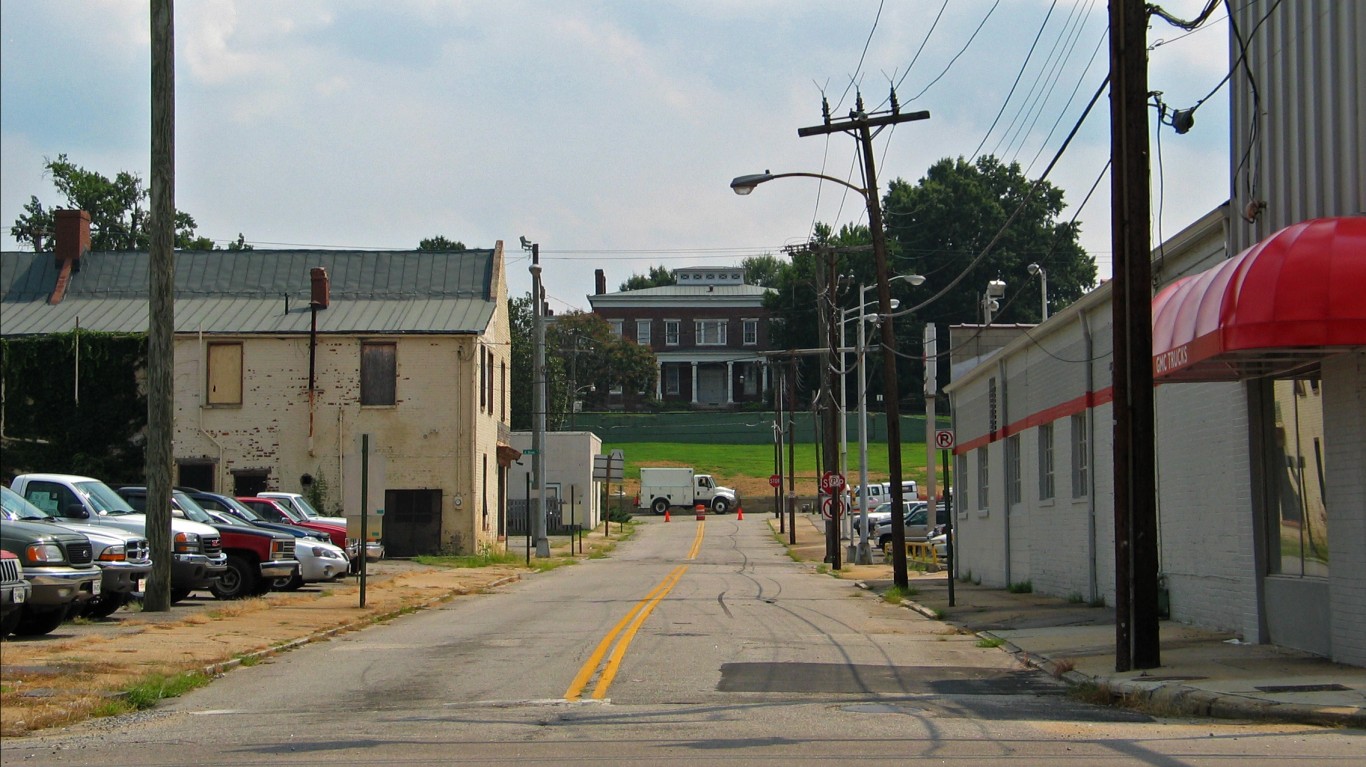
Virginia: Petersburg city
> County pop. with inconsistent access to food: 25.9% (8,280 people)
> State pop. with inconsistent access to food: 10.2% (863,390 people)
> County poverty rate: 27.6% (state: 10.6%)
> Households receiving SNAP benefits: 27.0%
> Households in rural areas: 2.0%
See all stories featuring: Virginia
[in-text-ad]
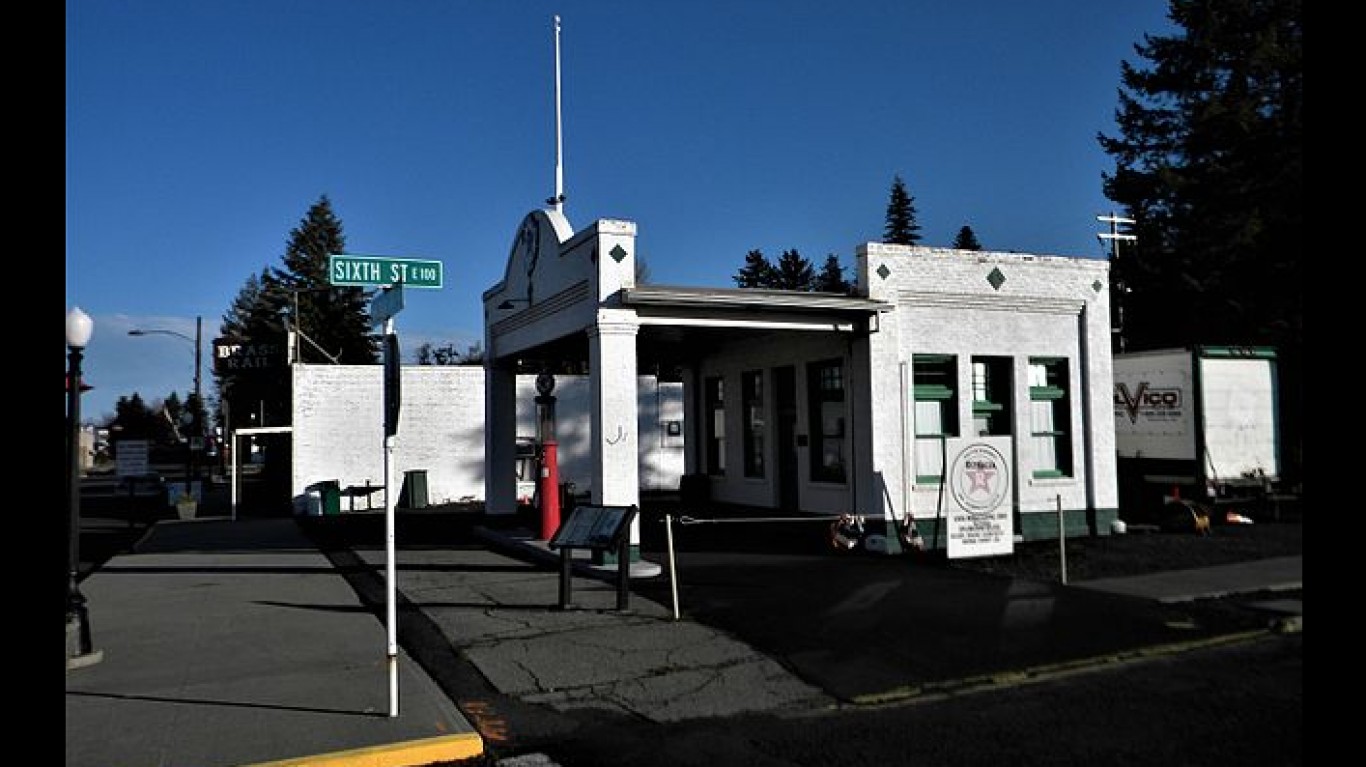
Washington: Whitman County
> County pop. with inconsistent access to food: 18.3% (8,760 people)
> State pop. with inconsistent access to food: 11.5% (848,990 people)
> County poverty rate: 27.5% (state: 11.0%)
> Households receiving SNAP benefits: 10.8%
> Households in rural areas: 31.2%
See all stories featuring: Washington
West Virginia: McDowell County
> County pop. with inconsistent access to food: 19.9% (3,930 people)
> State pop. with inconsistent access to food: 14.8% (268,070 people)
> County poverty rate: 34.9% (state: 19.1%)
> Households receiving SNAP benefits: 30.5%
> Households in rural areas: 86.1%
See all stories featuring: West Virginia
Wisconsin: Menominee County
> County pop. with inconsistent access to food: 17.2% (780 people)
> State pop. with inconsistent access to food: 10.0% (578,480 people)
> County poverty rate: 35.8% (state: 11.3%)
> Households receiving SNAP benefits: 30.7%
> Households in rural areas: 100.0%
See all stories featuring: Wisconsin
[in-text-ad-2]
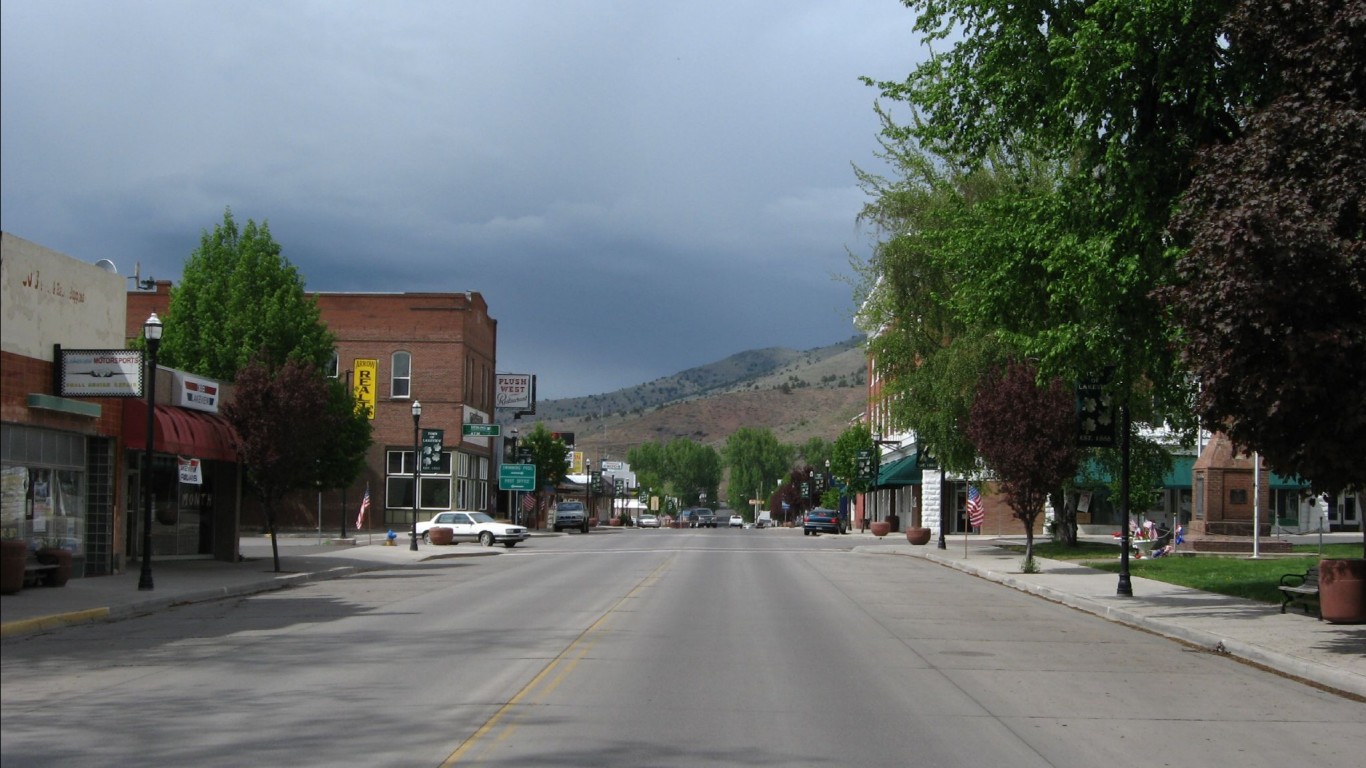
Wyoming: Albany County
> County pop. with inconsistent access to food: 16.3% (6,170 people)
> State pop. with inconsistent access to food: 12.3% (71,060 people)
> County poverty rate: 23.0% (state: 11.3%)
> Households receiving SNAP benefits: 4.3%
> Households in rural areas: 17.4%
See all stories featuring: Wyoming
Take Charge of Your Retirement In Just A Few Minutes (Sponsor)
Retirement planning doesn’t have to feel overwhelming. The key is finding expert guidance—and SmartAsset’s simple quiz makes it easier than ever for you to connect with a vetted financial advisor.
Here’s how it works:
- Answer a Few Simple Questions. Tell us a bit about your goals and preferences—it only takes a few minutes!
- Get Matched with Vetted Advisors Our smart tool matches you with up to three pre-screened, vetted advisors who serve your area and are held to a fiduciary standard to act in your best interests. Click here to begin
- Choose Your Fit Review their profiles, schedule an introductory call (or meet in person), and select the advisor who feel is right for you.
Why wait? Start building the retirement you’ve always dreamed of. Click here to get started today!
Thank you for reading! Have some feedback for us?
Contact the 24/7 Wall St. editorial team.
Latest from 24/7


Our expert who first called NVIDIA in 2009 is predicting 2025 will see a historic AI breakthrough.
You can follow him investing $500,000 of his own money on our top AI stocks for free.