Special Report
This American City Has the Most Vacant Homes

Published:
Last Updated:

The U.S. housing market is at one of its strongest points in decades — and U.S. vacancy rates reflect that strength. Nationwide, just 1.52% of single-owner homes and condos are vacant, one of the lowest points in years. The last time vacancy rates were so low was the 1990s.
To identify the American cities with the most vacancies, 24/7 Wall St. reviewed the number of single family homes and condos that are unoccupied in 15,957 ZIP codes. Occupancy status was determined by ATTOM Data Solutions using tax assessor data for the end of the third quarter of 2018.
[in-text-ad]
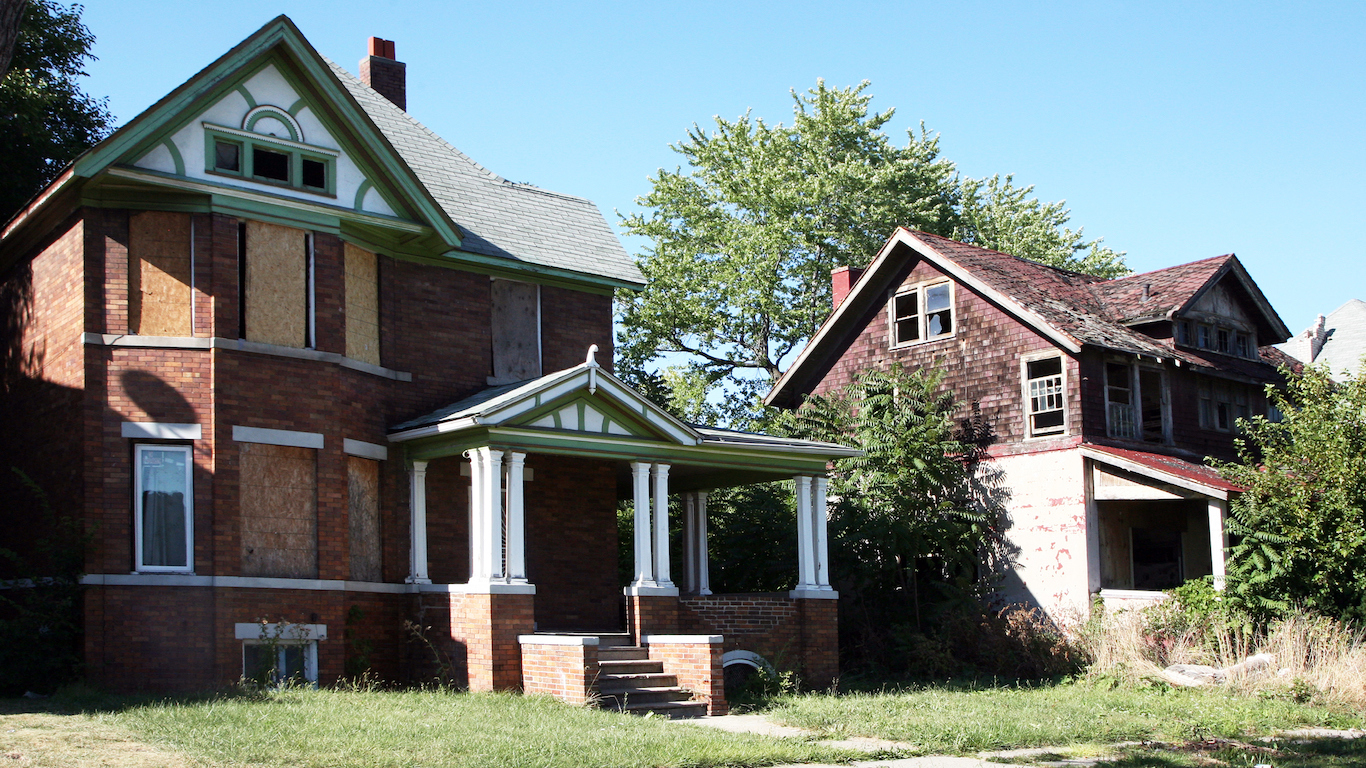
Of the 29 cities where at least 5,000 single-family homes and condos are vacant, the vacancy rate exceeds the national rate of 1.52% in all but two cases. In most of the cities on this list, the rate is well beyond that figure. The cities on this list with the highest rates — places like Flint and Detroit, Michigan and Gary, Indiana — are often legacy cities well known for their long-term economic decline due to deindustrialization. In these cities, vacancy rates are well in excess of 10%.
A large number of the American cities with the most vacant homes can be found in the Midwest. In many of these cities, including those suffering from long term industrial decline, relatively high vacancy rates may be due in part to new regulations that have made buying a home harder.
While a high number of home vacancies coincides with lower home prices, the cities on this list do not necessarily have the least expensive housing market in their states.
| City | State | Population | 2018 Single family homes | 2018 Vacant Homes | 2018 Vacant Homes |
|---|---|---|---|---|---|
| United States | United States | 328,839,750 | 95,126,759 | 1,447,906 | 1.52% |
| Pompano Beach | Florida | 453,887 | 151,054 | 5,010 | 3.32% |
| Mobile | Alabama | 273,256 | 98,891 | 5,049 | 5.11% |
| Louisville | Kentucky | 746,867 | 241,973 | 5,062 | 2.09% |
| San Antonio | Texas | 1,700,582 | 458,505 | 5,206 | 1.14% |
| Hilton Head Island | South Carolina | 42,535 | 30,945 | 5,229 | 16.90% |
| Jacksonville | Florida | 832,821 | 263,708 | 5,491 | 2.08% |
| West Palm Beach | Florida | 355,274 | 118,888 | 5,670 | 4.77% |
| Gary | Indiana | 82,349 | 29,501 | 5,728 | 19.42% |
| Tucson | Arizona | 884,283 | 254,454 | 5,830 | 2.29% |
| Kansas City | Missouri | 327,912 | 109,260 | 6,077 | 5.56% |
| Phoenix | Arizona | 1,400,479 | 365,582 | 6,193 | 1.69% |
| Dayton | Ohio | 420,498 | 145,578 | 6,269 | 4.31% |
| Atlanta | Georgia | 686,577 | 198,848 | 6,350 | 3.19% |
| Oklahoma City | Oklahoma | 552,472 | 184,297 | 6,362 | 3.45% |
| Saint Petersburg | Florida | 351,709 | 135,921 | 6,893 | 5.07% |
| Memphis | Tennessee | 684,828 | 198,711 | 7,433 | 3.74% |
| Fort Lauderdale | Florida | 813,236 | 273,921 | 7,504 | 2.74% |
| Miami | Florida | 1,829,999 | 490,243 | 7,589 | 1.55% |
| Birmingham | Alabama | 438,725 | 148,174 | 8,107 | 5.47% |
| Saint Louis | Missouri | 616,101 | 219,155 | 8,662 | 3.95% |
| Flint | Michigan | 156,738 | 57,118 | 8,986 | 15.73% |
| Cleveland | Ohio | 738,683 | 208,952 | 9,386 | 4.49% |
| Houston | Texas | 3,098,550 | 708,259 | 10,228 | 1.44% |
| Indianapolis | Indiana | 930,784 | 271,488 | 11,104 | 4.09% |
| Chicago | Illinois | 2,696,991 | 583,375 | 11,358 | 1.95% |
| Las Vegas | Nevada | 1,496,538 | 460,309 | 11,371 | 2.47% |
| Philadelphia | Pennsylvania | 1,560,023 | 469,643 | 11,910 | 2.54% |
| Baltimore | Maryland | 630,714 | 215,810 | 17,382 | 8.05% |
| Detroit | Michigan | 640,125 | 222,119 | 24,780 | 11.16% |
Thank you for reading! Have some feedback for us?
Contact the 24/7 Wall St. editorial team.