[cnxvideo id=”816908″ placement=”ros”]The American housing bubble that wreaked havoc on the global economy was a long time in the making. Largely the product of exploitative lending practices that put people in homes they could not afford, the housing market bust dragged the median American home value down by 37% — from a pre-recession high of $230,000 in the third quarter of 2005 to a post-recession low of $145,000 in the first quarter of 2011.
Today, with the housing collapse a decade behind us, new regulations safeguard home buyers from predatory lenders. Since the housing market crash, home prices have regained the value lost — and then some. Through the first quarter of 2019, home prices have risen by nearly 70% since the post-recession low.
While steady year-over-year growth in home value is generally considered healthy, too much growth too quickly can lead to market instability and a risk of a collapse in the long term. In some U.S. cities, home values might be climbing at a rate that could prove disastrously unsustainable.
Reviewing quarterly median home price data for 123 metropolitan statistical areas from real estate data firm ATTOM Data Solutions, 24/7 Wall St. identified 15 U.S. metropolitan areas where home prices are at least 20% higher than at their nearest pre-recession peak. In several of these cities, prices are over 50% above that level.
Prices have risen in these metropolitan areas for good reason. Most of these areas are home to growing job sectors in high-paying industries and are attracting new residents and families. Growing demand for housing can drive up home prices, and some cities on this list are also some of America’s fastest growing housing markets.
An unaffordable housing market is another hallmark of a housing bubble. Nationwide, the median home value is equivalent to 3.61 times the median household income. We only considered those housing markets where home values were less affordable as they are on average nationwide. Even though many cities on this list have healthy job markets and high incomes, rapidly rising real estate costs mean many residents still struggle to afford their homes.
It is important to note that 24/7 Wall St. does not claim to be able to predict the presence of a housing bubble in a given market. A number of other regional factors, including interest rates, delinquency rates, and the health of specific industries in a given area, all can affect the long-term stability of housing markets. But should the nation’s unprecedented sustained economic growth hit a serious stumbling block in the coming months, some of these markets, judging from current indicators, will be among the most vulnerable.
Click here to see cities on the verge of a housing crisis
Click here to see our methodology

15. Seattle-Tacoma-Bellevue, WA
> Home price chg. from pre-recession peak: 23.1%
> Current median home price: $437,000
> Pre-recession peak: $355,000 (Q2 2007)
> Median household income: $82,133
> 10 yr. population growth: 16.9%
[in-text-ad]
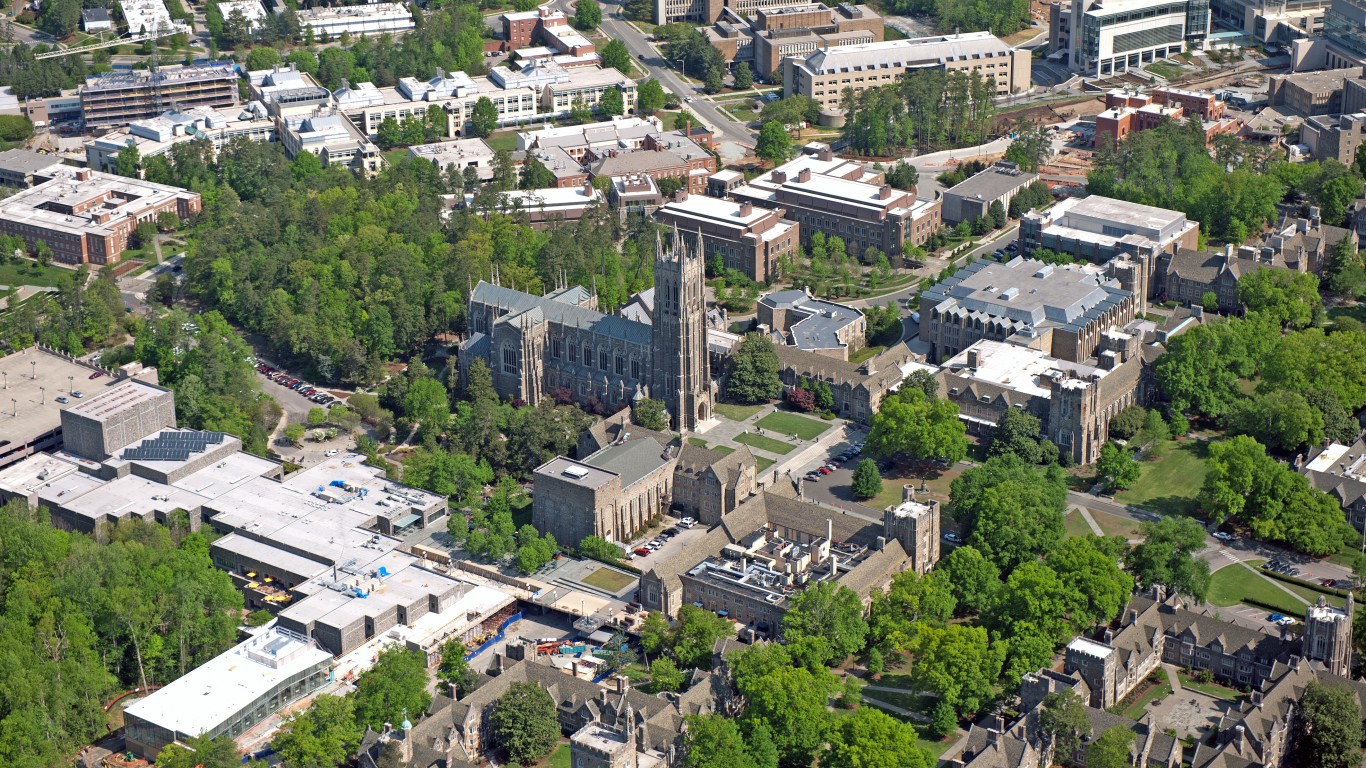
14. Durham-Chapel Hill, NC
> Home price chg. from pre-recession peak: 27.1%
> Current median home price: $225,000
> Pre-recession peak: $177,000 (Q2 2007)
> Median household income: $61,271
> 10 yr. population growth: 18.3%
[recirclink id=537843]

13. Boise City, ID
> Home price chg. from pre-recession peak: 27.2%
> Current median home price: $254,379
> Pre-recession peak: $200,000 (Q3 2007)
> Median household income: $55,324
> 10 yr. population growth: 21.0%

12. Spokane-Spokane Valley, WA
> Home price chg. from pre-recession peak: 29.1%
> Current median home price: $226,000
> Pre-recession peak: $175,000 (Q3 2007)
> Median household income: $53,321
> 10 yr. population growth: 23.7%
[in-text-ad-2]
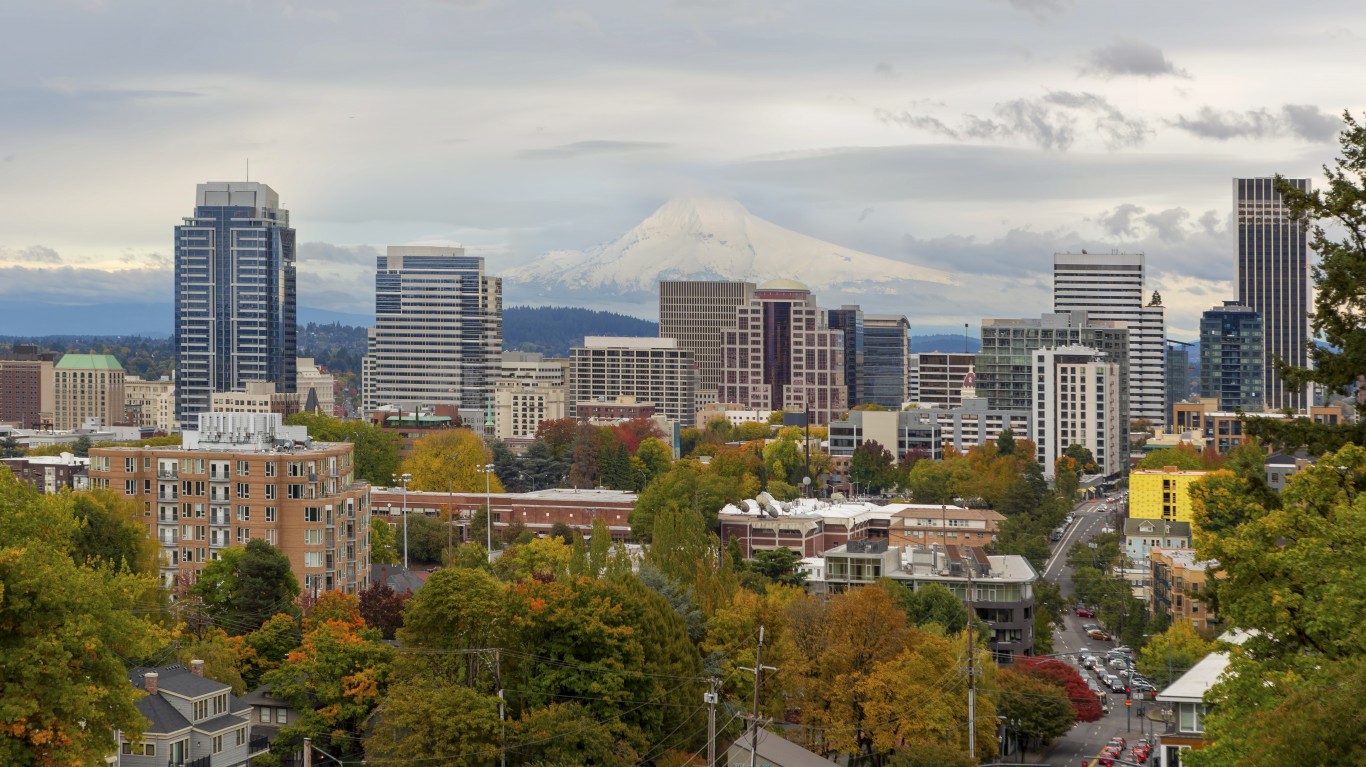
11. Portland-Vancouver-Hillsboro, OR-WA
> Home price chg. from pre-recession peak: 31.5%
> Current median home price: $367,000
> Pre-recession peak: $279,000 (Q3 2007)
> Median household income: $71,931
> 10 yr. population growth: 12.7%
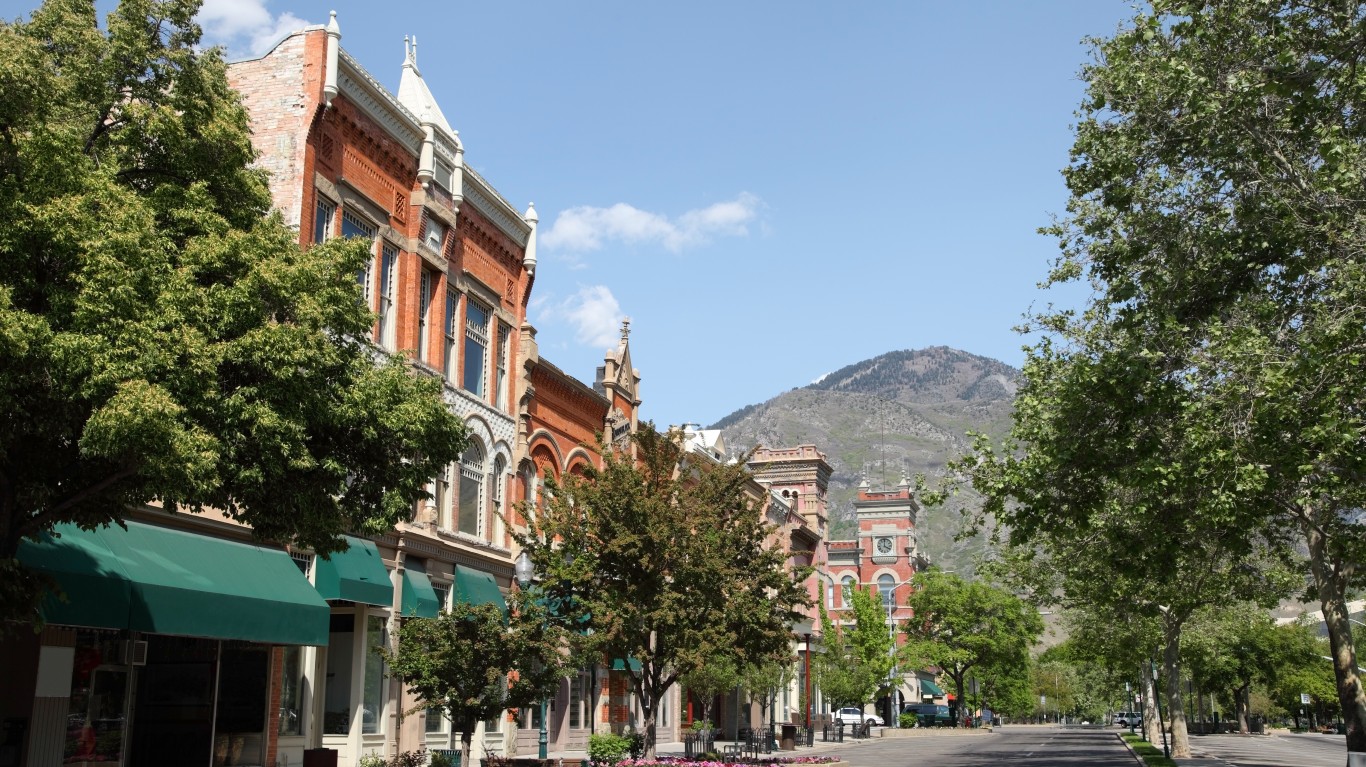
10. Provo-Orem, UT
> Home price chg. from pre-recession peak: 31.6%
> Current median home price: $309,296
> Pre-recession peak: $235,000 (Q3 2007)
> Median household income: $70,196
> 10 yr. population growth: 25.1%
[in-text-ad]

9. Salt Lake City, UT
> Home price chg. from pre-recession peak: 34.3%
> Current median home price: $318,750
> Pre-recession peak: $237,378 (Q3 2007)
> Median household income: $71,510
> 10 yr. population growth: 9.8%
[recirclink id=529506]

8. Urban Honolulu, HI
> Home price chg. from pre-recession peak: 37.8%
> Current median home price: $565,000
> Pre-recession peak: $410,000 (Q4 2007)
> Median household income: $81,284
> 10 yr. population growth: N/A
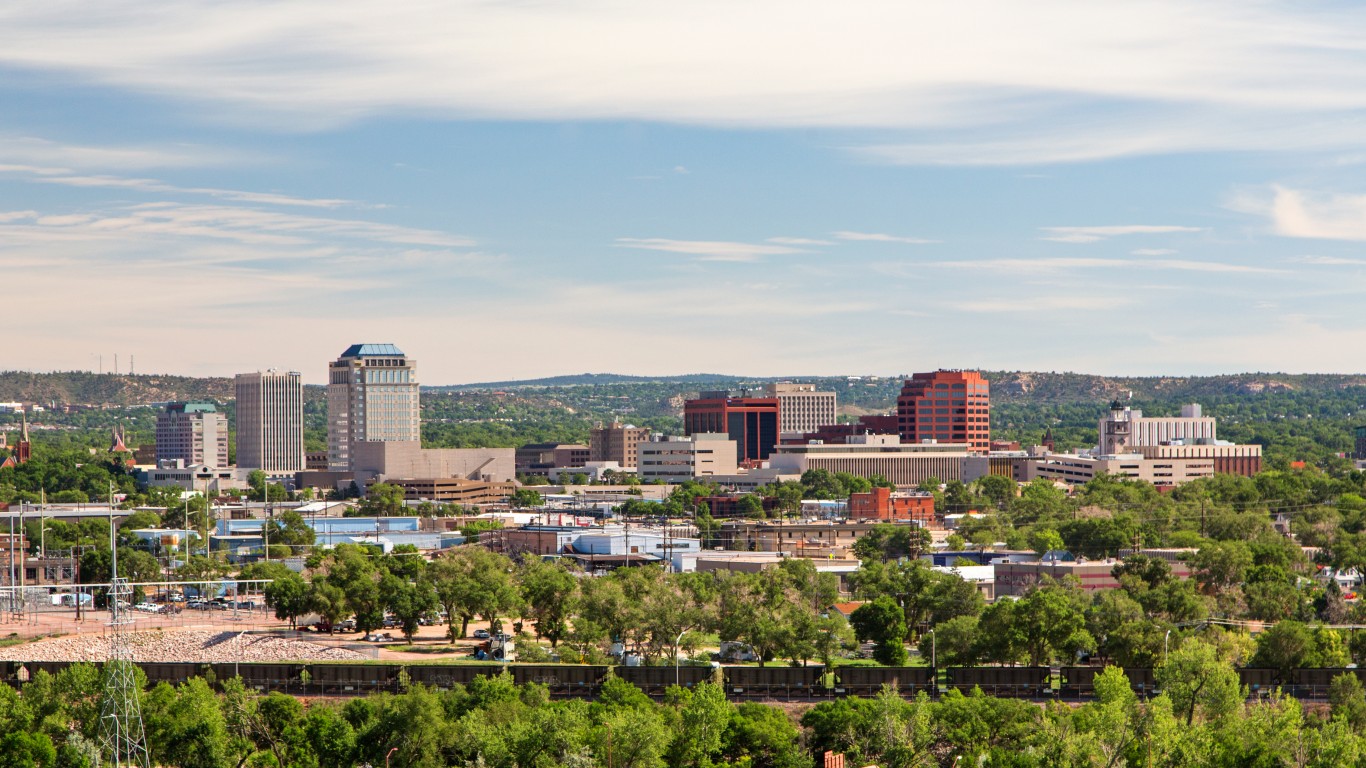
7. Colorado Springs, CO
> Home price chg. from pre-recession peak: 42.6%
> Current median home price: $285,000
> Pre-recession peak: $199,900 (Q3 2007)
> Median household income: $65,593
> 10 yr. population growth: 19.0%
[in-text-ad-2]
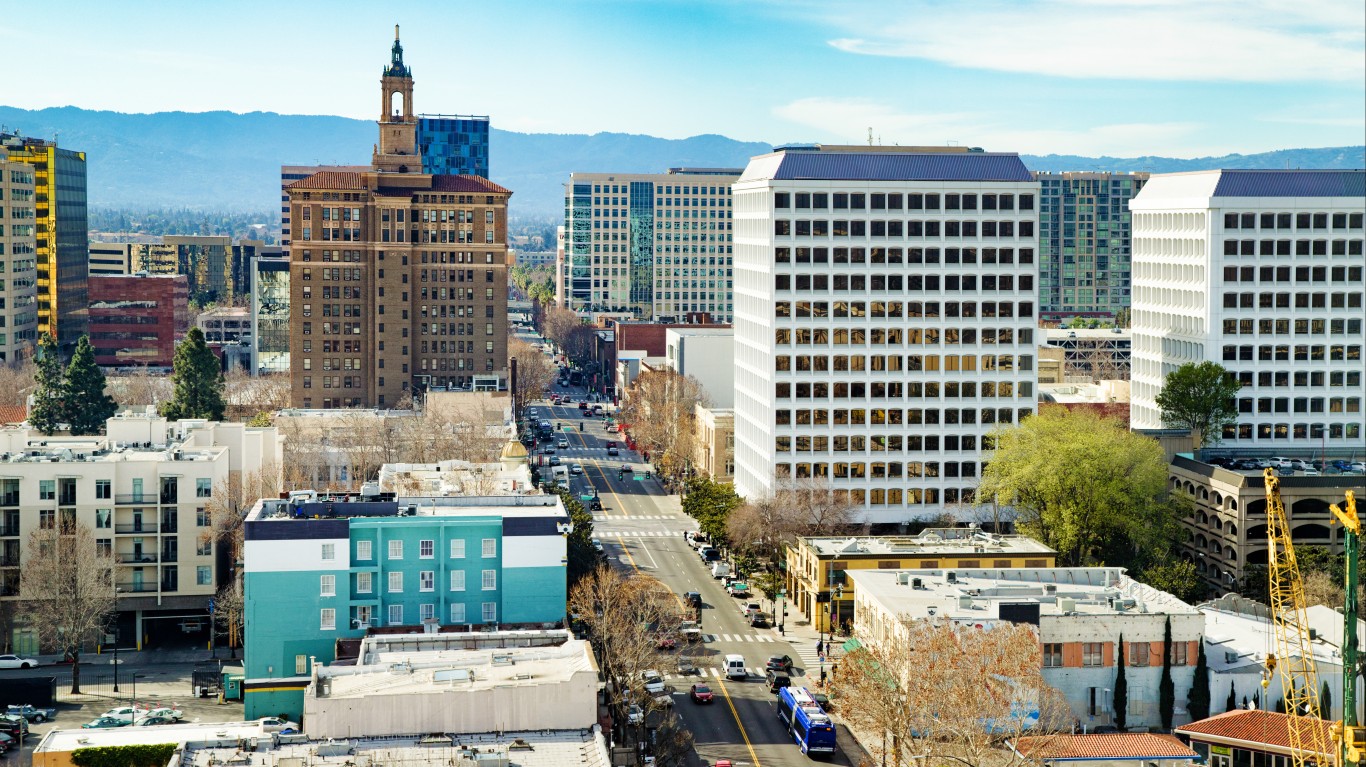
6. San Jose-Sunnyvale-Santa Clara, CA
> Home price chg. from pre-recession peak: 43.4%
> Current median home price: $1.0 million
> Pre-recession peak: $730,000 (Q2 2007)
> Median household income: $117,474
> 10 yr. population growth: 10.8%

5. Nashville-Davidson–Murfreesboro–Franklin, TN
> Home price chg. from pre-recession peak: 54.9%
> Current median home price: $240,000
> Pre-recession peak: $154,900 (Q3 2007)
> Median household income: $63,939
> 10 yr. population growth: 25.1%
[in-text-ad]

4. Austin-Round Rock, TX
> Home price chg. from pre-recession peak: 62.1%
> Current median home price: $302,000
> Pre-recession peak: $186,250 (Q3 2007)
> Median household income: $73,800
> 10 yr. population growth: 32.8%
[recirclink id=528823]
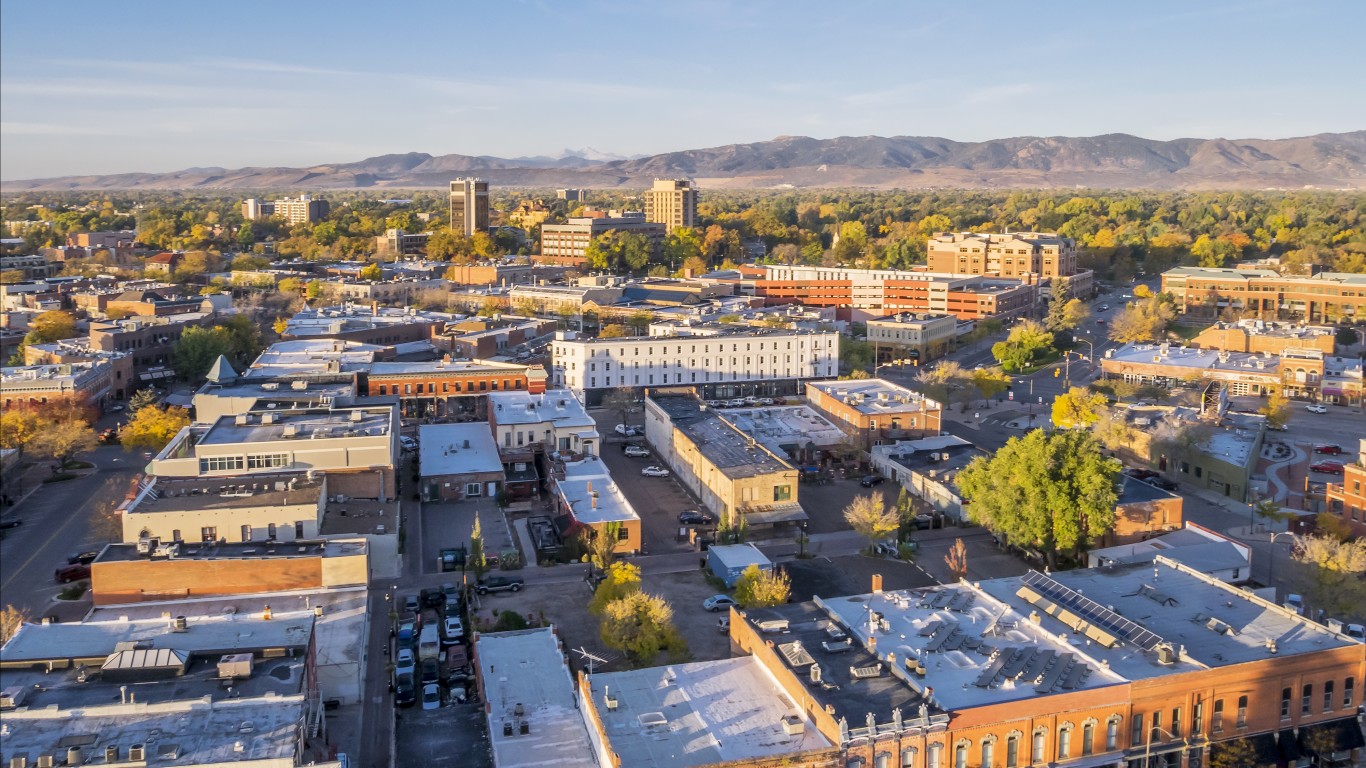
3. Fort Collins, CO
> Home price chg. from pre-recession peak: 66.9%
> Current median home price: $365,500
> Pre-recession peak: $219,000 (Q4 2006)
> Median household income: $69,102
> 10 yr. population growth: 19.6%
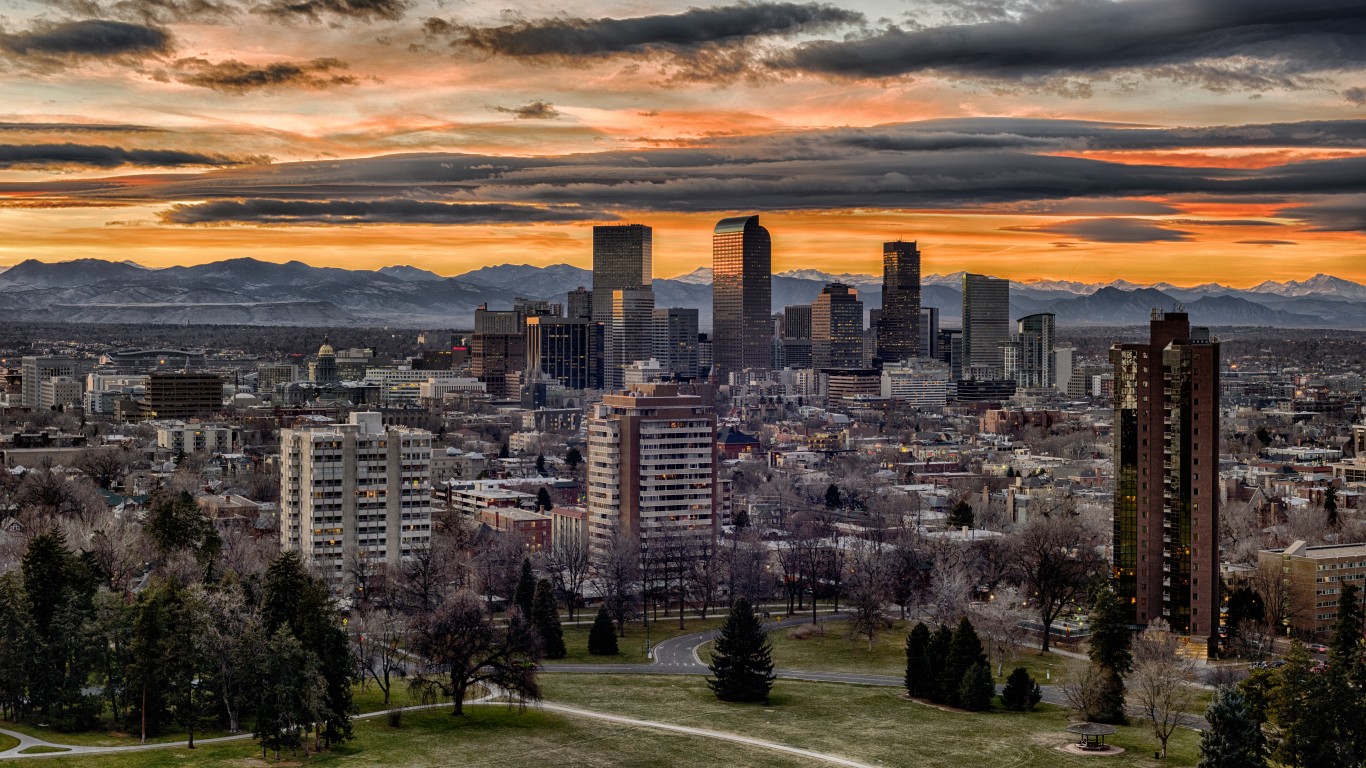
2. Denver-Aurora-Lakewood, CO
> Home price chg. from pre-recession peak: 68.2%
> Current median home price: $382,000
> Pre-recession peak: $227,050 (Q3 2005)
> Median household income: $76,643
> 10 yr. population growth: 17.1%
[in-text-ad-2]
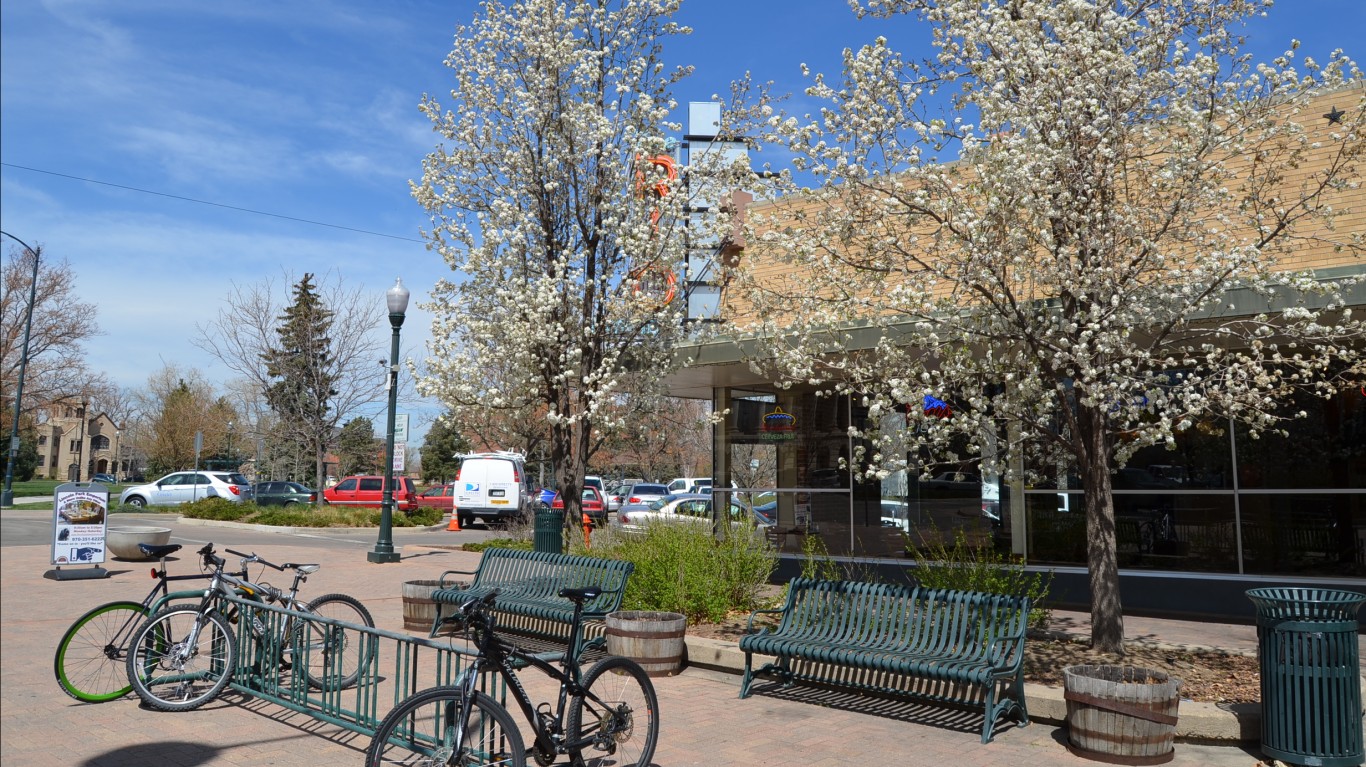
1. Greeley, CO
> Home price chg. from pre-recession peak: 79.2%
> Current median home price: $326,950
> Pre-recession peak: $182,500 (Q3 2005)
> Median household income: $68,884
> 10 yr. population growth: 25.0%
Methodology:
To identify the cities that may be at risk of a housing collapse, 24/7 Wall St. reviewed quarterly median home price data for 123 metropolitan statistical areas from real estate data firm ATTOM Data Solutions. We reviewed the 15 metro areas with the greatest percentage change in median home value from their pre-recession high to current levels. Ten-year population change came from the U.S. Census Bureau’s American Community Survey. The affordability ration — median home value-to-median household income — was calculated with 2017 data, also from the ACS. We excluded from consideration those markets with an affordability ratio higher than 3.61.