Special Report
These Are the World’s Biggest Producers of Waste
Published:
Last Updated:

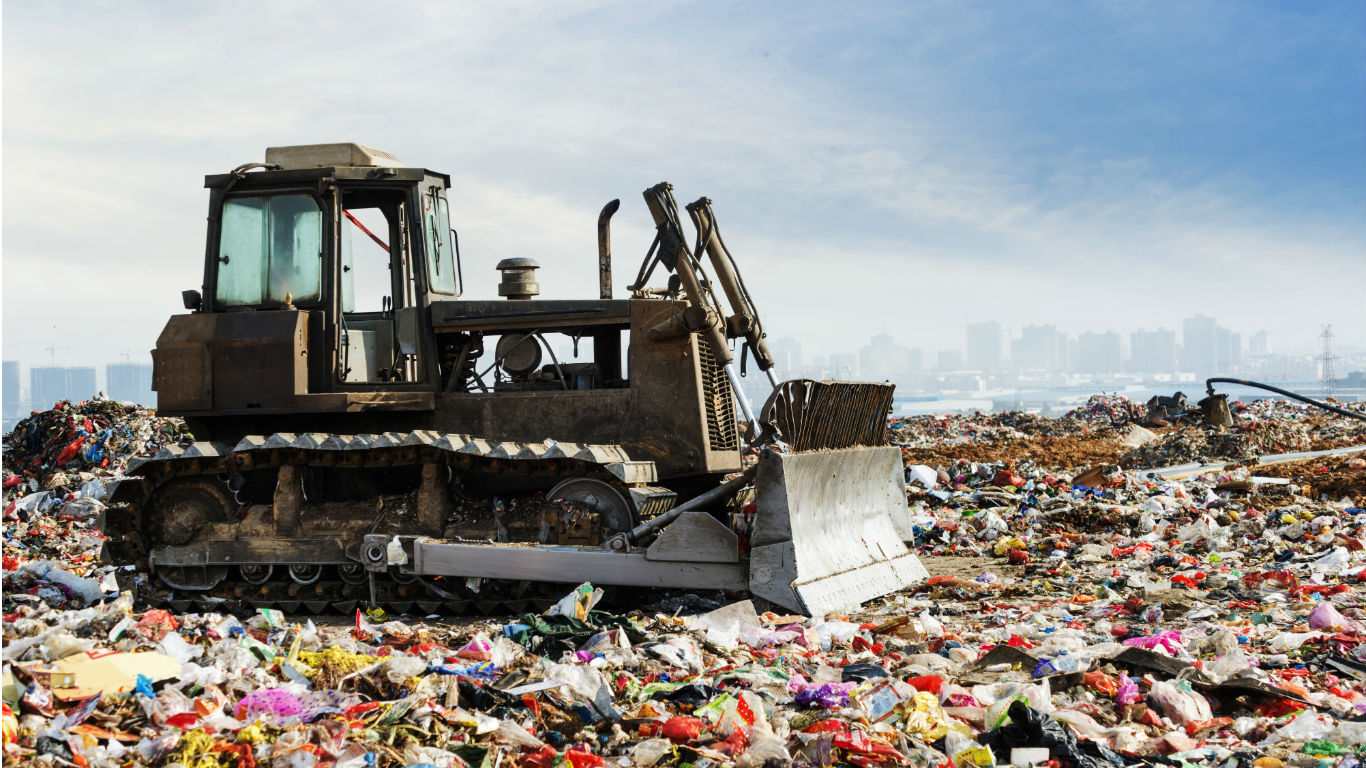
The world is drowning in trash, and the waste generation rates are only increasing, according to the World Bank. Due to population growth and urban areas growth, the amount of trash countries produce is only expected to rise — by some estimates as much as 70% between 2016 and 2050.
While much of the focus is on individuals and families and the amount of trash they generate, residential trash is only a fraction of the garbage produced by certain industries.
Municipal solid waste management (MSW), which is waste generated from companies, buildings, institutions, small businesses, houses, and yards, often comprises less than 5% of the total amount of waste produced in a country.
Between 30% and 35% of the total amount of generated waste in most developed countries is attributed to building sector activities such as building construction, renovation, and demolition processes, according to the official EU statistical data.
In many countries on our list, the construction industry is often the largest culprit, generating more than 90% of the total waste produced in a country. China is a notable exception, where more than half of the waste is agricultural or industrial.
Many countries have recognized the importance of properly and safely disposing of trash and have passed laws regulating how cities and corporations source and get rid of the waste they are producing. Some developing countries are struggling because governments often lack the funding to solve waste management challenges. Many are focusing on advocating recycling. In the United States, for example, some states will even pay you to recycle.
Click here to read about the countries that produce the most waste.
To identify the largest producers of waste, 24/7 Tempo calculated the special waste and regular municipal solid waste per capita produced by each country, using data from the World Bank’s “What a Waste” global database, last updated in September of 2018. We summed for each country the metric tons (or tonnes) of waste in the latest year for which data was available in the special categories of agricultural waste, construction and demolition, e waste, hazardous waste, industrial waste, medical waste, and the total municipal solid waste (msw).

10. Serbia
> Estimated annual waste per capita: 8.9 metric tons
> Estimated annual waste total: 62,269,603 metric tons
> Waste treatment recycling: 0.8%
> Population: 7,020,858
Similar to other countries on the list, Serbia also generates a large amount of construction industry waste — over 46 million metric tons of the 62 million metric tons of total waste.
The residential construction industry in Serbia has been booming over the last several years. Permits are being issued in record numbers. The huge amount of construction and demolition waste may be partially explained by a law that requires 70% of construction material and built-in equipment to be made in Serbia. Regulation and individual initiatives to properly manage construction waste are both lacking. This has resulted in construction waste going directly to municipal landfills without sorting.
[in-text-ad]

9. Ukraine
> Estimated annual waste per capita: 10.6 metric tons
> Estimated annual waste total: 474,106,025 metric tons
> Waste treatment recycling: 3.2%
> Population: 44,831,135
Ukraine, one of the biggest arms dealers in the world, generates just over 474 million metric tons of waste a year, 448 million of which is hazardous waste. No other of the 105 countries for which data on hazardous waste is available produces more such waste. The government has recognized hazardous waste management as the most urgent and critical issue that needs to be addressed in waste management in general. Lack of financing has been identified as a major reason for the lack of initiatives in the field.
Most of the other 26 million metric tons of waste in Ukraine is municipal solid waste and agricultural waste, which includes garbage produced in farms, poultry and slaughterhouses, harvest waste, fertilizer run-off from fields, and pesticides.

8. Luxembourg
> Estimated annual waste per capita: 11.8 metric tons
> Estimated annual waste total: 7,016,503 metric tons
> Waste treatment recycling: 28.4%
> Population: 596,336
Luxembourg, a tiny nation of about 600,000 people, produced slightly more than 7 million tonnes of waste in 2017, but only a fraction of it was municipal solid waste. This kind of waste consists of products homes, businesses, schools, and hospitals throw out, such as appliances, clothes, bottles, food, and paper.
The other 90.0% of the garbage was mostly construction and demolition waste. The construction industry in Luxembourg has fared better than many other EU countries since the recession because of its overall strong economy. The number of building companies, as well as building permits, increased between 2008 and 2013. Investment in construction grew by 8.6% after rebounding from the housing crisis. Part of the demand may be explained by the growing tourism industry. Luxembourg is among the most tourism-friendly countries in the world.
7. Sweden
> Estimated annual waste per capita: 16.2 metric tons
> Estimated annual waste total: 163,199,471 metric tons
> Waste treatment recycling: 32.4%
> Population: 10,057,698
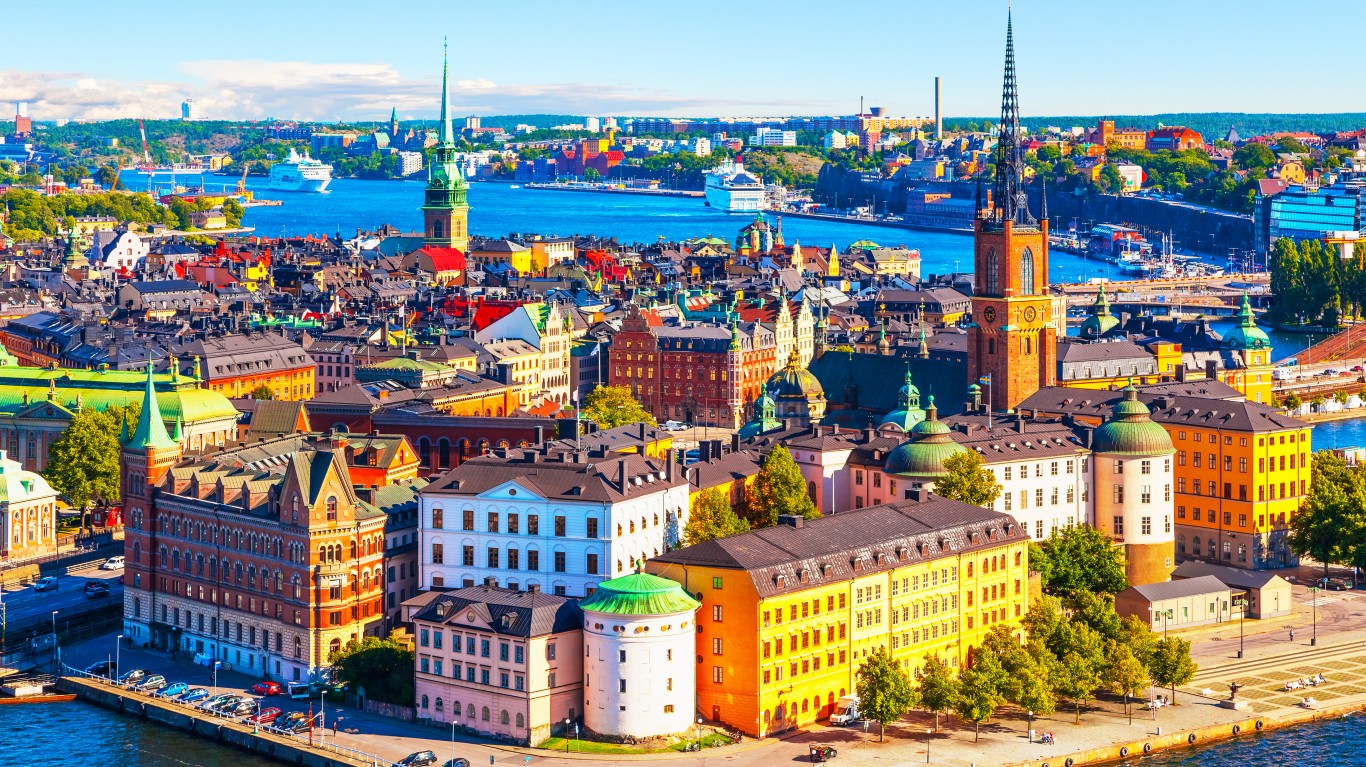
Sweden, one of the happiest countries in the world, generates about 163 million tonnes of waste a year, the 15th most of the 178 countries for which data is available. But only a small fraction of that — about 2.6% — is municipal solid waste, while about 93% of the garbage is construction and demolition waste. The rest is mostly medical and hazardous waste.
Though Sweden is among the countries producing the most waste, largely due to the large amount of construction waste, the nation has made improvements in recycling this waste. This kind of waste has been prioritized in the national waste plan and in its waste prevention program.
[in-text-ad-2]

6. Armenia
> Estimated annual waste per capita: 16.3 metric tons
> Estimated annual waste total: 47,889,000 metric tons
> Waste treatment recycling: N/A
> Population: 2,930,450
Armenia produces relatively little municipal waste, with nearly 493,000 tons in 2014. It also ranks among the countries producing the least amount of agricultural and construction waste. However, what contributes to Armenia’s rank among the world’s biggest producers of waste is the huge amount of industrial waste it produces. Of the nearly 48 million tons of total waste the country produces, 47.3 million is industrial.
Armenia does not have processing plants or specialized sites to treat and bury waste, partly explaining its waste problem. Its first solid waste landfill has been in the making since 2011. The country’s garbage is currently being disposed of at uncontrolled dumpsites from which toxins escape into the air in the form of methane gas.
5. Finland
> Estimated annual waste per capita: 16.6 metric tons
> Estimated annual waste total: 91,698,449 metric tons
> Waste treatment recycling: 28.1%
> Population: 5,508,214
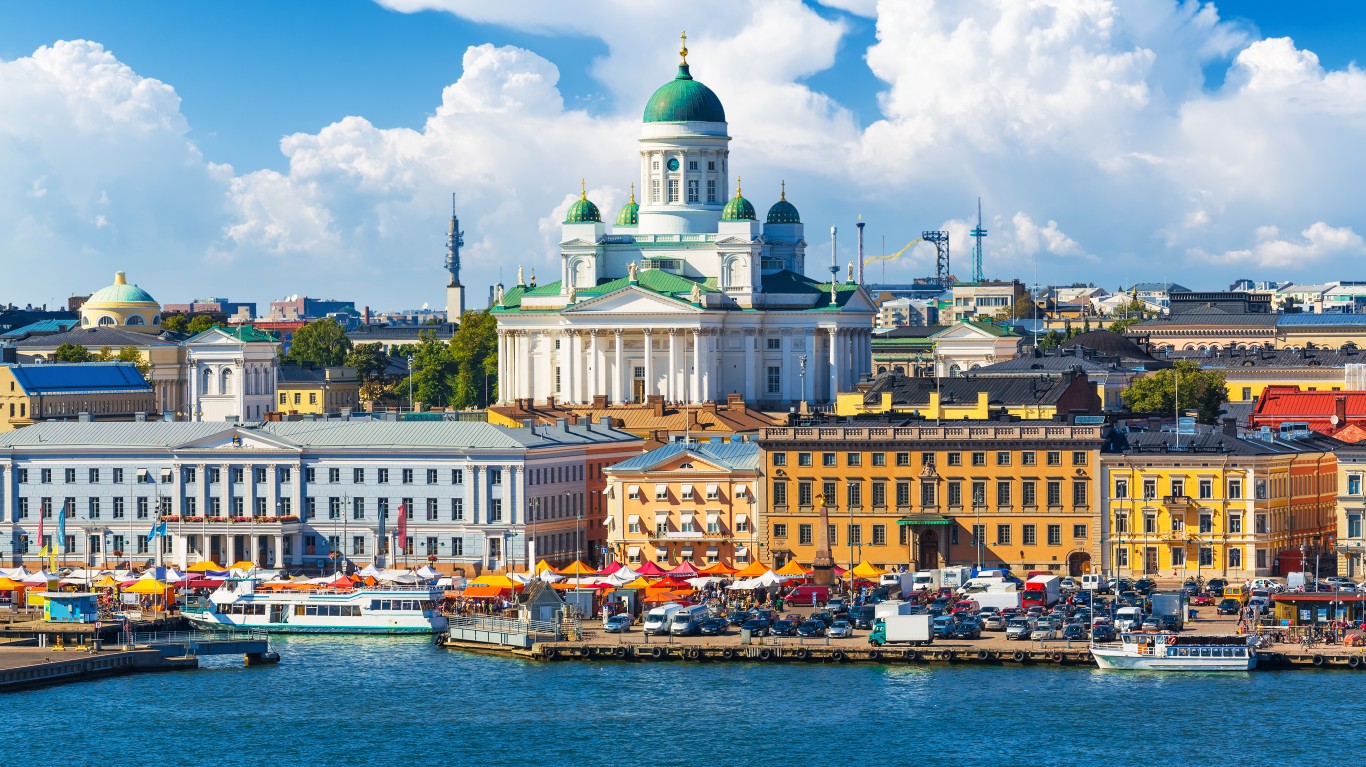
Just about 3.0% of the total waste produced in Finland is municipal waste. Almost half of it is burned, a trend that has only been improving over the last several years. Recycling has also been increasing because it’s a highly advocated method of waste management in the country and in Europe in general.
The other 97.0% of waste generated in the country comes from various industries, but mostly construction. The housing sector in Finland, one of the richest countries in the world, has been growing due to low mortgage rates and expanding urban areas, resulting in an increased demand for new buildings, especially with small apartments in centrally located zones.
[in-text-ad]
4. Estonia
> Estimated annual waste per capita: 23.5 metric tons
> Estimated annual waste total: 30,912,409 metric tons
> Waste treatment recycling: 24.7%
> Population: 1,317,384
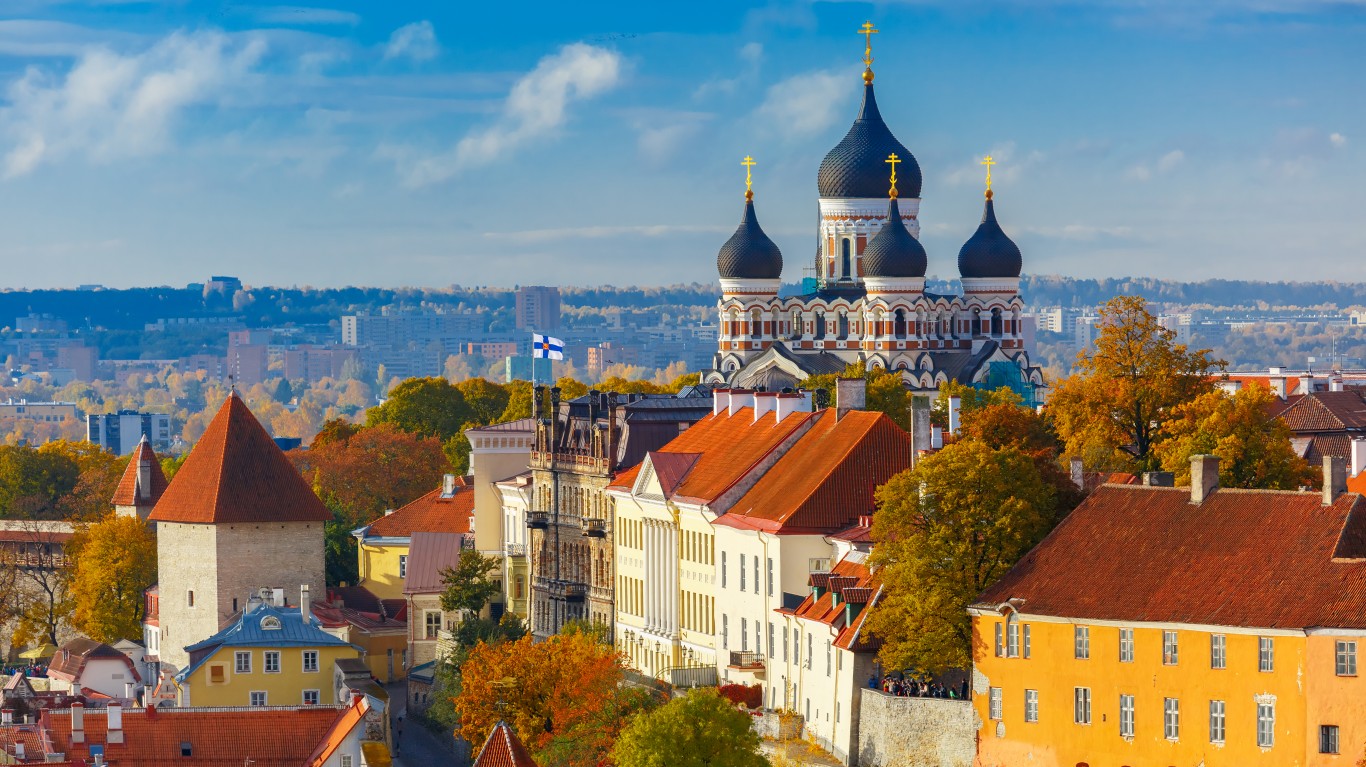
Estonia, a rising tourism destination where tourists sometimes outnumber locals, produces a total amount of nearly 31 million metric tons of garbage, and a third of that is hazardous waste. The country generates more than 35 times the EU average of hazardous waste per capita, with almost all of it coming from the oil shale sector. Ash and other waste from combusting and refining ends up in landfill, polluting the air with toxic substances.
The country has set regulations for discharging of hazardous waste with taxes imposed if such waste is dumped into water, but payment of these taxes is not strictly enforced, resulting in weak incentive for companies to reduce their environmental footprint, according to the OECD.

3. United States
> Estimated annual waste per capita: 25.9 metric tons
> Estimated annual waste total: 8,425,840,000 metric tons
> Waste treatment recycling: 34.6%
> Population: 325,147,121
The United States, with the third-largest population of all countries, produced the most municipal solid waste in the world — 258 million tonnes of MSW was generated in 2017. By contrast, second-place China generated 210 million tonnes of MSW in 2017. Adding to this total the World Bank’s special waste categories of industrial, medical, E waste, hazardous, and agricultural waste, the U.S. generates approximately 8.4 billion tonnes of waste in a year.
While the U.S. is the third biggest producer of waste on a per capita basis, some areas within the country are making strides addressing the problem. For example, San Francisco passed an ordinance in 2009 requiring all residents and tourists to compost food waste. The city turned more than a million tonnes of food waste into compost, and as of 2012 had achieved nearly 80% waste diversion — the highest rate of any major U.S. city in the United States. Local government are raising awareness about recycling. Some state now will even pay residents to recycle.

2. Bulgaria
> Estimated annual waste per capita: 26.7 metric tons
> Estimated annual waste total: 189,141,945 metric tons
> Waste treatment recycling: 19.0%
> Population: 7,075,947
Bulgaria, a country of about 7 million people, generates slightly more garbage per person as the United States, a country of more than 325 million people. This is largely due to the more than 172 million metric tons of waste produced by the construction industry, the fifth highest amount of the 68 countries for which construction and demolition waste data is available.
After an economic slowdown that resulted from the global recession, the construction business is picking up again. Real estate construction has seen the greatest increase in activity — 16.4% between 2010 and 2016. While Bulgaria seems on track to produce even more waste, it is among the countries doing the most to minimize its effect on the environment.
[in-text-ad-2]

1. Canada
> Estimated annual waste per capita: 36.1 metric tons
> Estimated annual waste total: 1,325,480,289 metric tons
> Waste treatment recycling: 20.6%
> Population: 36,708,083
Driven by agricultural waste and industrial waste generation, which totalled 181 million tonnes and 1.12 billion tonnes, respectively, in 2017, Canada’s estimated total waste generation is the highest in the world. Canada produced 1.33 billion metric tonnes of waste, or 36.1 tonnes per person.
According to the Canadian government, waste from industrial activities such as oil refining, chemical manufacturing, and metal processing contains various hazardous chemicals, including acids, phenols, arsenic, lead, and mercury. Industrial waste generation is a long-standing problem in Canada, which sought to address the issue as early as 1992 when it ratified the Basel Convention. Like many affluent nations, Canada exports large portions of its waste to other countries, and the convention controls and aims at reducing these waste shipments. This and other measures put Canada on the list of countries doing the most to protect the environment.
The average American spends $17,274 on debit cards a year, and it’s a HUGE mistake. First, debit cards don’t have the same fraud protections as credit cards. Once your money is gone, it’s gone. But more importantly you can actually get something back from this spending every time you swipe.
Issuers are handing out wild bonuses right now. With some you can earn up to 5% back on every purchase. That’s like getting a 5% discount on everything you buy!
Our top pick is kind of hard to imagine. Not only does it pay up to 5% back, it also includes a $200 cash back reward in the first six months, a 0% intro APR, and…. $0 annual fee. It’s quite literally free money for any one that uses a card regularly. Click here to learn more!
Flywheel Publishing has partnered with CardRatings to provide coverage of credit card products. Flywheel Publishing and CardRatings may receive a commission from card issuers.
Thank you for reading! Have some feedback for us?
Contact the 24/7 Wall St. editorial team.