Special Report
25 Countries That Produce the Most CO2 Emissions
Published:
Last Updated:

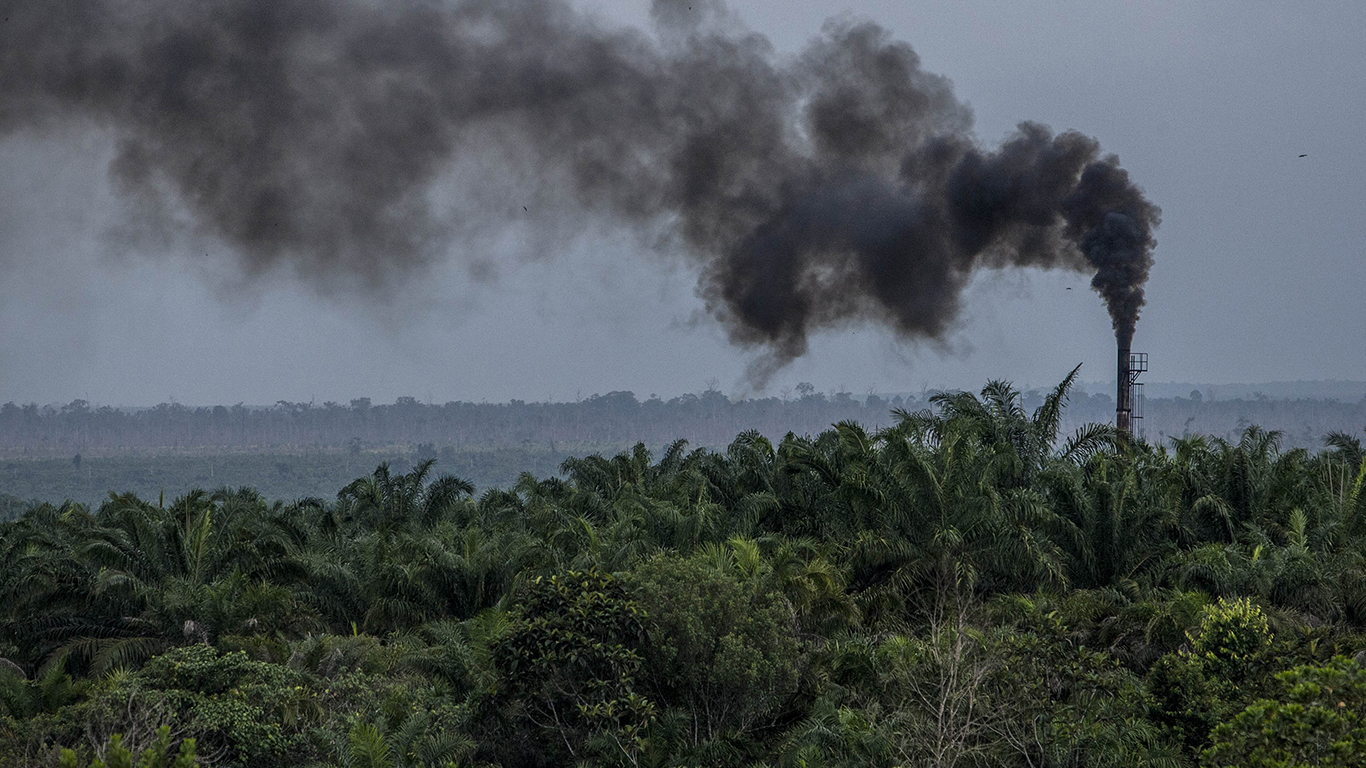
Despite long-standing warnings of a climate emergency as well as efforts by some nations to reduce carbon dioxide emissions, the worldwide use of fossil fuels — and with it global greenhouse gas emissions — grew last year.
A number of potential disaster scenarios caused by climate change remain well documented. And yet, increasing demand for coal, oil, and natural gas drove the increase in GHG emissions, according to the International Energy Agency.
To determine the countries emitting the most CO2, 24/7 Wall St. ranked countries based on territorial emissions — millions of metric tons of carbon emitted from fossil fuels and cement production within a country’s borders — in 2017 published by the Global Carbon Project 2018. This report and our analysis focuses only on fossil fuel-generated CO2 emissions, the single most important greenhouse gas and by far the largest contributor to anthropogenic warming.
Cement, in particular, and natural resources extraction and processing in general, contribute massively to CO2 emissions. A recent report found that the majority of carbon emissions are created by such processes, even before any fuel is burned.
Resource extraction has more than tripled since 1970 and continues to accelerate, even though the population has only doubled in that time, according to the United Nations’ Global Resources Outlook 2019. Perhaps it is no surprise that the countries emitting the most CO2 are also often among the countries that control the world’s oil.
Click here to read about the 25 countries that produce the most CO2.
Click here to see our methodology.

25. Malaysia
> CO2 emissions from fossil fuel (2017): 254.6 million metric tons
> CO2 emissions from fossil fuel per person (2017): 8.1 metric tons
> Change from CO2 emissions in 1992: 241.9%
> Methane emissions (2012): 34.3 million metric tons (CO2e)
> Population (2017): 31.6 million
> GDP per capita (2017): $26,824
Malaysia has experienced tremendous economic growth in the last four decades, moving rapidly from an agricultural economy to an industrial economy. This expansion has meant more factories, automobiles, and power plants, all of which enormously escalated energy demands.
That demand has pushed Malaysia’s CO2 emissions to 254.58 million metric tons, or 8.1 metric tons per person in 2017, a 241.9% rise over 25 years.
At the end of 2017, Prime Minister Datuk Seri Najib Razak set a target of a 45% reduction from 2005 emissions levels by 2030, and for the country to be carbon neutral by 2050. Emissions, however, continue to rise as Malaysia finds itself unable to make the larger efforts needed to wean itself off fossil fuels, particularly cheap — but dirty — coal.
[in-text-ad]
24. Taiwan
> CO2 emissions from fossil fuel (2017): 271.5 million metric tons
> CO2 emissions from fossil fuel per person (2017): 11.5 metric tons
> Change from CO2 emissions in 1992: 89.4%
> Methane emissions (2012): Not available
> Population (2017): 23.5 million
> GDP per capita (2017): Not available
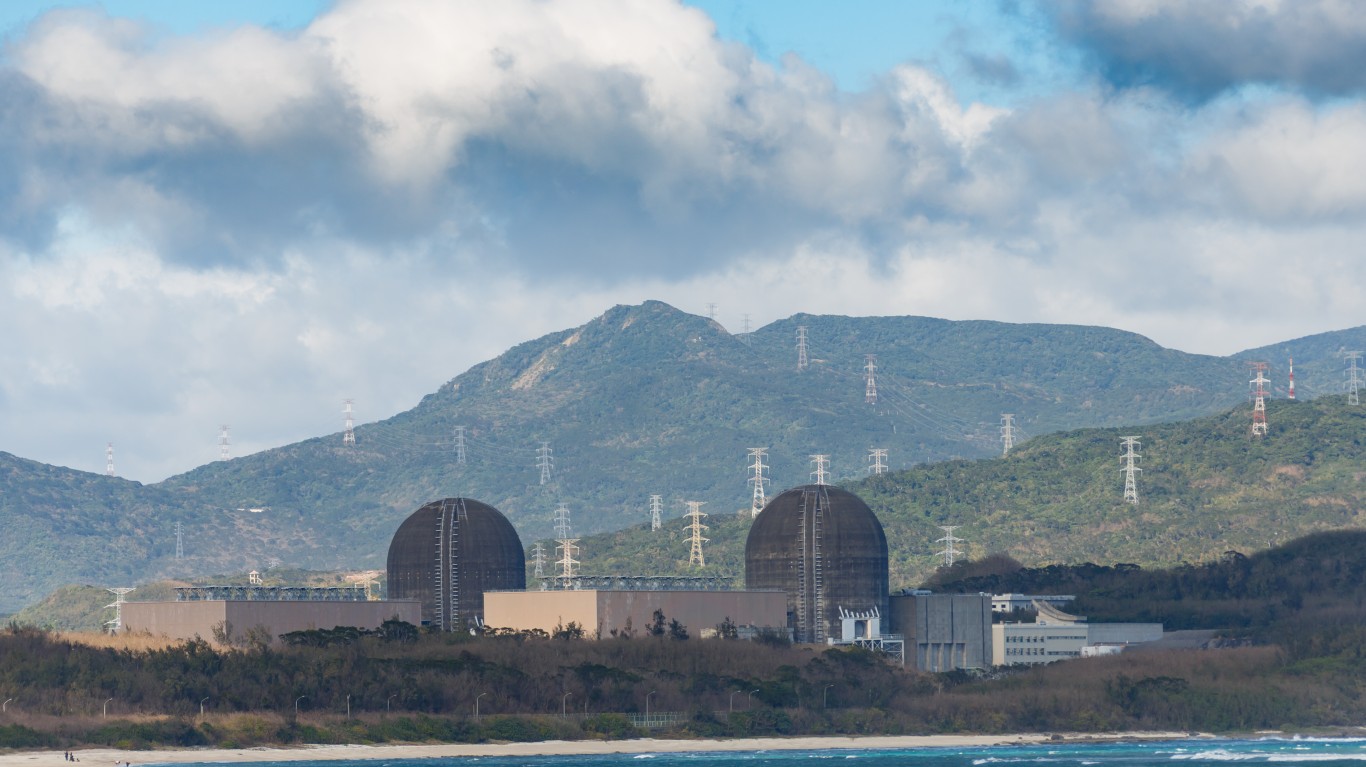
Most of the countries emitting the most CO2 are also among the top emitters on a per capita basis, and Taiwan is no exception. The 271.53 million metric tons of CO2 from fossil fuels, or about 11.5 metric tons per person, are each in the highest 25 for countries worldwide.
Taiwan is attempting to move away from nuclear power, a zero emission source of energy but one with many other issues — environmental and otherwise. In doing so, however, the nation has increased its dependency on coal, failing to move forward with alternative energy technology.
23. Spain
> CO2 emissions from fossil fuel (2017): 281.4 million metric tons
> CO2 emissions from fossil fuel per person (2017): 6.0 metric tons
> Change from CO2 emissions in 1992: 12.4%
> Methane emissions (2012): 37.2 million metric tons (CO2e)
> Population (2017): 46.6 million
> GDP per capita (2017): $34,269
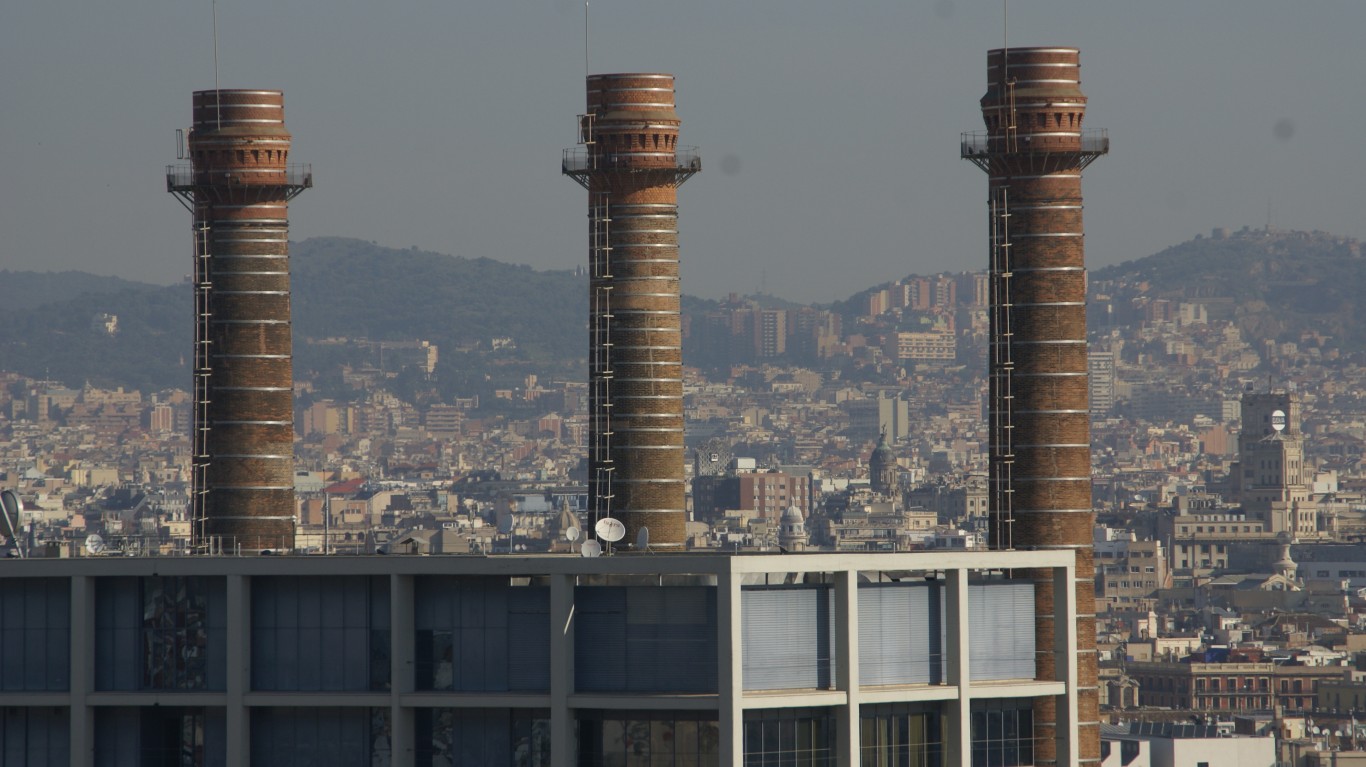
Though it has a much larger GDP than Taiwan and twice the population, Spain’s CO2 output is only slightly higher. CO2 emissions from Spain have fallen since their peak in 2005, but they are up by 12.4% compared to 1992. Spain’s CO2 emissions ranked ninth in 2017 out of the 51 European and Central Asian countries examined.
The country’s recently-elected Prime Minister Pedro Sanchez is determined to make Spain a leader in GHG emissions reductions within the European Union and has proposed a plan that would end the burning of fossil fuels by 2050.
22. Kazakhstan
> CO2 emissions from fossil fuel (2017): 292.6 million metric tons
> CO2 emissions from fossil fuel per person (2017): 16.2 metric tons
> Change from CO2 emissions in 1992: 25.6%
> Methane emissions (2012): 71.4 million metric tons (CO2e)
> Population (2017): 18.0 million
> GDP per capita (2017): $24,079
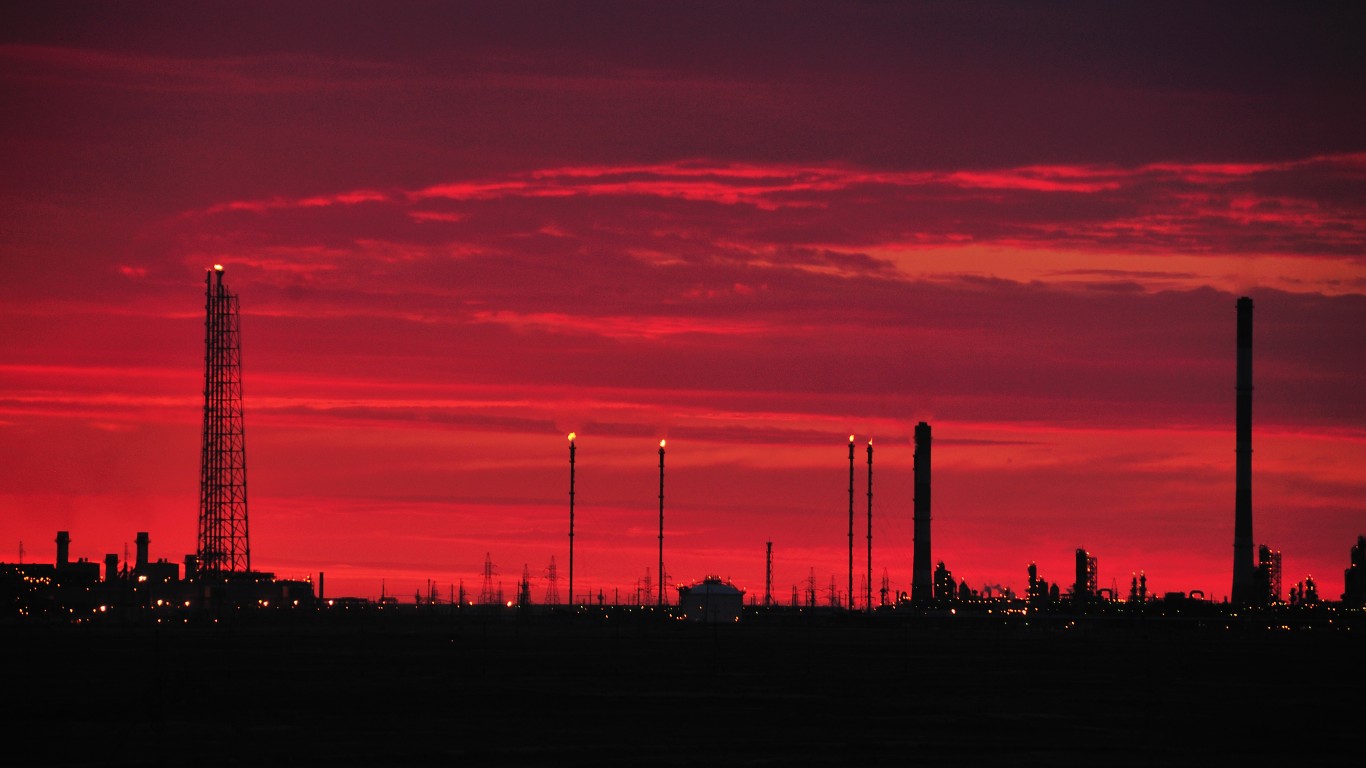
Kazakhstan’s carbon dioxide output is immense, particularly relative to its population, with a per capita emission rate of 16.2 metric tons in 2017. Carbon emissions from the country’s energy sector amount to 85% of its annual GHG emissions, but the country has been slow to act on the need to reduce its reliance on fossil fuels and put alternative energy sources in place. Instead, it is focused on updating its coal plants and creating more natural gas plant capacity, carrying its reliance on fossil fuels into the future.
[in-text-ad-2]
21. Poland
> CO2 emissions from fossil fuel (2017): 326.6 million metric tons
> CO2 emissions from fossil fuel per person (2017): 8.6 metric tons
> Change from CO2 emissions in 1992: -10.2%
> Methane emissions (2012): 65.1 million metric tons (CO2e)
> Population (2017): 38.0 million
> GDP per capita (2017): $27,344
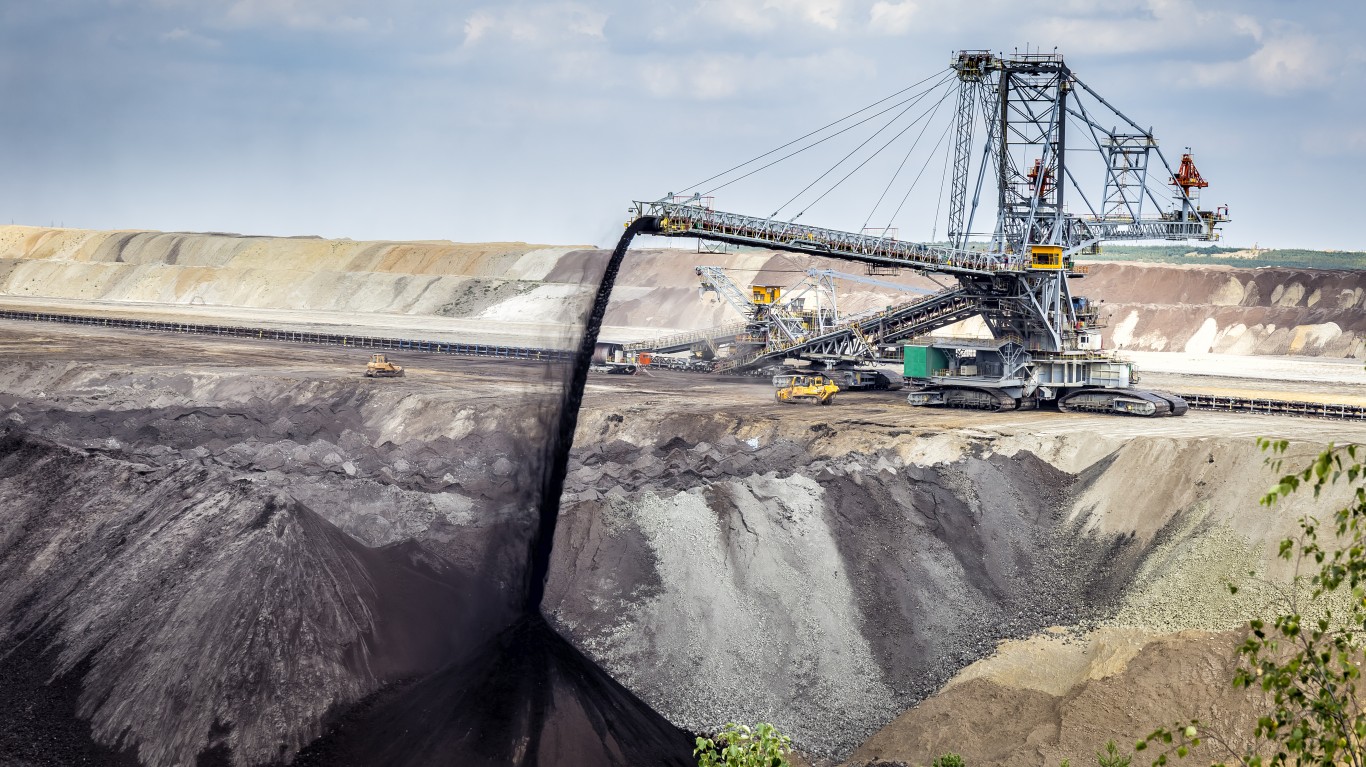
Though Poland reduced its carbon output by 10.2% between 1992 and 2017, the country’s CO2 emissions are the 21st largest in the world and sixth largest in Europe.
Poland has not shown a great deal of enthusiasm for climate measures. A law that took effect in 2016 may be discouraging the development of wind energy and. In climate negotiations, Poland has put forth a set of priorities above climate policy, including reducing poverty and hunger and increasing energy security. Still, because of its heavy historical dependence on coal, there are clear paths to carbon reduction in Poland as coal is phased out.

20. Thailand
> CO2 emissions from fossil fuel (2017): 330.84 million metric tons
> CO2 emissions from fossil fuel per person (2017): 4.8 metric tons
> Change from CO2 emissions in 1992: 206.1%
> Methane emissions (2012): 106.5 million metric tons (CO2e)
> Population (2017): 69.0 million
> GDP per capita (2017): $16,279
Thailand’s GDP quadrupled and its CO2 emissions tripled between 1992 and 2017. Thailand’s energy production from coal expanded by 31.6% between 2006 and 2016 — even as it made a major shift to natural gas.
Thailand has announced in the last few years aggressive goals in reducing its carbon output. Most recently, the country said it will reduce its GHG emissions by 20% by 2030 through increased alternative energy production and improved mass transit.
[in-text-ad]
19. Italy
> CO2 emissions from fossil fuel (2017): 355.45 million metric tons
> CO2 emissions from fossil fuel per person (2017): 5.9 metric tons
> Change from CO2 emissions in 1992: -19.1%
> Methane emissions (2012): 35.2 million metric tons (CO2e)
> Population (2017): 60.5 million
> GDP per capita (2017): $35,343
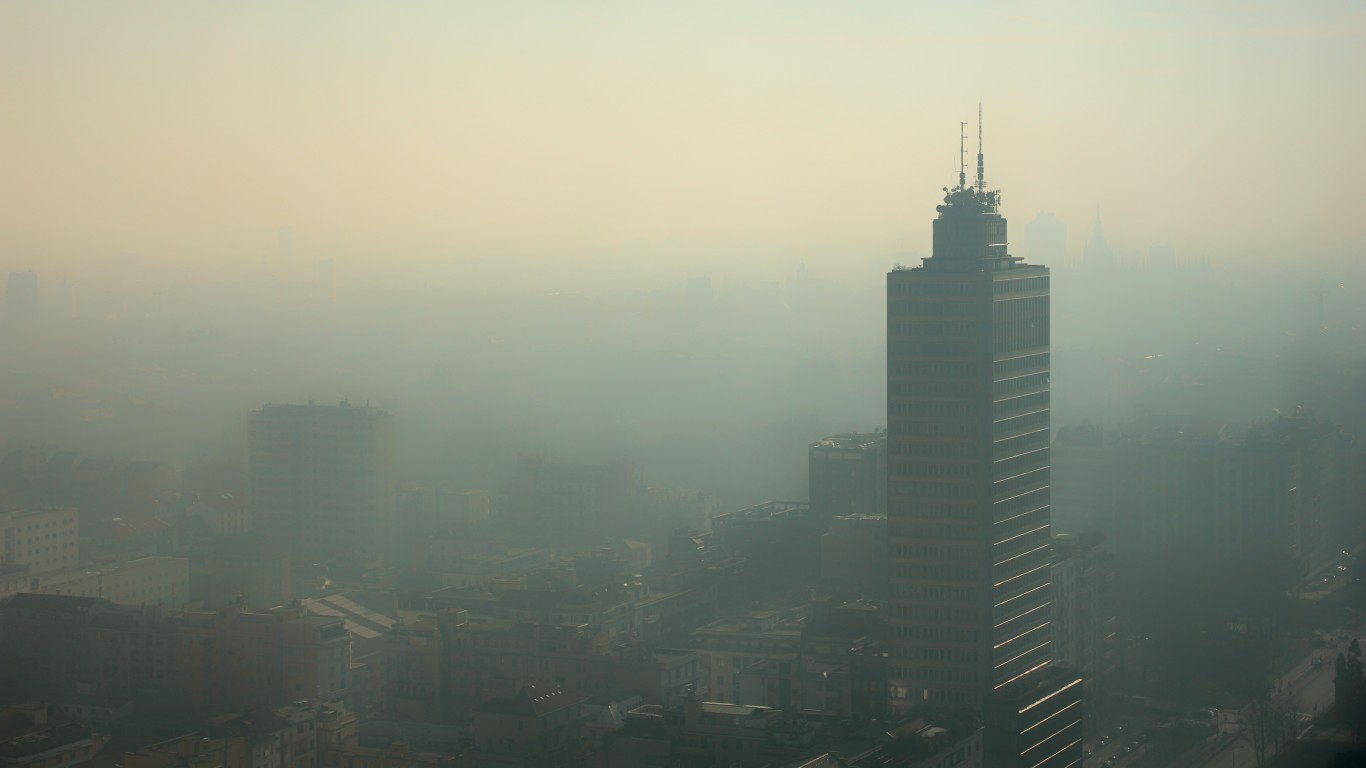
Italy’s carbon dioxide emissions peaked in 2004 at 495.5 million metric tons, and then declined to 348.5 million metric tons in 2014. While Italy’s CO2 emissions ticked up in 2017, they were down 19.1% from 1992.
The country reduced its GHG emissions by significantly increasing renewable sources of energy. Between 2006 and 2016, Italy’s energy generation from renewable sources rose 17.0% annually from 3.4 million to 15.5 million tons of oil equivalent.
18. France
> CO2 emissions from fossil fuel (2017): 356.3 million metric tons
> CO2 emissions from fossil fuel per person (2017): 5.3 metric tons
> Change from CO2 emissions in 1992: -14.9%
> Methane emissions (2012): 81.2 million metric tons (CO2e)
> Population (2017): 67.1 million
> GDP per capita (2017): $38,808
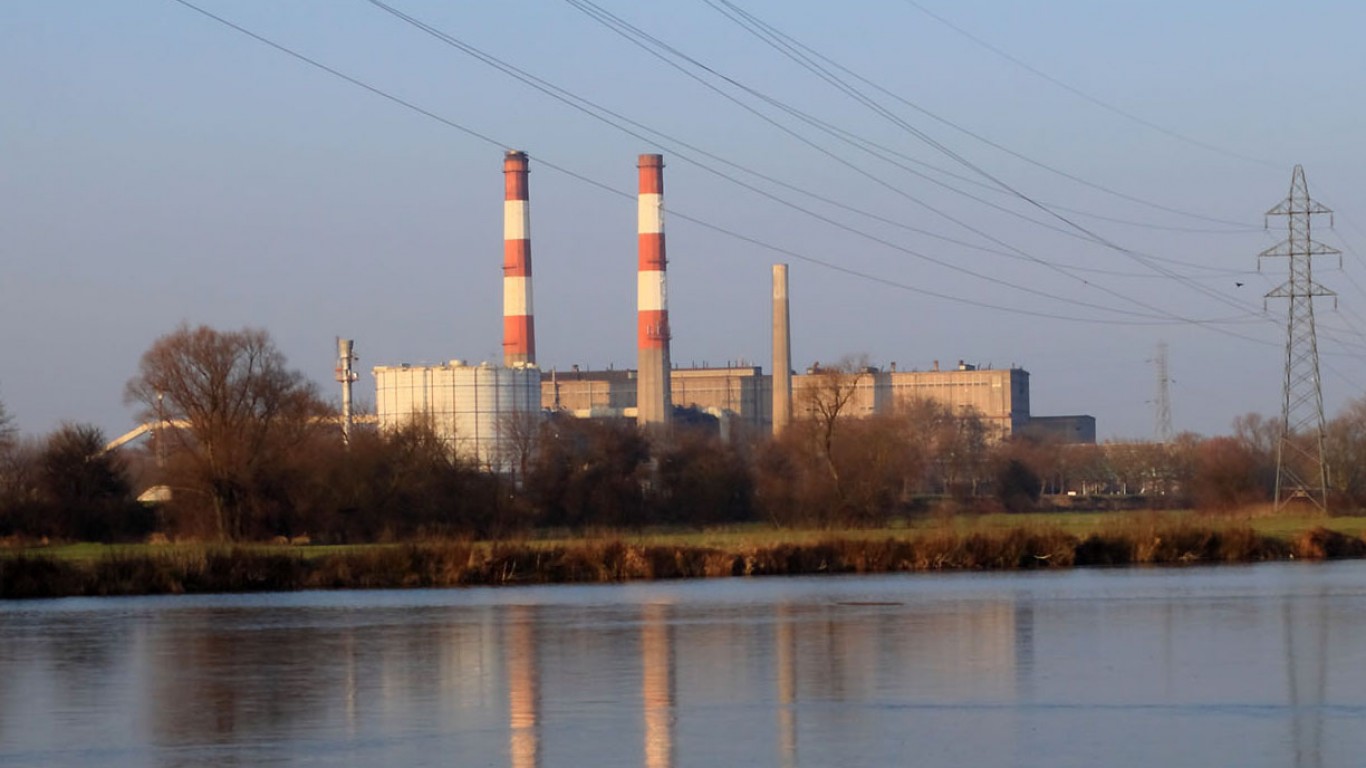
France and Spain have similar levels of per capita emissions, though France has a higher GDP per capita. Because of France’s reliance on nuclear power over the past 40 years, it has produced relatively low, and declining, CO2 emissions. Close to 80% of electricity produced in France comes from nuclear power, the highest such share of any country in the world.
In recent years, France has also reduced its carbon footprint with a strong move toward renewable energy. According to British Petroleum’s (BP) June 2018 Statistics Review of World Energy, energy generation in France from renewable sources rose by 19.9% a year between 2006 and 2016.
17. United Kingdom
> CO2 emissions from fossil fuel (2017): 384.7 million metric tons
> CO2 emissions from fossil fuel per person (2017): 5.8 metric tons
> Change from CO2 emissions in 1992: -35.2%
> Methane emissions (2012): 59.0 million metric tons (CO2e)
> Population (2017): 66.0 million
> GDP per capita (2017): $39,884
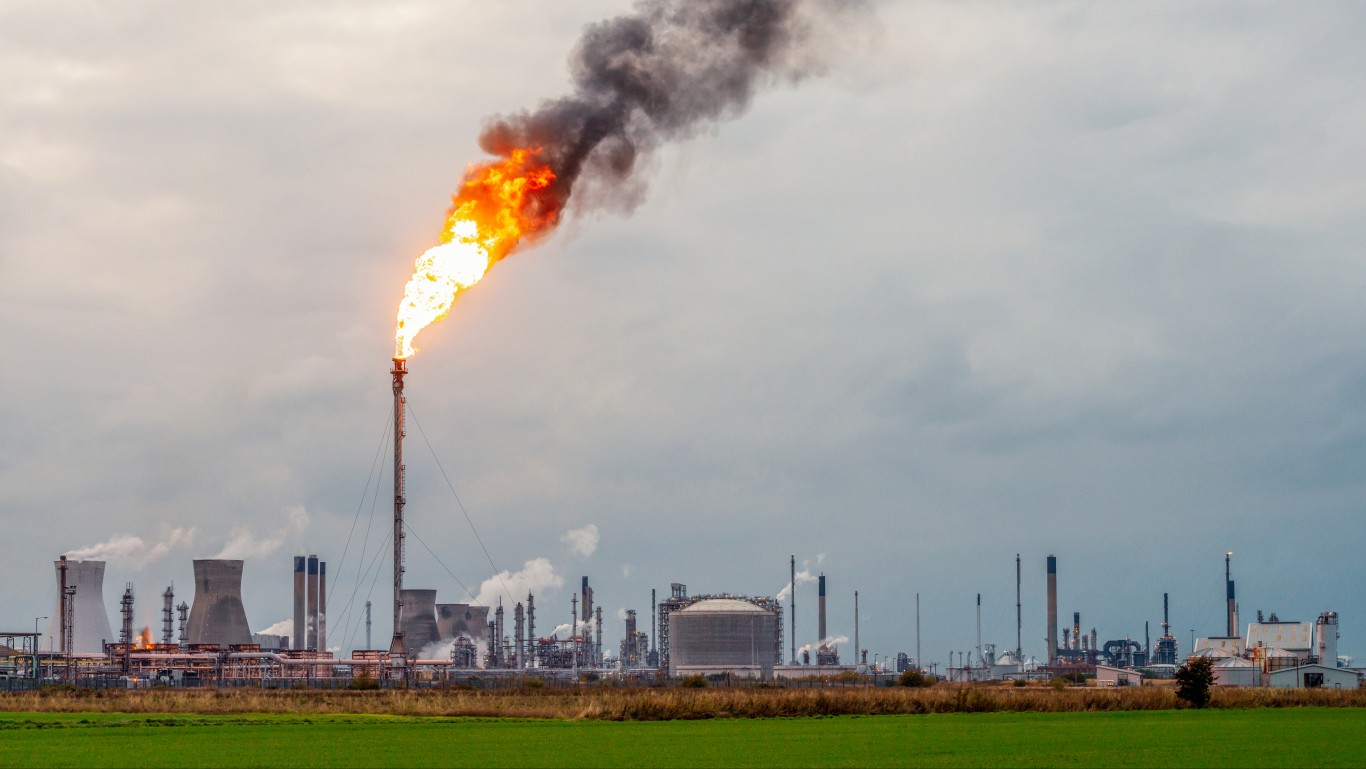
While the United Kingdom ranks among the top emitters of carbon, it has significantly reduced its carbon emissions — by about 35% between 1992 and 2017. Only a few countries in the world can claim any reduction at all, and most of them not nearly the reduction that the U.K. has managed.
The biggest reason for the U.K.’s success in reducing its carbon output is the country’s phasing out of coal-fired power in favor of natural gas and renewables. Other factors include improved energy efficiency from both the residential sector and industry.
[in-text-ad-2]
16. Australia
> CO2 emissions from fossil fuel (2017): 413.1 million metric tons
> CO2 emissions from fossil fuel per person (2017): 16.8 metric tons
> Change from CO2 emissions in 1992: 45.0%
> Methane emissions (2012): 125.6 million metric tons (CO2e)
> Population (2017): 24.6 million
> GDP per capita (2017): $44,643
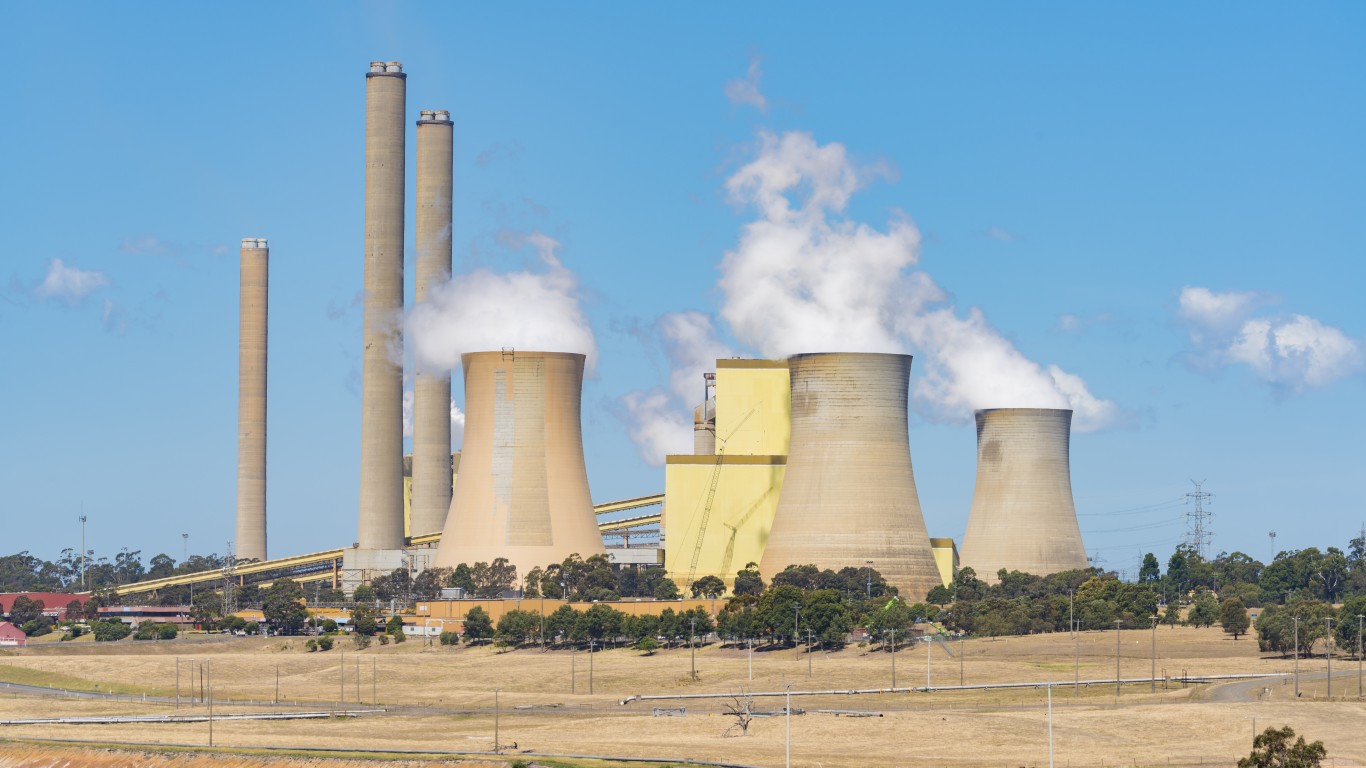
With less than half the population of Great Britain, Australia also had less than half the carbon emissions of the U.K. in 1992. By 2017, the relative carbon output shifted dramatically, with Australia emitting more than the U.K. as Britain reduced its use of fossil fuels.
Over the last decade, Australia’s emissions from energy production have leveled off, but emissions from industrial and transportation sources have increased significantly. Though Australia has added to its renewable energy resources, it is still planning a new coal-fired power plant and may have a difficult time meeting its Paris Agreement obligations.
15. Turkey
> CO2 emissions from fossil fuel (2017): 447.9 million metric tons
> CO2 emissions from fossil fuel per person (2017): 5.5 metric tons
> Change from CO2 emissions in 1992: 181.6%
> Methane emissions (2012): 78.9 million metric tons (CO2e)
> Population (2017): 80.7 million
> GDP per capita (2017): $25,135
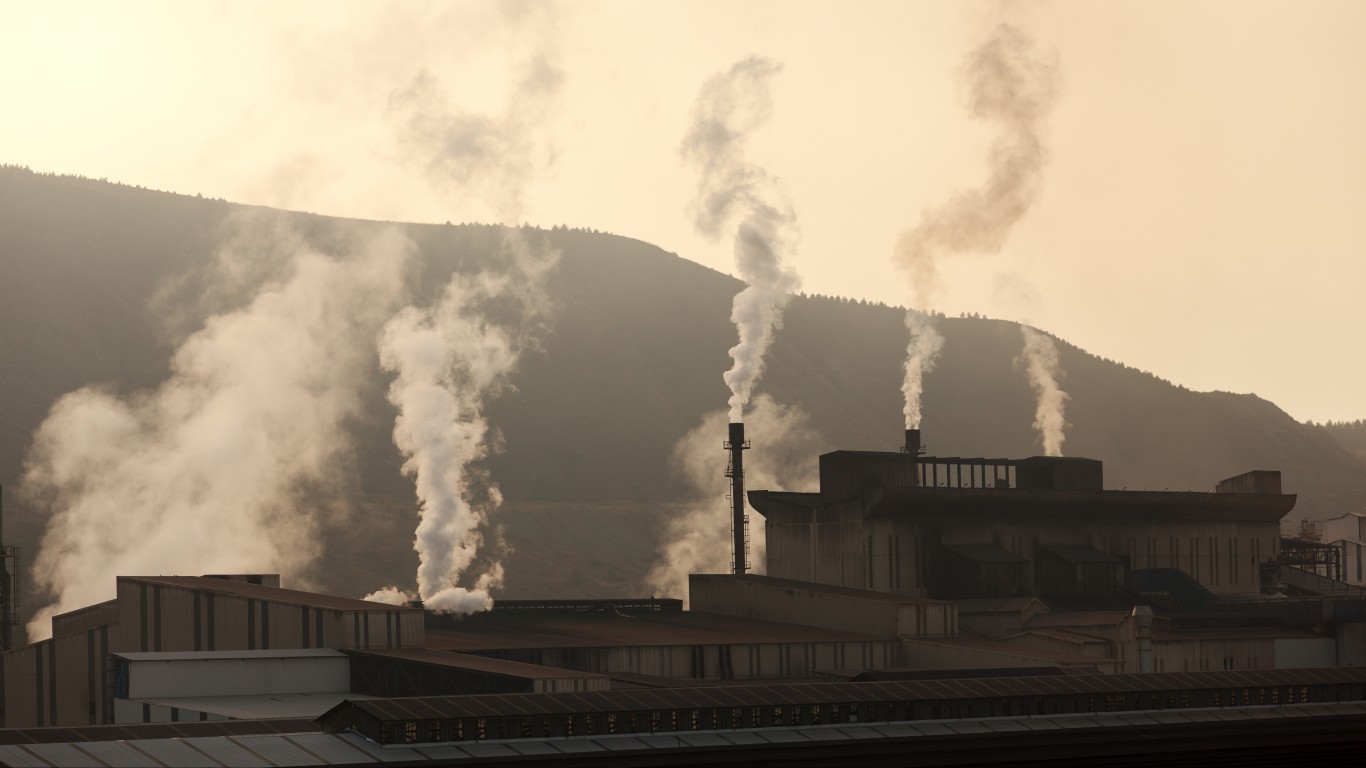
Turkey greatly increased its CO2 emissions over the 25 years through 2017, from 159.1 million metric tons to 447.9 million metric tons — an increase of 181.6%. This is only partially explained by the significant increase in population — a nearly 45% population growth between 1992 and 2017. Economic growth in Turkey has also contributed to growing CO2 emissions, with the economy tripling in size over the last two decades.
The country, however, is heavily reliant on coal for energy. Its lack of a clear target or cohesive plan for greenhouse gas reduction is one roadblock to its entry into the EU.
[in-text-ad]
14. South Africa
> CO2 emissions from fossil fuel (2017): 456.3 million metric tons
> CO2 emissions from fossil fuel per person (2017): 8.0 metric tons
> Change from CO2 emissions in 1992: 51.6%
> Methane emissions (2012): 63.2 million metric tons (CO2e)
> Population (2017): 56.7 million
> GDP per capita (2017): $12,294
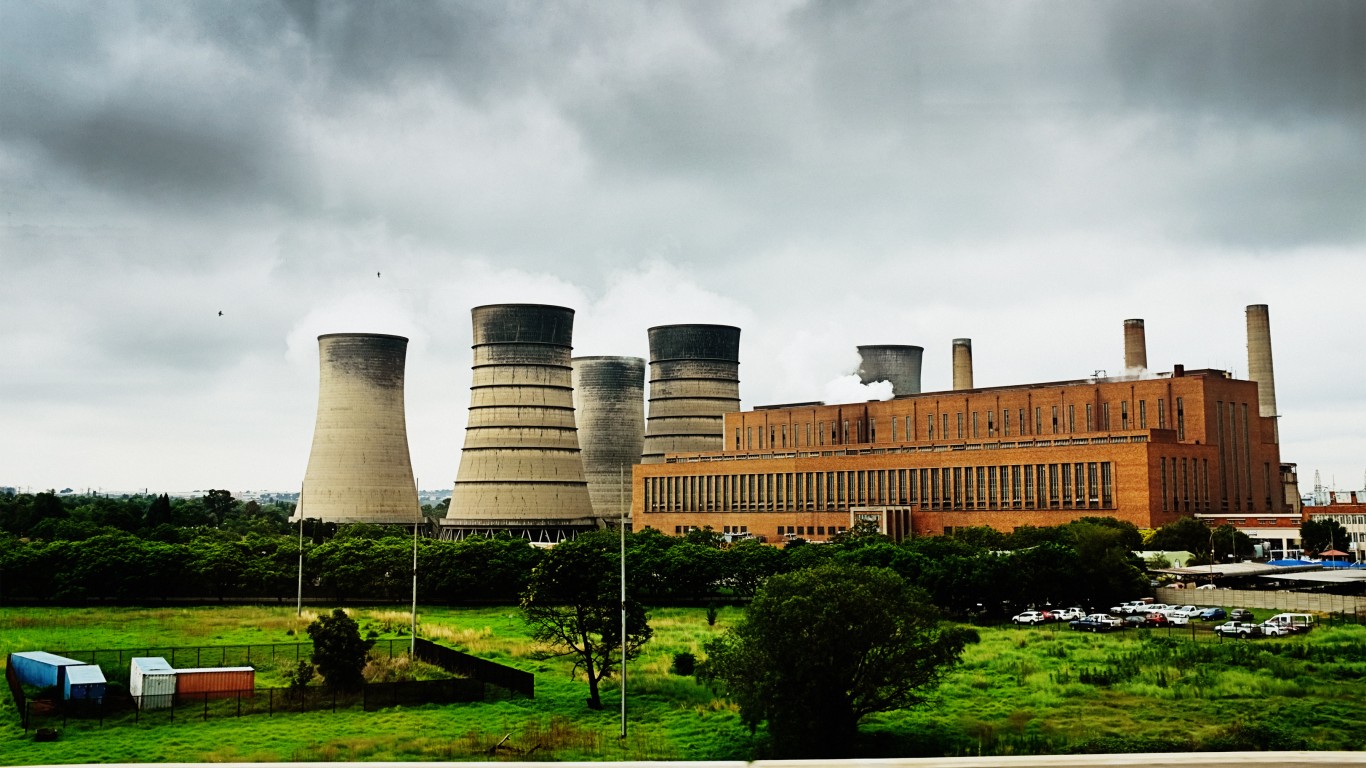
South Africa has had a similar percentage population growth as Turkey but with a much smaller increase in CO2 emissions, partly due to a slowing economy. Like Turkey, it is heavily reliant on coal for its energy, but last August new President Cyril Ramaphosa announced a plan to close 35 of the country’s 42 coal plants by 2050 and shift to natural gas and renewable energy. Even considering South Africa’s social problems, particularly poverty and inequality, Climate Action Tracker (CAT), a consortium of research organizations tracking worldwide progress on climate action, has criticized the plan as “highly insufficient” for meeting the country’s Paris Agreement goals.

13. Brazil
> CO2 emissions from fossil fuel (2017): 476.1 million metric tons
> CO2 emissions from fossil fuel per person (2017): 2.3 metric tons
> Change from CO2 emissions in 1992: 118.0%
> Methane emissions (2012): 477.1 million metric tons (CO2e)
> Population (2017): 209.3 million
> GDP per capita (2017): $14,137
Brazil’s greenhouse gas emission sources are very different from other high emission countries. In 2015, the country produced 61.8% of its electricity from hydroelectric sources, which while down from 92.4% in 1992, was still among the highest such shares of any country in the world. While hydroelectric sources contribute less to CO2 emissions than other sources, Brazil’s CO2 emissions still rose by 118% over the 25 years through 2017. The country also has a massive output of methane — a much more powerful greenhouse gas than CO2.
The country’s large spikes in total GHG emissions are the result of the agricultural sector and the loss of forested land, which functions as a “carbon sink,” absorbing CO2. While polls show that most Brazilians are concerned about climate change, the current administration appears to be deferential to agriculture interests and uninclined to curb deforestation. Deforestation of the Amazon climbed by 29% in 2016, resulting in nearly 2 million acres lost.
12. Indonesia
> CO2 emissions from fossil fuel (2017): 486.8 million metric tons
> CO2 emissions from fossil fuel per person (2017): 1.8 metric tons
> Change from CO2 emissions in 1992: 139.0%
> Methane emissions (2012): 223.3 million metric tons (CO2e)
> Population (2017): 264.0 million
> GDP per capita (2017): $11,189
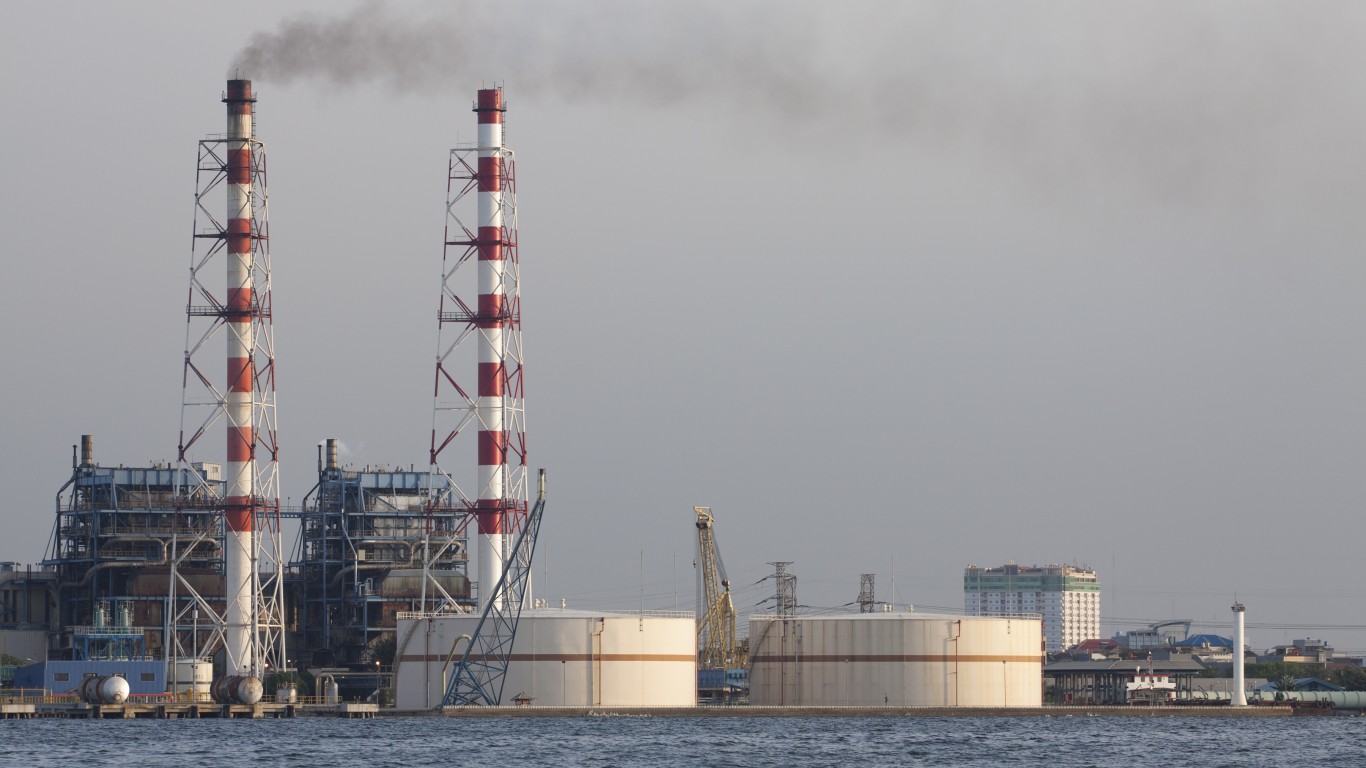
Indonesia looks a lot like Brazil and South Africa in its level of CO2 emissions, but its population is nearly the size of both countries’ populations combined. All three countries have relatively low GDP per capita. But while Indonesia has the lowest GDP per capita of the three nations, its economy grew twice as fast between 1992 and 2017. This can provide some explanation for its greater increase in emissions during that time period than the other two countries.
Indonesia’s economy is likely to become even more carbon intensive with its growing middle class, automobile use, and energy demands, and with the government’s focus on more coal-fired power plants instead of renewables.
[in-text-ad-2]
11. Mexico
> CO2 emissions from fossil fuel (2017): 490.3 million metric tons
> CO2 emissions from fossil fuel per person (2017): 3.8 metric tons
> Change from CO2 emissions in 1992: 46.7%
> Methane emissions (2012): 116.7 million metric tons (CO2e)
> Population (2017): 129.2 million
> GDP per capita (2017): $17,331
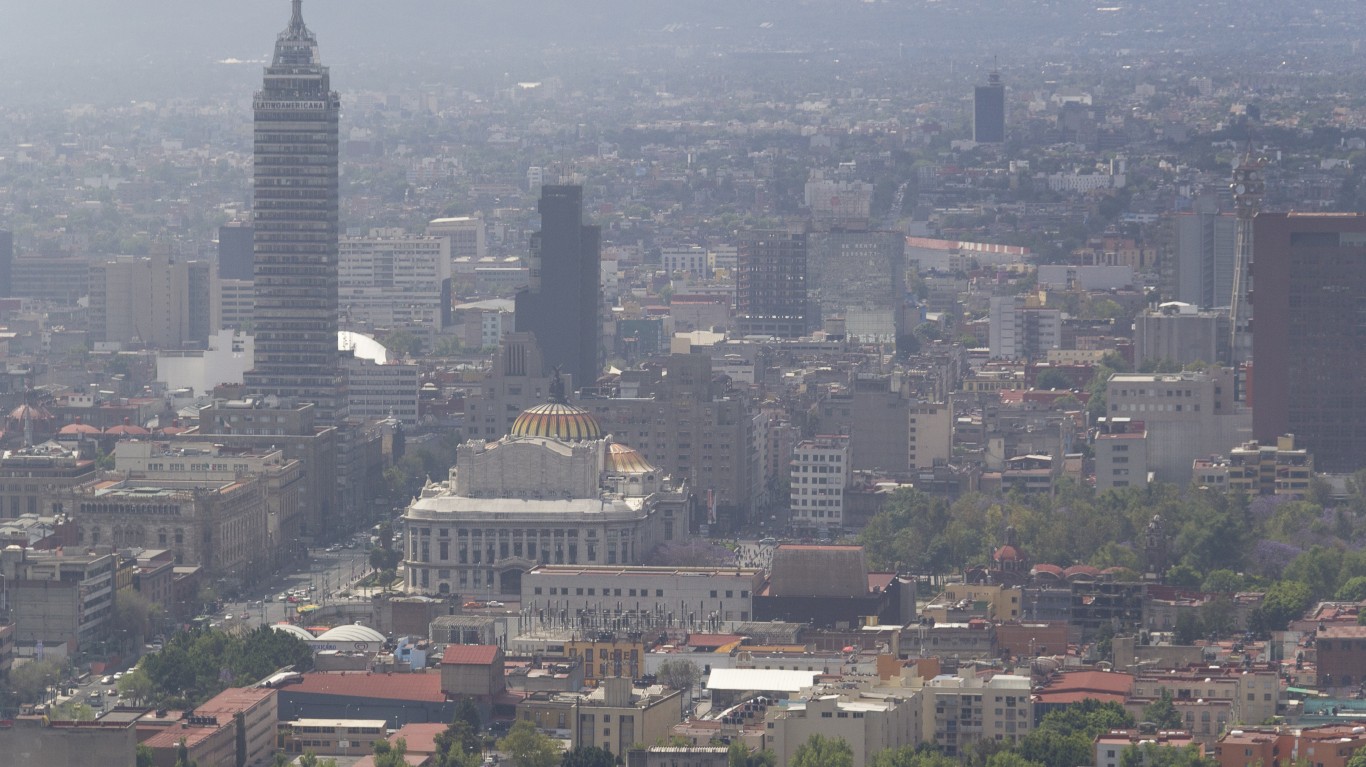
Mexico emits about the same amount of carbon as Indonesia but with half the population. Until recently, Mexico had set aggressive climate change goals and had been on a path toward carbon reduction and cleaner energy. Today, the country’s politics are moving it in a direction more in line with that of Indonesia, with renewable energy planning replaced with a comprehensive upgrading of aging fossil fuel plants and a heavy reliance on coal.
10. Canada
> CO2 emissions from fossil fuel (2017): 572.8 million metric tons
> CO2 emissions from fossil fuel per person (2017): 15.6 metric tons
> Change from CO2 emissions in 1992: 22.2%
> Methane emissions (2012): 106.8 million metric tons (CO2e)
> Population (2017): 36.7 million
> GDP per capita (2017): $44,018
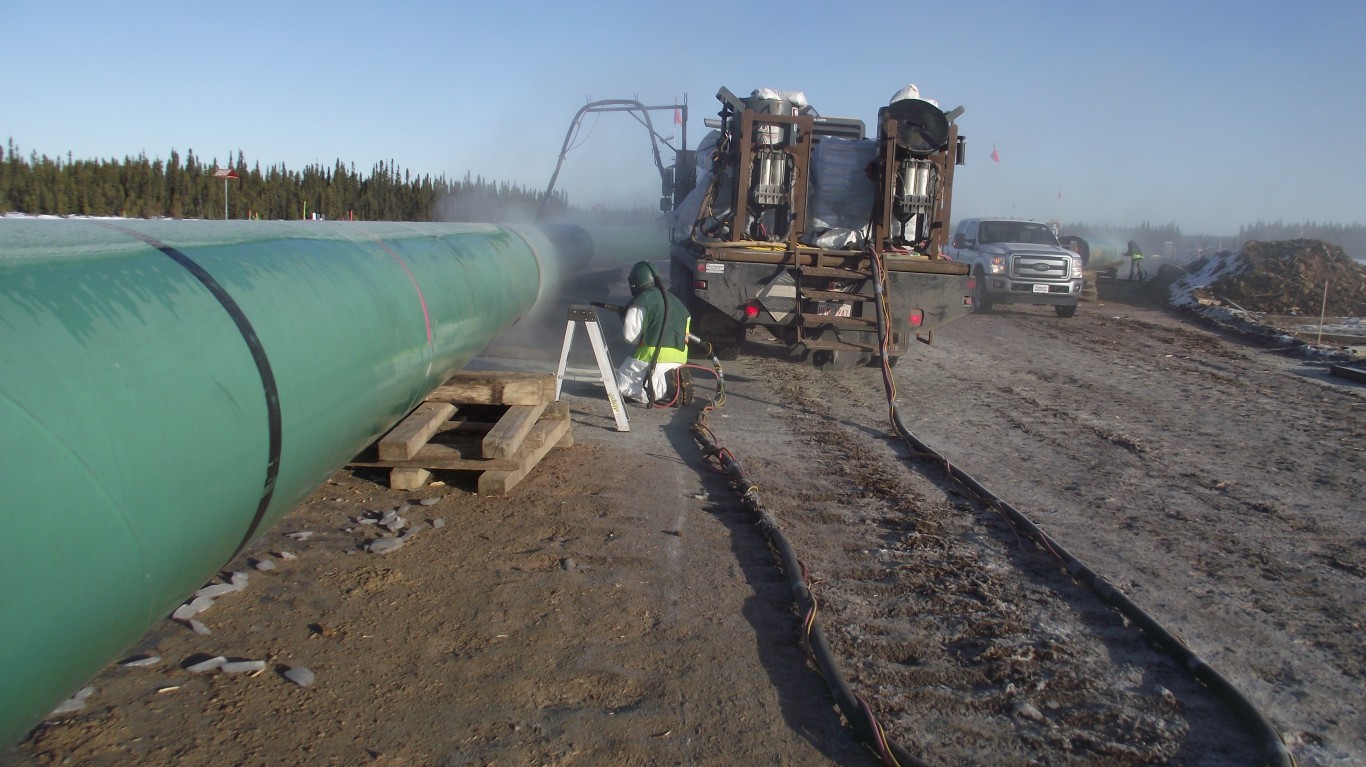
Out of the 25 top CO2 emitters, Canada has close to the highest per capita carbon emission rate at 15.6 metric tons. Largely to blame for this ignominious status is its huge landmass and dispersed population as well as the country’s extreme temperatures — Canadians live energy-intensive lives. While some progress has been made in the development of renewable energy resources — which have nearly quadrupled since 2007 to the equivalent of 10 million tons of oil — efforts to curb CO2 have been undermined by huge subsidies to the coal and oil and gas industries, amounting to $3.3 billion annually, according to Environmental Defence, a Canadian environmental advocacy organization.
Though the government insists Canada is on track to meet its Paris Agreement goal of reducing carbon emissions by 30% from 2005 levels by 2030, projections show the country is behind.
[in-text-ad]
9. South Korea
> CO2 emissions from fossil fuel (2017): 616.1 million metric tons
> CO2 emissions from fossil fuel per person (2017): 12.0 metric tons
> Change from CO2 emissions in 1992: 118.3%
> Methane emissions (2012): 32.6 million metric tons (CO2e)
> Population (2017): 51.5 million
> GDP per capita (2017): $35,938
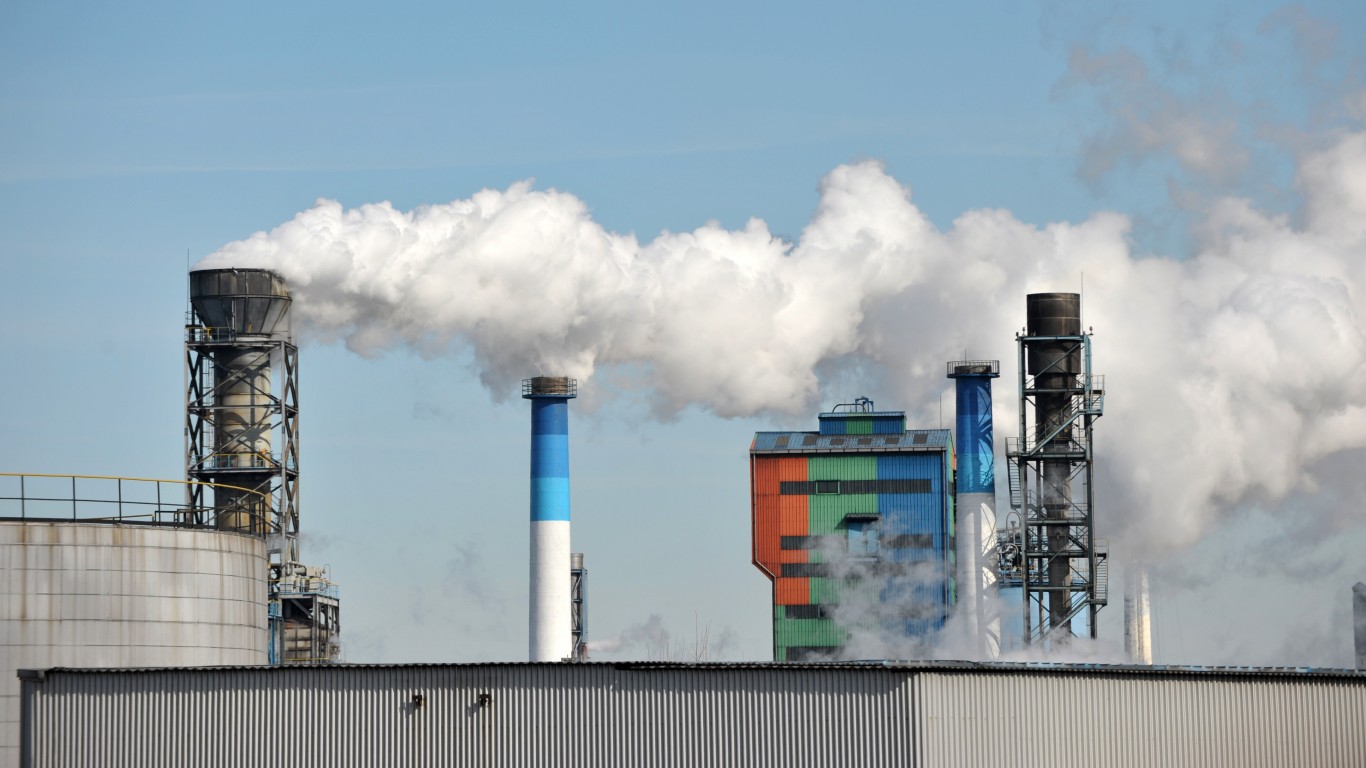
South Korea is responsible for 1.7% of the global carbon output, though South Koreans make up only 0.7% of the global population. With its fast-growing economy, GDP more than tripled and CO2 emissions more than doubled between 1992 and 2017, with more cars on the road and a growing demand for energy for residential use.
Korea has pledged to reduce its GHG output by 37% by 2030, but at the same time, it has built only a tiny amount of alternative energy infrastructure and is planning to construct 20 new coal plants in the next three years.

8. Saudi Arabia
> CO2 emissions from fossil fuel (2017): 635.0 million metric tons
> CO2 emissions from fossil fuel per person (2017): 19.3 metric tons
> Change from CO2 emissions in 1992: 122.8%
> Methane emissions (2012): 62.9 million metric tons (CO2e)
> Population (2017): 32.9 million
> GDP per capita (2017): $48,986
Between 1992 and 2017, the population and economy of Saudi Arabia nearly doubled. With this phenomenal growth came phenomenal CO2 emissions growth of 122.8% over thE 25 year period.
As the world’s largest oil producer, it is not surprising that virtually all of the country’s energy comes from oil and gas, with a miniscule amount of 0.1% in 2017 from renewables. While Saudi Arabia was seen by many in the early 1990s as taking an obstructionist position toward international climate negotiations and skepticism toward climate science, it signed the Paris climate agreement, with the caveat that its economy must not suffer an “abnormal burden.”
7. Iran
> CO2 emissions from fossil fuel (2017): 672.3 million metric tons
> CO2 emissions from fossil fuel per person (2017): 8.3 metric tons
> Change from CO2 emissions in 1992: 196.2%
> Methane emissions (2012): 121.3 million metric tons (CO2e)
> Population (2017): 81.2 million
> GDP per capita (2017): $18,983
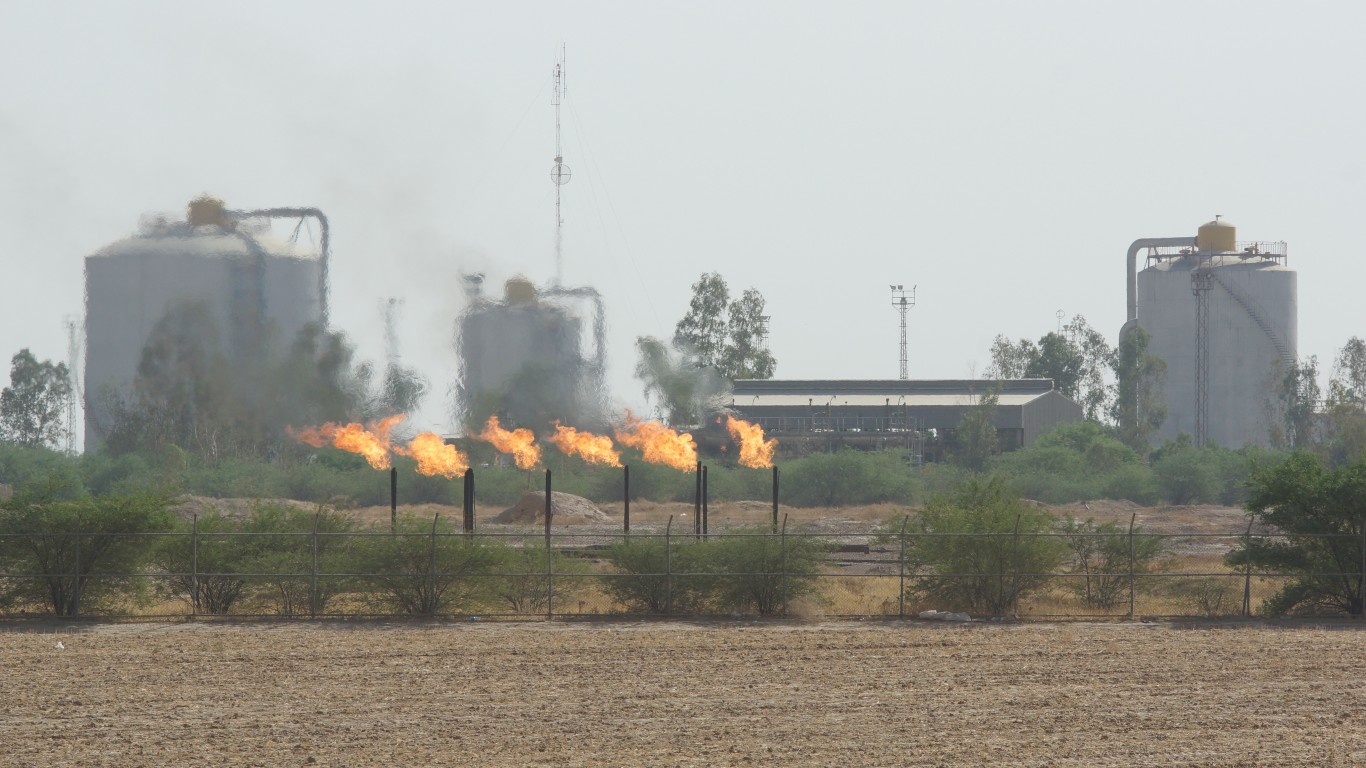
Like Saudi Arabia, Iran’s population growth was fast, at nearly 40%, and in its GDP more than doubled from 1992 to 2017. This growth was accompanied by a similar increase in CO2 emissions. The similarities end here. Iran’s GDP per capita is less than half that of Saudi Arabia, and it has been struggling under economic sanctions for many years. Also, unlike its neighbor across the Persian Gulf, Iran was an early signer of the Paris Agreement and has made pursuing a green economy a priority. It has pledged to slash emissions and reform its energy sector, having received promises from the EU for help with technology.
Climate change has had a strong impact on Iran, which has faced numerous ecological problems tied to the climate emergency — from shrinking lakes and rivers to floods and droughts. Lake Urmia, the largest in the Middle East, may be completely dry in six to nine years.
[in-text-ad-2]
6. Germany
> CO2 emissions from fossil fuel (2017): 799.4 million metric tons
> CO2 emissions from fossil fuel per person (2017): 9.7 metric tons
> Change from CO2 emissions in 1992: -17.3%
> Methane emissions (2012): 55.7 million metric tons (CO2e)
> Population (2017): 82.7 million
> GDP per capita (2017): $45,446
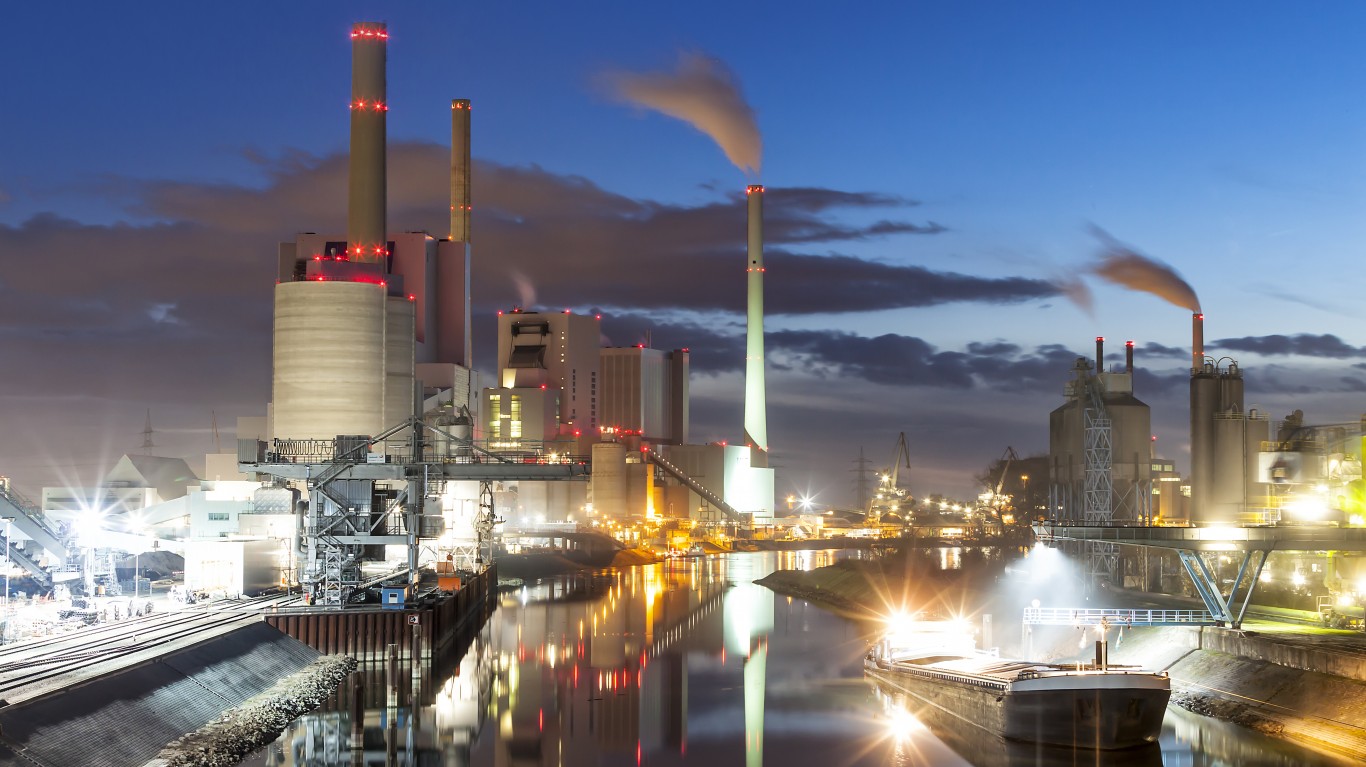
Germany is showing progress in carbon reduction, having lowered its output by over 17% between 1992 and 2016. The country also has the most aggressive plan for further reductions than any other EU nation. While many climate scientists argue for the continuation, and even expansion, of nuclear power because of its zero emissions, Germany is phasing out its nuclear plants. While CO2 emissions from most countries on this list have increased substantially between 1992 and 2017, Germany’s CO2 emissions declined by 17.3% over that period.
The country, however, is still heavily dependent on coal — and most of its plants burn lignite, the dirtiest coal. In 2015, Germany generated 44.3% of its electricity from coal sources.

5. Japan
> CO2 emissions from fossil fuel (2017): 1,205.1 million metric tons
> CO2 emissions from fossil fuel per person (2017): 9.5 metric tons
> Change from CO2 emissions in 1992: 2.4%
> Methane emissions (2012): 39.0 million metric tons (CO2e)
> Population (2017): 126.8 million
> GDP per capita (2017): $39,011
Japan’s CO2 emissions peaked in the three years following the 2011 Fukushima nuclear disaster, reaching 1,314 million metric tons of CO2 in 2013. Emissions have since been reduced to pre-2011 levels as the country has increased its use of renewables — now about 5% of its energy mix. Still, Japan is heavily reliant on oil and is criticized for its promotion of coal and technology to reduce CO2 emissions from coal.
[in-text-ad]
4. Russian Federation
> CO2 emissions from fossil fuel (2017): 1,692.8 million metric tons
> CO2 emissions from fossil fuel per person (2017): 11.7 metric tons
> Change from CO2 emissions in 1992: -15.1%
> Methane emissions (2012): 545.8 million metric tons (CO2e)
> Population (2017): 144.5 million
> GDP per capita (2017): $24,790
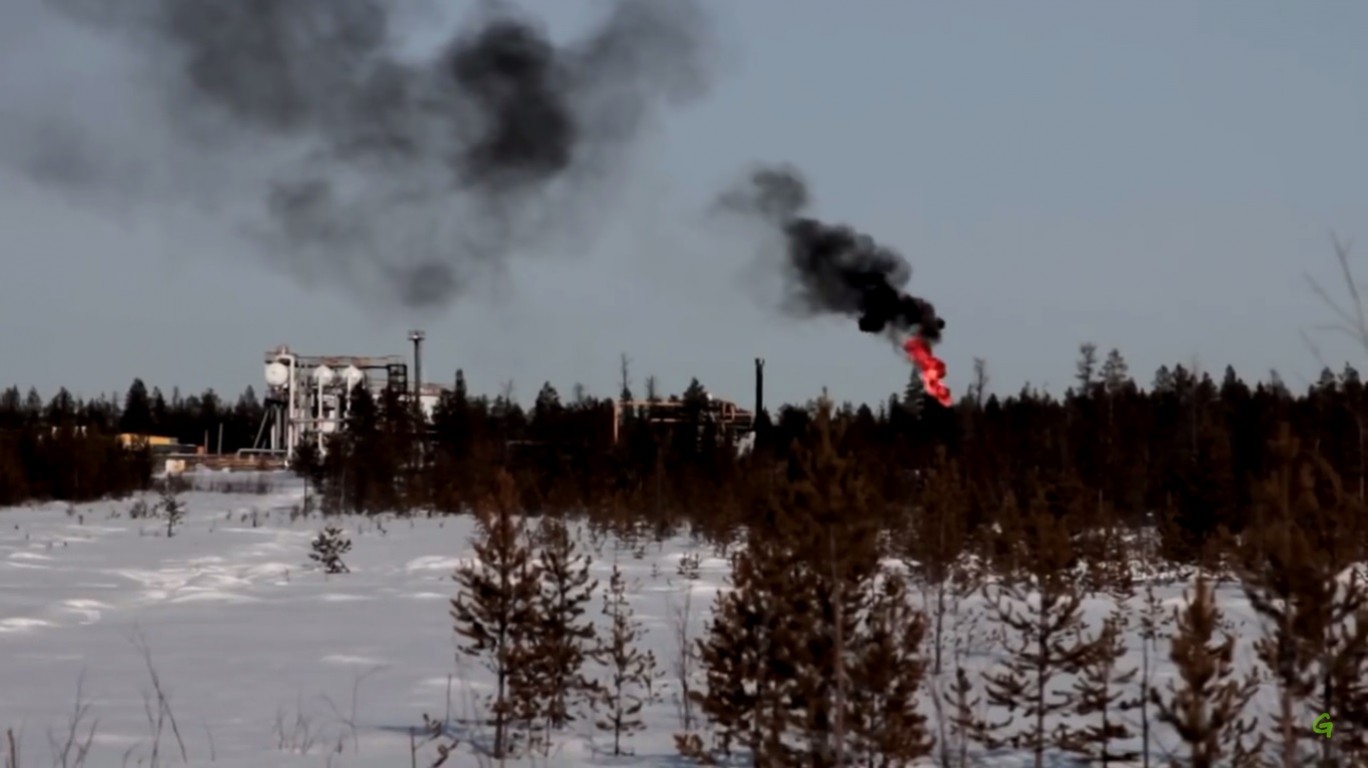
Coal remains one of the world’s largest sources of energy production. Approximately 40% of electricity produced worldwide came from coal sources in 2015. Russia is somewhat of an exception, relying heavily over the past 25 years on natural gas for electricity production — gas was the source of roughly half of the country’s electricity production in both 1992 and 2015. The nation’s coal production, however, has also surged over the same period. Russia is the sixth largest coal-producing nation in the world, and coal production has risen by 70% since the late 1990s to 373 million metric tons in 2015. According to the nonprofit Carbon Disclosure Project’s Carbon Majors Database, the growth has been driven largely by the coal industry’s expansion into Southwest Siberia, where the Kuznetsk coal basin is located.
Russia’s population is 2.8% smaller than it was 25 years ago, one of only two countries on this list to report a population decline since 1992. This could partially account for the 15.1% reduction in overall CO2 emissions from Russia.
3. India
> CO2 emissions from fossil fuel (2017): 2,466.8 million metric tons
> CO2 emissions from fossil fuel per person (2017): 1.8 metric tons
> Change from CO2 emissions in 1992: 253.0%
> Methane emissions (2012): 636.4 million metric tons (CO2e)
> Population (2017): 1.34 billion
> GDP per capita (2017): $6,514
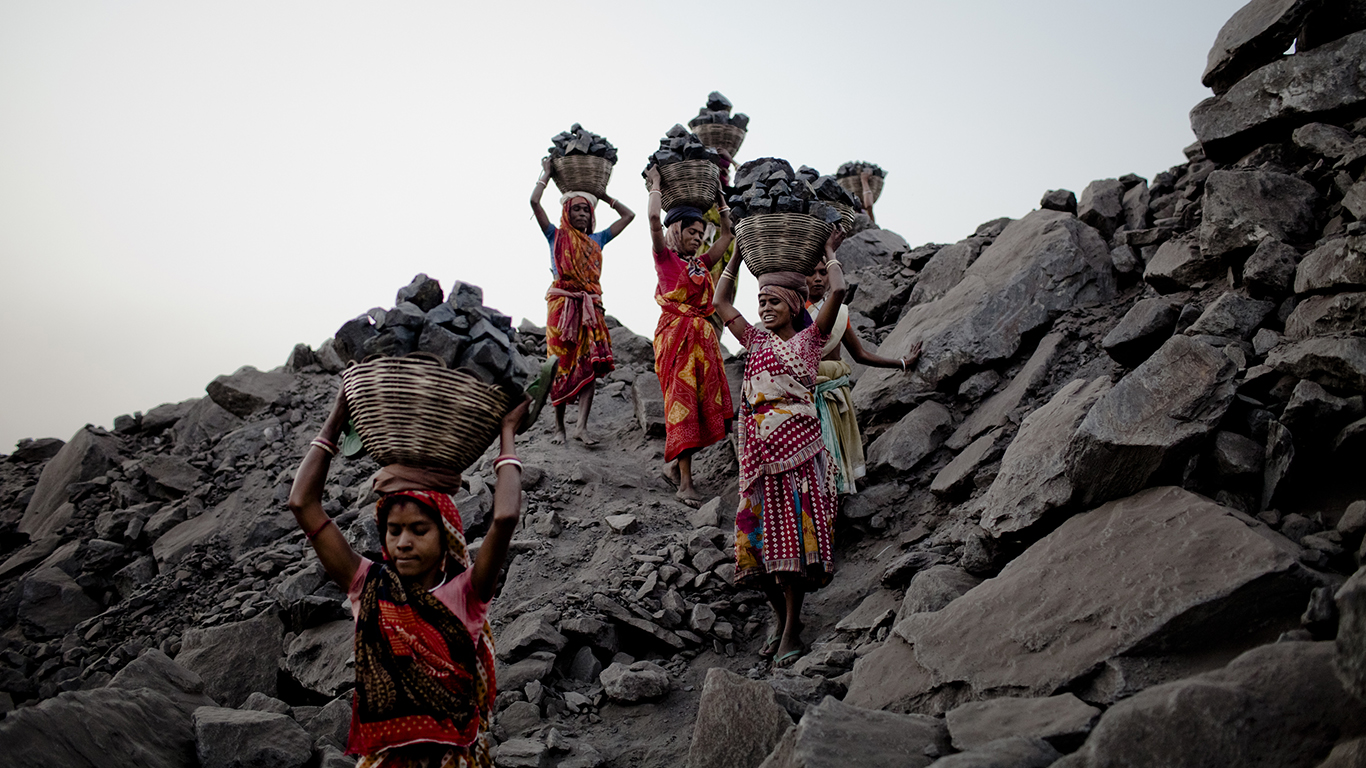
As is generally the case in the countries emitting the most CO2, a small group of companies accounts for a huge portion of emissions in India. Notably, state-owned Coal India alone emitted the equivalent of just over 1 billion metric tons of CO2 in 2015, or 2.4% of global industrial greenhouse gas emissions. This has placed the company among the world’s five corporations emitting the most CO2, according to the Carbon Majors Database.
While many of the world’s large national CO2 emitters have in recent decades reduced their reliance on coal as a source of electricity, India’s coal usage has risen — from 68% of electricity production in 1992 to 75% in 2015.
2. USA
> CO2 emissions from fossil fuel (2017): 5,269.5 million metric tons
> CO2 emissions from fossil fuel per person (2017): 16.2 metric tons
> Change from CO2 emissions in 1992: 1.8%
> Methane emissions (2012): 499.8 million metric tons (CO2e)
> Population (2017): 325.1 million
> GDP per capita (2017): $54,471
The United States was the world’s largest national CO2 emitter until 2006, when China surpassed U.S. emissions that year of 6,019 million metric tons of CO2. And while U.S. emissions have declined since, China’s emissions have steadily increased.
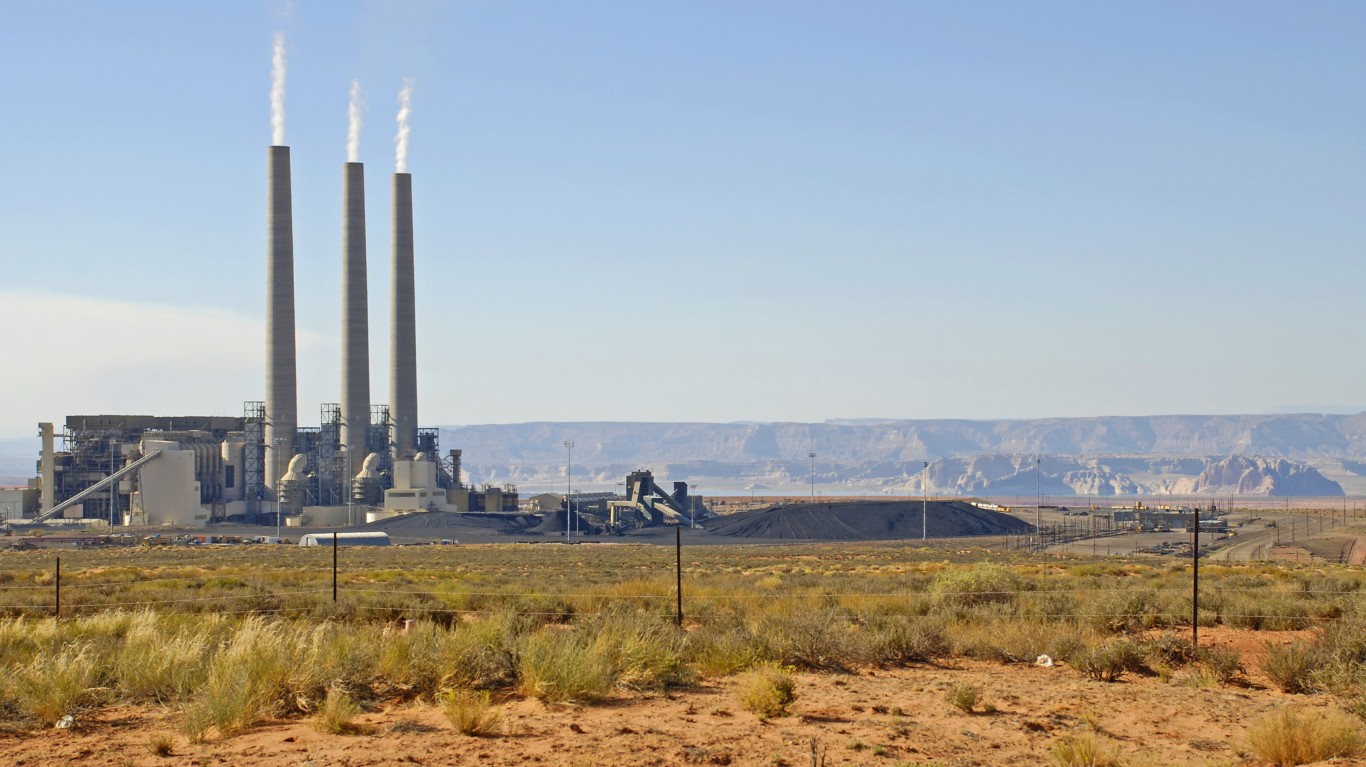
U.S. electricity production from coal sources has dropped in recent decades, from over half in 1992 to about a third of electricity production in 2015. At the same time, however, the United States has become the world’s largest producer of crude oil and significantly ramped up natural gas production and usage — though natural gas use results in relatively less CO2 emissions, the methane output during its production and destructive extraction techniques are by no means more environmentally friendly. Over the 25-year period through 2015, U.S. electricity production from natural gas sources grew from 13.1% to 31.9% of total electricity generated. In 2012, the latest data year, nearly 500 million metric tons of methane, a far more harmful GHG, was emitted by the United States, the fourth highest amount of countries on this list.
[in-text-ad-2]
1. China
> CO2 emissions from fossil fuel (2017): 9,838.8 million metric tons
> CO2 emissions from fossil fuel per person (2017): 7.1 metric tons
> Change from CO2 emissions in 1992: 270.3%
> Methane emissions (2012): 1,752.3 million metric tons (CO2e)
> Population (2017): 1.39 billion
> GDP per capita (2017): $15,309
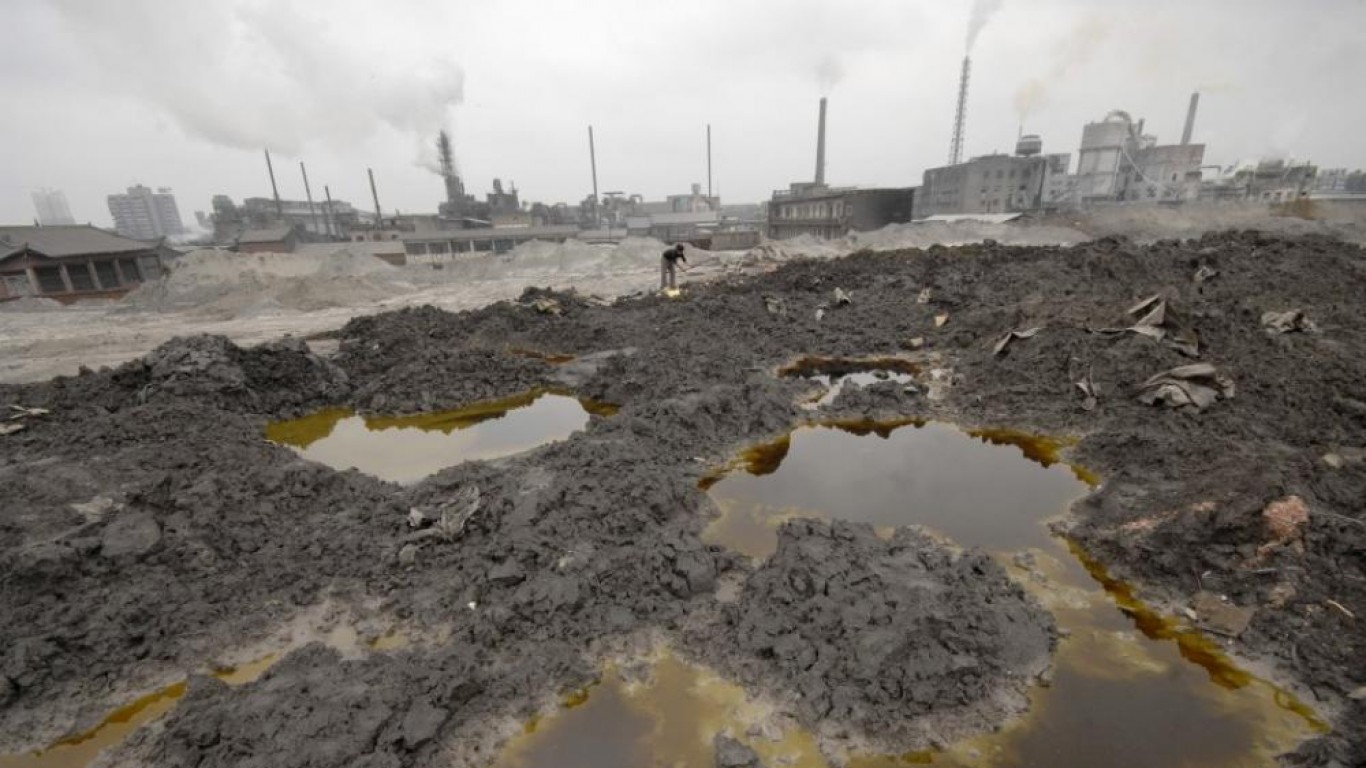
With the world’s largest population and for decades one of the fastest growing economies, China is far and away the world’s top CO2 emitter. Close to 10,000 million metric tons of CO2 from burning fossil fuel were emitted by the superpower in 2017. On a per capita basis, China’s CO2 emissions of 7.1 metric tons per person trail that of most countries on this list but still rank in the top 50 worldwide.
Driving China’s CO2 emissions is the nation’s massive coal production. China’s generation of electricity from coal has dropped slightly from 75% in 1992 to 70% in 2015. Still, overall coal production has tripled since 2000 to nearly 4,000 million metric tons — approximately half of all global coal production.
Start by taking a quick retirement quiz from SmartAsset that will match you with up to 3 financial advisors that serve your area and beyond in 5 minutes, or less.
Each advisor has been vetted by SmartAsset and is held to a fiduciary standard to act in your best interests.
Here’s how it works:
1. Answer SmartAsset advisor match quiz
2. Review your pre-screened matches at your leisure. Check out the advisors’ profiles.
3. Speak with advisors at no cost to you. Have an introductory call on the phone or introduction in person and choose whom to work with in the future
Thank you for reading! Have some feedback for us?
Contact the 24/7 Wall St. editorial team.