
By several economic indicators, the United States is in a historic era of prosperity. The unemployment rate recently hit 3.3%, its lowest point since the 1960s; the Dow Jones Industrial Average reached an all-time high last year; and over the past decade, incomes have climbed by 14% nationwide, and by at least 16% in over a dozen states.
In this context, it can be easy to overlook the parts of the country that have been left behind. In nearly every state in the nation, there is at least one county where social and economic measures reflect a poor quality of life.
To identify the worst counties to live in, 24/7 Wall St. used U.S. Census Bureau data to construct an index of three measures: poverty, the percentage of adults who have at least a bachelor’s degree, and average life expectancy at birth.
Only counties with populations of at least 10,000 were considered. County equivalents like Census areas, parishes, and independent cities were included in our analysis. Data on life expectancy is from the Institute for Health Metrics and Evaluation — an independent population health research center at the University of Washington. We also considered April 2019 unemployment rates from the Bureau of Labor Statistics.
Often, these counties have higher than typical unemployment and have reported a declining population in recent years. Many of these counties also rank as the poorest county in the state.
Click here to see the worst county to live in every state

Alabama: Wilcox County
> 5-yr. population change: -6.7% (state: +1.5%)
> Poverty rate: 31.9% (state: 18.0%)
> Adults with a bachelor’s degree: 12.0% (state: 24.5%)
> Life expectancy: 72.2 years (state: 75.7 years)
Wilcox is a county in southern Alabama, west of Montgomery. Nearly 32% of county residents live below the poverty line, more than double the 14.9% national poverty rate. Joblessness is one hurdle to prosperity. The county’s April unemployment rate of 7.0% is nearly double the national unemployment rate of 3.6%.
Likely due in part to a lack of available work, people are leaving Wilcox County. In the last five years, the county’s population shrank by 6.7%, even as the U.S. population grew by 3.8%.
[in-text-ad]
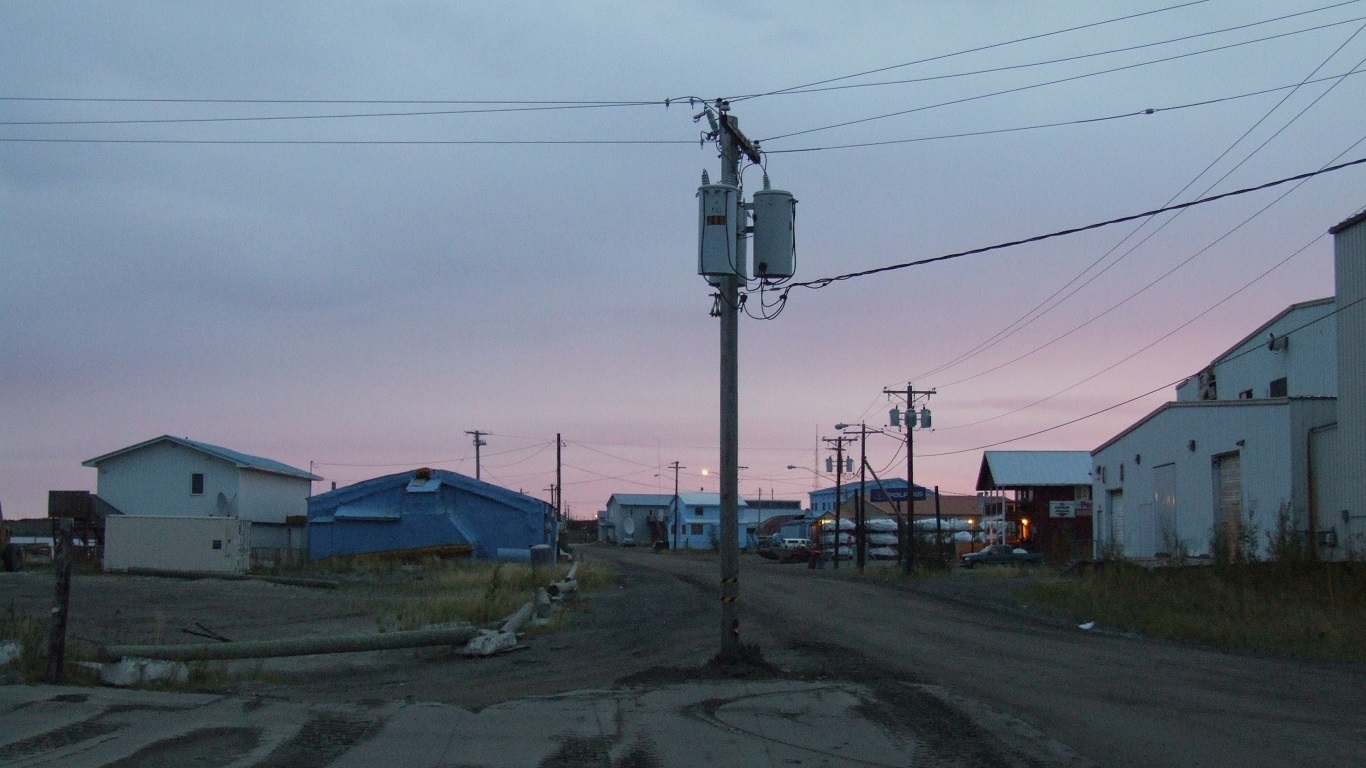
Alaska: Bethel Census Area
> 5-yr. population change: +4.5% (state: +3.9%)
> Poverty rate: 27.0% (state: 10.2%)
> Adults with a bachelor’s degree: 12.6% (state: 29.0%)
> Life expectancy: 74.3 years (state: 78.4 years)
Life expectancy at birth in Alaska’s Bethel Census Area — a designation specific to Alaska that is treated as a county equivalent by the U.S. Census Bureau — is just 74 years, four years below the average life expectancy of 78.4 years across the state as a whole. Poverty can be detrimental to personal health, and in Bethel, 27% of the population lives below the poverty line, nearly triple the 10.2% statewide poverty rate.
The county’s low median household income is partially the result of a weak job market. The county’s unemployment rate stands at 13.7%. Nationwide, the unemployment rate is just 3.6%.
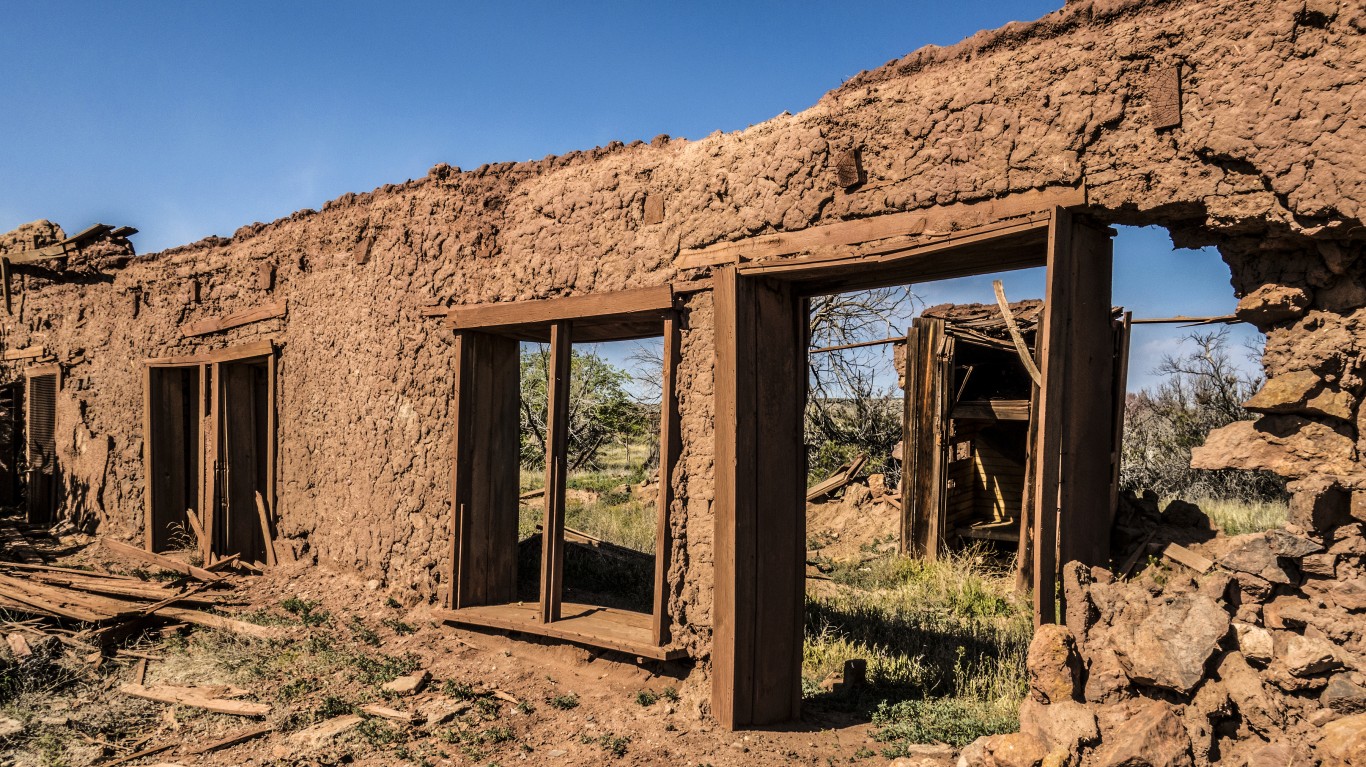
Arizona: Apache County
> 5-yr. population change: +0.0% (state: +6.2%)
> Poverty rate: 35.9% (state: 17.0%)
> Adults with a bachelor’s degree: 11.5% (state: 28.4%)
> Life expectancy: 74.3 years (state: 79.6 years)
Apache County is located in the northeastern corner of Arizona, sharing a border with Utah and New Mexico. The Navajo Nation Reservation comprises much of Apache County; native American reservations often struggle with social and economic challenges. In the county, more than one in every three residents live below the poverty line. The financial hardship is partially attributable to the lack of job opportunities in the county. As of April 2019, 8.6% of the county’s labor force was out of work, compared to the 3.6% national unemployment rate.
In addition to economic struggles, the county also struggles with/faces several health issues. Unhealthy habit are relatively common in Apache County. County adult residents are more likely to smoke and less likely to lead physically active lifestyles than the typical Arizona resident. Also, average life expectancy in the county is just 74 years, and Apache ranks as the least healthy county in Arizona.

Arkansas: Phillips County
> 5-yr. population change: -9.8% (state: +2.1%)
> Poverty rate: 33.0% (state: 18.1%)
> Adults with a bachelor’s degree: 11.3% (state: 22.0%)
> Life expectancy: 71.3 years (state: 76.2 years)
Phillips County, located along the banks of the Mississippi in the Arkansas Delta region, is the second oldest county in the state. It is also the worst county to live in the state. Life expectancy is an indicator of local conditions, and in Phillips County, the average life expectancy is just 71.3 years, about eight years below the national life expectancy.
Many of the worst counties to live in are losing residents rapidly, but few are shrinking as fast as Phillips County. In the last five years, the number of people living in the county fell by 9.8%, even as the U.S. population grew by 3.8%. Currently, the county is home to fewer than 20,000 people, down from a peak of over 46,000 in 1950.
[in-text-ad-2]

California: Lake County
> 5-yr. population change: -0.4% (state: +4.4%)
> Poverty rate: 22.8% (state: 15.1%)
> Adults with a bachelor’s degree: 15.3% (state: 32.6%)
> Life expectancy: 75.8 years (state: 80.8 years)
California’s population grew by 4.4% in the last five years, outpacing the comparable 3.8% national population growth. Lake County, however, was one of the few counties in the state to report population decline. Over the last five years, the number of people living in the county fell by 0.4%.
Sub-optimal economic conditions may be driving people out of the county. The county’s April unemployment rate of 5.1% is above both the 4.3% state unemployment rate and the 3.6% national rate. For those who are working in Lake County, incomes are generally low. The typical area household income is just $40,446 a year compared to the median annual household income across the state as a whole of $67,169.

Colorado: Otero County
> 5-yr. population change: -2.5% (state: +7.8%)
> Poverty rate: 22.9% (state: 11.5%)
> Adults with a bachelor’s degree: 17.7% (state: 39.4%)
> Life expectancy: 76.4 years (state: 80.2 years)
Colorado’s population is one of the fastest growing in the country. In the last five years, the number of people living in the state climbed by 7.8%. Not all parts of the state are growing, however, as Otero County, the worst county to live in the state, reported a 2.5% population decline over the same period.
With a countywide poverty rate of 22.9% compared to a state poverty rate of 11.5%, residents of Otero County are about twice as likely to live in poverty than the typical Colorado resident. Lower-income Americans can afford fewer healthy options related to medical care, diet, and lifestyle, and health outcomes are lagging in Otero County. Life expectancy at birth in the county is 76 years, about four years shy of life expectancy statewide.
[in-text-ad]
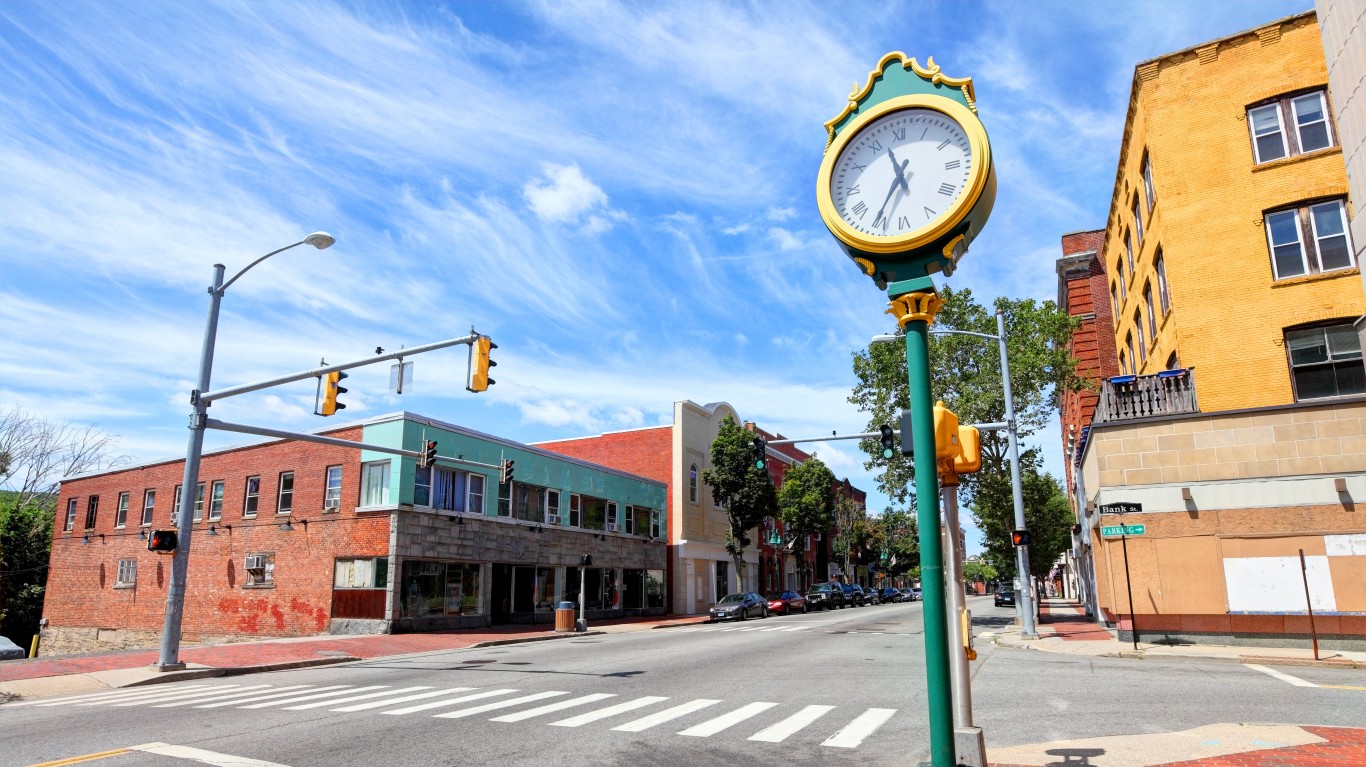
Connecticut: Windham County
> 5-yr. population change: -1.2% (state: +0.6%)
> Poverty rate: 11.1% (state: 10.1%)
> Adults with a bachelor’s degree: 24.4% (state: 38.4%)
> Life expectancy: 79.0 years (state: 80.6 years)
Windham, a county that makes up Connecticut’s northeastern corner, is the only county in the state where fewer than one in every four adults have a bachelor’s degree. Higher educational attainment typically corresponds with higher-paying employment opportunities, and Windham is also the poorest county in Connecticut. The typical county household annual income $62,553. While this is about $5,000 more than the national median, it is well below the statewide median annual household income of $73,781.
Like many counties on this list, Windham is losing residents. In the last five years, the number of people living in the county fell by 1.2%.
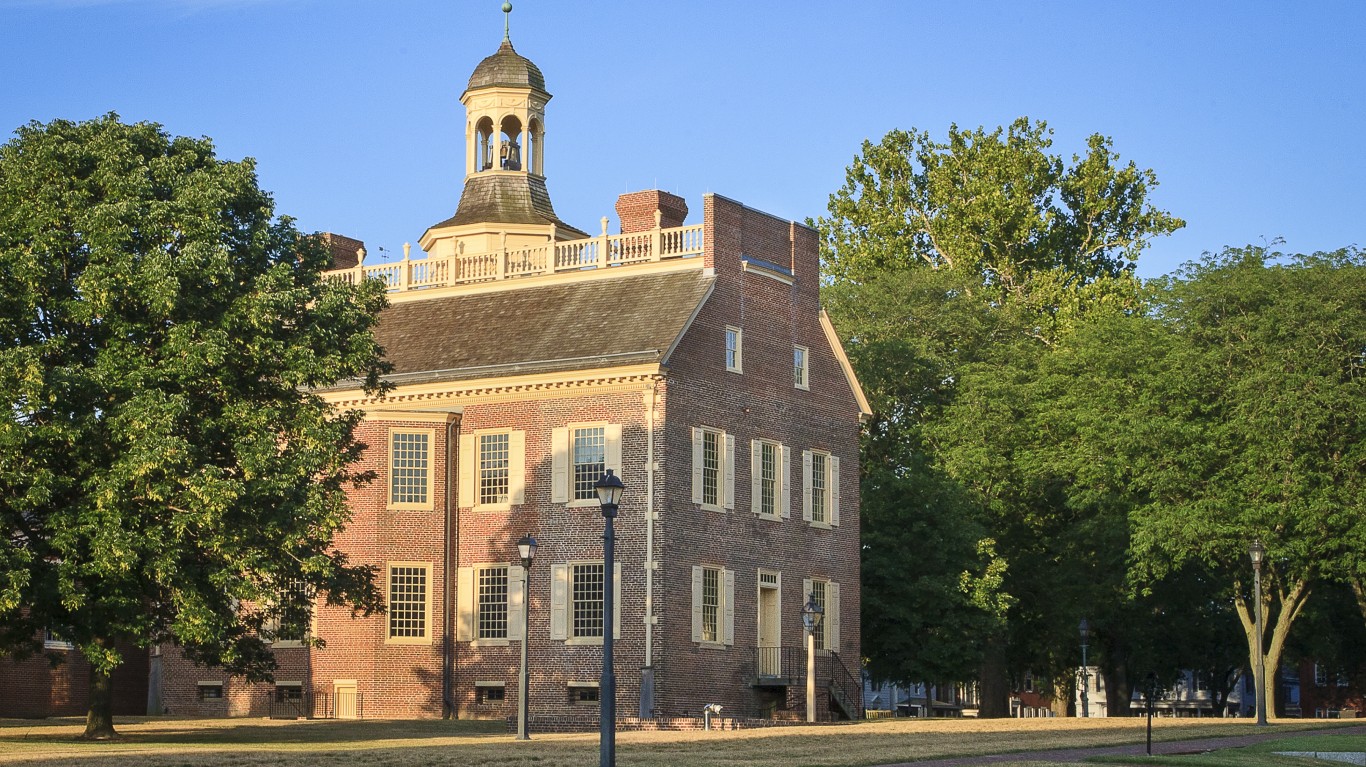
Delaware: Kent County
> 5-yr. population change: +6.4% (state: +4.8%)
> Poverty rate: 13.0% (state: 12.1%)
> Adults with a bachelor’s degree: 23.5% (state: 31.0%)
> Life expectancy: 77.5 years (state: 78.7 years)
Kent County is located in the middle of Delaware. The county’s seat is the state capital of Dover. The worst county to live in the state, Kent is the only Delaware county in which fewer than one in every four adults have a bachelor’s degree.
Health outcomes in the area are also trailing the state as a whole. Life expectancy in Kent County is 77.5 years, the lowest of any Delaware county and about a year less than the life expectancy statewide. Partially as a result, Kent also ranks as the least healthy county in the state.

Florida: Union County
> 5-yr. population change: -0.6% (state: +7.4%)
> Poverty rate: 21.4% (state: 15.5%)
> Adults with a bachelor’s degree: 8.3% (state: 28.5%)
> Life expectancy: 67.6 years (state: 79.5 years)
Union County is located in northern Florida, and is not only the worst county to live in Florida but one of the worst in the country. The average life expectancy in the county fell by over half a year between 2010 and 2014 and is now just 67.6 years, more than 11 years below the average life expectancy nationwide.
Unlike most counties on this list, Union County has a relatively low unemployment rate. Just 2.8% of the county’s labor force is unemployed, below the 3.6% national unemployment rate. Many of the jobs in the county, however, are stressful and dangerous. The local economy relies heavily on the Union Correctional Institution, a maximum security prison, and the profession of corrections officer ranks among the worst jobs in America.
[in-text-ad-2]

Georgia: Ben Hill County
> 5-yr. population change: -1.9% (state: +5.0%)
> Poverty rate: 30.4% (state: 16.9%)
> Adults with a bachelor’s degree: 10.2% (state: 29.9%)
> Life expectancy: 73.6 years (state: 77.4 years)
Ben Hill County is located in the southern central part of Georgia, far from Atlanta, Savannah, and the state’s other most populous cities. Only 10.2% of adults in the county have a bachelor’s degree, compared with 29.9% of adults in the state. Adults without a college education are more likely to struggle to make ends meet, and in Ben Hill County, over 30% of the population lives below the poverty line, nearly double the state’s 16.9% poverty rate.

Hawaii: Hawaii County
> 5-yr. population change: +5.9% (state: +4.3%)
> Poverty rate: 17.4% (state: 10.3%)
> Adults with a bachelor’s degree: 28.6% (state: 32.0%)
> Life expectancy: 80.2 years (state: 81.2 years)
Hawaii County is coterminous with the island of Hawaii. Joblessness is more common in Hawaii County than anywhere else in the state. Unemployment stands at 3.8% countywide, a full percentage-point higher than the state unemployment rate.
The poverty rate in Hawaii County of 17.4% is well above the 10.3% state poverty rate, and like many counties on this list, Hawaii County is also the poorest in the state. Partially as a result, more area residents depend on government assistance. About one in every five Hawaii County residents receive SNAP benefits, well above the recipiency rate in every other county in the state.
[in-text-ad]

Idaho: Owyhee County
> 5-yr. population change: -0.8% (state: +5.7%)
> Poverty rate: 23.3% (state: 14.5%)
> Adults with a bachelor’s degree: 9.7% (state: 26.8%)
> Life expectancy: 78.7 years (state: 79.5 years)
Owyhee County makes up the southwestern corner of Idaho. The county is one of only two in the state where fewer than one in every 10 adults have a bachelor’s degree. Across the state as a whole, more than one in every four adults have a bachelor’s degree. Incomes tend to climb with educational attainment, and in Owyhee County, most households earn about $36,000 or less a year compared to the state median annual household income of $50,985.
Like many counties on this list, Owyhee is losing residents. In the last five years, the number of people living in Owyhee fell by 0.8% even as Idaho’s population as a whole grew by 5.7%.
Illinois: Saline County
> 5-yr. population change: -2.2% (state: +0.2%)
> Poverty rate: 20.6% (state: 13.5%)
> Adults with a bachelor’s degree: 16.4% (state: 33.4%)
> Life expectancy: 74.9 years (state: 79.0 years)
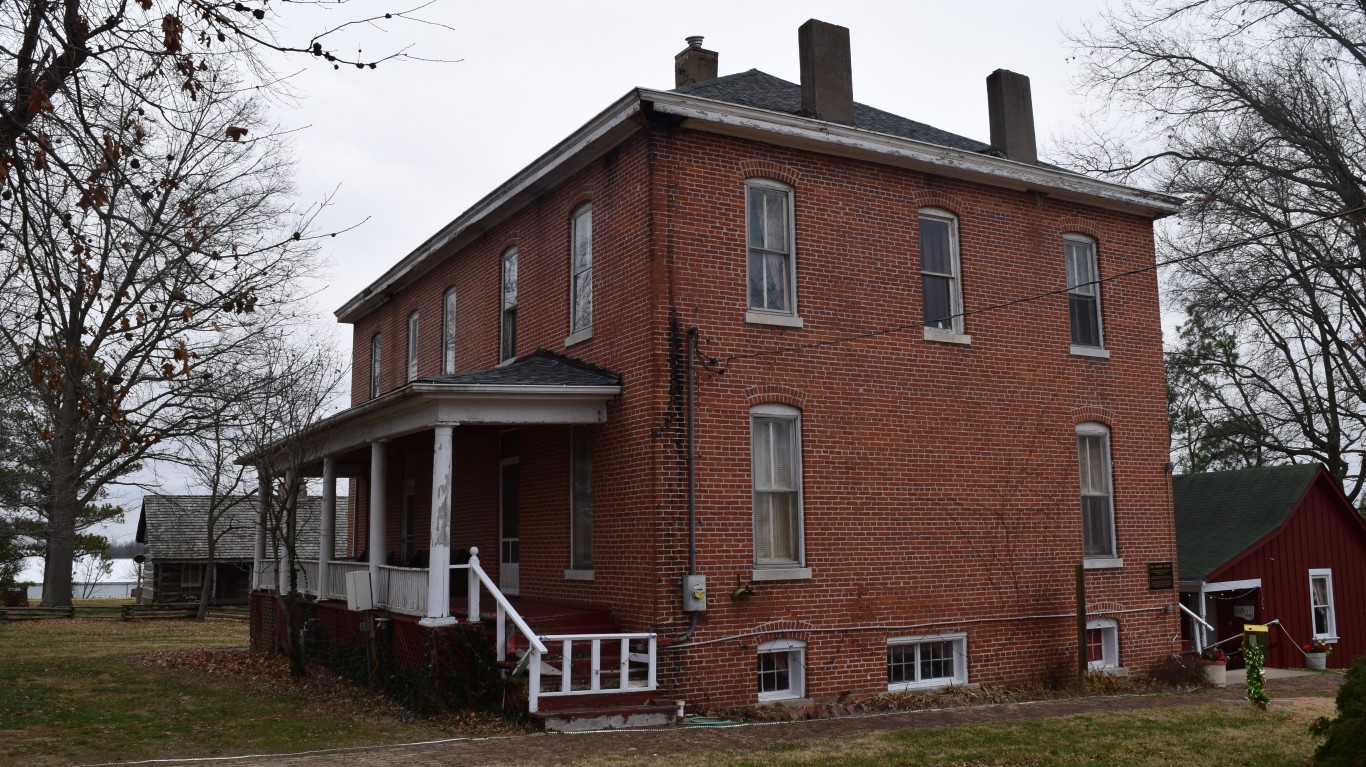
Saline County, located in southern Illinois, is one of the poorest counties in the state. One in every four residents rely on SNAP benefits, and one in every five live below the poverty line. The financial hardship is partially attributable to the high jobless rate in the county. Unemployment in the county stands at 5.5%, well above the 4.4% state and 3.6% national unemployment rates.
The lack of economic opportunities may also be pushing people out of the county. In the last five years, the number of people living in Saline County fell by 2.2%.

Indiana: Switzerland County
> 5-yr. population change: +1.0% (state: +2.0%)
> Poverty rate: 19.7% (state: 14.6%)
> Adults with a bachelor’s degree: 8.7% (state: 25.3%)
> Life expectancy: 76.5 years (state: 77.7 years)
Switzerland County is located in eastern Indiana along the Ohio River, which forms the state’s border with Kentucky. Switzerland is one of only two counties in Indiana where fewer than one in every 10 adults have a four-year college education. Incomes tend to rise with higher educational attainment, and Switzerland County’s 19.7% poverty rate is well above the statewide 14.6% poverty rate.
Higher-income, better-educated Americans tend to have longer life expectancies. In Switzerland County, the average life expectancy is 76.5 years, about a year below life expectancy across the state as a whole.
[in-text-ad-2]
Iowa: Lee County
> 5-yr. population change: -2.7% (state: +2.3%)
> Poverty rate: 16.3% (state: 12.0%)
> Adults with a bachelor’s degree: 15.7% (state: 27.7%)
> Life expectancy: 77.5 years (state: 79.7 years)
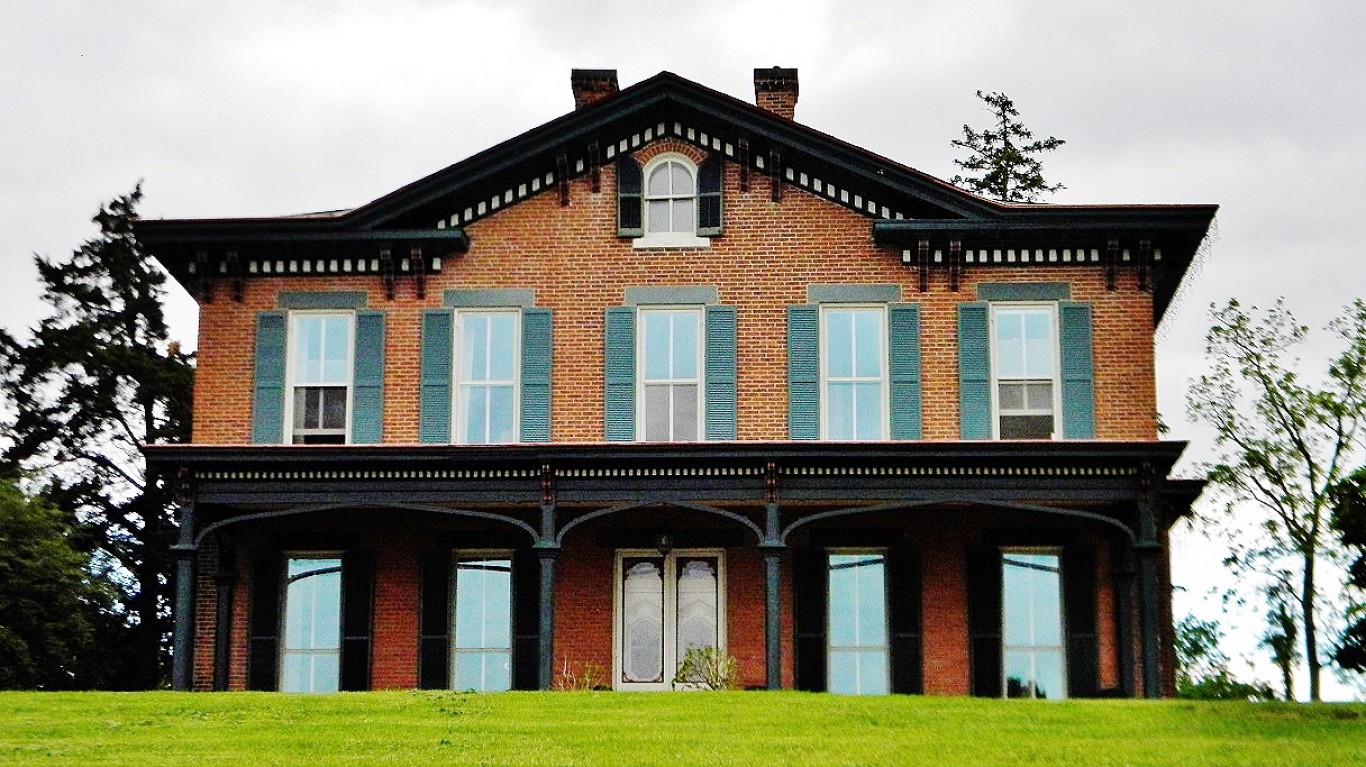
Lee County is located in southeastern Iowa along the Mississippi River. Though joblessness is less of a problem in Lee County than it is nationwide, workers in Lee County are more likely to be out of a job than they are across the state. Lee County’s 3.1% unemployment rate is well above 2.4% statewide rate. Incomes are also lower in Lee County than they are statewide. The typical area household earns $48,266 a year, compared to the statewide median annual household income of $56,570.
College-educated Americans are less likely to be unemployed and more likely to earn higher salaries than those without a bachelor’s degree. In Lee County, 15.7% of adults have a four-year college degree, compared to 27.7% of adults across Iowa as a whole.
Kansas: Wyandotte County
> 5-yr. population change: +3.8% (state: +1.8%)
> Poverty rate: 21.4% (state: 12.8%)
> Adults with a bachelor’s degree: 16.7% (state: 32.3%)
> Life expectancy: 75.4 years (state: 78.7 years)
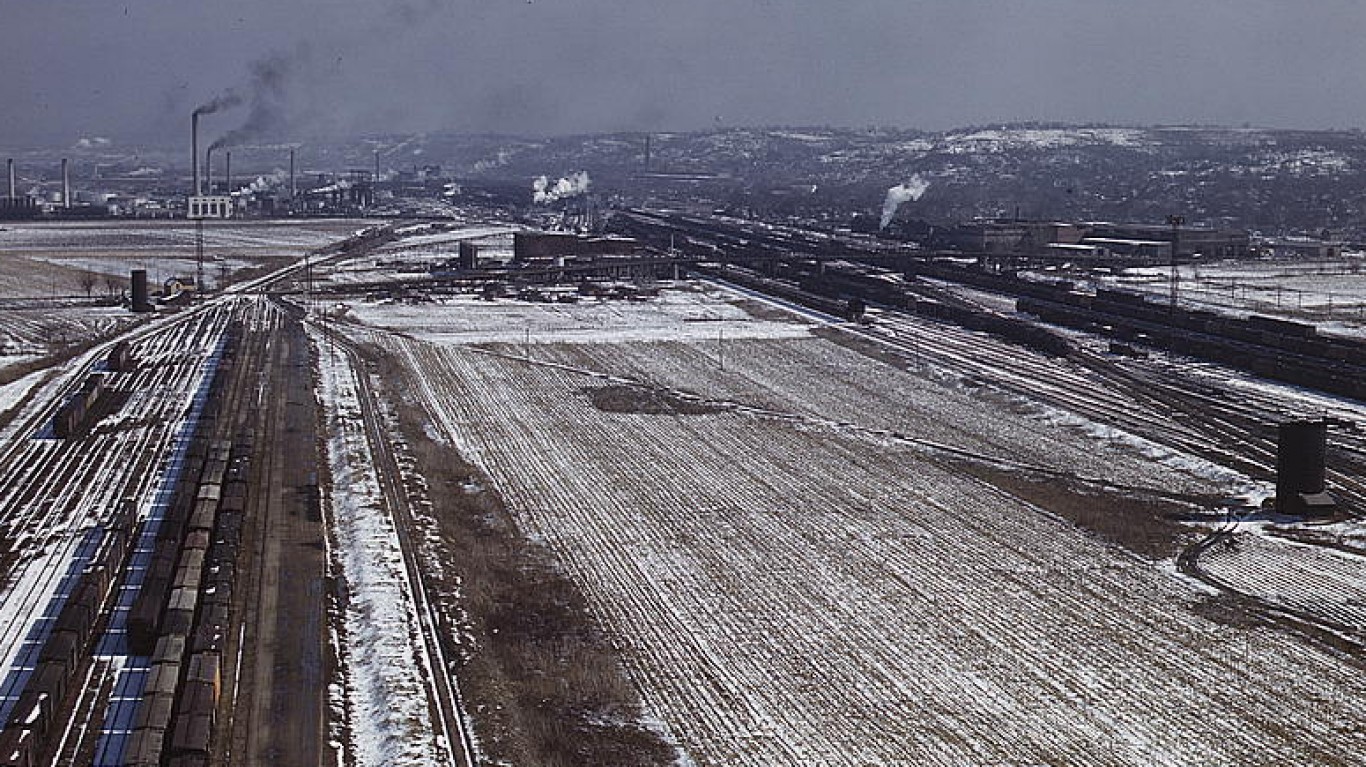
Many of the counties on this list are relatively rural and isolated. This is not the case with Wyandotte County in Kansas, located just across the state line from Kansas City, Missouri, one of the Midwest’s largest cities.
Kansas is one of the states with the most educated adults: 90.5% of Kansans 25 and older have a high school diploma, and 32.3% have a bachelor’s degree — both figures higher than the comparable national shares. Adults in Wyandotte county, however, are far less likely than those in their state to enjoy the benefits of a secondary or postsecondary education. Just 78.8% of adults have a high school diploma, and 16.7% have a college education.
[in-text-ad]

Kentucky: McCreary County
> 5-yr. population change: -2.5% (state: +1.9%)
> Poverty rate: 41.0% (state: 18.3%)
> Adults with a bachelor’s degree: 7.6% (state: 23.2%)
> Life expectancy: 72.9 years (state: 76.3 years)
Like other nearby counties in southeastern Kentucky, McCreary County has been decimated by the decline of the coal industry. Throughout the 20th century, over two-dozen coal mines that once employed thousands of local workers shut down. While mining operations have begun to sprout up again in recent years, McCreary is still struggling economically. The county has a higher than average unemployment rate, and 45% of area residents with jobs commute to work outside the county limits. One of the poorest counties in the United States, McCreary has a 41% poverty rate, and half of all area households earn less than $20,000 a year.
Louisiana: Madison Parish
> 5-yr. population change: -4.1% (state: +3.0%)
> Poverty rate: 36.4% (state: 19.6%)
> Adults with a bachelor’s degree: 13.4% (state: 23.4%)
> Life expectancy: 71.6 years (state: 75.8 years)
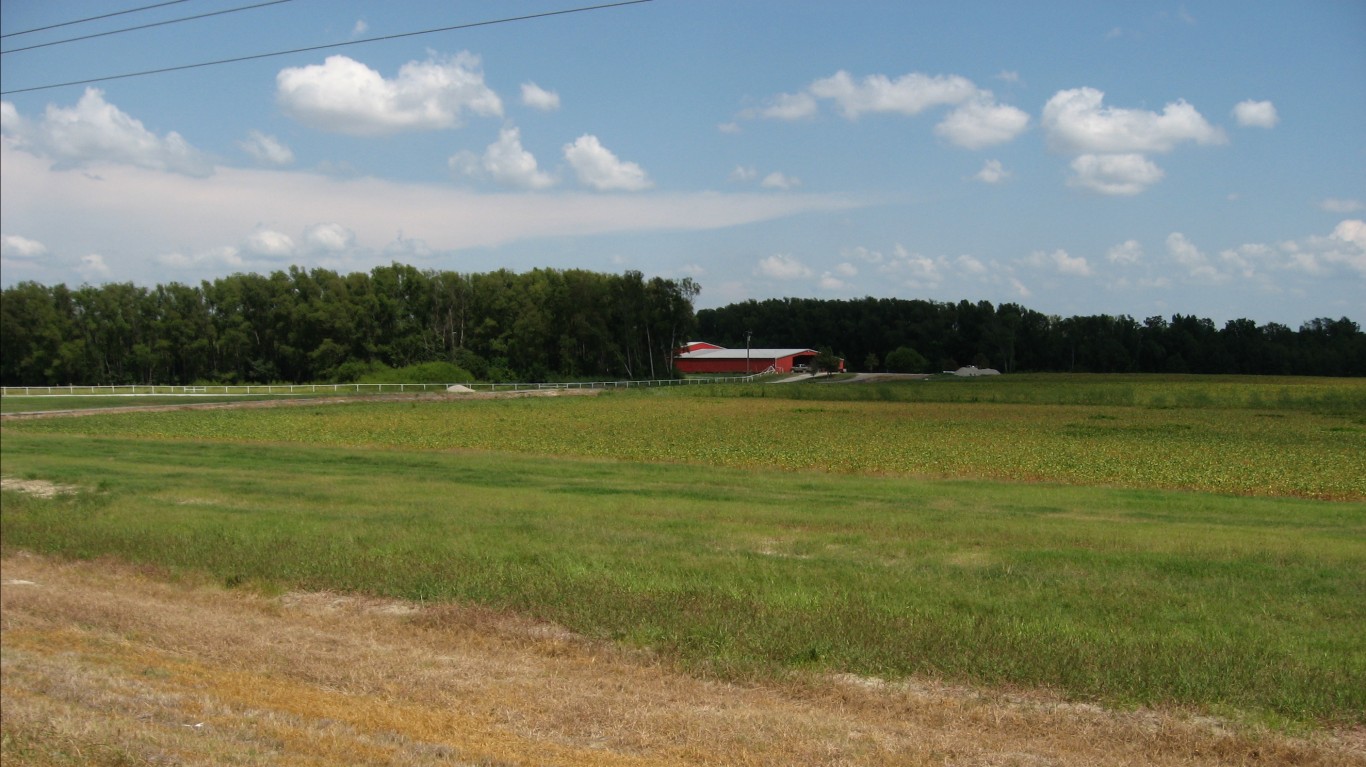
Madison Parish is located in the eastern part of the state along the Mississippi River. Like many of the counties and parishes along the Mississippi River, Madison Parish is poor, and people are leaving. Over the last five years, the number of people living in Madison fell by 4.1%. More than one in every three parish residents live in poverty, and Madison ranks as the poorest parish in the state.
A stronger job market in Madison Parish would likely go a long way in alleviating economic conditions and slow population decline. The county’s unemployment rate of 5.9% is much higher than the 3.6% national unemployment rate.

Maine: Piscataquis County
> 5-yr. population change: -2.7% (state: +0.1%)
> Poverty rate: 18.7% (state: 12.9%)
> Adults with a bachelor’s degree: 17.8% (state: 30.3%)
> Life expectancy: 78.0 years (state: 79.3 years)
Generally, Maine ranks as a good place to live, based on key social and demographic data. Piscataquis County, the massive 4,400 square mile county making up part of the state’s rural interior, is one exception. The county has an above average poverty rate and a low bachelor’s degree attainment rate. A number of counties in Maine are losing population, but few are declining at a faster rate than Piscataquis, which recorded a 2.7% population decline over the past five years.
[in-text-ad-2]

Maryland: Baltimore
> 5-yr. population change: -0.1% (state: +3.6%)
> Poverty rate: 22.4% (state: 9.7%)
> Adults with a bachelor’s degree: 30.4% (state: 39.0%)
> Life expectancy: 72.1 years (state: 79.2 years)
Baltimore is an independent city that does not lie within the jurisdiction of a county. With nearly the state’s highest poverty rate and by far the lowest life expectancy, Baltimore ranks as the worst county or county equivalent to live in Maryland. Life expectancy at birth in the city is just 72 years, seven year below life expectancy across the state as a whole. Additionally, 22.4% of Baltimore residents live below the poverty line, more than double the 9.7% state poverty rate.
While crime rates have improved in major cities nationwide, Baltimore, along with other cities like Chicago and St. Louis, still report staggering levels of violence. Unsafe streets and poor economic conditions may be driving people away. In the last five years, Baltimore reported a 0.1% population decline, even as Maryland’s population grew by 3.6%.
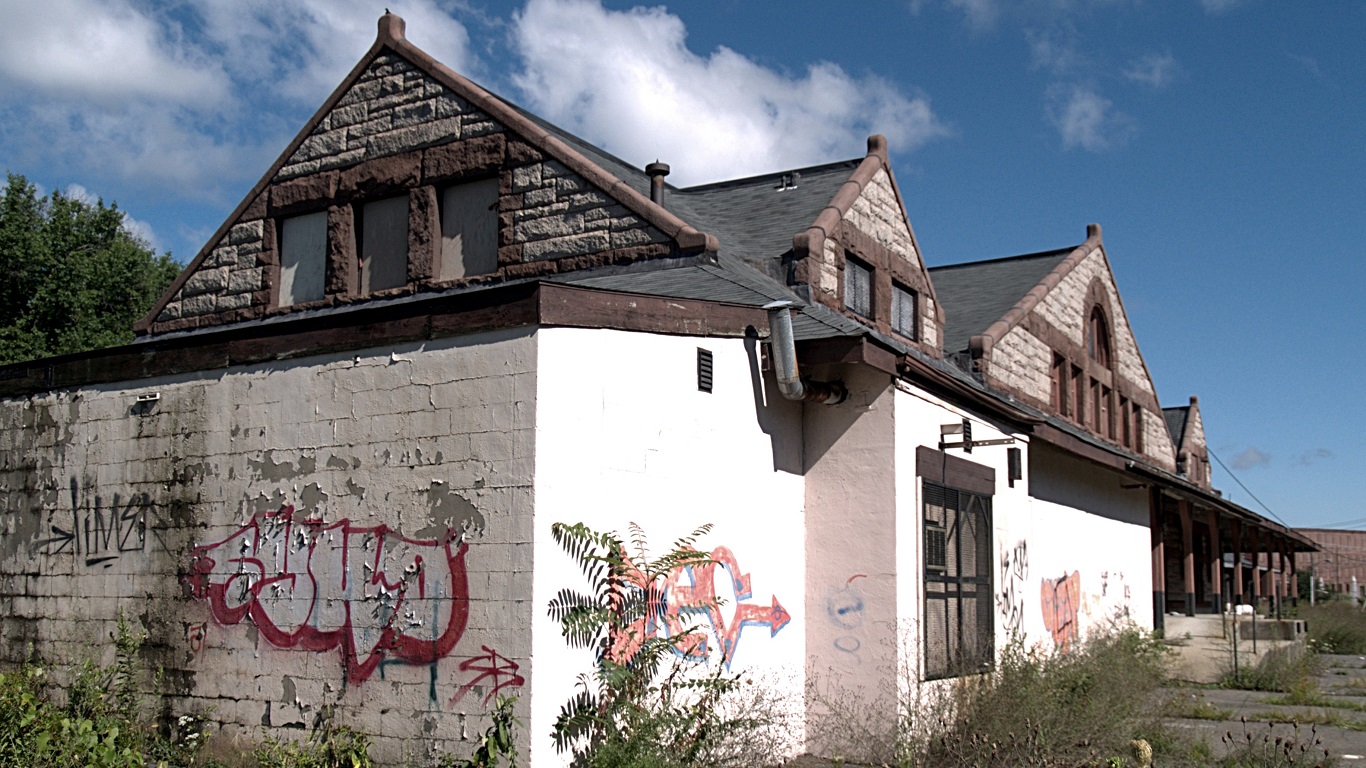
Massachusetts: Hampden County
> 5-yr. population change: +1.1% (state: +3.5%)
> Poverty rate: 17.2% (state: 11.1%)
> Adults with a bachelor’s degree: 26.5% (state: 42.1%)
> Life expectancy: 78.9 years (state: 80.4 years)
Massachusetts is one of the wealthiest states in the country, and nearly every major county in the state has a median annual household income above the national median of $57,652. The county with the lowest median income is Hampden, which forms a large part of the state’s border with Connecticut and contains the city of Springfield. In Hampden, the typical household has an annual income of $52,205, which is not too much lower than the national figure but well below the state median of $74,167.
Poverty is a major indicator for the likelihood residents having poor diets and lacking access to quality medical care. This likely helps explain Hampden County’s rank as the least healthy county in the state.
[in-text-ad]
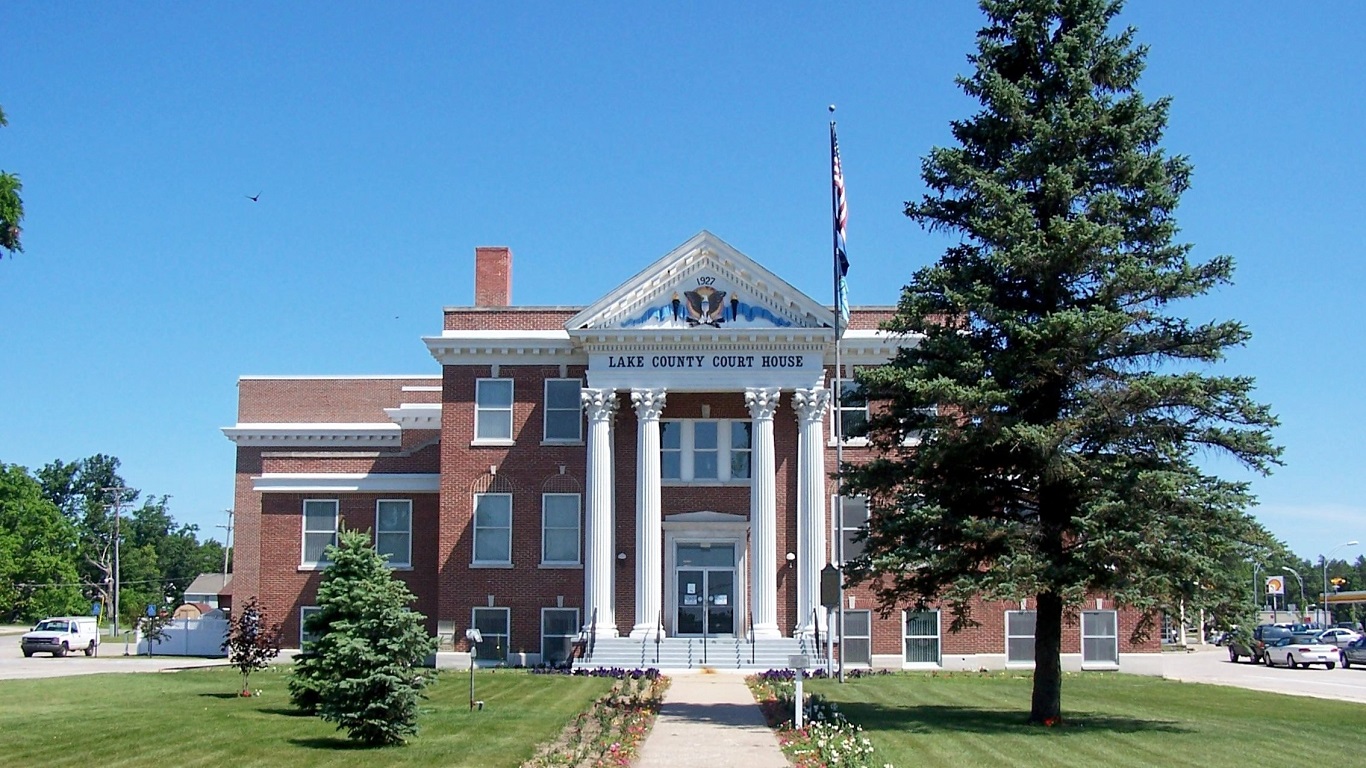
Michigan: Lake County
> 5-yr. population change: +1.1% (state: +0.3%)
> Poverty rate: 25.0% (state: 15.6%)
> Adults with a bachelor’s degree: 11.4% (state: 28.1%)
> Life expectancy: 76.8 years (state: 78.3 years)
Lake County, located in western Michigan about 80 miles north of Grand Rapids, is the poorest county in the state. The typical income of a household in the county is just $32,309 a year, about $20,000 less than that of the typical Michigan household. The low incomes likely contribute to the prevalence of serious financial hardship in the county — one in every four residents live below the poverty line.
Incomes in the county would likely rise with an improved job market. Currently, 6.3% of workers in the county are unemployed, well above the 4.1% state and 3.6% national unemployment rates.
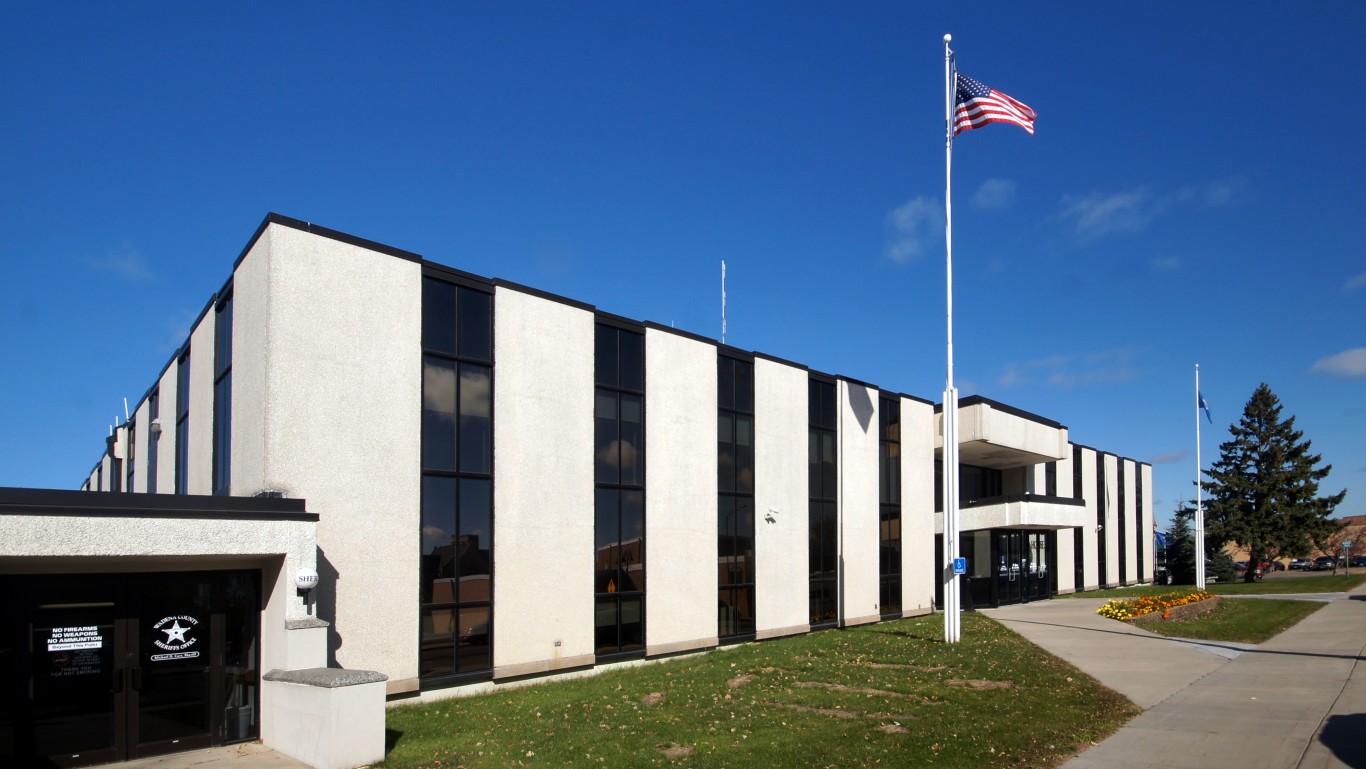
Minnesota: Wadena County
> 5-yr. population change: -1.3% (state: +3.3%)
> Poverty rate: 15.0% (state: 10.5%)
> Adults with a bachelor’s degree: 12.9% (state: 34.8%)
> Life expectancy: 78.8 years (state: 80.9 years)
Nearly every large county in Minnesota compares favorably to the majority of counties on this list. One exception is Wadena County, which is in the central part of the state. In the county, just 12.9% of adults have a bachelor’s degree, barely one-third of the state’s equivalent share of 34.8% of adults.
Low educational attainment tends to coincide with low incomes, and Wadena’s median annual household income of $45,018 is the lowest of any county in the state with a population of at least 10,000.
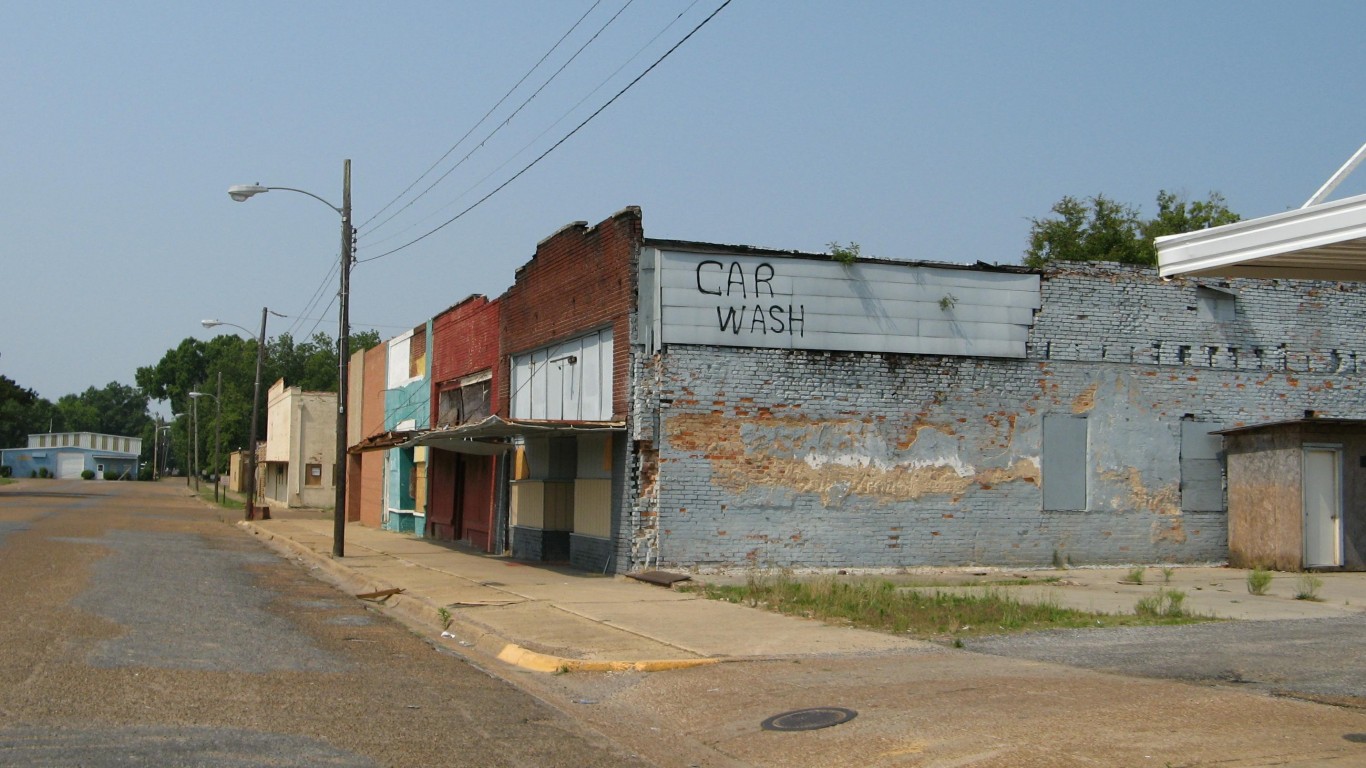
Mississippi: Holmes County
> 5-yr. population change: -4.9% (state: +0.6%)
> Poverty rate: 46.5% (state: 21.5%)
> Adults with a bachelor’s degree: 10.7% (state: 21.3%)
> Life expectancy: 71.0 years (state: 74.9 years)
Holmes County is located in the Mississippi Delta region. The county’s 46.5% poverty rate is nearly the highest of any U.S. county and more than triple the national poverty rate of 14.6%. Additionally, 29.2% of households in the country earn less than $10,000 a year, the largest share of any U.S. county.
The widespread financial hardship is partially attributable to a weak job market. As of the end of last year, 8.7% of county workers were unemployed, and among those who had a job, 44% commuted to work outside the county limits.
[in-text-ad-2]

Missouri: Pemiscot County
> 5-yr. population change: -5.2% (state: +1.6%)
> Poverty rate: 28.5% (state: 14.6%)
> Adults with a bachelor’s degree: 12.0% (state: 28.2%)
> Life expectancy: 72.0 years (state: 77.7 years)
Pemiscot County, situated in the southeast corner of Missouri along the Mississippi River, ranks as the worst county to live in the state. The county’s poverty rate of 28.5% is nearly double the statewide poverty rate of 14.6%. Americans living below the poverty line are far more likely to be unhealthy than wealthier Americans, and in Pemiscot County, the life expectancy at birth is just 72 years, nearly six years less than the life expectancy statewide.
As is the case in many counties on this list, Pemiscot County is losing resident rapidly. In the last five years, the number of people living in the county fell by 5.2%, even as the state population as a whole grew by 1.6%.

Montana: Roosevelt County
> 5-yr. population change: +7.1% (state: +3.9%)
> Poverty rate: 29.1% (state: 14.4%)
> Adults with a bachelor’s degree: 15.5% (state: 30.7%)
> Life expectancy: 71.2 years (state: 78.9 years)
Native American reservations often struggle with social and economic challenges, and much of Roosevelt County, Montana, lies within the Fort Peck Indian Reservation. The county’s poverty rate of 29.1% is more than double the state poverty rate of 14.4%, and life expectancy in the county is just 71 years — about eight years less than the life expectancy statewide. Joblessness is also more common in Roosevelt County than it is across the state as a whole. The county’s unemployment rate of 4.6% is a full percentage point higher than Montana’s unemployment rate.
[in-text-ad]

Nebraska: Dakota County
> 5-yr. population change: -1.6% (state: +3.6%)
> Poverty rate: 16.8% (state: 12.0%)
> Adults with a bachelor’s degree: 12.6% (state: 30.6%)
> Life expectancy: 78.4 years (state: 79.6 years)
Dakota County is located in eastern Nebraska, directly across the Missouri River from Sioux City, Iowa. An estimated 16.8% of people in Dakota County live below the poverty line, a higher poverty rate than the state rate of 12.0%. Incomes tend to rise with educational attainment, and only 12.6% of adults in Dakota County have a bachelor’s degree or higher, the smallest share of any county in the state. As is the case with many counties on this list, Dakota County is shrinking. As of 2017, about 20,500 people lived in the county, 1.6% fewer than five years prior.

Nevada: Nye County
> 5-yr. population change: -1.2% (state: +6.8%)
> Poverty rate: 17.3% (state: 14.2%)
> Adults with a bachelor’s degree: 11.5% (state: 23.7%)
> Life expectancy: 74.1 years (state: 78.1 years)
Nye County, Nevada, is located in the southern part of the state, west of Las Vegas. The county is easily the worst to live in the state, based on 24/7 Wall St.’s index. Just 11.5% of county adults have a bachelor’s degree, less than half the state’s relatively low 23.7% share, and the county’s 4.8% April unemployment rate is one of the higher rates in the country. People born today in Nye County have a life expectancy of 74.1 years, which is about five years below the national average life expectancy.

New Hampshire: Coos County
> 5-yr. population change: -2.3% (state: +1.1%)
> Poverty rate: 13.3% (state: 8.1%)
> Adults with a bachelor’s degree: 18.3% (state: 36.0%)
> Life expectancy: 78.2 years (state: 80.2 years)
Residents of Coos County, the northernmost county in New Hampshire, are more likely to be unemployed and live below the poverty line than those living in any other county in the state. As of April 2019, 3.7% of the county’s labor force was unemployed, well above the 2.4% state unemployment rate. The relative lack of jobs in the county likely contributes to the highest-in-the-state poverty rate of 13.3%. New Hampshire’s poverty rate of 8.1% is the lowest of any U.S. state.
[in-text-ad-2]
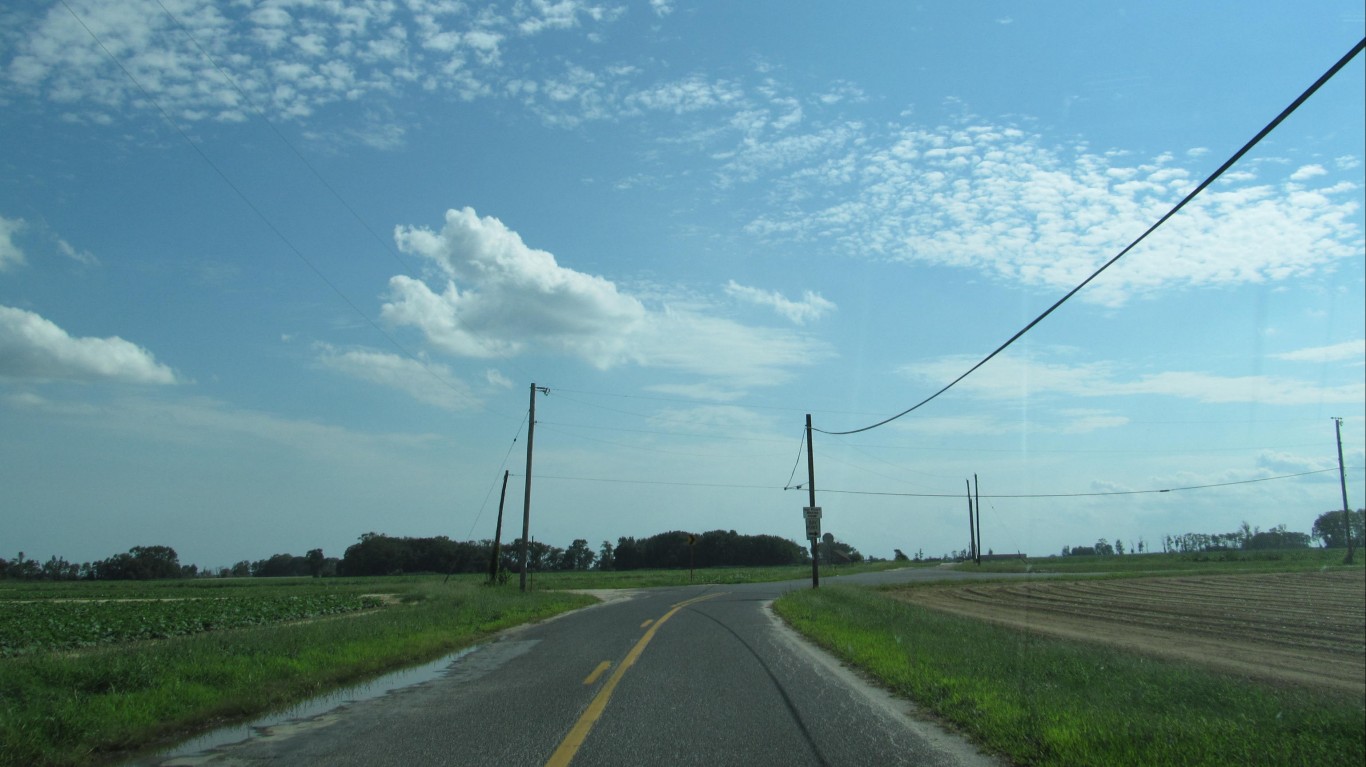
New Jersey: Cumberland County
> 5-yr. population change: -1.2% (state: +1.9%)
> Poverty rate: 18.8% (state: 10.7%)
> Adults with a bachelor’s degree: 14.4% (state: 38.1%)
> Life expectancy: 76.6 years (state: 80.0 years)
New Jersey’s Cumberland County is located in the southern part of the state, making up much of the state’s coastline adjacent to the Delaware Bay. Cumberland has an adult bachelor’s degree attainment rate of just 14.4%, compared to a state share of 38.1%. The county also has the highest poverty rate in the state among counties with at least 10,000 people, at 18.8% of residents, compared to a state poverty rate of 10.7%.
People living in poverty are much more likely to face issues leading to health problems and poorer populations tend to have shorter life expectancy. Like many of the places on this list, Cumberland ranks as the least healthy county in the state.
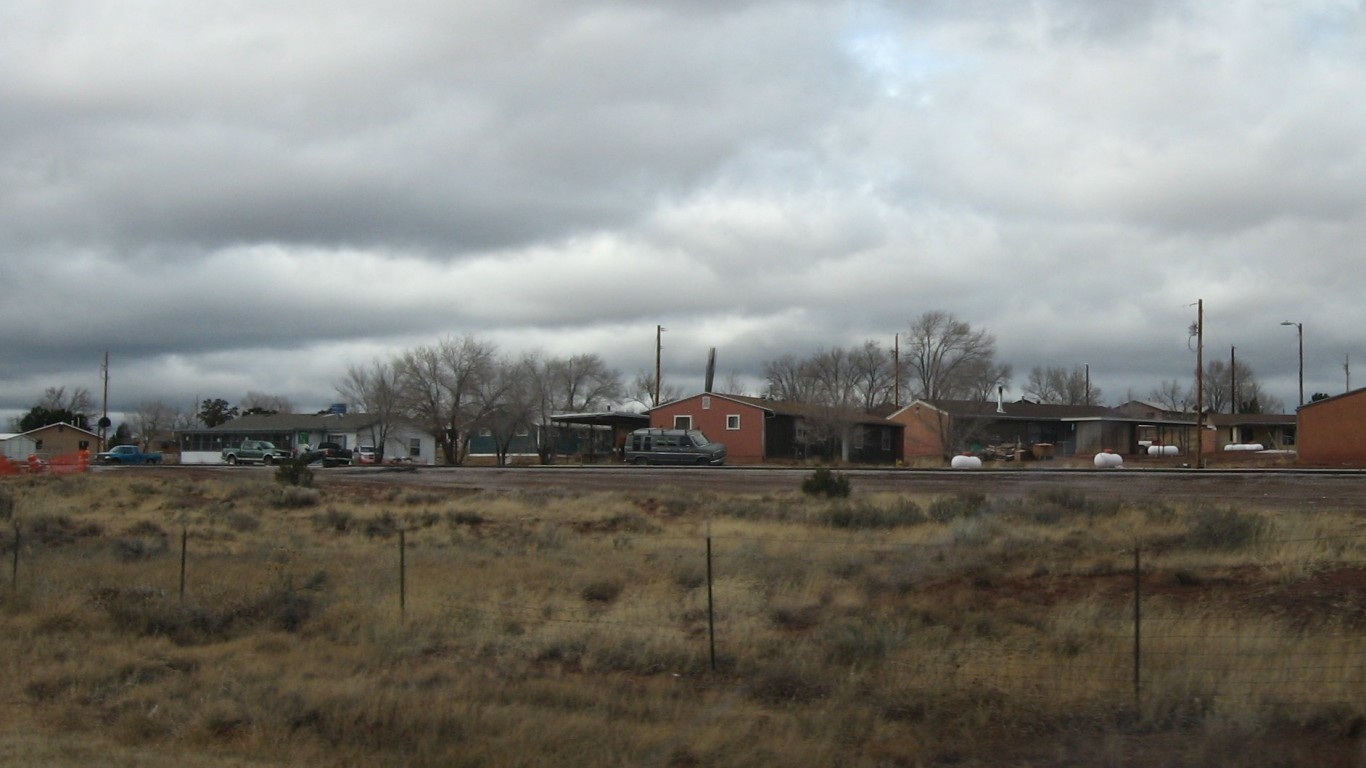
New Mexico: McKinley County
> 5-yr. population change: +1.3% (state: +1.4%)
> Poverty rate: 37.5% (state: 20.6%)
> Adults with a bachelor’s degree: 10.8% (state: 26.9%)
> Life expectancy: 74.9 years (state: 78.4 years)
McKinley County is located in western New Mexico along the Arizona border, adjacent to Apache County â another county on this list. Like Apache County, McKinley County spans over a large Native American Reservation. Due to a number of historical and political factors, populations living on reservations are more likely to perform relatively poorly in measures of social and economic well-being. In McKinley County, 37.5% of the population lives in poverty, one of the highest poverty rates of any U.S. county. Additionally, at 74.9 years, life expectancy in McKinley County is about four years below U.S. life expectancy.
Unemployment in McKinley County stands at 6.0%, well above the 3.6% national unemployment rate. Economic growth in the county is likely hindered, as due to several social and regulatory factors, New Mexico ranks as one of the worst states for business.
[in-text-ad]

New York: Bronx County
> 5-yr. population change: +5.0% (state: +2.1%)
> Poverty rate: 29.7% (state: 15.1%)
> Adults with a bachelor’s degree: 19.4% (state: 35.3%)
> Life expectancy: 78.7 years (state: 80.4 years)
Bronx County is coterminous with the New York City borough of the same name. Nearly 30% of Bronx County residents live below the poverty line, roughly double the 15.1% poverty rate across New York state. Incomes tend to rise with higher educational attainment, and Bronx County is the least educated county in the state. Just 71.5% of adults in the Bronx have completed high school, compared to 86.1% of adults across the state as a whole.
Due to widespread financial hardship, a larger than typical share of Bronx residents depend on government assistance to afford basic necessities. Some 36.5% of county residents receive SNAP benefits, the largest share of any county in the state and nearly triple the 12.6% national recipiency rate.
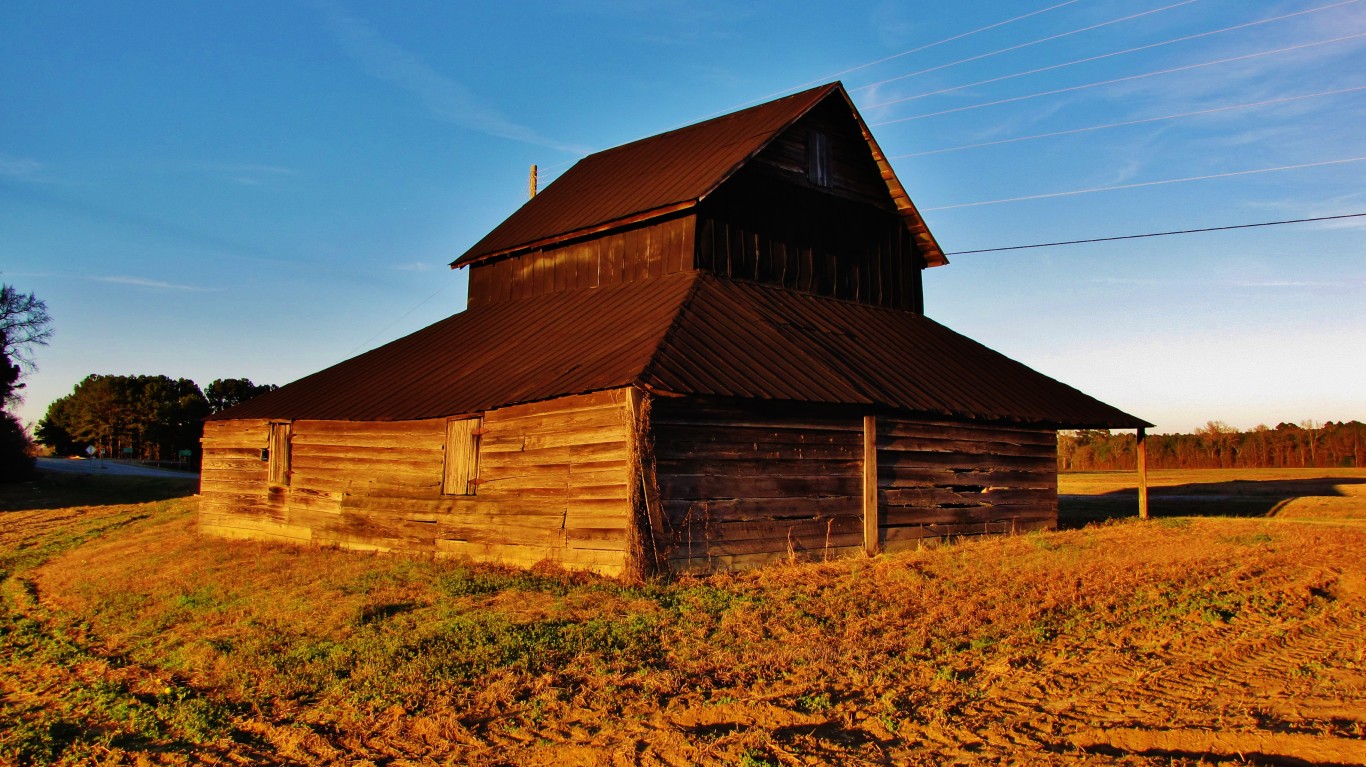
North Carolina: Robeson County
> 5-yr. population change: +0.2% (state: +5.3%)
> Poverty rate: 29.2% (state: 16.1%)
> Adults with a bachelor’s degree: 12.8% (state: 29.9%)
> Life expectancy: 73.7 years (state: 77.9 years)
Robeson County is located in southern North Carolina along the South Carolina state border. Life expectancy in the county is just shy of 74 years, about four years less than the average life expectancy at birth across the state as a whole. Health outcomes like life expectancy tend to be worse in poorer areas, and Robeson is the only county in the state where nearly 30% of residents live below the poverty line. The widespread financial hardship is partially attributable to the weak job market in the county. Unemployment in Robeson County stands at 5.0%, well above the 4.0% state unemployment rate.

North Dakota: Rolette County
> 5-yr. population change: +4.6% (state: +10.2%)
> Poverty rate: 32.4% (state: 11.0%)
> Adults with a bachelor’s degree: 20.7% (state: 28.9%)
> Life expectancy: 73.0 years (state: 80.0 years)
Rolette County is located north central North Dakota along the Canadian border. The county’s poverty rate of 32.4% is nearly triple the 11.0% poverty rate across the state as a whole. Health outcomes tend to be worse in poorer populations, and life expectancy at birth in Rolette County is just 73 years, seven years below life expectancy statewide.
The county’s median household income of $36,170 is the lowest in the state. Low incomes are partially attributable to a weak job market. The county’s unemployment rate of 7.7% is the highest of any county in the state and more than triple the 2.3% state unemployment rate.
[in-text-ad-2]

Ohio: Adams County
> 5-yr. population change: -2.1% (state: +0.7%)
> Poverty rate: 23.8% (state: 14.9%)
> Adults with a bachelor’s degree: 12.1% (state: 27.2%)
> Life expectancy: 75.2 years (state: 77.9 years)
Adams County is the poorest county in the state, with a median annual household income of just $36,320, roughly $16,000 less than the state median of $52,407. The county’s poverty rate of 23.8% is well above the state and national figures of 14.9% and 14.6%, respectively, and more than one in four residents receive SNAP benefit assistance. The county, which is on the state’s border with Kentucky, had an unemployment rate of 5.3% as of April, one of the highest rates among large U.S. counties.
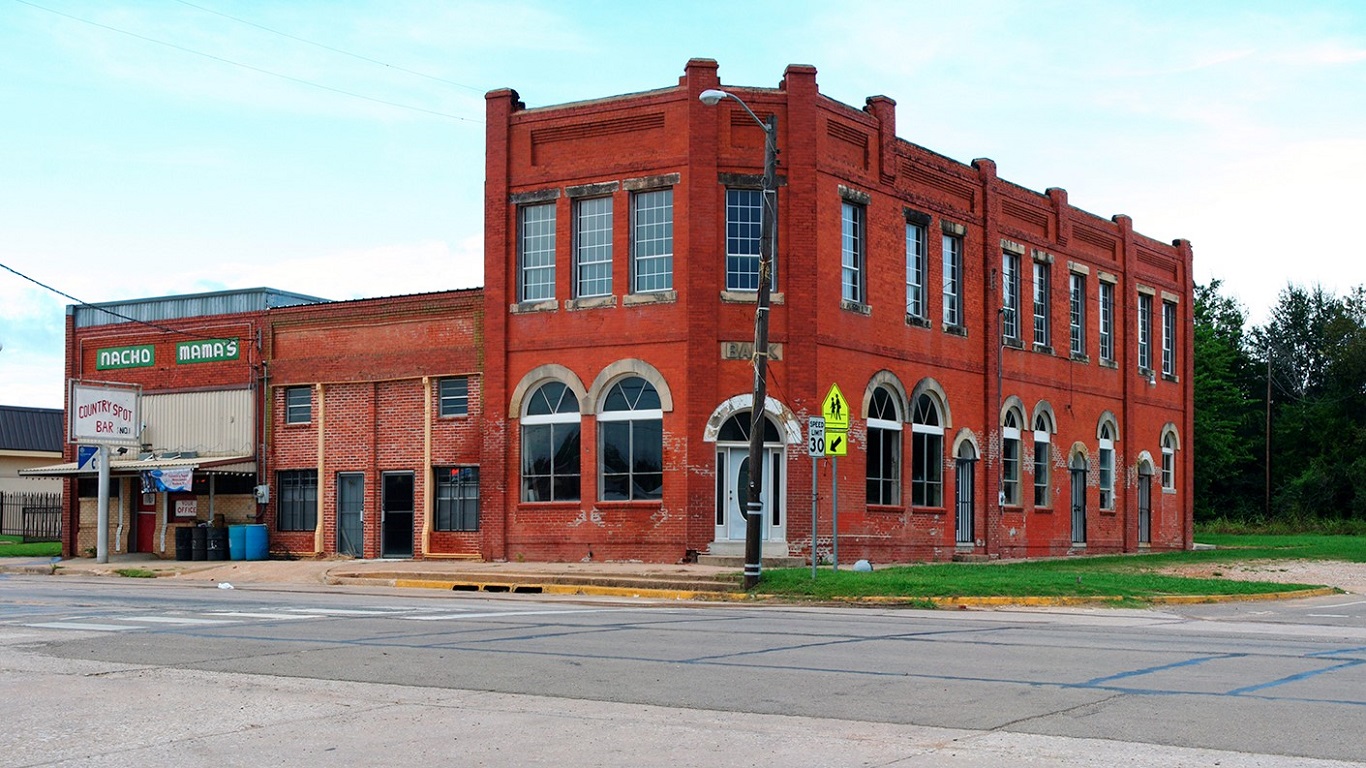
Oklahoma: Choctaw County
> 5-yr. population change: -1.3% (state: +3.9%)
> Poverty rate: 31.0% (state: 16.2%)
> Adults with a bachelor’s degree: 12.5% (state: 24.8%)
> Life expectancy: 73.3 years (state: 76.1 years)
Choctaw County is located in southern Oklahoma along the Texas state border. By several measures, Choctaw is the poorest county in the state. The county’s 31.0% poverty rate is the highest of any county in the state and is nearly double Oklahoma’s 16.2% poverty rate. Additionally, Choctaw is the only county in the state where more than 15% of households earn less than $10,000 a year. Low-paying jobs and widespread financial hardship may be pushing people out. In the last five years, Choctaw’s population declined by 1.3%, even as Oklahoma’s population grew by 3.9%.
[in-text-ad]

Oregon: Malheur County
> 5-yr. population change: -2.0% (state: +4.9%)
> Poverty rate: 25.2% (state: 14.9%)
> Adults with a bachelor’s degree: 13.2% (state: 32.3%)
> Life expectancy: 78.4 years (state: 79.4 years)
A declining population is often a sign of poor conditions and a generally unfavorable place to live, and Malheur County is one of only a few counties in Oregon where the population has declined in the past five years. Incomes in the county, which forms the southeasternmost part of the state, are easily the lowest in among Oregon’s counties with at least 10,000 people. The typical household income of $37,112 is about $19,000 less than the state median annual household income. Likely due to its relatively rural nature and widespread poverty, Malheur has the lowest concentration of doctors among state counties.
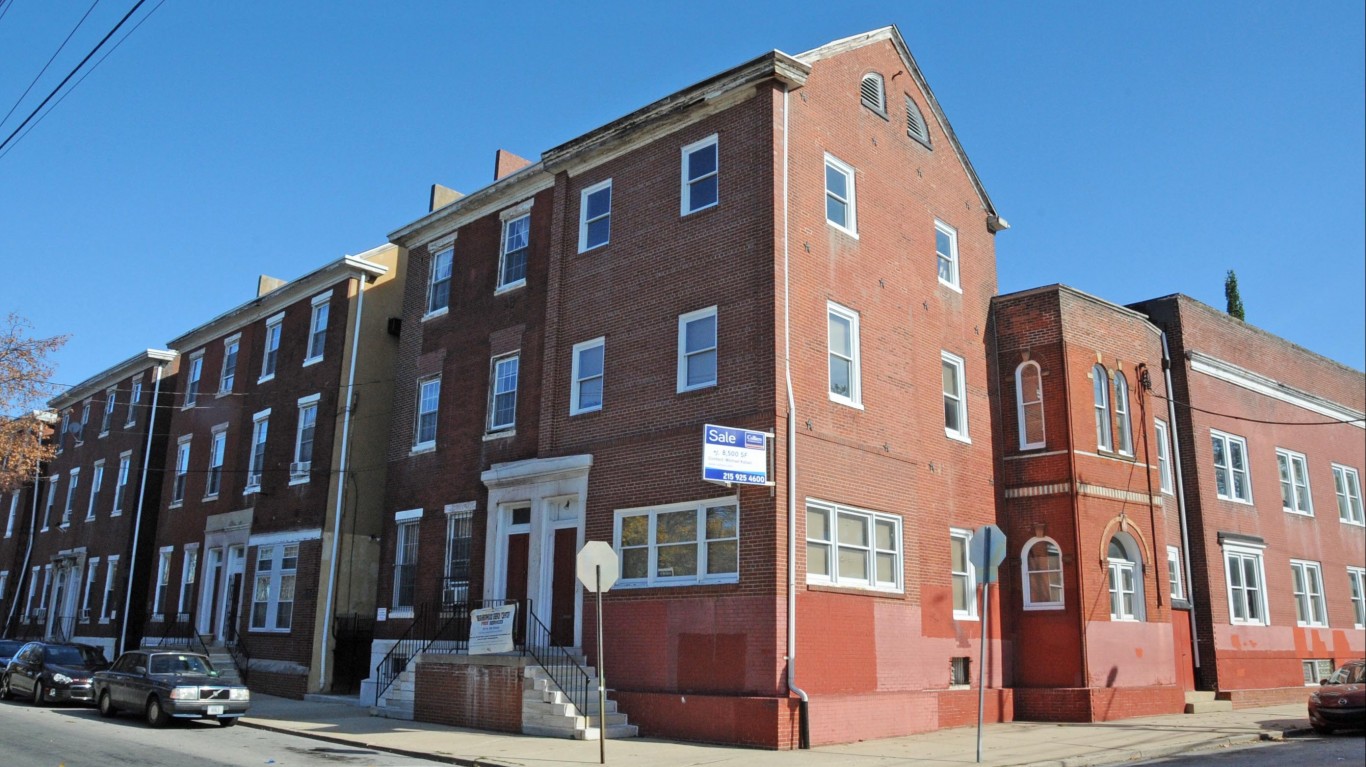
Pennsylvania: Philadelphia County
> 5-yr. population change: +2.9% (state: +0.7%)
> Poverty rate: 25.8% (state: 13.1%)
> Adults with a bachelor’s degree: 27.1% (state: 30.1%)
> Life expectancy: 75.5 years (state: 78.8 years)
Philadelphia County is coterminous with the city of the same name. It is the only county in Pennsylvania where more than one in every four residents live below the poverty line. Additionally, nearly 15% of households in the county earn less than $10,000 a year, a larger share than in every other Pennsylvania county. Due to widespread financial hardship, 24.5% of Philadelphia residents receive food stamps, the highest recipiency rate in the state.
Unlike most counties on this list, Philadelphia is growing faster than the state as a whole. In the last five years, the county population grew by 2.9%, more than four times faster than the state as a whole.

Rhode Island: Providence County
> 5-yr. population change: +1.0% (state: +0.3%)
> Poverty rate: 16.7% (state: 13.4%)
> Adults with a bachelor’s degree: 27.8% (state: 33.0%)
> Life expectancy: 79.3 years (state: 79.8 years)
Rhode Island, the nation’s smallest state by land area, only has five counties, and even the worst county to live in the state, Providence, is actually more favorable compared to most U.S. counties. The county, which contains the state capital city of the same name, comprises more than half the state’s population. While both high school and college attainment levels among adults are slightly below the national figures, Providence’s unemployment rate is also below the national rate, and its life expectancy is slightly higher than the national life expectancy.
[in-text-ad-2]

South Carolina: Marlboro County
> 5-yr. population change: -4.3% (state: +5.7%)
> Poverty rate: 26.6% (state: 16.6%)
> Adults with a bachelor’s degree: 8.9% (state: 27.0%)
> Life expectancy: 72.0 years (state: 76.9 years)
In Marlboro County, which ranks as the least healthy county in the state, the average life expectancy is just 72 years, about seven years below the national life expectancy. The county’s high poverty likely helps explain its low life expectancy, More than one in four county residents live in poverty, and the typical household income of just $33,921 is nearly $24,000 below the median nationwide. As is the case with many counties on this list, Marlboro County’s population is declining — it shrank by 4.3% over the last five years.

South Dakota: Oglala Lakota County
> 5-yr. population change: +0.0% (state: +4.9%)
> Poverty rate: 51.9% (state: 13.9%)
> Adults with a bachelor’s degree: 12.4% (state: 27.8%)
> Life expectancy: 66.8 years (state: 79.6 years)
Oglala Lakota County falls entirely within the Pine Ridge Indian Reservation in southern South Dakota. Average life expectancy can be indicative of local conditions, and in Oglala Lakota County, life expectancy is just 66.8 years, the lowest of any U.S. county and more in line with life expectancy in developing nations like Pakistan and Tanzania than the United States.
Serious financial hardship is common in Oglala Lakota County. It is one of only two counties in the country where over half of the population lives in poverty, and nearly 55% of county residents rely on SNAP, or food stamps, to afford basic necessities. Not only does Oglala Lakota rank as the worst county to live in South Dakota, but it is also the worst county to live in nationwide.
[in-text-ad]

Tennessee: Grundy County
> 5-yr. population change: -2.9% (state: +3.8%)
> Poverty rate: 28.5% (state: 16.7%)
> Adults with a bachelor’s degree: 11.0% (state: 26.1%)
> Life expectancy: 72.5 years (state: 76.3 years)
Grundy County, located just northwest of Chattanooga, ranks as the worst county to live in Tennessee. After declining by about half a year since 2010, life expectancy in Grundy is just 72.5 years, nearly four years below the average life expectancy in the state.
The typical household in Grundy County earns only $31,919 a year, well below the median household income statewide of $48,708. Incomes tend to rise with educational attainment, and in Grundy County, only 73.2% of adults have a high school diploma, the smallest share of any county in the state.
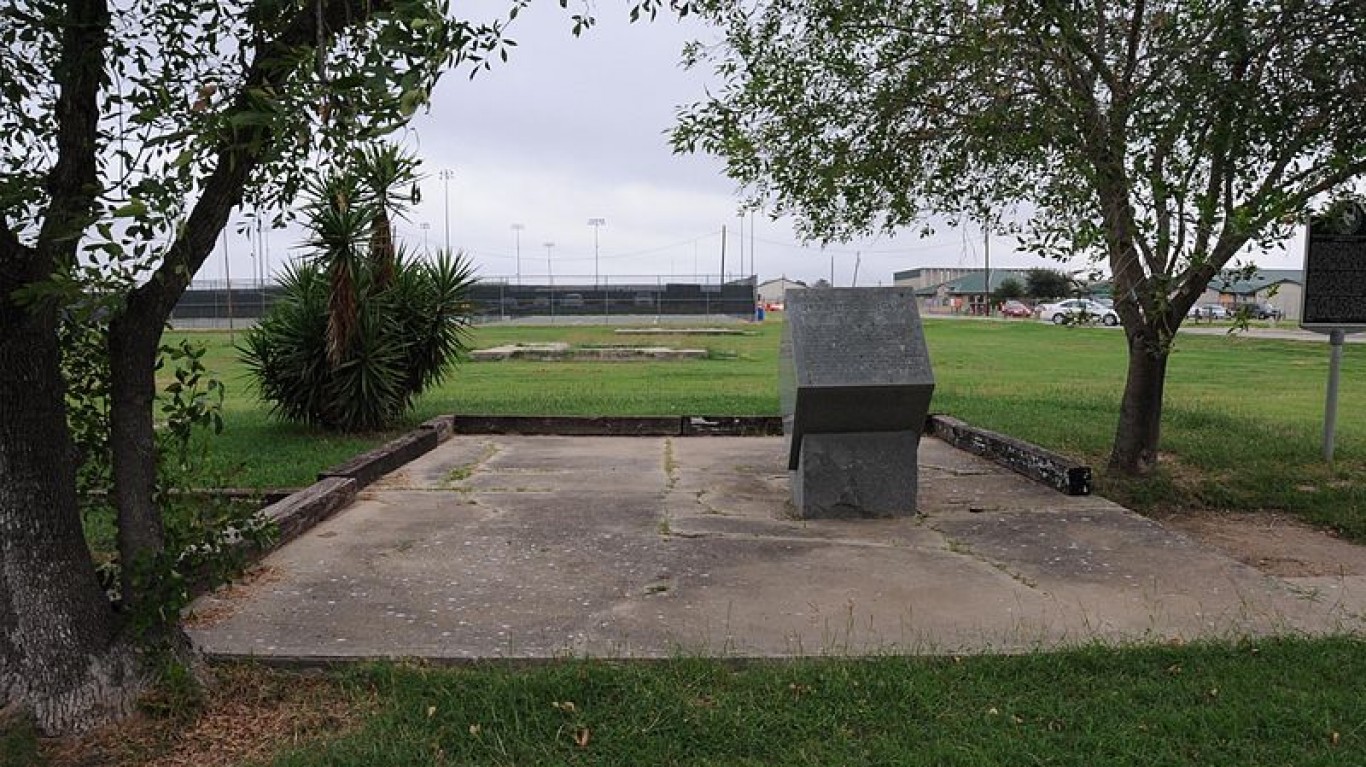
Texas: Zavala County
> 5-yr. population change: +3.4% (state: +8.8%)
> Poverty rate: 36.2% (state: 16.0%)
> Adults with a bachelor’s degree: 7.6% (state: 28.7%)
> Life expectancy: 77.9 years (state: 78.5 years)
Zavala County is located southwest of San Antonio, not far from the Mexico border. Only 60.3% of county residents have a high school diploma, and just 7.6% of adults have a bachelor’s degree, well below the comparable 82.8% and 28.7% statewide shares. Incomes tend to rise with educational attainment, and the relatively small share of high school- and college-educated adults in Zavala County likely partially explains the low incomes. More than one every three county residents live below the poverty line, more than double the 16.0% state poverty rate.

Utah: San Juan County
> 5-yr. population change: +3.3% (state: +8.2%)
> Poverty rate: 28.4% (state: 11.0%)
> Adults with a bachelor’s degree: 17.3% (state: 32.5%)
> Life expectancy: 79.0 years (state: 79.9 years)
San Juan County is located in the southeast corner of Utah, along the state borders of Colorado, Arizona, and New Mexico. It is the only county in the state where more than one in every 10 households earn less than $10,000 a year. The county’s 28.4% poverty rate is by far the highest in the state and more than double the 11.0% poverty rate across Utah.
Native American reservations often struggle with social and economic challenges, and much of San Juan County covers the 17.5 million square acre Navajo Nation Reservation
[in-text-ad-2]

Vermont: Orleans County
> 5-yr. population change: -0.9% (state: -0.1%)
> Poverty rate: 14.2% (state: 11.4%)
> Adults with a bachelor’s degree: 22.0% (state: 36.8%)
> Life expectancy: 79.4 years (state: 80.2 years)
As a state, Vermont ranks as one of the best places to live, and so even the county that performs the worst in 24/7 Wall St.’s index still compares favorably to most U.S. counties. Still, Orleans County, which forms part of the state border with Canada, has a median annual household income of $45,664, which is about $12,000 below the median incomes state and nationwide.
The county stands out as an unfavorable place to live by some other measures. Its 4.7% April unemployment rate, for example, is by far the highest among Vermont’s counties with at least 10,000 people. The majority of Vermont counties have an unemployment rate of 2.6% or less.
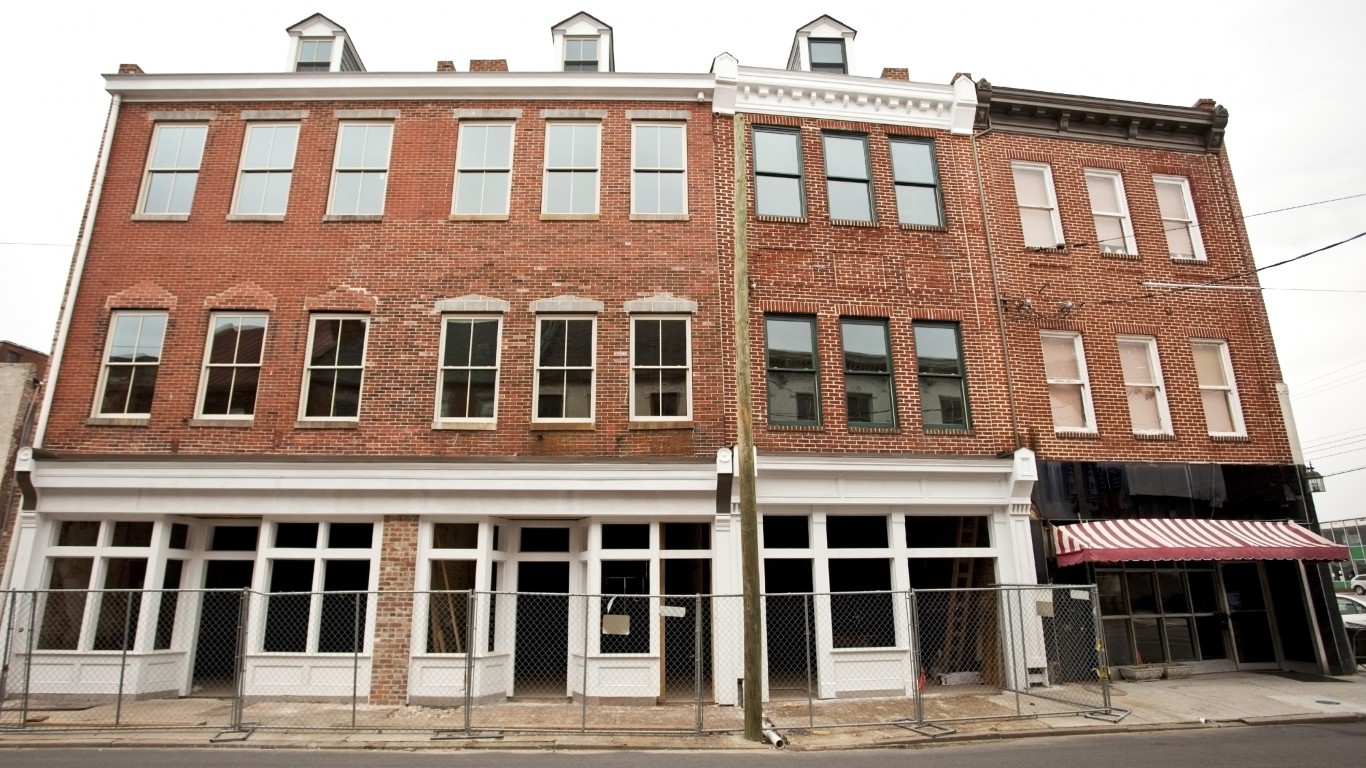
Virginia: Petersburg
> 5-yr. population change: -0.6% (state: +4.4%)
> Poverty rate: 27.6% (state: 11.2%)
> Adults with a bachelor’s degree: 17.5% (state: 37.6%)
> Life expectancy: 72.2 years (state: 79.2 years)
Like other independent cities in the state of Virginia, Petersburg operates as a county. The average life expectancy at birth in the city of just 72 years is nearly seven years less than the national life expectancy and is one of the lowest life expectancies of any U.S. county. The city’s low life expectancy is closely tied to its low incomes, as poorer residents tend to face a number of obstacles to maintaining good health. Of the city’s 32,000 residents, 27.6% live in poverty, compared to the state poverty rate of 11.2%.
[in-text-ad]

Washington: Adams County
> 5-yr. population change: +3.7% (state: +6.4%)
> Poverty rate: 23.1% (state: 12.2%)
> Adults with a bachelor’s degree: 13.6% (state: 34.5%)
> Life expectancy: 79.2 years (state: 80.0 years)
Adams County is located in eastern Washington, southwest of Spokane. Adams is the only county in the state where fewer than two in every three adults have graduated high school. A high school education is often a prerequisite for employment, and the county’s low educational attainment rates may partially explain its high jobless rate. As of April 2019, 6.0% of county workers were unemployed, well above the unemployment rates of 4.7% statewide and 3.6% nationwide. With a 23.1% poverty rate, Adams County residents are nearly twice as likely to face serious financial hardship than the typical Washington resident.
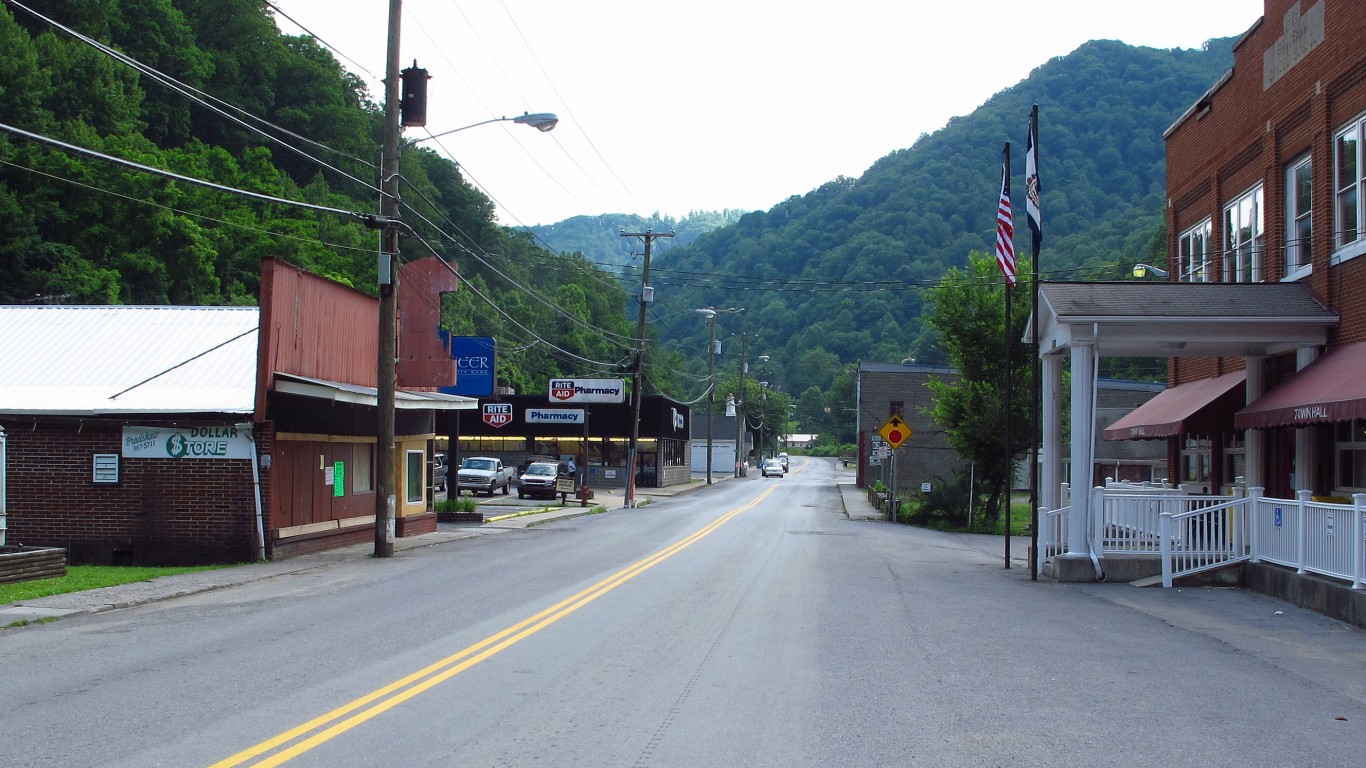
West Virginia: McDowell County
> 5-yr. population change: -10.3% (state: -0.7%)
> Poverty rate: 34.9% (state: 17.8%)
> Adults with a bachelor’s degree: 4.9% (state: 19.9%)
> Life expectancy: 70.3 years (state: 76.0 years)
McDowell County is the worst county to live in West Virginia and one of the worst counties to live in nationwide. A coal county located in the southern part of the state, McDowell is characterized by population decline and poverty. Currently, the county is home to less than 20,000 people, down from nearly 100,000 in 1950. In the last five years alone, the county’s population shrunk by 10.3%. Of the remaining residents, more than a third live below the poverty line.
Opioid overdoses are contributing to lower life expectancy in the United States, and McDowell County has been hit especially hard by the opioid epidemic. Between 2010 and 2014, life expectancy in the county fell slightly from 70.4 years to 70.3.
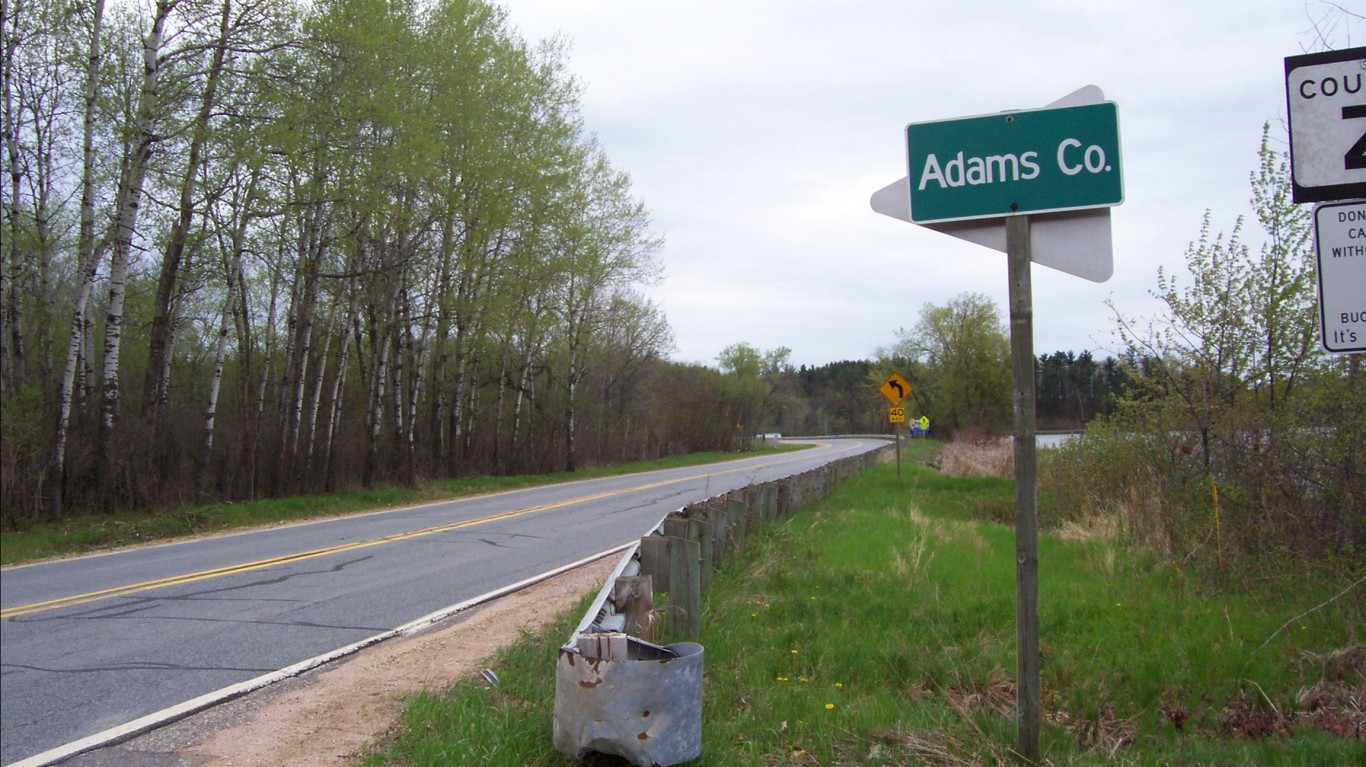
Wisconsin: Adams County
> 5-yr. population change: -3.8% (state: +1.3%)
> Poverty rate: 13.0% (state: 12.3%)
> Adults with a bachelor’s degree: 12.5% (state: 29.0%)
> Life expectancy: 77.8 years (state: 79.8 years)
Adams County lags behind a majority of Wisconsin counties in several measures related to income, education, and health. The typical household in Adams County earns $44,003 a year, more than $13,000 less than the state median of $56,759. One factor contributing to low incomes is likely the low educational attainment of area residents. Just 12.5% of Adams County adults have a bachelor’s degree, the second smallest share of any county in Wisconsin and less than half the state’s 29.0% college attainment rate.
Income and education are some of the most significant factors that influence health and longevity. Life expectancy in Adams County is just 77.8 years, less than Wisconsin’s average of 79.8 years.
[in-text-ad-2]
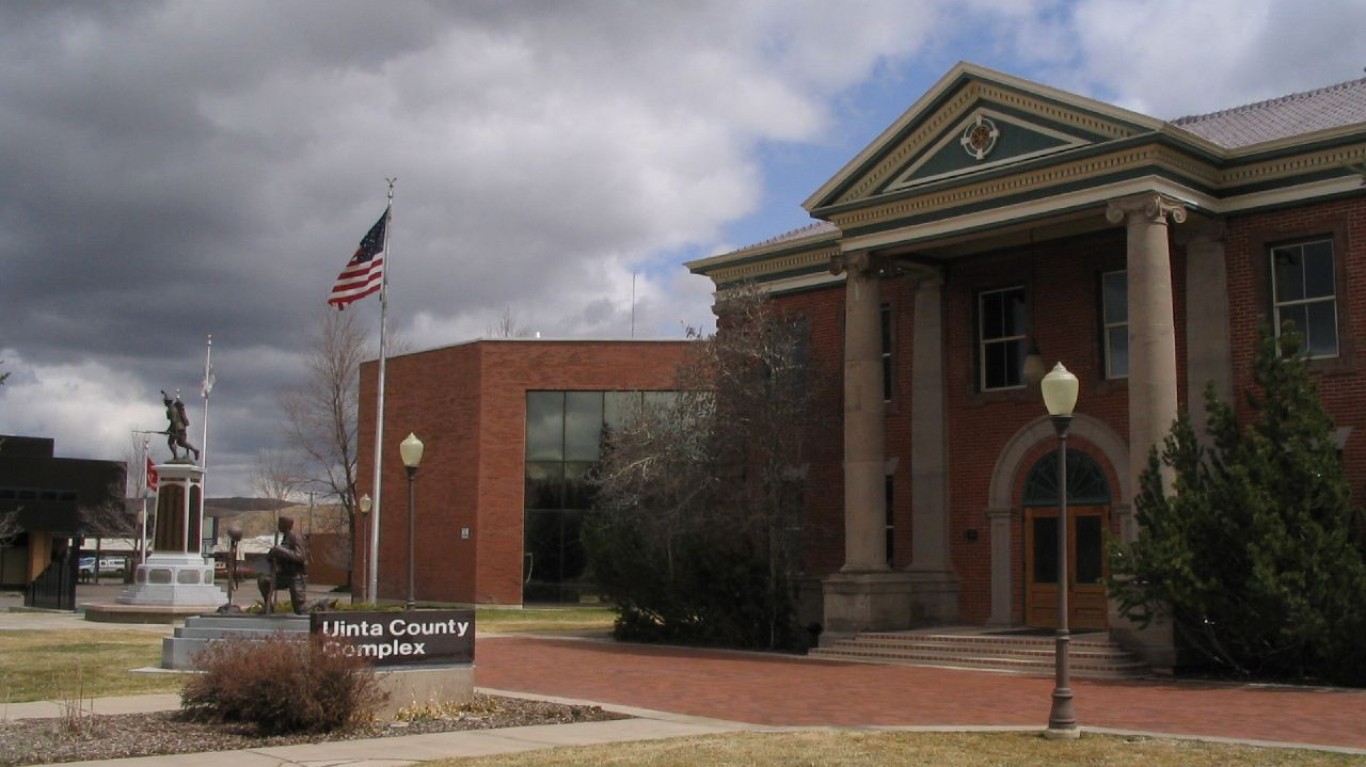
Wyoming: Uinta County
> 5-yr. population change: -0.9% (state: +3.6%)
> Poverty rate: 14.9% (state: 11.1%)
> Adults with a bachelor’s degree: 17.4% (state: 26.7%)
> Life expectancy: 77.4 years (state: 78.6 years)
Uinta County is located in the southwest corner of Wyoming. Just 17.4% of adults in Uinta County have a bachelor’s degree or higher, the smallest share of any county in the state. Incomes tend to rise with higher educational attainment, and in Uinta, the typical household earns $54,672 a year, slightly less than the median household income of $60,938 in Wyoming. Like many counties on this list, Uinta is shrinking. In the last five years, the number of people living in the county fell by 0.9%, even as the state’s population grew by 3.6%.
Thank you for reading! Have some feedback for us?
Contact the 24/7 Wall St. editorial team.
 24/7 Wall St.
 24/7 Wall St.
 24/7 Wall St.
 24/7 Wall St.
 24/7 Wall St.


