Special Report
States Where the Most People Still Live With Their Parents

Published:
Last Updated:

In the United States, people are legally considered adults after turning 18. This is the age when people are expected to head out on their own, either by joining the workforce or continuing their education in college.
Of course, no one expects all young people to leave their parents’ home the day after their 18th birthday, but more and more young adults remain at home long after they have completed high school. In 2006, 29.0% of Americans aged 18 to 34 lived at their parents’ home. In 2017, this share increased to 34.6%.
The rate of younger adults living with their parents varies widely from state to state. In a few states, less than 20% of residents 18 to 34 live with their parents. In others, more than 40% of the same age group have remained at home.
24/7 Wall St. reviewed data from the Census Bureau’s American Community Survey to determine the states where the largest share of 18 to 34 year olds still live with their parents.
Of course, some 18-year-olds are still in high school. Other young adults live at home while attending college to save money. Many students face very different economic realities based on where they live. Young adults are more likely to continue living at home in the states where a dollar is worth less.
Young people may not be completely at fault for their living situation. Economists agree that millennials face much tougher economic realities than their parents. Home prices and rent are much more expensive today, even adjusting for inflation, than in the 1960s and 70s. The cost of a college degree at a state school has also more than tripled in the last 30 years. Most college graduates finish school with debt, averaging over $28,000. Many states in which many young people live with their parents also rank highly among the states where students graduate with the most debt.
Click here to see where the most people still live with their parents
Click here to read our methodology

50. North Dakota
> 18-34 yr. old population living with parent(s), 2017: 15.8%
> 18-34 yr. old population living with parent(s), 2006: 14.9% (the lowest)
> Cost of living: 9.9% lower than avg.
> Median age at first marriage: 27.7 (10th lowest)
> Annual unemployment rate: 2.3% (2nd lowest)
[in-text-ad]

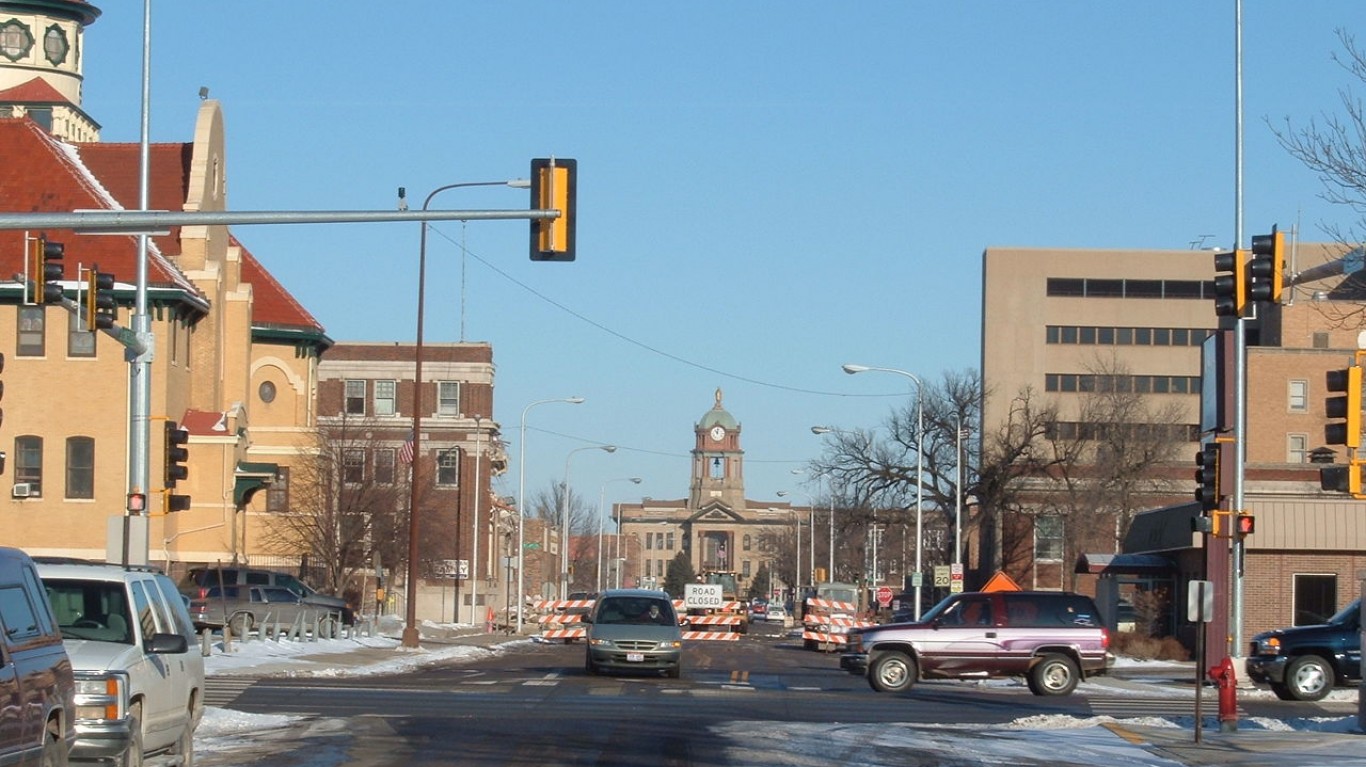
49. South Dakota
> 18-34 yr. old population living with parent(s), 2017: 19.3%
> 18-34 yr. old population living with parent(s), 2006: 21.5% (7th lowest)
> Cost of living: 11.8% lower than avg.
> Median age at first marriage: 28.0 (16th lowest)
> Annual unemployment rate: 2.8% (5th lowest – tied)

48. Nebraska
> 18-34 yr. old population living with parent(s), 2017: 20.9%
> 18-34 yr. old population living with parent(s), 2006: 21.2% (6th lowest)
> Cost of living: 10.4% lower than avg.
> Median age at first marriage: 27.5 (9th lowest)
> Annual unemployment rate: 2.9% (9th lowest – tied)

47. Iowa
> 18-34 yr. old population living with parent(s), 2017: 21.7%
> 18-34 yr. old population living with parent(s), 2006: 19.7% (3rd lowest)
> Cost of living: 10.2% lower than avg.
> Median age at first marriage: 27.9 (13th lowest)
> Annual unemployment rate: 2.4% (3rd lowest – tied)
[in-text-ad-2]

46. Wyoming
> 18-34 yr. old population living with parent(s), 2017: 23.6%
> 18-34 yr. old population living with parent(s), 2006: 20.2% (5th lowest)
> Cost of living: 4.8% lower than avg.
> Median age at first marriage: 26.8 (5th lowest)
> Annual unemployment rate: 3.6% (23rd lowest – tied)

45. Montana
> 18-34 yr. old population living with parent(s), 2017: 23.8%
> 18-34 yr. old population living with parent(s), 2006: 23.1% (11th lowest)
> Cost of living: 5.4% lower than avg.
> Median age at first marriage: 28.4 (22nd lowest)
> Annual unemployment rate: 3.6% (23rd lowest – tied)
[in-text-ad]

44. Kansas
> 18-34 yr. old population living with parent(s), 2017: 24.4%
> 18-34 yr. old population living with parent(s), 2006: 22.6% (10th lowest)
> Cost of living: 10.0% lower than avg.
> Median age at first marriage: 27.2 (6th lowest)
> Annual unemployment rate: 3.5% (19th lowest – tied)

43. Colorado
> 18-34 yr. old population living with parent(s), 2017: 25.4%
> 18-34 yr. old population living with parent(s), 2006: 21.5% (8th lowest)
> Cost of living: 3.2% higher than avg.
> Median age at first marriage: 29.1 (15th highest)
> Annual unemployment rate: 3.4% (19th lowest – tied)

42. Washington
> 18-34 yr. old population living with parent(s), 2017: 25.4%
> 18-34 yr. old population living with parent(s), 2006: 24.0% (16th lowest)
> Cost of living: 6.4% higher than avg.
> Median age at first marriage: 28.4 (23rd lowest)
> Annual unemployment rate: 4.7% (6th highest)
[in-text-ad-2]

41. Oregon
> 18-34 yr. old population living with parent(s), 2017: 26.6%
> 18-34 yr. old population living with parent(s), 2006: 22.3% (9th lowest)
> Cost of living: 0.5% lower than avg.
> Median age at first marriage: 28.9 (21st highest)
> Annual unemployment rate: 4.3% (9th highest – tied)

40. Arkansas
> 18-34 yr. old population living with parent(s), 2017: 26.6%
> 18-34 yr. old population living with parent(s), 2006: 24.6% (19th lowest)
> Cost of living: 13.5% lower than avg.
> Median age at first marriage: 26.5 (3rd lowest)
> Annual unemployment rate: 3.6% (23rd lowest – tied)
[in-text-ad]

39. Idaho
> 18-34 yr. old population living with parent(s), 2017: 27.1%
> 18-34 yr. old population living with parent(s), 2006: 19.6% (2nd lowest)
> Cost of living: 7.0% lower than avg.
> Median age at first marriage: 26.0 (2nd lowest)
> Annual unemployment rate: 2.8% (5th lowest – tied)

38. Wisconsin
> 18-34 yr. old population living with parent(s), 2017: 27.1%
> 18-34 yr. old population living with parent(s), 2006: 24.6% (18th lowest)
> Cost of living: 7.6% lower than avg.
> Median age at first marriage: 28.9 (20th highest)
> Annual unemployment rate: 2.8% (5th lowest – tied)

37. Oklahoma
> 18-34 yr. old population living with parent(s), 2017: 27.9%
> 18-34 yr. old population living with parent(s), 2006: 23.7% (13th lowest)
> Cost of living: 11.0% lower than avg.
> Median age at first marriage: 26.7 (4th lowest)
> Annual unemployment rate: 3.3% (15th lowest – tied)
[in-text-ad-2]

36. Alaska
> 18-34 yr. old population living with parent(s), 2017: 28.3%
> 18-34 yr. old population living with parent(s), 2006: 31.0% (13th highest)
> Cost of living: 4.4% higher than avg.
> Median age at first marriage: 27.4 (8th lowest)
> Annual unemployment rate: 6.5% (the highest)

35. Minnesota
> 18-34 yr. old population living with parent(s), 2017: 28.7%
> 18-34 yr. old population living with parent(s), 2006: 23.9% (15th lowest)
> Cost of living: 2.5% lower than avg.
> Median age at first marriage: 29.0 (17th highest)
> Annual unemployment rate: 3.3% (15th lowest – tied)
[in-text-ad]

34. Indiana
> 18-34 yr. old population living with parent(s), 2017: 29.4%
> 18-34 yr. old population living with parent(s), 2006: 26.0% (21st lowest)
> Cost of living: 10.2% lower than avg.
> Median age at first marriage: 28.0 (15th lowest)
> Annual unemployment rate: 3.6% (23rd lowest – tied)

33. Missouri
> 18-34 yr. old population living with parent(s), 2017: 29.5%
> 18-34 yr. old population living with parent(s), 2006: 26.1% (22nd lowest)
> Cost of living: 10.5% lower than avg.
> Median age at first marriage: 28.1 (19th lowest)
> Annual unemployment rate: 3.3% (15th lowest – tied)

32. Utah
> 18-34 yr. old population living with parent(s), 2017: 29.7%
> 18-34 yr. old population living with parent(s), 2006: 23.6% (12th lowest)
> Cost of living: 3.0% lower than avg.
> Median age at first marriage: 25.5 (the lowest)
> Annual unemployment rate: 2.9% (9th lowest – tied)
[in-text-ad-2]

31. Kentucky
> 18-34 yr. old population living with parent(s), 2017: 30.3%
> 18-34 yr. old population living with parent(s), 2006: 27.8% (25th lowest)
> Cost of living: 12.1% lower than avg.
> Median age at first marriage: 27.2 (7th lowest)
> Annual unemployment rate: 4.0% (12th highest – tied)

30. Ohio
> 18-34 yr. old population living with parent(s), 2017: 30.5%
> 18-34 yr. old population living with parent(s), 2006: 29.5% (19th highest)
> Cost of living: 11.1% lower than avg.
> Median age at first marriage: 28.8 (25th highest)
> Annual unemployment rate: 4.3% (9th highest – tied)
[in-text-ad]

29. Tennessee
> 18-34 yr. old population living with parent(s), 2017: 30.8%
> 18-34 yr. old population living with parent(s), 2006: 26.2% (23rd lowest)
> Cost of living: 9.6% lower than avg.
> Median age at first marriage: 27.7 (11th lowest)
> Annual unemployment rate: 3.2% (13th lowest – tied)

28. Nevada
> 18-34 yr. old population living with parent(s), 2017: 31.6%
> 18-34 yr. old population living with parent(s), 2006: 19.8% (4th lowest)
> Cost of living: 2.4% lower than avg.
> Median age at first marriage: 28.6 (24th lowest)
> Annual unemployment rate: 4.0% (12th highest – tied)

27. Vermont
> 18-34 yr. old population living with parent(s), 2017: 31.8%
> 18-34 yr. old population living with parent(s), 2006: 29.5% (20th highest)
> Cost of living: 2.5% higher than avg.
> Median age at first marriage: 29.3 (13th highest)
> Annual unemployment rate: 2.2% (the lowest)
[in-text-ad-2]

26. North Carolina
> 18-34 yr. old population living with parent(s), 2017: 31.9%
> 18-34 yr. old population living with parent(s), 2006: 23.8% (14th lowest)
> Cost of living: 8.7% lower than avg.
> Median age at first marriage: 28.3 (21st lowest)
> Annual unemployment rate: 4.0% (12th highest – tied)

25. Virginia
> 18-34 yr. old population living with parent(s), 2017: 32.6%
> 18-34 yr. old population living with parent(s), 2006: 28.0% (24th highest)
> Cost of living: 2.1% higher than avg.
> Median age at first marriage: 28.8 (23rd highest)
> Annual unemployment rate: 2.9% (9th lowest – tied)
[in-text-ad]

24. Maine
> 18-34 yr. old population living with parent(s), 2017: 32.6%
> 18-34 yr. old population living with parent(s), 2006: 25.6% (20th lowest)
> Cost of living: 1.6% lower than avg.
> Median age at first marriage: 29.2 (14th highest)
> Annual unemployment rate: 3.3% (15th lowest – tied)

23. Michigan
> 18-34 yr. old population living with parent(s), 2017: 34.0%
> 18-34 yr. old population living with parent(s), 2006: 30.9% (14th highest)
> Cost of living: 7.0% lower than avg.
> Median age at first marriage: 29.0 (18th highest)
> Annual unemployment rate: 4.1% (12th highest – tied)

22. Arizona
> 18-34 yr. old population living with parent(s), 2017: 34.2%
> 18-34 yr. old population living with parent(s), 2006: 24.2% (17th lowest)
> Cost of living: 3.6% lower than avg.
> Median age at first marriage: 28.9 (19th highest)
> Annual unemployment rate: 4.9% (3rd highest – tied)
[in-text-ad-2]

21. Alabama
> 18-34 yr. old population living with parent(s), 2017: 34.4%
> 18-34 yr. old population living with parent(s), 2006: 30.6% (16th highest)
> Cost of living: 13.3% lower than avg.
> Median age at first marriage: 28.0 (17th lowest)
> Annual unemployment rate: 3.8% (18th highest – tied)

20. Georgia
> 18-34 yr. old population living with parent(s), 2017: 34.7%
> 18-34 yr. old population living with parent(s), 2006: 26.5% (24th lowest)
> Cost of living: 7.5% lower than avg.
> Median age at first marriage: 28.8 (24th highest)
> Annual unemployment rate: 3.8% (18th highest – tied)
[in-text-ad]

19. Texas
> 18-34 yr. old population living with parent(s), 2017: 34.9%
> 18-34 yr. old population living with parent(s), 2006: 28.2% (23rd highest)
> Cost of living: 3.0% lower than avg.
> Median age at first marriage: 28.1 (18th lowest)
> Annual unemployment rate: 3.7% (23rd highest – tied)

18. New Hampshire
> 18-34 yr. old population living with parent(s), 2017: 34.9%
> 18-34 yr. old population living with parent(s), 2006: 29.6% (17th highest)
> Cost of living: 5.8% higher than avg.
> Median age at first marriage: 29.9 (6th highest)
> Annual unemployment rate: 2.4% (3rd lowest – tied)

17. South Carolina
> 18-34 yr. old population living with parent(s), 2017: 35.0%
> 18-34 yr. old population living with parent(s), 2006: 29.5% (18th highest)
> Cost of living: 9.6% lower than avg.
> Median age at first marriage: 28.7 (25th lowest)
> Annual unemployment rate: 3.4% (19th lowest – tied)
[in-text-ad-2]

16. West Virginia
> 18-34 yr. old population living with parent(s), 2017: 35.6%
> 18-34 yr. old population living with parent(s), 2006: 28.8% (22nd highest)
> Cost of living: 13.0% lower than avg.
> Median age at first marriage: 27.9 (12th lowest)
> Annual unemployment rate: 4.9% (3rd highest – tied)

15. Louisiana
> 18-34 yr. old population living with parent(s), 2017: 35.6%
> 18-34 yr. old population living with parent(s), 2006: 32.7% (7th highest)
> Cost of living: 9.9% lower than avg.
> Median age at first marriage: 29.0 (16th highest)
> Annual unemployment rate: 4.5% (7th highest)
[in-text-ad]

14. Massachusetts
> 18-34 yr. old population living with parent(s), 2017: 36.1%
> 18-34 yr. old population living with parent(s), 2006: 33.4% (5th highest)
> Cost of living: 7.9% higher than avg.
> Median age at first marriage: 30.6 (the highest)
> Annual unemployment rate: 2.9% (9th lowest – tied)

13. Pennsylvania
> 18-34 yr. old population living with parent(s), 2017: 36.4%
> 18-34 yr. old population living with parent(s), 2006: 33.9% (4th highest)
> Cost of living: 2.1% lower than avg.
> Median age at first marriage: 29.7 (11th highest)
> Annual unemployment rate: 3.8% (18th highest – tied)

12. Illinois
> 18-34 yr. old population living with parent(s), 2017: 36.5%
> 18-34 yr. old population living with parent(s), 2006: 31.8% (10th highest)
> Cost of living: 1.5% lower than avg.
> Median age at first marriage: 29.8 (8th highest)
> Annual unemployment rate: 4.4% (8th highest)
[in-text-ad-2]

11. Mississippi
> 18-34 yr. old population living with parent(s), 2017: 37.4%
> 18-34 yr. old population living with parent(s), 2006: 32.4% (8th highest)
> Cost of living: 14.3% lower than avg.
> Median age at first marriage: 27.9 (14th lowest)
> Annual unemployment rate: 4.9% (3rd highest – tied)

10. Hawaii
> 18-34 yr. old population living with parent(s), 2017: 37.4%
> 18-34 yr. old population living with parent(s), 2006: 33.0% (6th highest)
> Cost of living: 18.5% higher than avg.
> Median age at first marriage: 28.1 (20th lowest)
> Annual unemployment rate: 2.8% (5th lowest – tied)
[in-text-ad]

9. Delaware
> 18-34 yr. old population living with parent(s), 2017: 37.4%
> 18-34 yr. old population living with parent(s), 2006: 29.2% (21st highest)
> Cost of living: 0.1% higher than avg.
> Median age at first marriage: 29.7 (10th highest)
> Annual unemployment rate: 3.2% (13th lowest – tied)

8. New Mexico
> 18-34 yr. old population living with parent(s), 2017: 38.1%
> 18-34 yr. old population living with parent(s), 2006: 30.9% (15th highest)
> Cost of living: 6.7% lower than avg.
> Median age at first marriage: 28.9 (22nd highest)
> Annual unemployment rate: 5.0% (2nd highest)

7. California
> 18-34 yr. old population living with parent(s), 2017: 39.3%
> 18-34 yr. old population living with parent(s), 2006: 31.1% (12th highest)
> Cost of living: 14.8% higher than avg.
> Median age at first marriage: 30.0 (4th highest)
> Annual unemployment rate: 4.3% (9th highest – tied)
[in-text-ad-2]

6. Florida
> 18-34 yr. old population living with parent(s), 2017: 39.8%
> 18-34 yr. old population living with parent(s), 2006: 27.8% (25th highest)
> Cost of living: 0.1% lower than avg.
> Median age at first marriage: 29.8 (9th highest)
> Annual unemployment rate: 3.4% (19th lowest – tied)

5. Maryland
> 18-34 yr. old population living with parent(s), 2017: 40.0%
> 18-34 yr. old population living with parent(s), 2006: 31.2% (11th highest)
> Cost of living: 9.4% higher than avg.
> Median age at first marriage: 29.6 (12th highest)
> Annual unemployment rate: 3.8% (18th highest – tied)
[in-text-ad]

4. New York
> 18-34 yr. old population living with parent(s), 2017: 40.3%
> 18-34 yr. old population living with parent(s), 2006: 36.7% (2nd highest)
> Cost of living: 15.8% higher than avg.
> Median age at first marriage: 30.5 (2nd highest)
> Annual unemployment rate: 3.9% (16th highest – tied)

3. Connecticut
> 18-34 yr. old population living with parent(s), 2017: 42.0%
> 18-34 yr. old population living with parent(s), 2006: 34.0% (3rd highest)
> Cost of living: 8.0% higher than avg.
> Median age at first marriage: 30.3 (3rd highest)
> Annual unemployment rate: 3.8% (18th highest – tied)

2. Rhode Island
> 18-34 yr. old population living with parent(s), 2017: 42.3%
> 18-34 yr. old population living with parent(s), 2006: 31.9% (9th highest)
> Cost of living: 1.4% lower than avg.
> Median age at first marriage: 29.9 (5th highest)
> Annual unemployment rate: 3.7% (23rd highest – tied)
[in-text-ad-2]

1. New Jersey
> 18-34 yr. old population living with parent(s), 2017: 47.5%
> 18-34 yr. old population living with parent(s), 2006: 39.2% (the highest)
> Cost of living: 12.9% higher than avg.
> Median age at first marriage: 29.9 (7th highest)
> Annual unemployment rate: 3.9% (16th highest – tied)
Methodology
To identify the states where the most people live with their parents, 24/7 Wall St. reviewed the share of 18-34-year-olds living with their parents in each state, with data from the Census Bureau’s 2017 American Community Survey. The cost of living in each state, or regional price parity, came from the Bureau of Economic Analysis and is for 2017. The median age of men and women when they were first married in each state comes from the Census Bureau’s 2017 American Consumer Survey. We calculated an average age at first marriage weighted using the ratio of male to female in the state population aged 15-54 — the same age group considered for the male and female median age at first marriage figures.
Credit card companies are at war, handing out free rewards and benefits to win the best customers. A good cash back card can be worth thousands of dollars a year in free money, not to mention other perks like travel, insurance, and access to fancy lounges. See our top picks for the best credit cards today. You won’t want to miss some of these offers.
Flywheel Publishing has partnered with CardRatings for our coverage of credit card products. Flywheel Publishing and CardRatings may receive a commission from card issuers.
Thank you for reading! Have some feedback for us?
Contact the 24/7 Wall St. editorial team.