Special Report
States That Are Most Prepared for Medical Emergencies

Published:
Last Updated:

The Spanish flu epidemic of 1918 killed tens of millions of people around the world, including over 670,000 Americans. The HIV/AIDS outbreak, which began in the early 1980s, has also killed nearly that many Americans. Each year, several serious outbreaks of disease in the United States are threatening to become epidemics, including the current measles outbreak. If it continues spreading, it might be among the worst outbreaks of all time.
There has not been catastrophic medical emergency in the country in years, partially thanks to the efforts of medical professionals working to contain any outbreak from spreading. But it could only be a matter of time before the next major epidemic strikes on U.S. soil.
It is impossible to gauge if, when, or how intensely events that can negatively impact our health will strike close to home. But the latest edition of the National Health Security Preparedness Index can give us some idea of how well each state is prepared for, protected from, and resilient to large-scale public health threats.
The NHSP index is broken down into six domains, each meant to measure a different aspect of emergency preparedness. In determining how prepared states are for medical emergencies, 24/7 Tempo considered the fourth domain, healthcare delivery, which measures, according to the report, actions to ensure access to high-quality medical services during and after disasters and emergencies. We listed the 20 states that received a score of 5 out of 10 or better in the healthcare delivery domain. These states tend to have better hospital systems, better EMT coverage, and better healthcare networks, all which would help better deal with a serious health crisis. It can be caused by one of these huge challenges Americans will face in the next decade.
Click here to see the 20 states that are most prepared for medical emergencies
Click here to see a detailed breakdown of the NHSP index.

20. South Dakota
> EMTs and paramedics: 115.0 per 100,000 people (6th most)
> Pct. of pop. who live within 50 mi of trauma centers: 94.5% (16th lowest)
> Physicians and surgeons: 390.7 per 100,000 people (5th most)
> Population: 869,666
[in-text-ad]

19. Pennsylvania
> EMTs and paramedics: 94.2 per 100,000 people (17th most)
> Pct. of pop. who live within 50 mi of trauma centers: 97.5% (24th lowest)
> Physicians and surgeons: 365.9 per 100,000 people (8th most)
> Population: 12,805,537
18. Missouri
> EMTs and paramedics: 114.7 per 100,000 people (7th most)
> Pct. of pop. who live within 50 mi of trauma centers: 94.6% (17th lowest)
> Physicians and surgeons: 253.6 per 100,000 people (18th fewest)
> Population: 6,113,532

17. Maine
> EMTs and paramedics: 131.0 per 100,000 people (2nd most)
> Pct. of pop. who live within 50 mi of trauma centers: 96.9% (21st lowest)
> Physicians and surgeons: 306.4 per 100,000 people (18th most)
> Population: 1,335,907
[in-text-ad-2]

16. Idaho
> EMTs and paramedics: 64.6 per 100,000 people (11th fewest)
> Pct. of pop. who live within 50 mi of trauma centers: 86.1% (7th lowest)
> Physicians and surgeons: 150.3 per 100,000 people (2nd fewest)
> Population: 1,716,943
15. Virginia
> EMTs and paramedics: 69.4 per 100,000 people (14th fewest)
> Pct. of pop. who live within 50 mi of trauma centers: 98.6% (24th highest)
> Physicians and surgeons: 252.4 per 100,000 people (17th fewest)
> Population: 8,470,020
[in-text-ad]
14. Mississippi
> EMTs and paramedics: 72.4 per 100,000 people (16th fewest)
> Pct. of pop. who live within 50 mi of trauma centers: 100.0% (the highest)
> Physicians and surgeons: 171.8 per 100,000 people (3rd fewest)
> Population: 2,984,100
13. Delaware
> EMTs and paramedics: 136.2 per 100,000 people (the most)
> Pct. of pop. who live within 50 mi of trauma centers: 100.0% (the highest)
> Physicians and surgeons: 275.4 per 100,000 people (24th most)
> Population: 961,939

12. Connecticut
> EMTs and paramedics: 92.5 per 100,000 people (18th most)
> Pct. of pop. who live within 50 mi of trauma centers: 100.0% (the highest)
> Physicians and surgeons: 405.3 per 100,000 people (4th most)
> Population: 3,588,184
[in-text-ad-2]

11. Vermont
> EMTs and paramedics: 78.6 per 100,000 people (22nd fewest)
> Pct. of pop. who live within 50 mi of trauma centers: 99.9% (12th highest)
> Physicians and surgeons: 605.0 per 100,000 people (the most)
> Population: 623,657

10. Nebraska
> EMTs and paramedics: 32.8 per 100,000 people (the fewest)
> Pct. of pop. who live within 50 mi of trauma centers: 96.8% (20th lowest)
> Physicians and surgeons: 236.2 per 100,000 people (15th fewest)
> Population: 1,920,076
[in-text-ad]
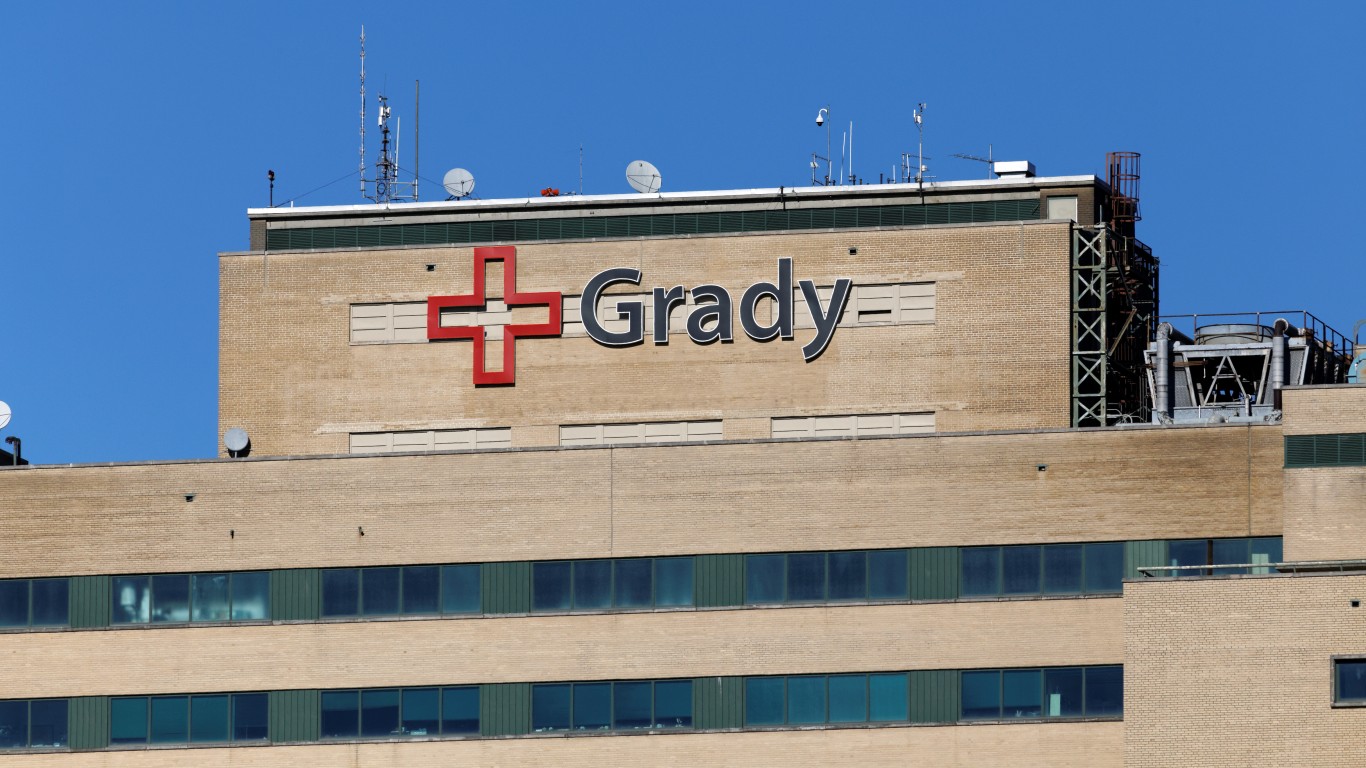
9. Georgia
> EMTs and paramedics: 92.5 per 100,000 people (18th most)
> Pct. of pop. who live within 50 mi of trauma centers: 92.7% (13th lowest)
> Physicians and surgeons: 226.0 per 100,000 people (10th fewest)
> Population: 10,429,379

8. Alabama
> EMTs and paramedics: 80.4 per 100,000 people (25th most)
> Pct. of pop. who live within 50 mi of trauma centers: 96.6% (19th lowest)
> Physicians and surgeons: 206.7 per 100,000 people (6th fewest)
> Population: 4,874,747

7. Rhode Island
> EMTs and paramedics: 55.7 per 100,000 people (7th fewest)
> Pct. of pop. who live within 50 mi of trauma centers: 100.0% (the highest)
> Physicians and surgeons: 311.0 per 100,000 people (15th most)
> Population: 1,059,639
[in-text-ad-2]

6. Kansas
> EMTs and paramedics: 103.0 per 100,000 people (12th most)
> Pct. of pop. who live within 50 mi of trauma centers: 97.5% (24th lowest)
> Physicians and surgeons: 254.2 per 100,000 people (19th fewest)
> Population: 2,913,123
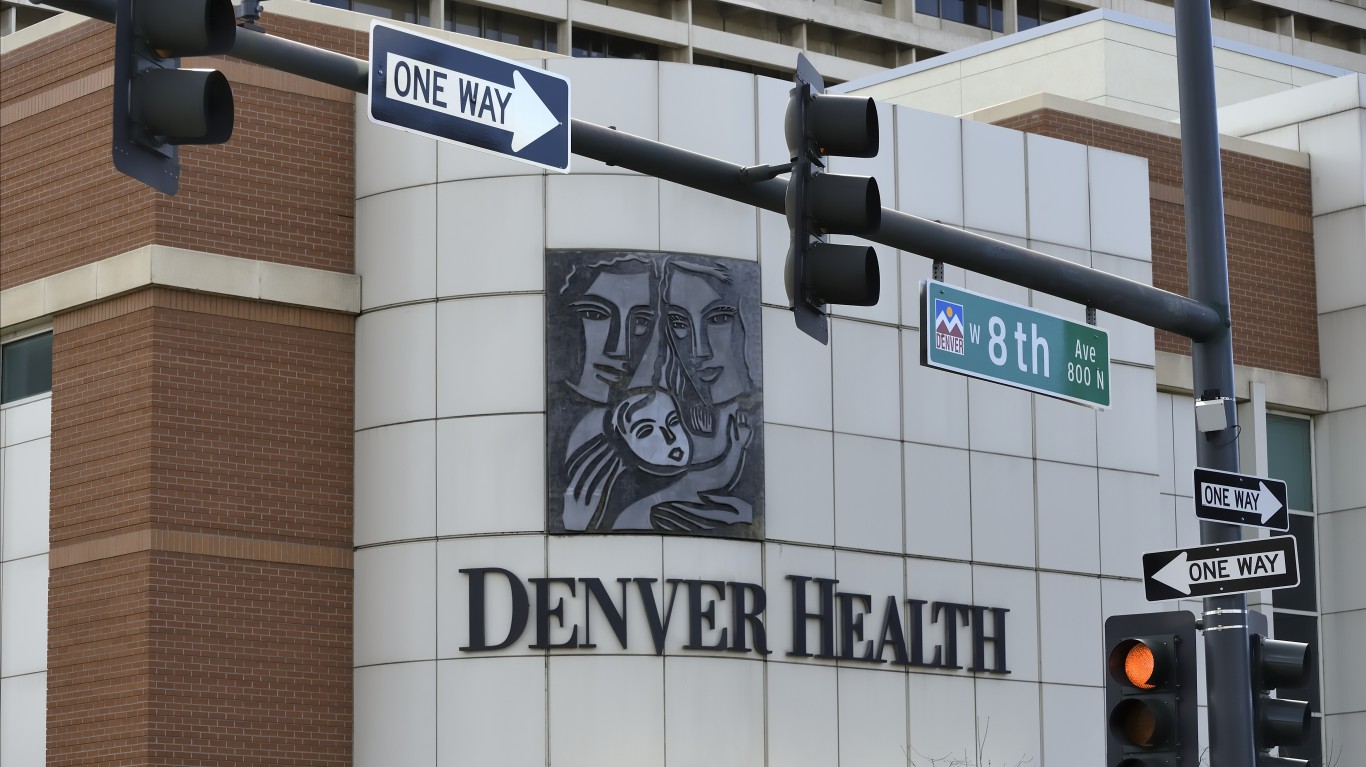
5. Colorado
> EMTs and paramedics: 75.3 per 100,000 people (18th fewest)
> Pct. of pop. who live within 50 mi of trauma centers: 98.8% (22nd highest)
> Physicians and surgeons: 333.3 per 100,000 people (11th most)
> Population: 5,607,154
[in-text-ad]

4. Wyoming
> EMTs and paramedics: 119.1 per 100,000 people (4th most)
> Pct. of pop. who live within 50 mi of trauma centers: 89.4% (10th lowest)
> Physicians and surgeons: 199.2 per 100,000 people (5th fewest)
> Population: 579,315

3. South Carolina
> EMTs and paramedics: 103.1 per 100,000 people (11th most)
> Pct. of pop. who live within 50 mi of trauma centers: 99.4% (18th highest)
> Physicians and surgeons: 300.1 per 100,000 people (19th most)
> Population: 5,024,369

2. New Hampshire
> EMTs and paramedics: 94.6 per 100,000 people (15th most)
> Pct. of pop. who live within 50 mi of trauma centers: 100.0% (the highest)
> Physicians and surgeons: 308.5 per 100,000 people (17th most)
> Population: 1,342,795
[in-text-ad-2]
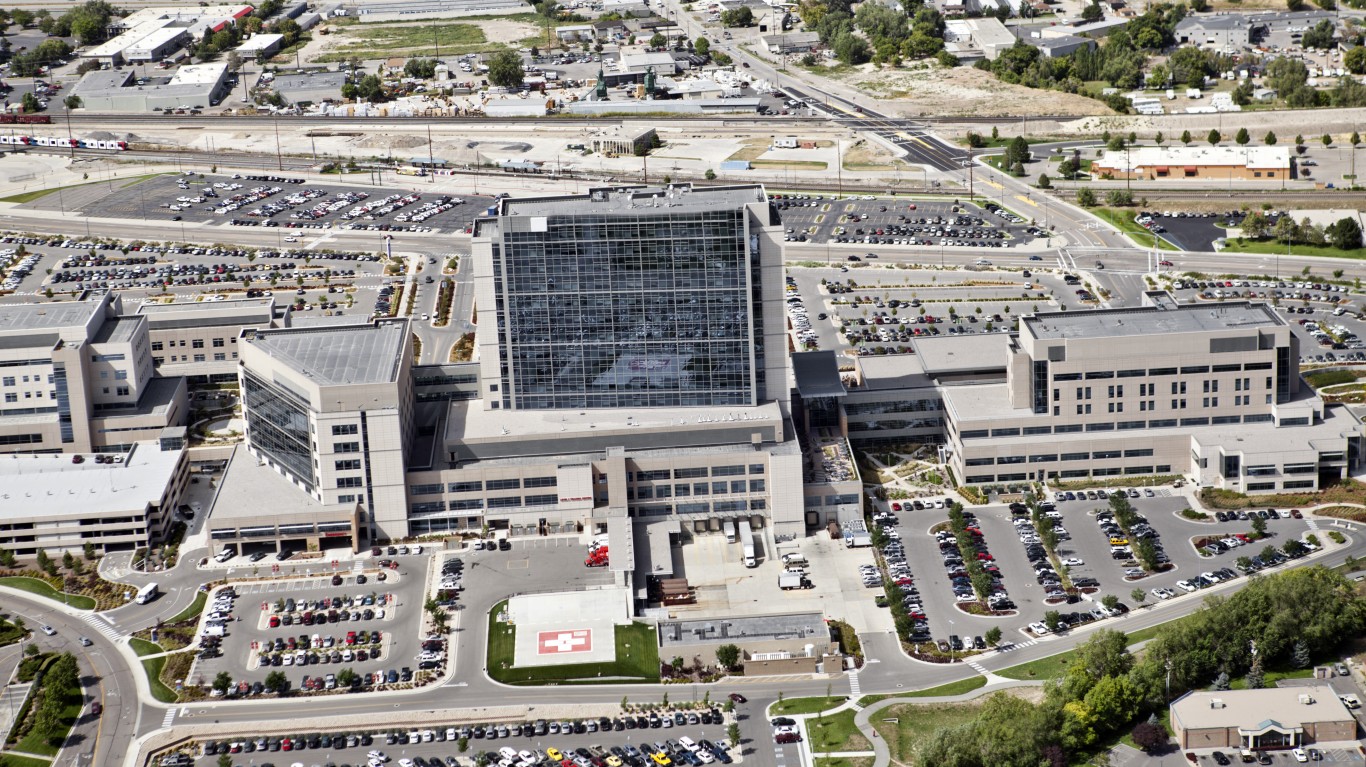
1. Utah
> EMTs and paramedics: 62.9 per 100,000 people (10th fewest)
> Pct. of pop. who live within 50 mi of trauma centers: 97.5% (24th lowest)
> Physicians and surgeons: 272.5 per 100,000 people (25th most)
> Population: 3,101,833
The healthcare delivery domain of the NHSPI includes several subdomains, including prehospital care, hospital and physician services, long-term care, mental and behavioral healthcare, and home care.
Prehospital care, which is generally provided by emergency medical services (EMS), includes 911 and dispatch, emergency medical response, field assessment and care, and transport (usually by ambulance or helicopter) to a hospital and between healthcare facilities.
Hospital and physician services refers to care for a patient who is formally admitted to a hospital or institution for treatment and/or care and stays for at least one night.
Long-term care is any medical and social services designed to support the needs of people with chronic health problems that affects their ability to perform everyday activities, who are living in a residential setting such as skilled nursing facilities, rehabilitation services, and the like.
Mental and behavioral healthcare deals with providing and facilitating access to medical and mental/behavioral health services including: medical treatment, substance abuse treatment, stress management, and medication with the intent to restore and improve the resilience and sustainability of health, mental and behavioral health, and social services networks. It includes access to information regarding available mass-care services for at-risk individuals and the entire affected population.
Home care includes clinical and nonclinical care, allowing a person with special needs to stay in their home. It may also include the management of patient care needs for people not sick enough to require hospitalization or long-term care, or for whom hospitalization is not deemed to be of benefit. Other examples of home care include skilled nursing visits, respiratory care services, provision of durable medical equipment, hospice, and pharmacist services.
Are you ahead, or behind on retirement? For families with more than $500,000 saved for retirement, finding a financial advisor who puts your interest first can be the difference, and today it’s easier than ever. SmartAsset’s free tool matches you with up to three fiduciary financial advisors who serve your area in minutes. Each advisor has been carefully vetted and must act in your best interests. Start your search now.
If you’ve saved and built a substantial nest egg for you and your family, don’t delay; get started right here and help your retirement dreams become a retirement reality.
Thank you for reading! Have some feedback for us?
Contact the 24/7 Wall St. editorial team.