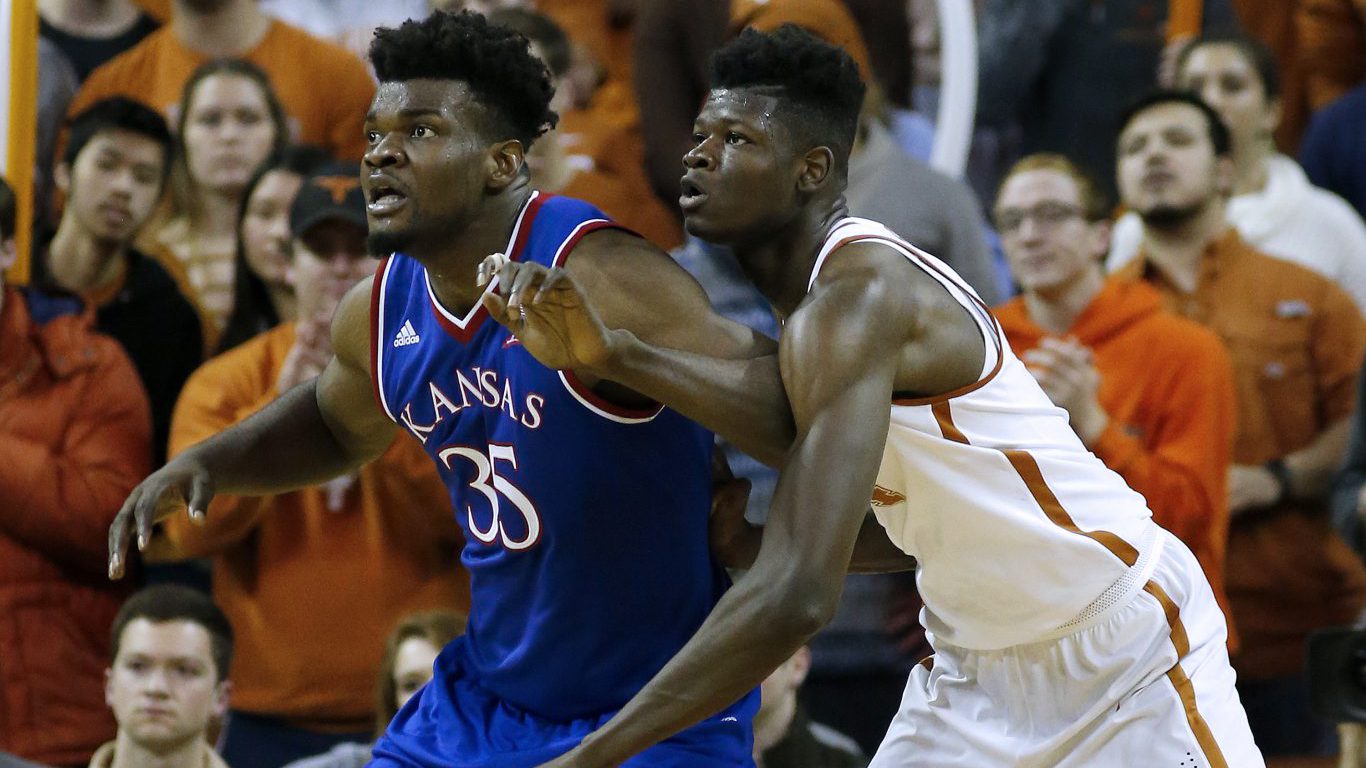
Each year, tens of millions of Americans pour into arenas, parks, rinks, and stadiums to see a professional sporting event in one of the four major American sports leagues — the NFL, NBA, NHL, and MLB.
But fans are now less inclined to go to games in person. The NFL, NHL, and MLB each saw a decline in total attendance from 2008 to 2018. Fans are often unwilling to pay high ticket prices, and teams don’t seem to care, as an increasing amount and share of their revenues come from lucrative TV contracts as opposed to ticket sales. But not all teams are losing fans at an equal rate. Some have seen average attendance declines of more than a third over the last decade.
To determine the sports teams running out of fans, 24/7 Wall St. used sports attendance data from ESPN to find the pro sports franchises that had an attendance decline of at least 10% from the 2008 season to the 2018 season. Teams that switched venues or made significant changes to their existing venue were not considered.
While it is tough to know exactly what is stopping fans from coming to games, losing is likely a top cause. Fans are simply not willing to pay top dollar to see a game that will probably end in disappointment for them. In fact, 10 of the 12 teams running out of fans played worse in 2018 than they did a decade earlier. Every team can have losing seasons, but franchises that always seem to come up short can lose the attention of their fans. Those squads are the hardest teams to root for.
Not all teams have attendance slumps for the same reason. Some teams, like the Philadelphia Phillies, usually have a packed stadium, but recent struggles seem to have impacted attendance. Other teams, like the Tampa Bay Rays, have never had strong attendance, and the one-time surge they experienced after their franchise-best 2008 season has long since dissipated. This is each MLB team’s best season in franchise history.
To determine the teams losing the most fans, 24/7 Wall St. reviewed 10-year percentage changes in average attendance at regular season home games in the NHL, NBA, MLB, and NFL. Attendance figures are from ESPN and are as of the most recent completed season — the 2018-2019 season for the NHL and NBA, and the 2018 seasons for the NFL and MLB — and the season 10 years prior. We only considered teams that had at least a 10% decline in the average percentage of the stadium that was filled.
To avoid attendance declines based on a reduction in stadium capacity, franchises that built a new facility or moved to a new city in those years were excluded. The average percentage of capacity filled during home games in a season for the NHL, NBA, and NFL also came from ESPN and is as of the most recently completed regular season. In the case of the MLB, average capacity filled is based on the average home game attendance from ESPN and officially listed stadium capacities.
Click here to see sports teams running out of fans.
12. Indianapolis Colts
> Avg. home attendance change 2008-2018: -10.8%
> 2008 avg. home game attendance (pct. capacity): 66,378 (105.4%)
> 2008 record: 12-4
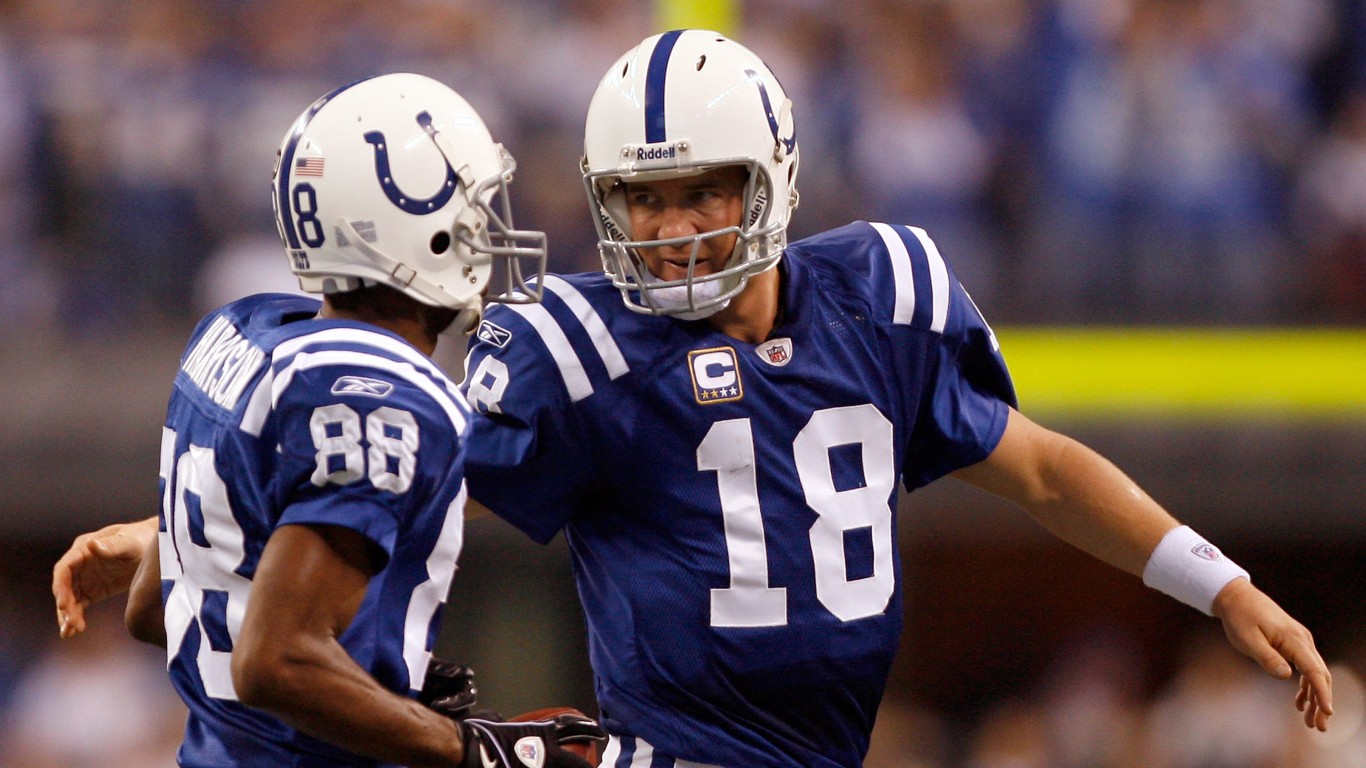
The Indianapolis Colts had a lot going for them in 2008. Peyton Manning was in his prime, the team was in the midst of a nine-year run of consecutive playoff appearances, and it had a new home in Lucas Oil Stadium. An average of 66,378 fans attended each home game that season — 5.4% over the new stadium’s announced capacity.
[in-text-ad]

12. Indianapolis Colts
> Avg. home attendance change 2008-2018: -10.8%
> 2018 avg. home game attendance (pct. capacity): 59,199 (94.0%)
> 2018 record: 10-6
In 2017, the Colts struggled. Franchise QB Andrew Luck was sidelined all season with a shoulder injury and the team went 4-12, missing the playoffs for the third straight season. This seems to have caused Colts fans to lose interest in their team, as 2018 was the first season in Lucas Oil Stadium history that average attendance did not exceed 100% of the announced capacity. Just 94.0% of seats were filled in 2018, 23rd among all NFL teams. But fans may be back in droves after a revamped Indy roster posted a 10-6 record in 2018 and made the playoffs for the first time after a three-season drought.

11. Carolina Hurricanes
> Avg. home attendance change 2008-2018: -13.6%
> 2008-2009 avg. home game attendance (pct. capacity): 16,572 (88.5%)
> 2008-2009 record: 45-30-7
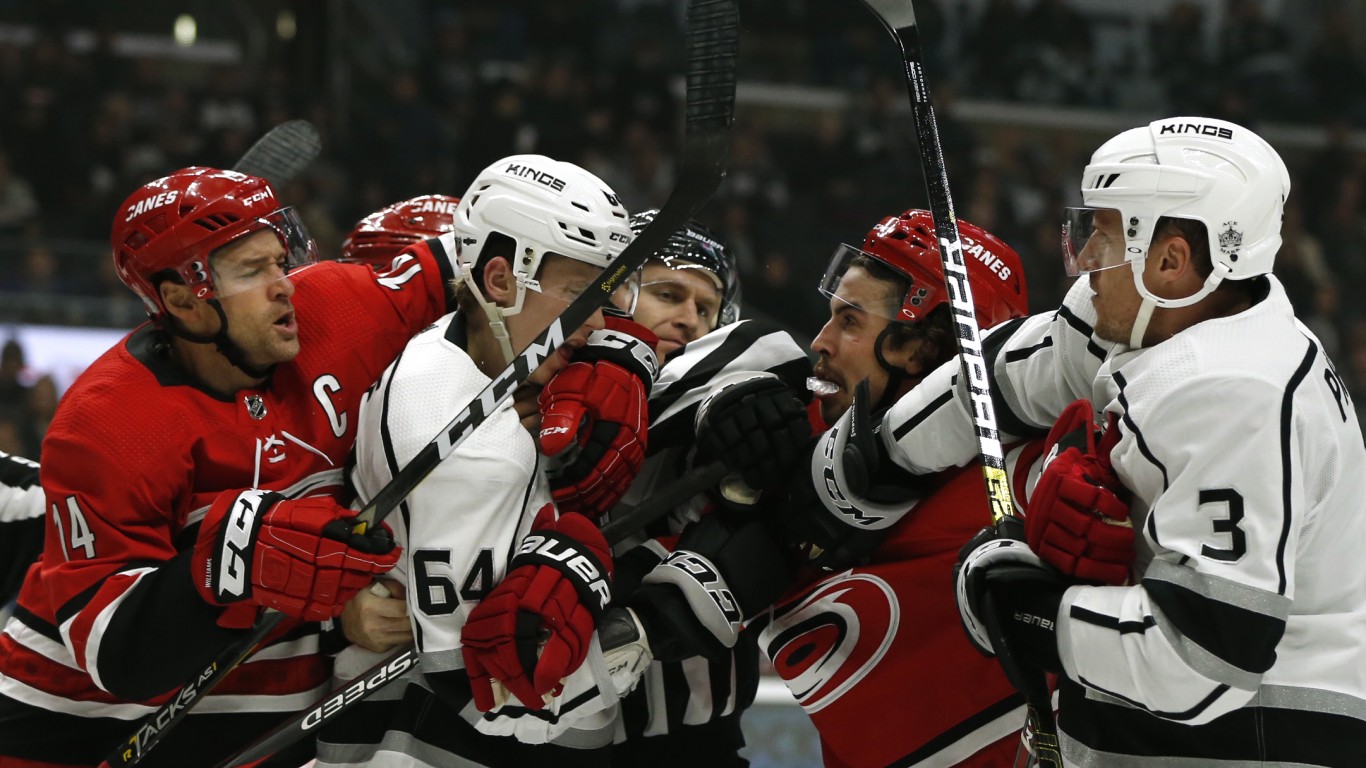
In the 2008-2009 NHL season, hockey teams had no problem packing their stadiums, with most franchises filling over 95% of their stadiums for home games on average. But Raleigh, North Carolina, is not known as a hockey city, and only 88.5% of seats were filled for Hurricanes games that season — even though the team played well all season and made the Eastern Conference Finals.
11. Carolina Hurricanes
> Avg. home attendance change 2008-2018: -13.6%
> 2018-2019 avg. home game attendance (pct. capacity): 14,322 (76.7%)
> 2018-2019 record: 46-29-7
The 2008-2009 NHL season would prove to be the last time the Hurricanes made the NHL playoffs for a decade. The team’s run of futility ended in 2019, when it captured a wild card spot. A decade of losing hockey can drive fans away, and Carolina’s average attendance of 14,322 at home games was also one of the lowest in the NHL — more than 2,000 fewer fans per game on average compared with 10 years prior. The Hurricanes ranked next-to-last in capacity filled in the 2018-2019 season, with an average of 76.7% of seats filled for home games.
[in-text-ad-2]
10. Tampa Bay Buccaneers
> Avg. home attendance change 2008-2018: -15.7%
> 2008 avg. home game attendance (pct. capacity): 64,511 (98.3%)
> 2008 record: 9-7
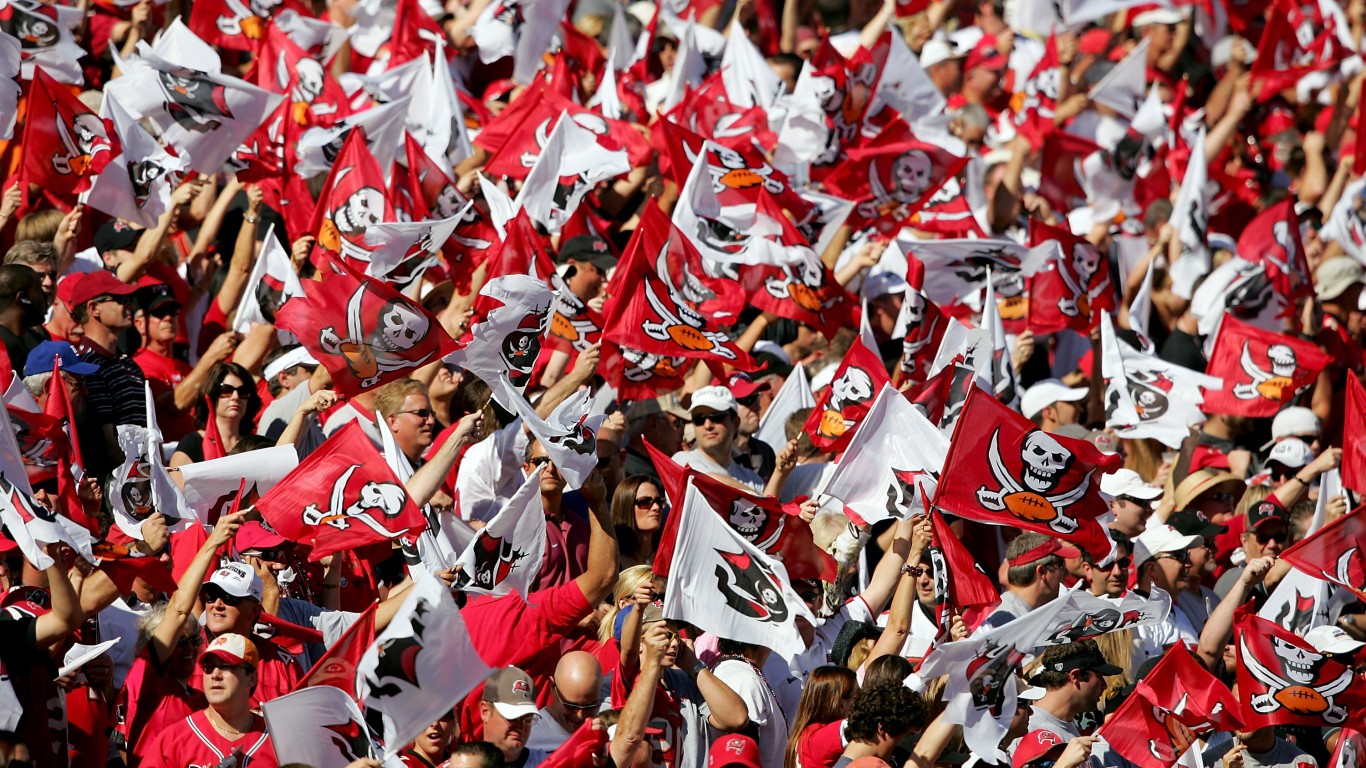
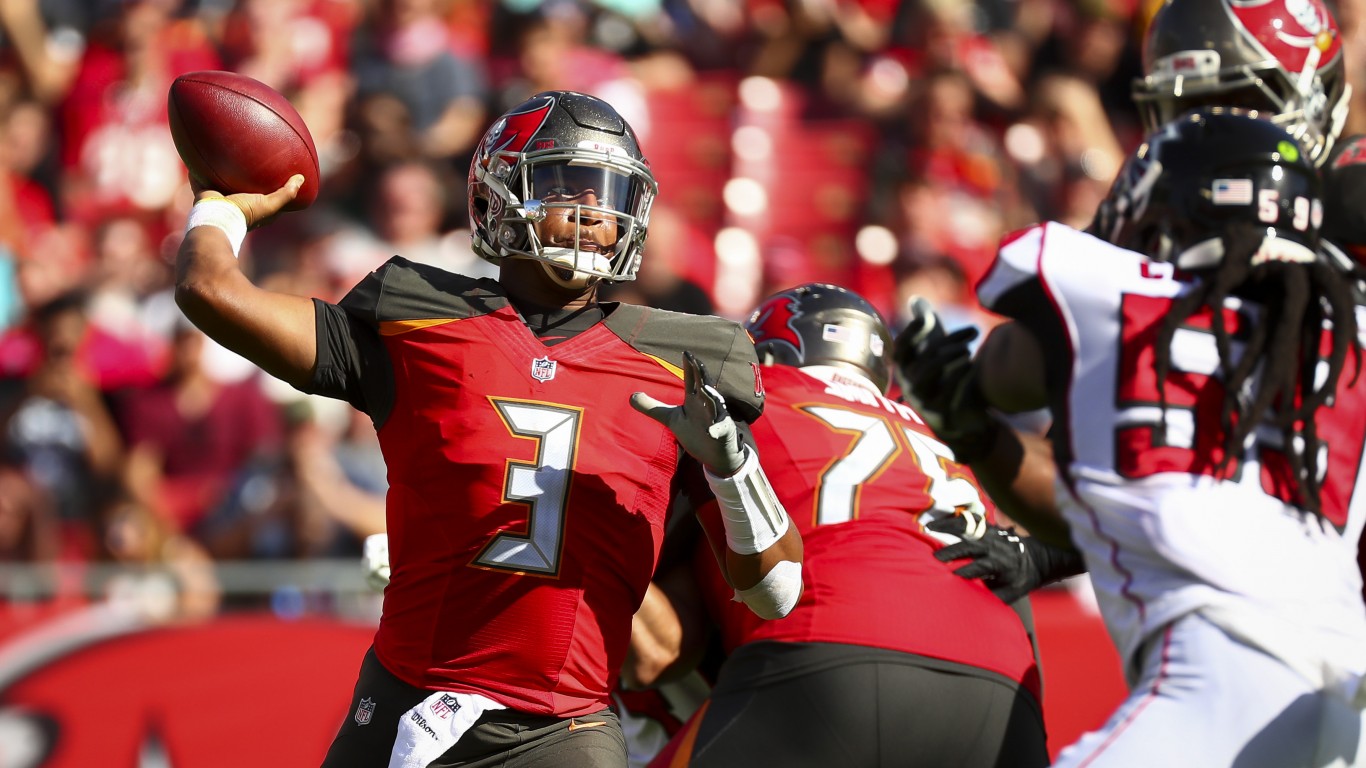
Hopes were high for the Tampa Bay Buccaneers going into the 2008 season: head coach Jon Gruden led the team to a 9-7 record and a trip to the playoffs the year prior. Fans packed Raymond James Stadium nearly to capacity for every game, but they were left disappointed when the team lost its last four games of the season to go 9-7 again, this time missing the playoffs. Gruden was fired, and the team has struggled ever since.
10. Tampa Bay Buccaneers
> Avg. home attendance change 2008-2018: -15.7%
> 2018 avg. home game attendance (pct. capacity): 54,356 (82.8%)
> 2018 record: 5-11
In 2018, the Tampa Bay Buccaneers were one of just four teams that failed to fill at least 90% of their home stadium on average. A string of disappointing coaches and quarterbacks have left the Bucs without a playoff appearance since 2007. Fans are losing interest — total attendance has dropped by more than 10,000 people per game in the last decade. Former Cardinals coach Bruce Arians is now tasked with righting the Buccaneers’ ship.

9. Phoenix Suns
> Avg. home attendance change 2008-2018: -17.0%
> 2008-2009 avg. home game attendance (pct. capacity): 18,422 (100.0%)
> 2008-2009 record: 46-36
The 2008-2009 Phoenix Suns marked the end of an era. In the previous four seasons, two-time MVP Steve Nash led the “Seven Seconds or Less” Suns, a team that played fast and scored in bunches. But after the Suns lost in the first round of the 2007-2008 playoffs, coach Mike D’Antoni left for the New York Knicks. Still, the core of the team was the same, and fans packed the US Airways Center to capacity to see the Suns lead the NBA with 109.4 points per game.
[in-text-ad]

9. Phoenix Suns
> Avg. home attendance change 2008-2018: -17.0%
> 2018-2019 avg. home game attendance (pct. capacity): 15,293 (83.0%)
> 2018-2019 record: 19-63
After years of futility, the Phoenix Suns had the second worst average home attendance in the 2018-2019 NBA season, with just 15,293 fans in attendance per game. Even DeAndre Ayton, the top overall pick in the 2018 draft, failed to draw fans to games. This is understandable, as the Suns posted an abysmal 19-63 record in the 2018-2019 season, their ninth straight season without a playoff berth.

8. Cincinnati Reds
> Avg. home attendance change 2008-2018: -20.9%
> 2008 avg. home game attendance (pct. capacity): 25,415 (60.4%)
> 2008 record: 74-88
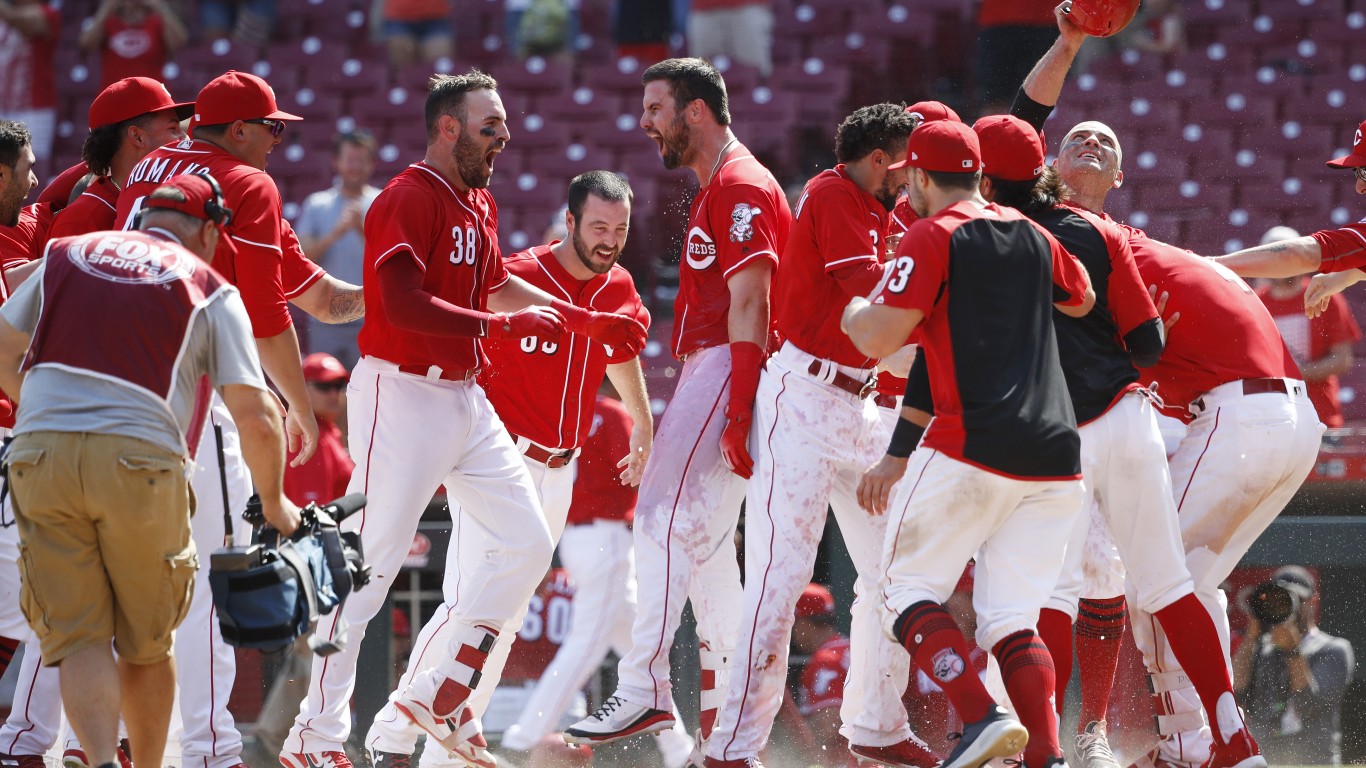
Even as they entered a rebuilding phase in 2008, the Cincinnati Reds managed to fill over 60% of seats for their home games. More than 25,000 fans, on average, showed up for Reds games — one of the lower averages in the MLB that season, but not bad considering the Reds had not made the playoffs in over a decade.
8. Cincinnati Reds
> Avg. home attendance change 2008-2018: -20.9%
> 2018 avg. home game attendance (pct. capacity): 20,115 (47.5%)
> 2018 record: 67-95
The Cincinnati Reds have been steadily losing fans since 2013, the last time the team posted a winning record or made the playoffs. That season, Cincy averaged over 31,000 fans per game. In 2018, the Reds barely averaged over 20,000. Cincinnati now has the dubious distinction of being one of just five teams that failed failed to average a half-full stadium in the 2018 season. The Reds hosted a total of 1.6 million fans in 2018, the franchise’s lowest total since 1984.
[in-text-ad-2]
7. Cincinnati Bengals
> Avg. home attendance change 2008-2018: -21.4%
> 2008 avg. home game attendance (pct. capacity): 64,582 (98.6%)
> 2008 record: 4-11-1
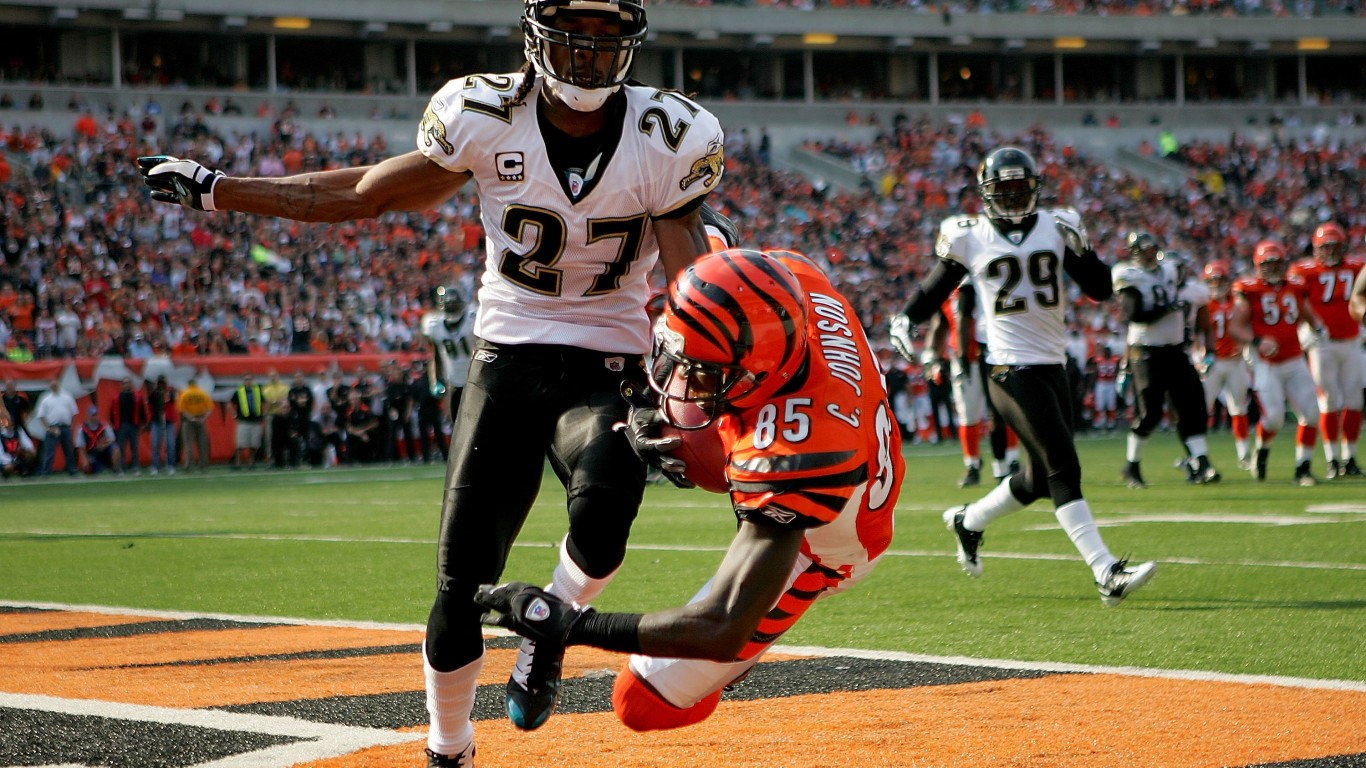
Cincinnati Bengals home games were almost completely full, on average, in 2008, even though the team won only four games all season after QB Carson Palmer missed most of the year with an elbow issue. Bengals fans regularly sold out Paul Brown Stadium at the time, thanks to Palmer and head coach Marvin Lewis, who, in 2005, brought the Bengals their first playoff appearance in 15 years.

7. Cincinnati Bengals
> Avg. home attendance change 2008-2018: -21.4%
> 2018 avg. home game attendance (pct. capacity): 50,753 (77.5%)
> 2018 record: 6-10
Other than the Los Angeles Chargers, who played in the tiny StubHub Center, no team averaged fewer fans than the Cincinnati Bengals during the 2018 NFL season. The Bengals’ stadium was just 77.5% full on average for home games, the third lowest capacity in the NFL. Cincy posted a 6-10 record, dead last in the AFC North. Cincinnati’s attendance has been steadily declining since it last made the playoffs in 2015. The team is still seeking its first playoff win since 1990.
6. Ottawa Senators
> Avg. home attendance change 2008-2018: -23.2%
> 2008-2009 avg. home game attendance (pct. capacity): 18,949 (105.0%)
> 2008-2009 record: 36-35-11
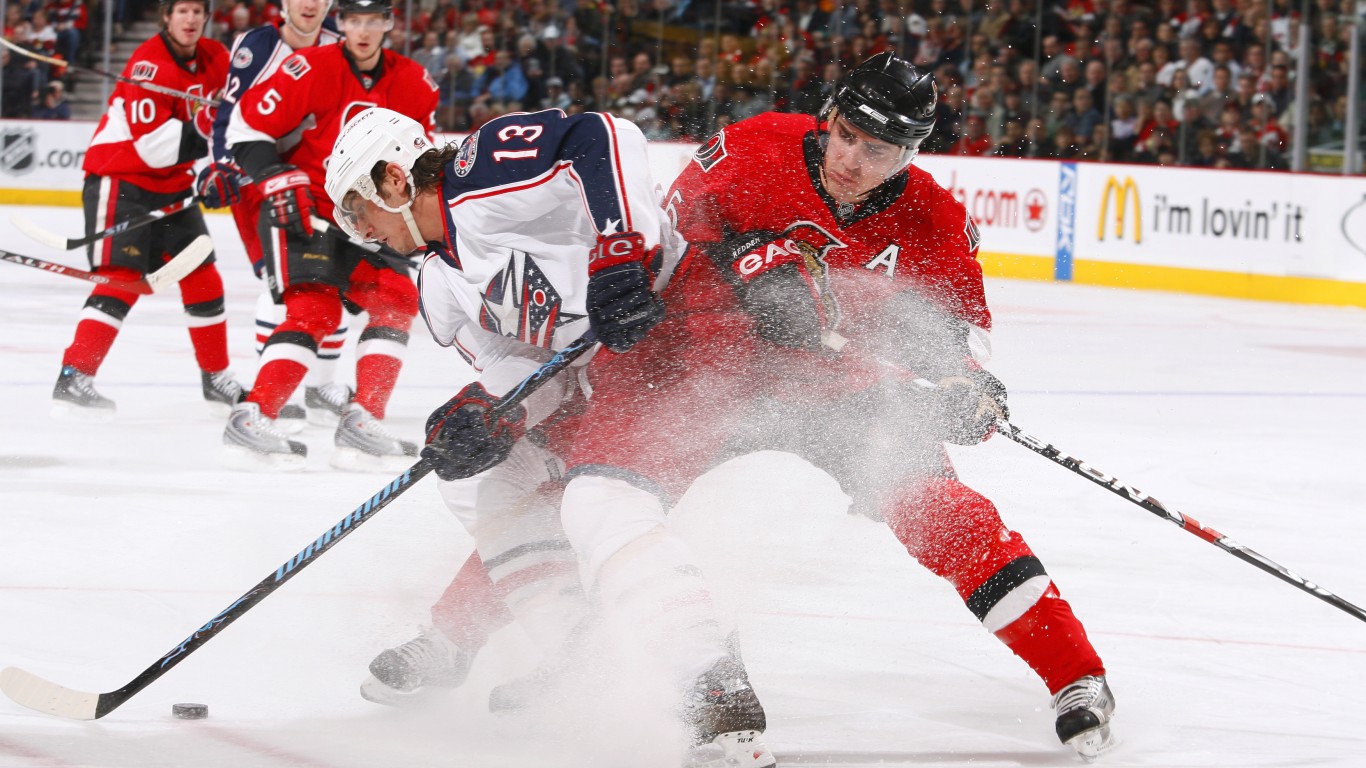
Ottawa Senators fans had many reasons to be optimistic heading into the 2008-2009 season — the franchise had made the playoffs each of the previous 11 seasons. Nearly 19,000 fans came to watch Senators home games, on average, beyond the capacity of Scotiabank Place, Ottawa’s arena at the time. Despite missing the playoffs that season, Ottawa ranked among the top 10 franchises in terms of average attendance and average capacity filled.
[in-text-ad]

6. Ottawa Senators
> Avg. home attendance change 2008-2018: -23.2%
> 2018-2019 avg. home game attendance (pct. capacity): 14,553 (76.0%)
> 2018-2019 record: 29-47-6
The 2018-2019 season gave Senators fans very little to cheer for. With just 64 points, the team finished dead last in the NHL by a wide margin. The Senators missed the playoffs for a second consecutive season, and attendance has slipped to around 14,500 fans per game. Ottawa’s arena was just 76% full for the average game that season, also dead last in the NHL.
5. Washington Redskins
> Avg. home attendance change 2008-2018: -31.1%
> 2008 avg. home game attendance (pct. capacity): 88,604 (96.6%)
> 2008 record: 8-8
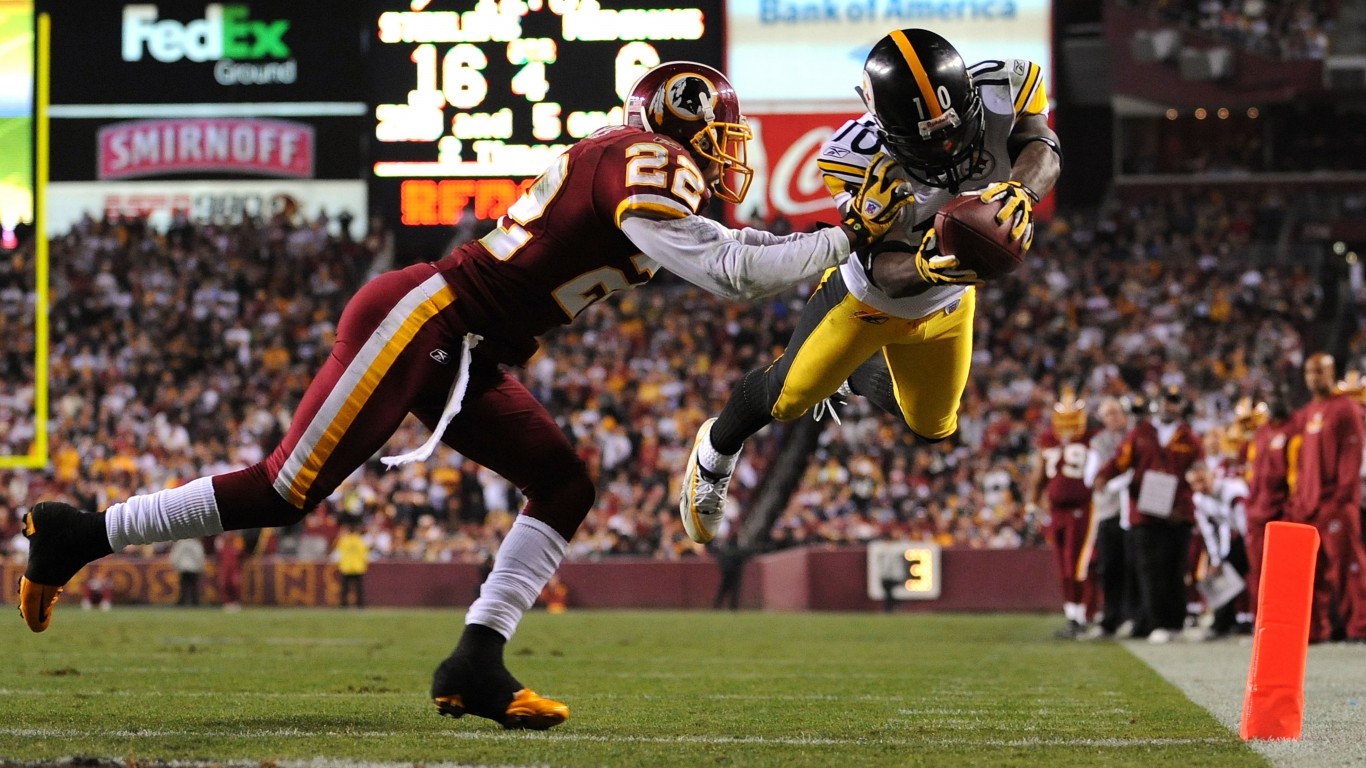
From 2006 to 2008, the Washington Redskins led all NFL teams in average attendance, with more than 87,000 fans per game. No other team had more than 80,000 attendees per game during those seasons. FedEx Field was regularly packed to and beyond capacity as the team made the playoffs in 2005 and 2007.
5. Washington Redskins
> Avg. home attendance change 2008-2018: -31.1%
> 2018 avg. home game attendance (pct. capacity): 61,028 (74.4%)
> 2018 record: 7-9
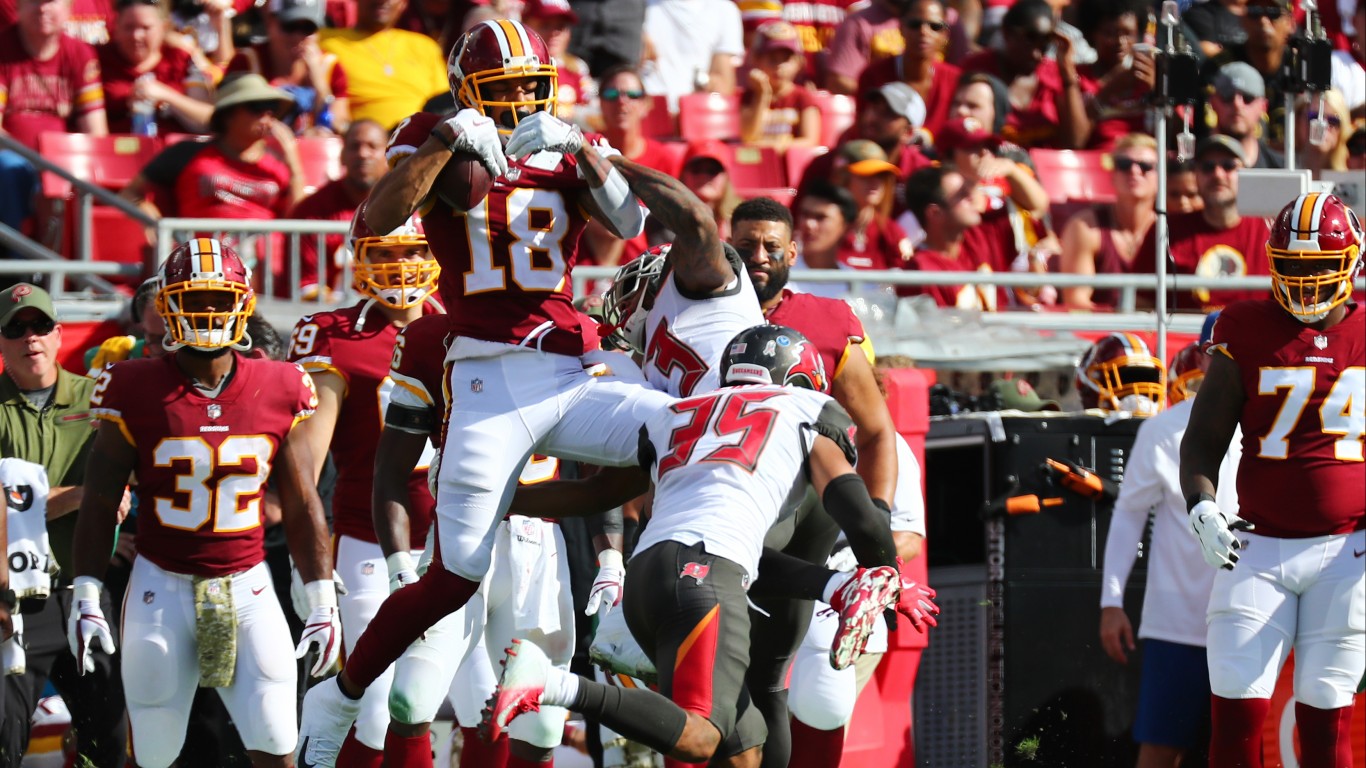
Washington was the only team that failed to fill at least three-quarters of seats in its stadium in the 2018 season, losing nearly a third of its fans over the past 10 years. The Redskins have not won a playoff game since the 2005 season, and they got blown out in their only three postseason appearances since.
[in-text-ad-2]

4. Chicago White Sox
> Avg. home attendance change 2008-2018: -34.9%
> 2008 avg. home game attendance (pct. capacity): 30,877 (76.0%)
> 2008 record: 89-74
In 2008, White Sox fans were riding high. Just a few seasons removed from their first World Series win since 1917, the team was still playing well under manager Ozzie Guillen. That season, the South Siders won the AL Central and drew more than 30,000 fans per game, filling an average of 76% of their stadium, one of the higher rates in the majors.

4. Chicago White Sox
> Avg. home attendance change 2008-2018: -34.9%
> 2018 avg. home game attendance (pct. capacity): 20,110 (50.1%)
> 2018 record: 62-100
Little has gone right for the White Sox since 2008. Chicago has steadily lost fans as the team has not made the postseason since. The White Sox barely filled half of their available seats in 2018 — just over 20,000 fans per game. This is not surprising, as the White Sox had one of their worst seasons ever, losing 100 games for the first time since 1970.
3. Philadelphia Phillies
> Avg. home attendance change 2008-2018: -35.3%
> 2008 avg. home game attendance (pct. capacity): 42,254 (97.1%)
> 2008 record: 92-70
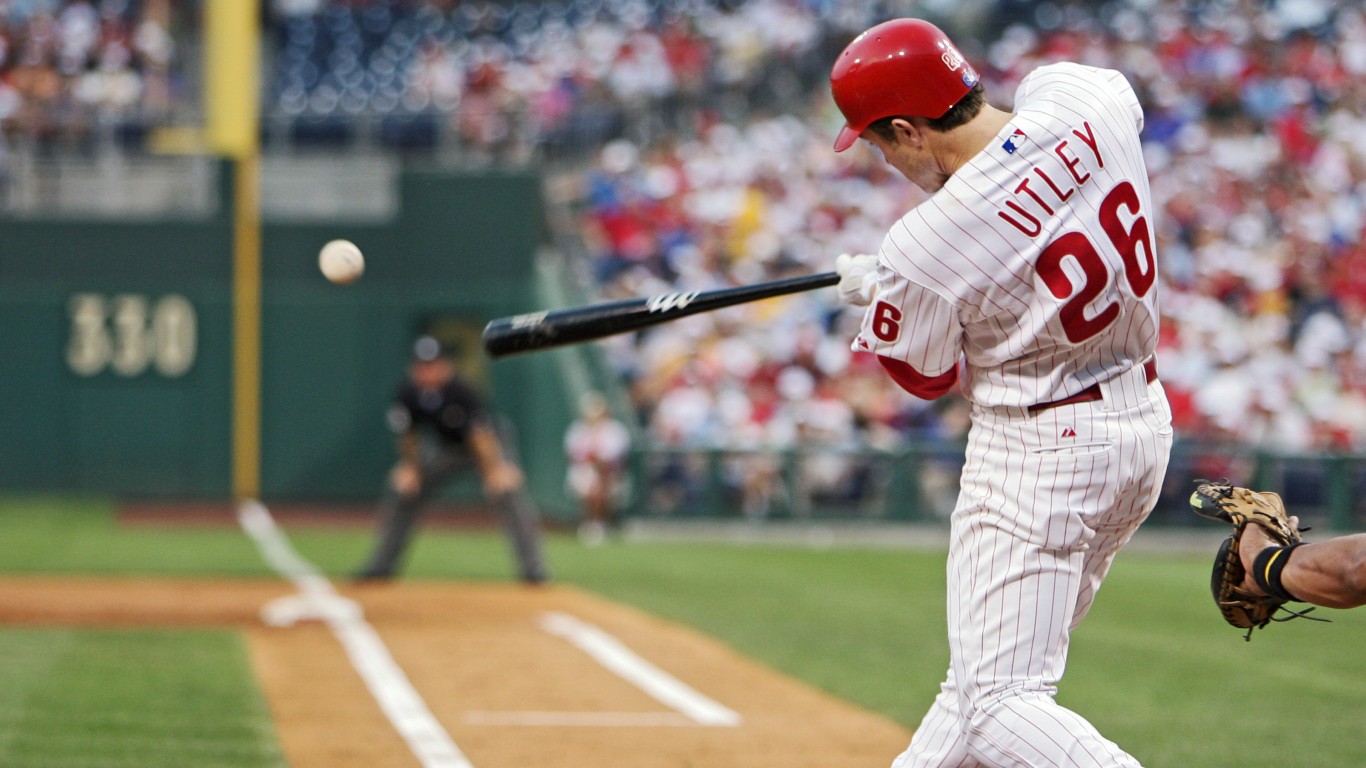
Phillies fans were excited ahead of the 2008 MLB season as the team finally broke through and ended its 13-year playoff drought the year prior. In 2008, Philadelphia won what would be its second of five straight NL East titles on its way to a World Series championship. More than 97% of seats at Citizens Bank Park were occupied that season, accounting for over 42,000 fans per game — both figures ranked among the top five in baseball that year.
[in-text-ad]

3. Philadelphia Phillies
> Avg. home attendance change 2008-2018: -35.3%
> 2018 avg. home game attendance (pct. capacity): 27,318 (63.4%)
> 2018 record: 80-82
This Phillies led the majors in total attendance from 2010 to 2012, but it can be tough to maintain enthusiasm for a team that has not made the playoffs since 2011. In 2018, an average of 27,318 fans per game came to Citizens Bank Park, near the middle of MLB attendance. Now that the team is playing better with the acquisition of superstar Bryce Harper, Philly fans are already returning to the ballpark in droves in 2019.
2. Tampa Bay Rays
> Avg. home attendance change 2008-2018: -35.9%
> 2008 avg. home game attendance (pct. capacity): 22,259 (52.8%)
> 2008 record: 97-65
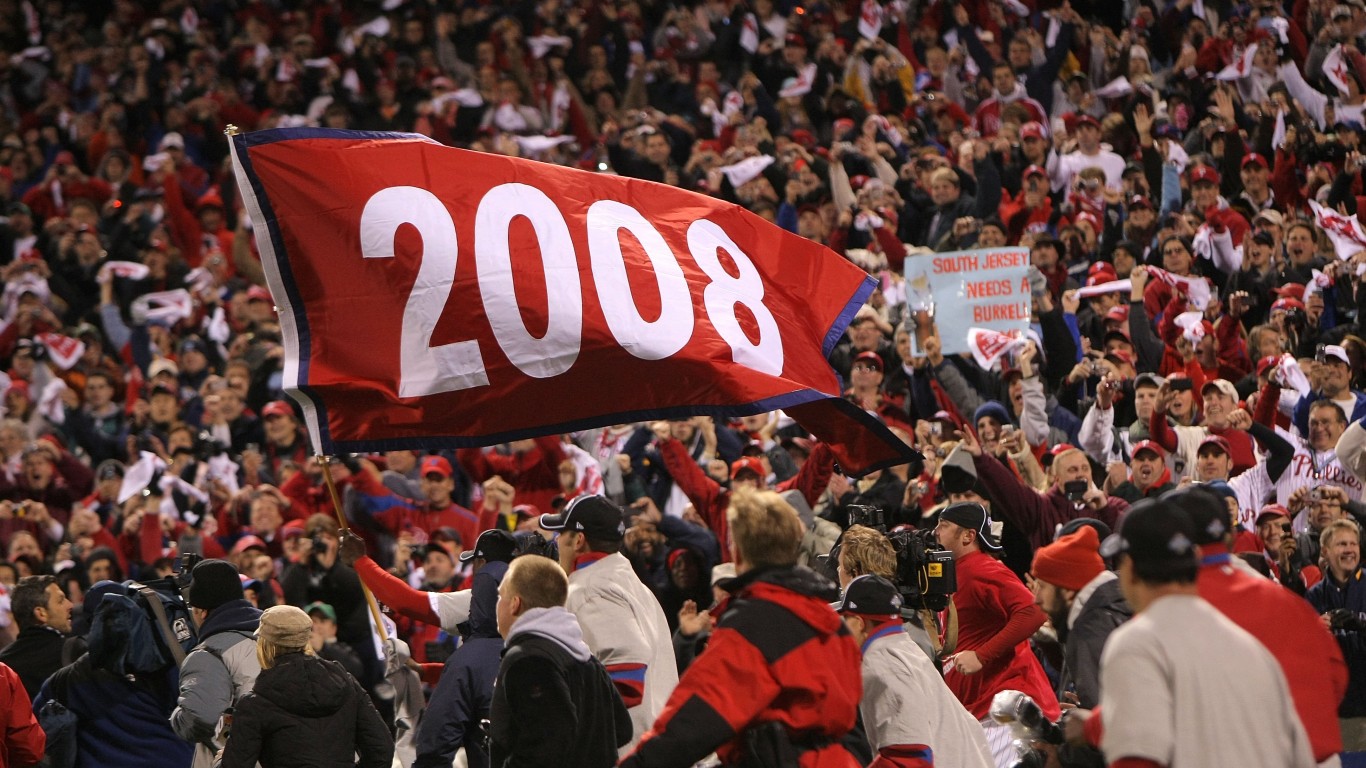
Even when the Tampa Bay Rays are playing well, the team’s stadium is rarely full. In 2008, the Rays won 97 games and made the postseason for the first time in team history, eventually losing in the World Series. Fans didn’t seem to care, as the team’s average home attendance was just over 22,000, or 52.8% of Tropicana Field’s capacity.
2. Tampa Bay Rays
> Avg. home attendance change 2008-2018: -35.9%
> 2018 avg. home game attendance (pct. capacity): 14,258 (41.8%)
> 2018 record: 90-72
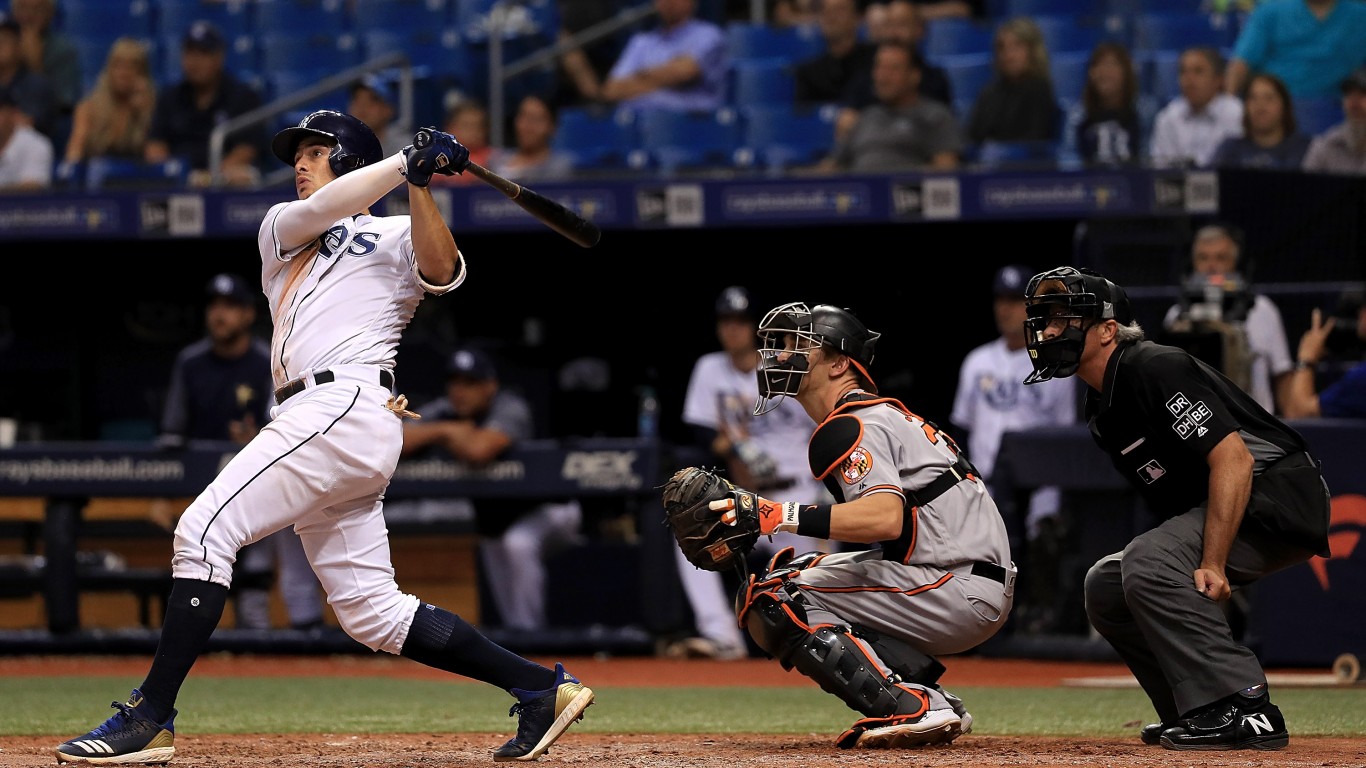
A decade after their first postseason run, the Rays are still a winning team, despite sharing a division with the high-powered Yankees and Red Sox, and the fans are still not showing up. Despite being 18 games over .500 in 2018, average attendance for Rays home games fell to 14,258 people per game, or just 41.8% of the Trop’s capacity. Most teams are able to attract more than 2 million fans to their games over a season. The Rays haven’t hit that mark since their inaugural season of 1998.
[in-text-ad-2]
1. Detroit Tigers
> Avg. home attendance change 2008-2018: -41.3%
> 2008 avg. home game attendance (pct. capacity): 39,538 (98.6%)
> 2008 record: 74-88
Following the team’s 2006 World Series appearance, in which they lost to the St. Louis Cardinals, attendance at Detroit Tigers had been increasing. Though the team had a losing record, Comerica Park was typically close to full in 2008, with nearly 40,000 fans coming to each game.

1. Detroit Tigers
> Avg. home attendance change 2008-2018: -41.3%
> 2018 avg. home game attendance (pct. capacity): 23,212 (56.3%)
> 2018 record: 64-98
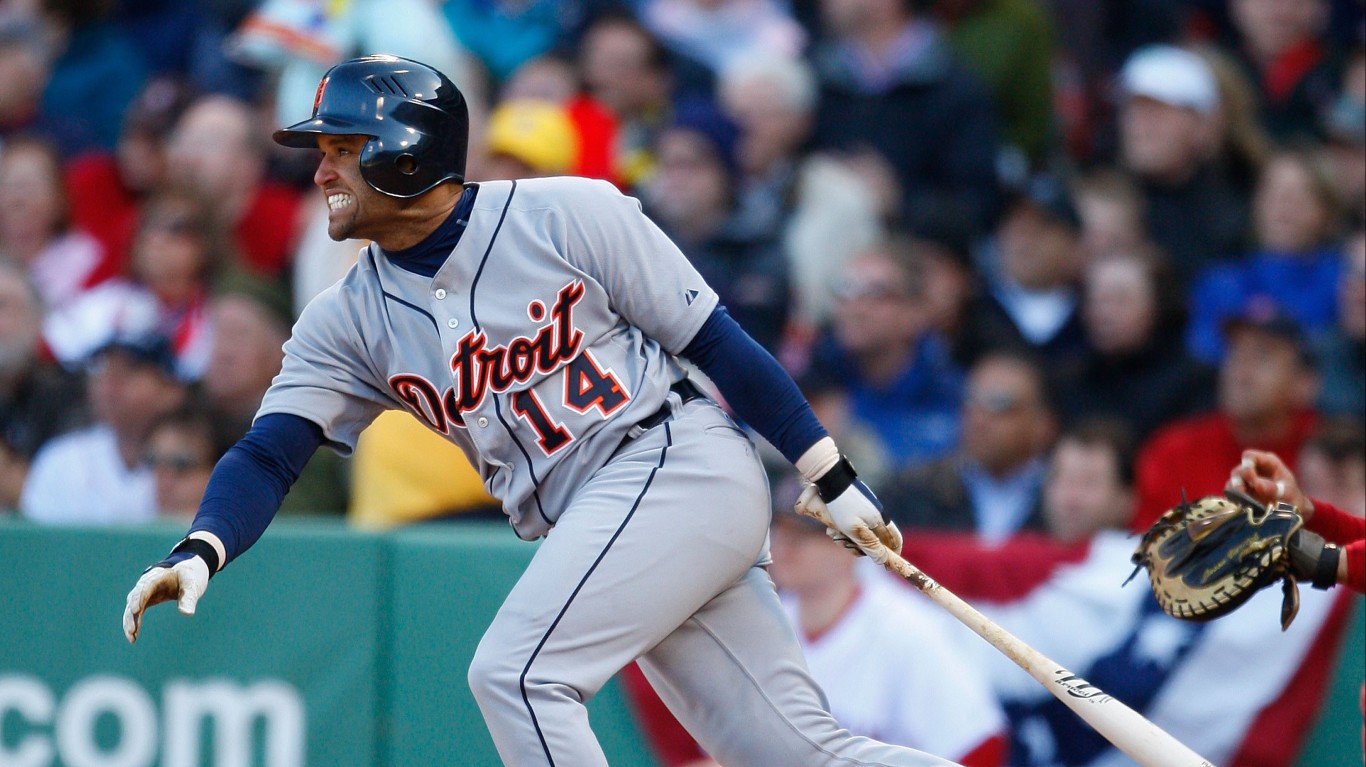
A four-season playoff drought may have, in part, spurred the mass exodus of Tigers fans. The team managed a string of postseason appearances in the early 2010s, but it has struggled since — and attendance suffered along with the team’s performance. After peaking in 2013, attendance at Tigers games has consistently fallen, reaching 23,212 per game in 2018. Though this may also have something to do with the fact that Detroit is quickly losing residents, as once-available manufacturing jobs are gone. It may be difficult to convince some of the remaining fans to come to Tigers games if the team is unable to put together a winning season.
Cash Back Credit Cards Have Never Been This Good
Credit card companies are at war, handing out free rewards and benefits to win the best customers. A good cash back card can be worth thousands of dollars a year in free money, not to mention other perks like travel, insurance, and access to fancy lounges. See our top picks for the best credit cards today. You won’t want to miss some of these offers.
Flywheel Publishing has partnered with CardRatings for our coverage of credit card products. Flywheel Publishing and CardRatings may receive a commission from card issuers.
Thank you for reading! Have some feedback for us?
Contact the 24/7 Wall St. editorial team.
 24/7 Wall St.
 24/7 Wall St.
 24/7 Wall St.
