
Do you think you live in a healthy community? Midwestern and Western residents who answer in the affirmative have a better chance of being correct than those who live in the East or South. Of the 25 healthiest cities reported here, more than half — 13 — are in the Midwest, with six of the communities in or adjacent to Minnesota. Nine more are in the West, with Utah and California each boasting three metropolitan areas ranking high on this list. Only three cities in the East broke into the top 25, and none from the South.
The average life expectancy in the United States is 78.6 years, according to the Centers for Disease Control and Prevention. But life expectancy varies from state to state and even from city to city. Apart from environmental and socioeconomic factors that may be outside of our control, there are many factors that can contribute to healthier living: don’t smoke; approach life with moderation when it comes to eating and drinking; exercise and keep moving.
But what magical combination adds up to a healthy community? When measuring health across a community, it is important to consider all the factors that can contribute to overall health: actual health outcomes, overall health factors such as behaviors and clinical care, social and economic factors, and physical environment measures.
Health outcomes can be measured by premature mortality (the number of deaths among residents under age 75 per 100,000 population), among other measures. Healthy behaviors can be measured by the percentage of the population that remains inactive during leisure time, among other measures. Access to health care includes concentration of medical professionals and the share of people who lack health insurance. And environmental measures can include commute times, clean air and more. Finally, socioeconomic measures can include education levels and income.
Many predictors of life-long health and longevity are rooted in our early years. Low birthweight, a mother’s age at birth, childhood poverty, and growing up in a single-parent household can all take a lasting toll.
Health outcomes are the result of several factors — including behavior, quality of care, socioeconomic factors, genetics. Americans’ overall health varies considerably by geography.
Click here to see the 25 healthiest cities in America
Click here to read our methodology
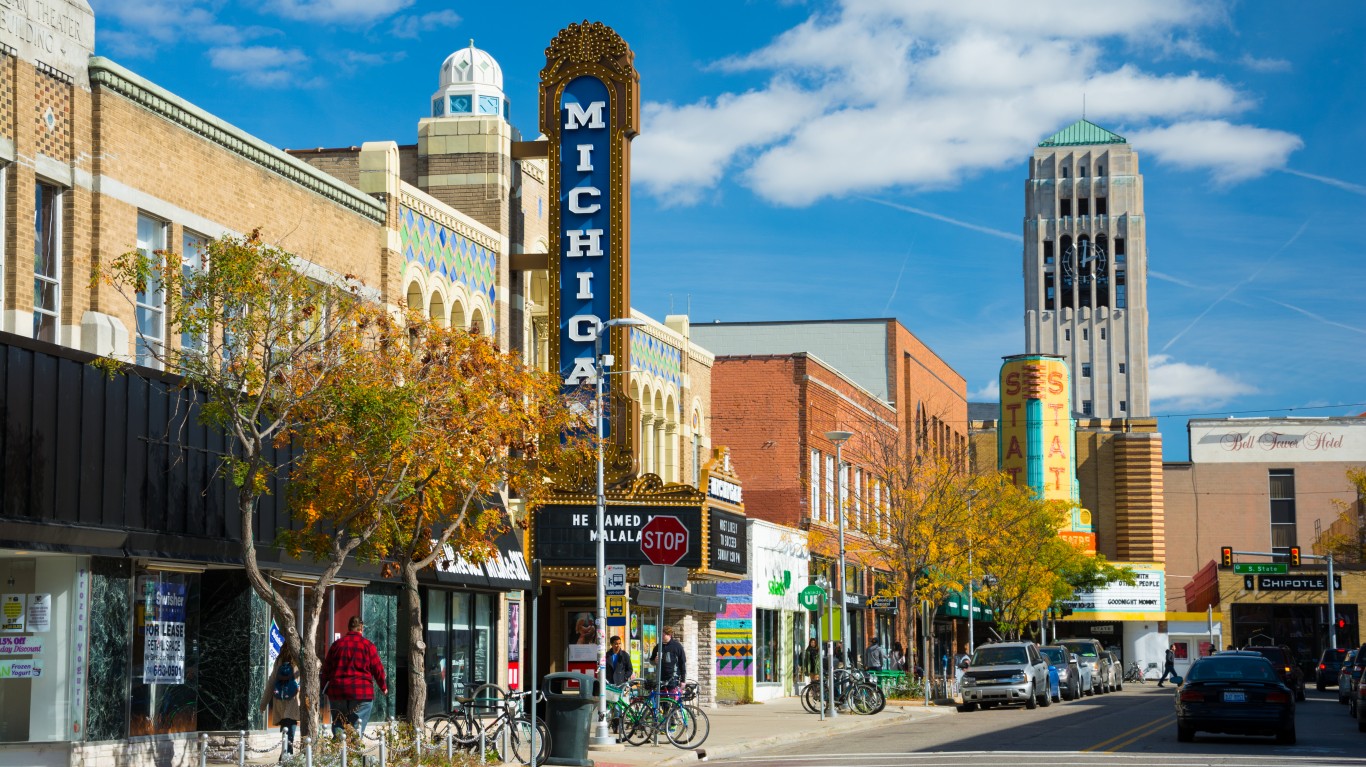
25. Ann Arbor, MI
> Premature death rate: 274 per 100,000 people
> Adult obesity rate: 23.8%
> Uninsured rate: 2.7%
> Median household income: $70,286
Ann Arbor boasts the third lowest uninsured rate of any U.S. metro area. Just 2.7% of the population lacks health insurance, well below the national uninsured rate of 8.7%. The area’s teen birth rate of 7.4 per 1,000 females ages 15-19 is less than a third of the national figure of 25 per 1,000.
Only 14.5% of adults in the city report no leisure-time physical activity — compared to the national average of 22% — and 91.2% of the population has access to places for physical activity like parks and gyms. This could partly help explain the city’s relatively low adult obesity rate of 23.8%, which is well below the national rate of 29.0%.
[in-text-ad]

24. Ogden-Clearfield, UT
> Premature death rate: 282 per 100,000 people
> Adult obesity rate: 28.2%
> Uninsured rate: 6.9%
> Median household income: $71,629
The Ogden-Clearfield metropolitan area dropped a couple of notches from its ranking as 22nd healthiest city last year. Nevertheless, good health habits prevail in the city. The adult smoking rate of 8.3% is considerably lower than the national rate of 17.0%, and the excessive drinking of 12.1% is also well below the national rate of 18.0%.
Excessive drinking also plays a smaller role in driving fatalities. Alcohol was involved in only 13.7% of driving deaths, versus 29.0% nationally.

23. Santa Maria-Santa Barbara, CA
> Premature death rate: 271 per 100,000 people
> Adult obesity rate: 21.0%
> Uninsured rate: 9.3%
> Median household income: $71,106
The obesity rate in Santa Maria-Santa Barbara is among the lowest nationwide. At 21%. it is 8 percentage points below the national obesity rate of 29%.
Somewhat surprisingly, 17.6% of area residents report being in fair or poor health, the largest share among the 25 cities listed here and above the national average of 16.0%. Additionally, a relatively high 9.3% of people do not have health insurance in this coastal California metropolitan area, the highest uninsured rate on this list and above the national rate of 8.7%.

22. Minneapolis-St. Paul-Bloomington, MN-WI
> Premature death rate: 291 per 100,000 people
> Adult obesity rate: 25.8%
> Uninsured rate: 4.2%
> Median household income: $76,856
Adults in the Twin Cities report the second lowest number of physically unhealthy days per month of any city on this list and among the lowest of any metro area nationwide at just 2.7 — a full day below the national average.
Better educated, higher income populations tend to report better health outcomes, and Minneapolis-St. Paul-Bloomington is no exception. At 8.1%, the metropolitan area’s poverty rate is well below the national rate of 13.4%. Similarly, nearly 42% of adults hold a bachelor’s degree or higher compared to 32% of adults nationwide.
[in-text-ad-2]
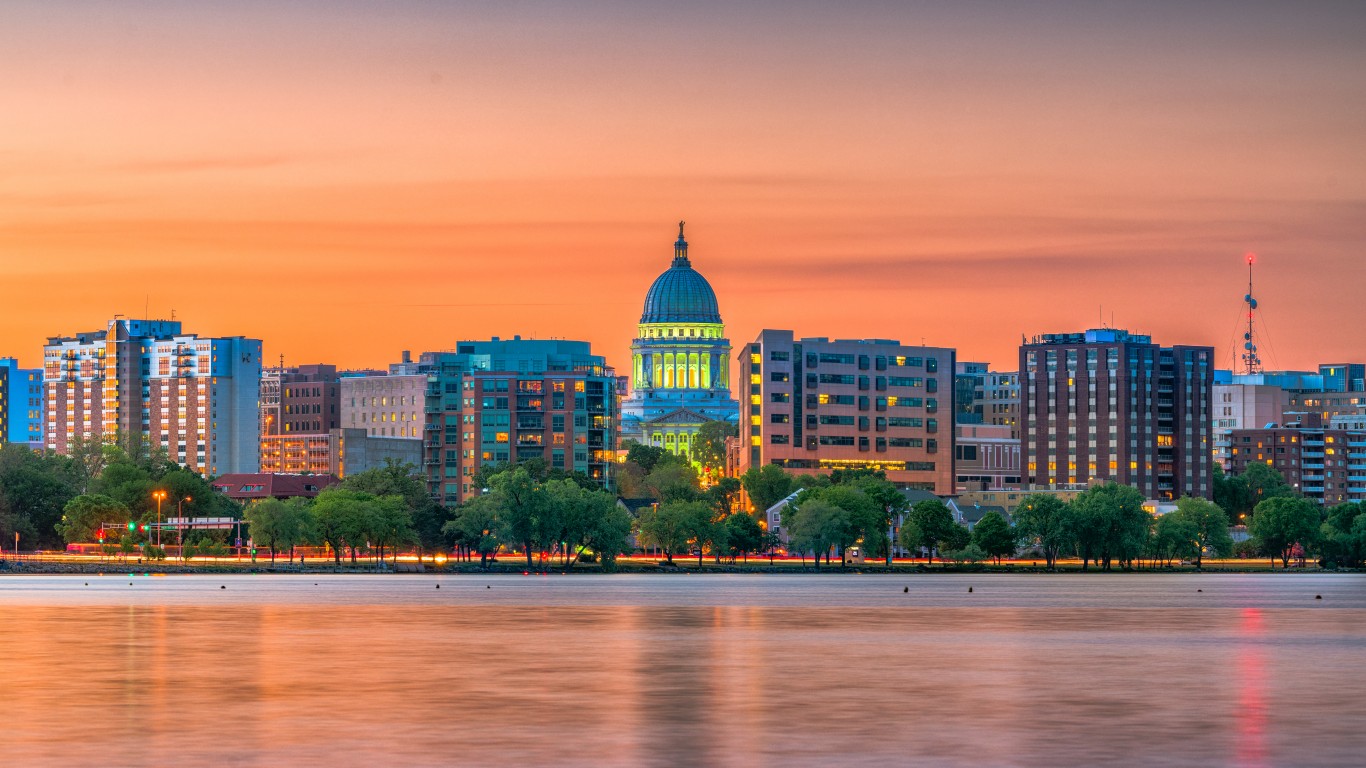
21. Madison, WI
> Premature death rate: 284 per 100,000 people
> Adult obesity rate: 26.1%
> Uninsured rate: 4.2%
> Median household income: $71,301
Madison is among the healthiest cities in the nation. Just 4.2% of area residents lack health insurance, less than half the national uninsured rate of 8.7%. Madison residents also stay active. Only 15.5% of adults report no leisure-time physical activity compared to 22.0% of adults nationwide.
Higher-income Americans can often afford access to better health care and to a greater range of healthy options related to diet and lifestyle. The median annual household income of $71,301 in Madison yields a gross difference of more than $900 per month above the $60,336 national median.
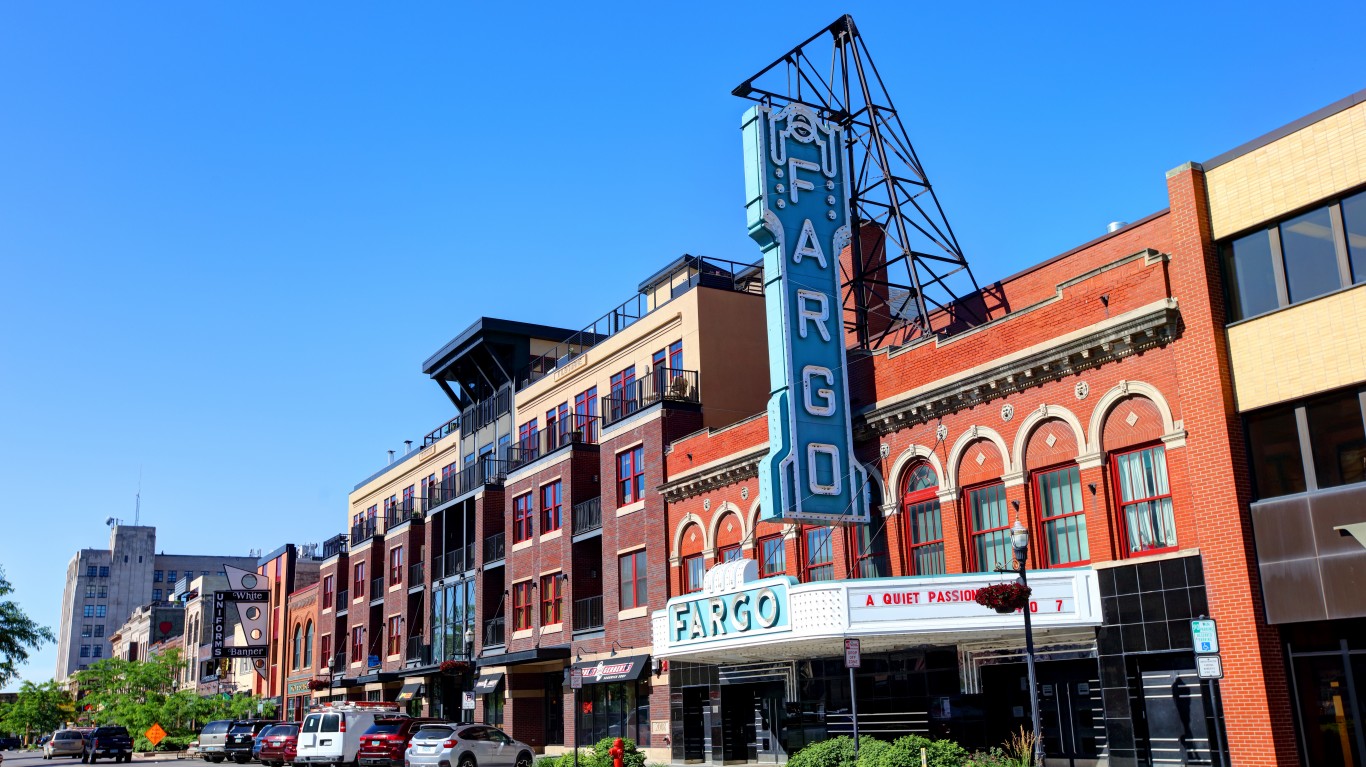
20. Fargo, ND-MN
> Premature death rate: 294 per 100,000 people
> Adult obesity rate: 30.7%
> Uninsured rate: 5.8%
> Median household income: $63,353
In Fargo, the average of just 2.7 physically unhealthy days per month is not only below the national average of 3.7 days, but it is also nearly the lowest nationwide. Fargo’s average number of mentally unhealthy days in the last month among adult residents, at 2.8, is also the second lowest nationwide. Adults in Fargo are also less likely to smoke and more likely to have physically active lifestyles than the typical American adult.
[in-text-ad]

19. Lincoln, NE
> Premature death rate: 302 per 100,000 people
> Adult obesity rate: 27.7%
> Uninsured rate: 6.9%
> Median household income: $60,057
Lincoln has moved up several spots in the healthiest cities ranking since placing in the No. 23 slot last year. One area of improvement is the health insurance coverage for the total population under age 65. Last year, 9% of that demographic in the Nebraska capital had no insurance. This year, just 6.9% are uninsured, which also beats the comparable national uninsured rate of 8.6%.
Adults in Lincoln are less likely to smoke and be obese and more likely to exercise than the typical American adult.

18. Seattle-Tacoma-Bellevue, WA
> Premature death rate: 308 per 100,000 people
> Adult obesity rate: 25.6%
> Uninsured rate: 5.6%
> Median household income: $82,133
With its population tipping the scales at more than 3.8 million, Seattle-Tacoma-Bellevue is the second largest metropolitan area among the 25 healthiest cities and one of the largest nationwide. It is also one of the healthiest. Just 25.6% of area adults are obese compared to 29.0% of adults nationwide. Area residents are also more likely to seek necessary and preventative medical care as just 5.6% of the population is uninsured, well below the 8.7% national uninsured rate.
Higher-income Americans can afford a greater range of healthy options related to diet and lifestyle. The median annual household income of $82,133 in Seattle is higher than in all but seven other metro areas nationwide.
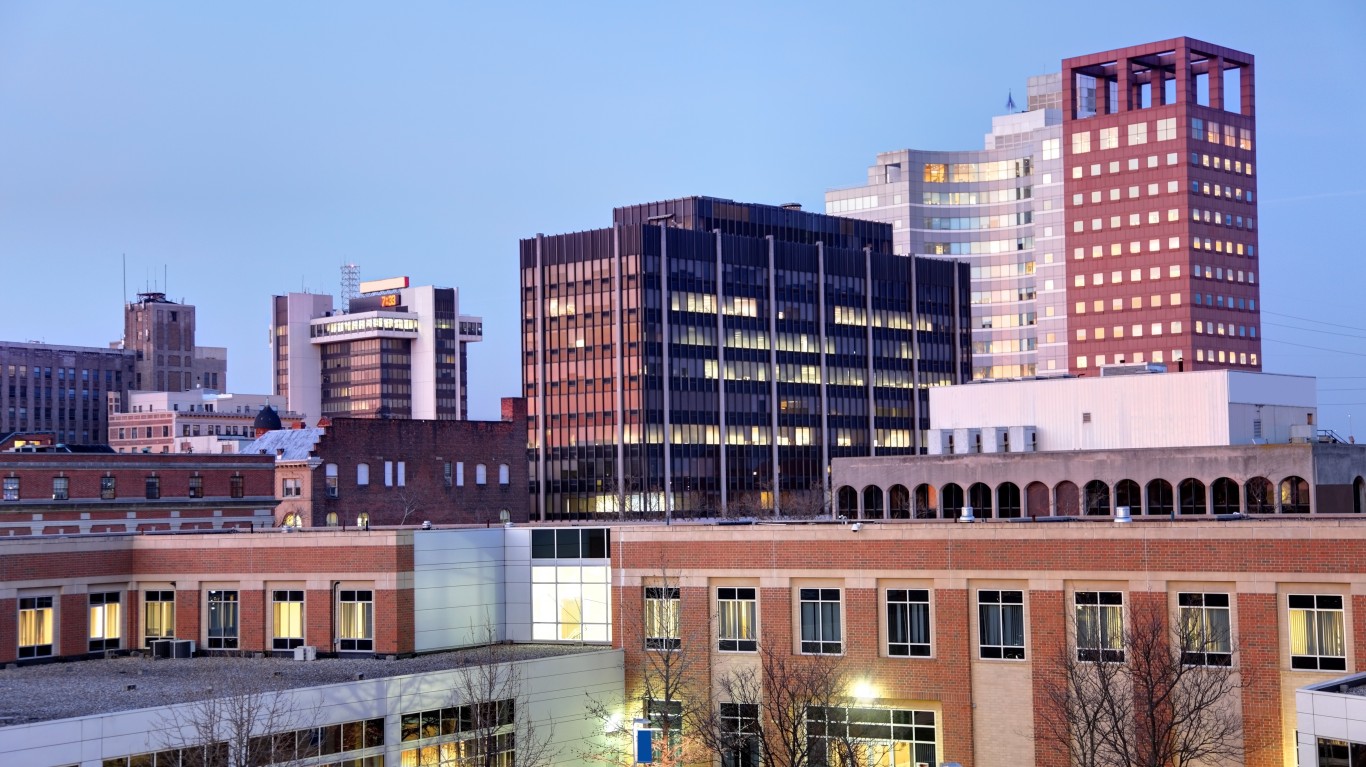
17. Bridgeport-Stamford-Norwalk, CT
> Premature death rate: 266 per 100,000 people
> Adult obesity rate: 21.6%
> Uninsured rate: 9.2%
> Median household income: $91,198
The Bridgeport-Stamford-Norwalk metropolitan area ranks among the healthiest U.S. cities — the premature death rate of 266 deaths before age 75 per 100,000 residents is lower than in all but a dozen other metro areas nationwide. Residents also seem motivated to stay fit as only 17.3% of adults report no leisure-time physical activity versus 22.0% nationwide. Perhaps partly as a result, the city’s adult obesity rate of 21.6% clocks in well below the national figure of 29.0%.
[in-text-ad-2]
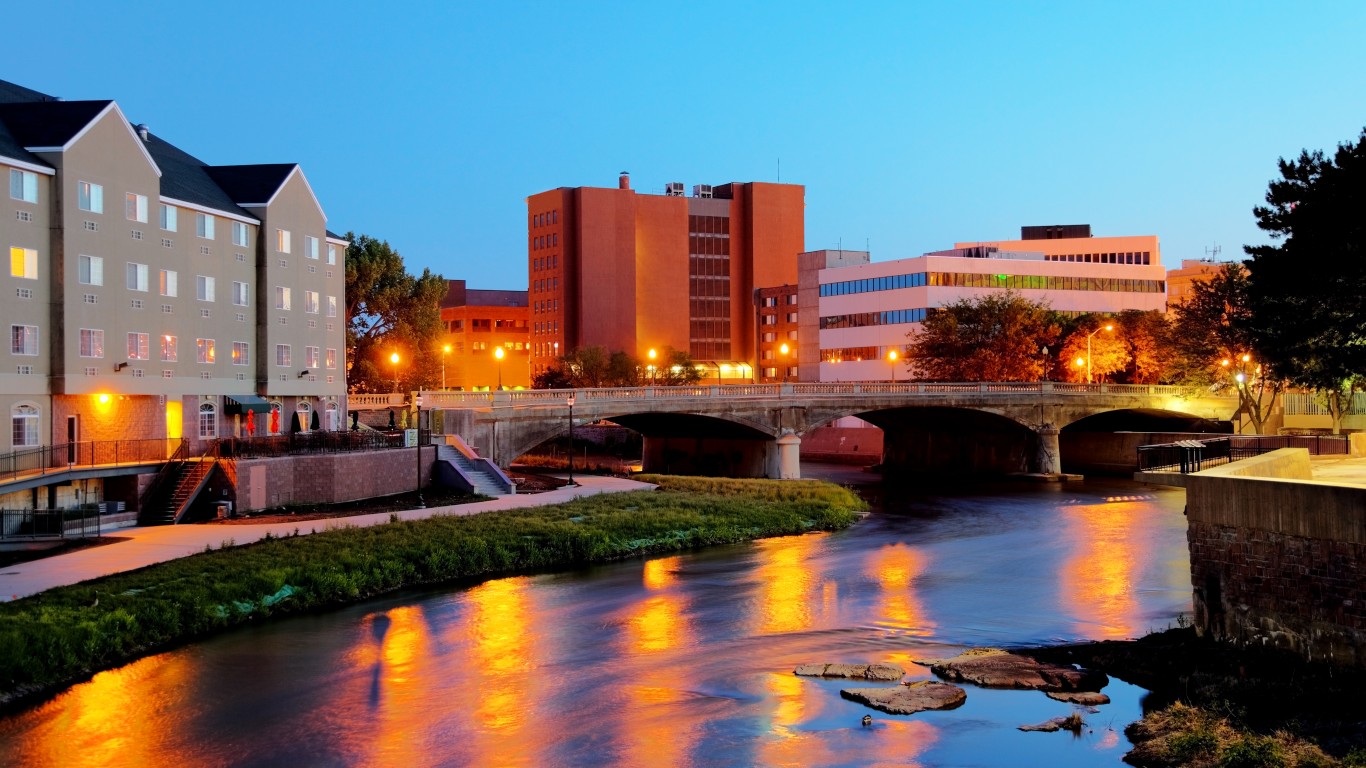
16. Sioux Falls, SD
> Premature death rate: 323 per 100,000 people
> Adult obesity rate: 31.3%
> Uninsured rate: 5.8%
> Median household income: $64,882
Just 10% of adults in the Sioux Falls metro area rate their health poor or fair, the second lowest share of any U.S. metro area and well below the national figure of 16%. Adults also repot an average of just 2.6 mentally unhealthy days in a month, the fewest of any U.S. metro area and more than a day below the national average. Adults in Sioux Falls are also less likely to smoke and more likely to have physically active lifestyles than the typical American adult.

15. Appleton, WI
> Premature death rate: 316 per 100,000 people
> Adult obesity rate: 29.3%
> Uninsured rate: 3.6%
> Median household income: $65,990
Appleton, is not only the 15th healthiest U.S. city, but also one of the best cities for older Americans. For example, over 54% of female Medicare enrollees receive an annual mammogram compared to 41% nationwide and 52% of Medicare enrollees receive a flu shot compared to 45% nationwide. In addition, 91% of area residents have access to places for physical activity compared to 84% nationwide.
Higher-income Americans can afford a greater range of healthy options related to diet and lifestyle. In Appleton, 6.9% of the population lives in poverty, well below the 13.4% national figure.
[in-text-ad]

14. St. Cloud, MN
> Premature death rate: 287 per 100,000 people
> Adult obesity rate: 28.7%
> Uninsured rate: 3.4%
> Median household income: $61,943
St. Cloud is among five metropolitan areas on the list of 25 healthiest cities located either fully or partially in the state of Minnesota. St. Cloud’s adult obesity rate of 28.7% is just below the 29% national average, but city residents are well above average when it comes to staying active. Just 19.2% report no leisure-time physical activity, compared to 22.0% of adults nationwide. The city’s smoking rate of 15.2% is also less than the 17.0% national adult smoking rate.

13. San Francisco-Oakland-Hayward, CA
> Premature death rate: 271 per 100,000 people
> Adult obesity rate: 20.7%
> Uninsured rate: 4.5%
> Median household income: $101,714
The San Francisco metropolitan area slipped from its No. 7 rank in last year’s list, despite a reduction in the uninsured population. Only 4.5% of the under-65 population lacks health insurance this year versus 7.7% last year. Nationwide, 8.7% of the demographic is uninsured.
Higher-income Americans can afford a greater range of healthy options related to diet and lifestyle. The San Francisco metro area’s median annual household income of $101,714 ranks among the highest of any metro area and way above the national median of $60,336. More than 21% of area households have an income of $200,000 or higher, the second largest share of any city and far more than the national share of 6.9%.

12. Mankato-North Mankato, MN
> Premature death rate: 276 per 100,000 people
> Adult obesity rate: 31.7%
> Uninsured rate: 3.5%
> Median household income: $61,241
Mankato-North Mankato, Minnesota, jumped up the list from last year’s No. 18 ranking. Both the obesity rate and median household income improved over the past year. The adult obesity rate declined from 33.3% to 31.7%, though it remains above the national rate of 29.0%. At 31.7%, the adult obesity rate is below 2018’s 33.3%, though still above the national average of 29%. Similarly, the median annual household income climbed to $61,241 from $57,833 and tops the national median of $60,336.
[in-text-ad-2]

11. Burlington-South Burlington, VT
> Premature death rate: 340 per 100,000 people
> Adult obesity rate: 22.6%
> Uninsured rate: 3.5%
> Median household income: $63,160
Burlington, Vermont is one of only three metropolitan areas in the Eastern United States to rank among the 25 healthiest cities. Medical care is readily available in the city, with more than 148 primary care physicians per 100,000 people, a greater concentration than in all but three other metro areas.
Area residents also benefit from clean air. The air quality tops all of the other healthiest cities, with the average daily density of fine particulate matter at 6.5 micrograms per cubic meter; 8.6 is the average national figure.

10. State College, PA
> Premature death rate: 229 per 100,000 people
> Adult obesity rate: 26.9%
> Uninsured rate: 4.0%
> Median household income: $55,895
The teen birth rate of 3.7 births per 1,000 females ages 15-19 in State College, Pennsylvania is the lowest of any city in the country, and significantly below the national average of 25 births per 1,000. Area adults are also far less likely to smoke or be obese than the typical American adult. They are also more likely to exercise regularly and be covered by health insurance.
[in-text-ad]

9. Corvallis, OR
> Premature death rate: 249 per 100,000 people
> Adult obesity rate: 26.5%
> Uninsured rate: 4.8%
> Median household income: $60,260
More than 90% of the population of this central west Oregon city has access to places for physical activity like gyms and parks, and it seems like they are using them as only 11.5% of adults report no leisure-time physical activity. Nationwide, the share of adults getting no exercise is nearly double that amount.
Corvallis has the highest concentration of mental health providers among the 25 healthiest cities — and the third highest among all U.S. cities — at 783.9 per 100,000 people.

8. Manhattan, KS
> Premature death rate: 222 per 100,000 people
> Adult obesity rate: 26.4%
> Uninsured rate: 5.8%
> Median household income: $50,698
Manhattan, Kansas, improved its ranking on this list from No. 12 last year. It has moved up thanks to several positive changes, such as in the premature death rate, which improved from 251.3 deaths before age 75 per 100,000 people to 221.7 per 100,000.
The 13.3% share of adults in the Manhattan metro area who report being in fair or poor health is considerably lower than the national share of 16.0%. This is likely due in part to healthier behaviors, as Manhattan adults are less likely to smoke and more likely to exercise than the typical American adult.
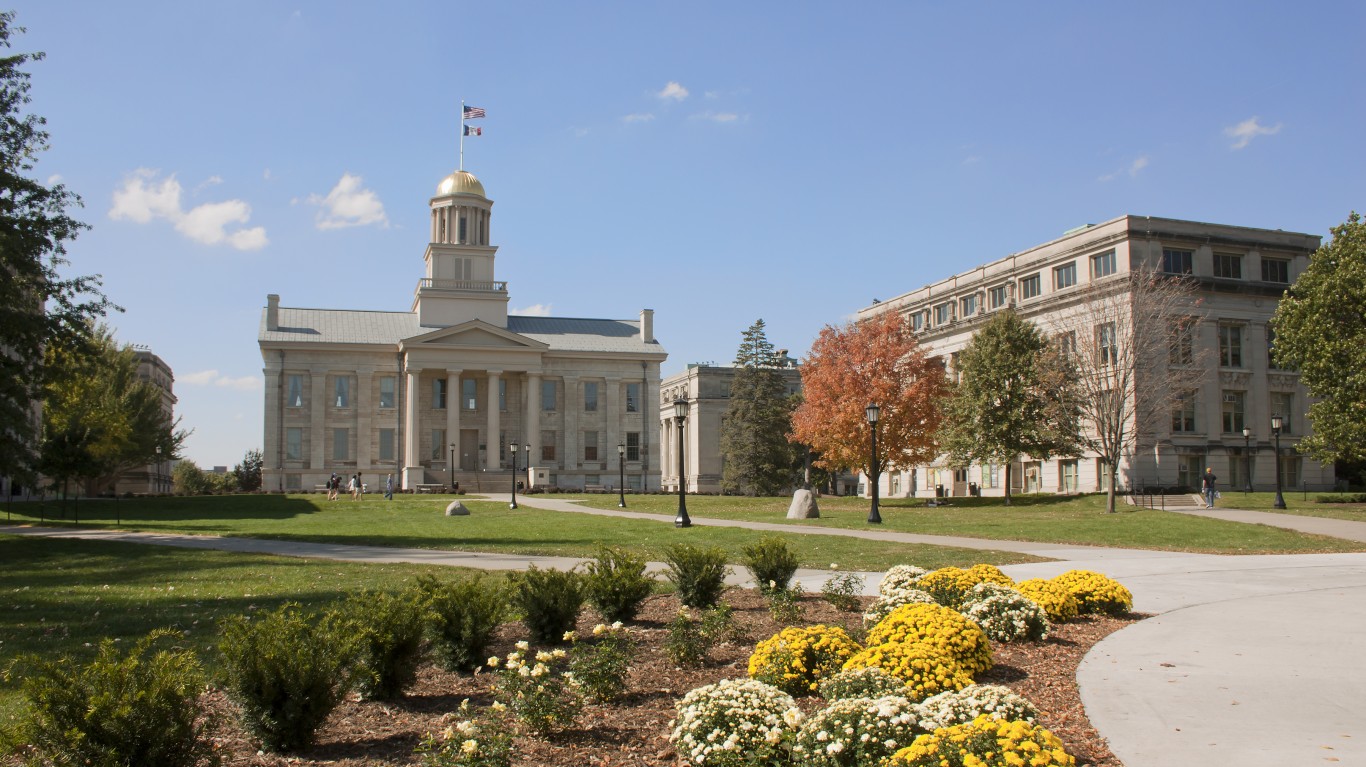
7. Iowa City, IA
> Premature death rate: 248 per 100,000 people
> Adult obesity rate: 25.7%
> Uninsured rate: 4.5%
> Median household income: $60,888
Among Iowa City adults, 12.2% report fair to poor health, well below the 16.0% of adults nationwide. Adult residents also report an average of just 2.8 physically unhealthy days in a month versus 3.7 days nationwide. The adult obesity rate of 25.7% compares favorably with the national average of 29.0%. While 24.2% of adults report excessive drinking — substantially above the 18% nationally — the percentage of driving deaths involving alcohol is 27.1%, below the nationwide figure of 29.0%.
[in-text-ad-2]

6. Boulder, CO
> Premature death rate: 243 per 100,000 people
> Adult obesity rate: 14.9%
> Uninsured rate: 4.0%
> Median household income: $80,834
Boulder, Colorado, is the only metro area in the United States where more than nine in every 10 adults have physically active lifestyles. More than 96% of the residents of the city situated in the foothills of the Rocky Mountains have access to places for physical activity, well above the national average of 84%. Just 9.4% of adults in Boulder report being in fair or poor health, compared to a national average of 16%. Also, 14.9% of area adults are obese, compared with 29.0% nationally. Nationally, 8.7% of the population under age 65 has no medical insurance. In Boulder, the uninsured rate is just 4.0%.
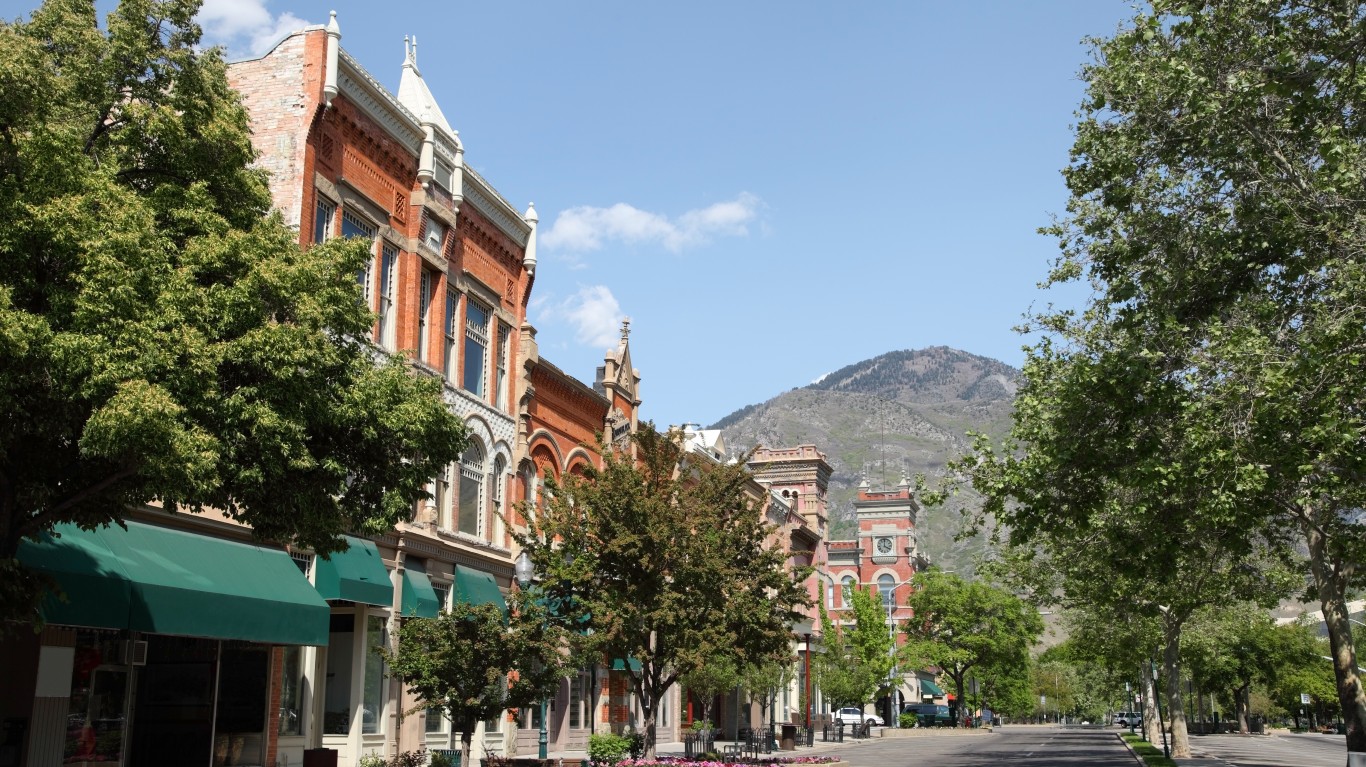
5. Provo-Orem, UT
> Premature death rate: 194 per 100,000 people
> Adult obesity rate: 25.4%
> Uninsured rate: 7.5%
> Median household income: $70,196
Located less than an hour south of Salt Lake City, Provo-Orem is among the country’s fastest growing metropolitan areas — due in part to a rapid birth rate. Only 6.2% of those newborns arrived with a low birthweight, compared with the national average of 8.0%.
Healthy behaviors are common in the in the Provo-Orem metro area. Only 6.8% of adults currently smoke versus 17% nationwide. Area adults are also far more likely to exercise regularly than the typical American adult. Partially as a result, the metro area’s obesity rate of 25.4% is below the comparable 29.0% national rate.
[in-text-ad]

4. Logan, UT-ID
> Premature death rate: 204 per 100,000 people
> Adult obesity rate: 26.5%
> Uninsured rate: 7.9%
> Median household income: $52,974
One of three Utah metro areas among the 25 healthiest cities in the nation, Logan rates high for its clean air, with an average daily density of 6.6 micrograms of fine particulate matter per cubic meter. Clean air likely contributes to positive health outcomes. For example, just 10.8% of metro area adults report being in fair or poor health, well below the 16.0% share of adults nationwide.
Healthy habits also help. Adults in Logan are far less likely to smoke and far more likely to exercise than the typical American adult.

3. San Jose-Sunnyvale-Santa Clara, CA
> Premature death rate: 216 per 100,000 people
> Adult obesity rate: 19.9%
> Uninsured rate: 4.2%
> Median household income: $117,474
Situated just south of San Francisco Bay, the San Jose-Sunnyvale-Santa Clara metropolitan area is the wealthiest in the United States — and also among the healthiest. The area’s adult smoking rate of 8.3% is less than half the national rate of 17%. The adult obesity rate of 19.9% is almost 10 percentage points below the 29.0% national figure. And nearly 98% of the population has access to places for physical activity, compared with 84% nationally.

2. Ames, IA
> Premature death rate: 206 per 100,000 people
> Adult obesity rate: 27.7%
> Uninsured rate: 4.9%
> Median household income: $60,351
Healthy habits are common in Ames, Iowa. The percentage of driving deaths involving alcohol, at 13.6%, is less than half of the national figure of 29.0%. Additionally, just 14.5% of adults smoke and 18.6% of adults are regularly physically active, compared to the national rates of 17.0% and 22.0%, respectively.
Healthy behaviors like these contribute to healthy outcomes. For example, the obesity rate in Ames of 27.7% is lower than the 29.0% national obesity rate. Additionally, Ames has the third lowest premature death rate among U.S. metro areas.
[in-text-ad-2]
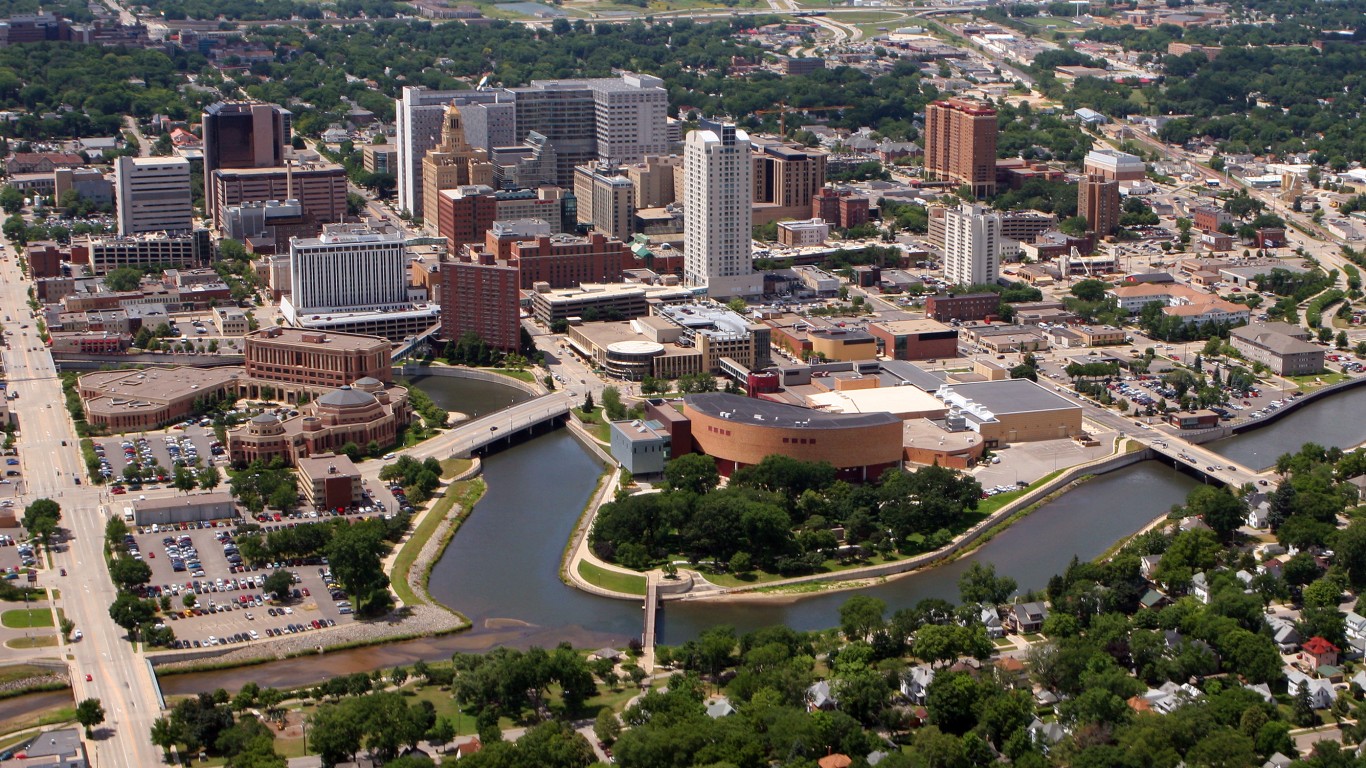
1. Rochester, MN
> Premature death rate: 282 per 100,000 people
> Adult obesity rate: 27.3%
> Uninsured rate: 3.9%
> Median household income: $71,985
Not only is Rochester, Minnesota, the healthiest city in the United States, but also it is the No. 1 city for older Americans. More than half of the female Medicare enrollees receive annual mammograms — 56.5% versus 41% nationally. Additionally, 55.5% of Rochester’s Medicare enrollees get a flu shot compared to the national average of 45%.
Higher-income Americans can afford a greater range of healthy options related to diet and lifestyle. Rochester’s median household income of $71,985 is well above the national median of $60,336. It is perhaps no coincidence that area adults report an average of just 2.7 physically unhealthy days a month, the least of any U.S. metro area.
Methodology
24/7 Tempo created an index modeled after an analysis conducted by County Health Rankings & Roadmaps, a Robert Wood Johnson Foundation and University of Wisconsin Population Health Institute joint program. To identify the 25 healthiest cities, 24/7 Tempo reviewed all U.S. metropolitan statistical areas. The index rankings are based on overall health outcomes, a weighted composite of length of life, quality of life, and overall health factors. The health factors component is itself a weighted composite of healthy behaviors, clinical care, social and economic factors, and physical environment measures. Median household income figures came from the Census Bureau’s 2017 American Community Survey.
Credit card companies are handing out rewards and benefits to win the best customers. A good cash back card can be worth thousands of dollars a year in free money, not to mention other perks like travel, insurance, and access to fancy lounges. See our top picks for the best credit cards today. You won’t want to miss some of these offers.
Flywheel Publishing has partnered with CardRatings for our coverage of credit card products. Flywheel Publishing and CardRatings may receive a commission from card issuers.
Thank you for reading! Have some feedback for us?
Contact the 24/7 Wall St. editorial team.
 24/7 Wall St.

