
Slightly more than one in every 10 Americans packed up and moved to a new home in 2017.
While reasons for relocating vary from person to person and family to family, there are some common themes. Younger Americans may move to a city for their career. Families may decide they need to be in a better school district. Older Americans frequently move to be in warmer climates or more walkable cities — in addition to several other factors that the best places to retire all share.
The 35.5 million Americans who move each year may be attracted to places by different attributes — but it appears some places have more of these attributes than others.
24/7 Wall St. reviewed population changes between 2010 and 2017 in nearly 15,000 cities, towns, villages, and Census designated places to identify the fastest growing place in every state. We only considered areas with populations of at least 1,000. To ensure accuracy, we did not consider places where the margin of error for population was greater than 10%. All data are five-year estimates from the U.S. Census Bureau’s American Community Survey.
The cities and towns on this list tend to be relatively prosperous. In the vast majority of the fastest growing places, the unemployment rate is lower than it is across the respective state as a whole. Additionally, in 42 of the 50 communities on this list, the typical household earns more than they typical household across the state as a whole. The strong job market and higher incomes in these areas likely make them more attractive to new residents.
Focusing on population change in cities in towns within a specific state does not shed light on broader, national migration patterns. While the U.S. population grew by 5.6% in the last seven years, some states, like Michigan and West Virginia, are home to fewer people now than in 2010. Meanwhile, in the Southeast and the West, populations are booming. These are America’s fastest growing and shrinking states.
Click here to see the fastest growing places in every state
Click here to see the fastest shrinking places in every state
Click here to read our methodology

1. Alabama: Pike Road
> 2010-2017 population change: +66.0% (state: +2.9%)
> Median household income: $102,500 (state: $46,472)
> Annual unemployment: 2.9% (state: 4.3%)
> Total population: 8,417
See all stories featuring: Alabama
[in-text-ad]
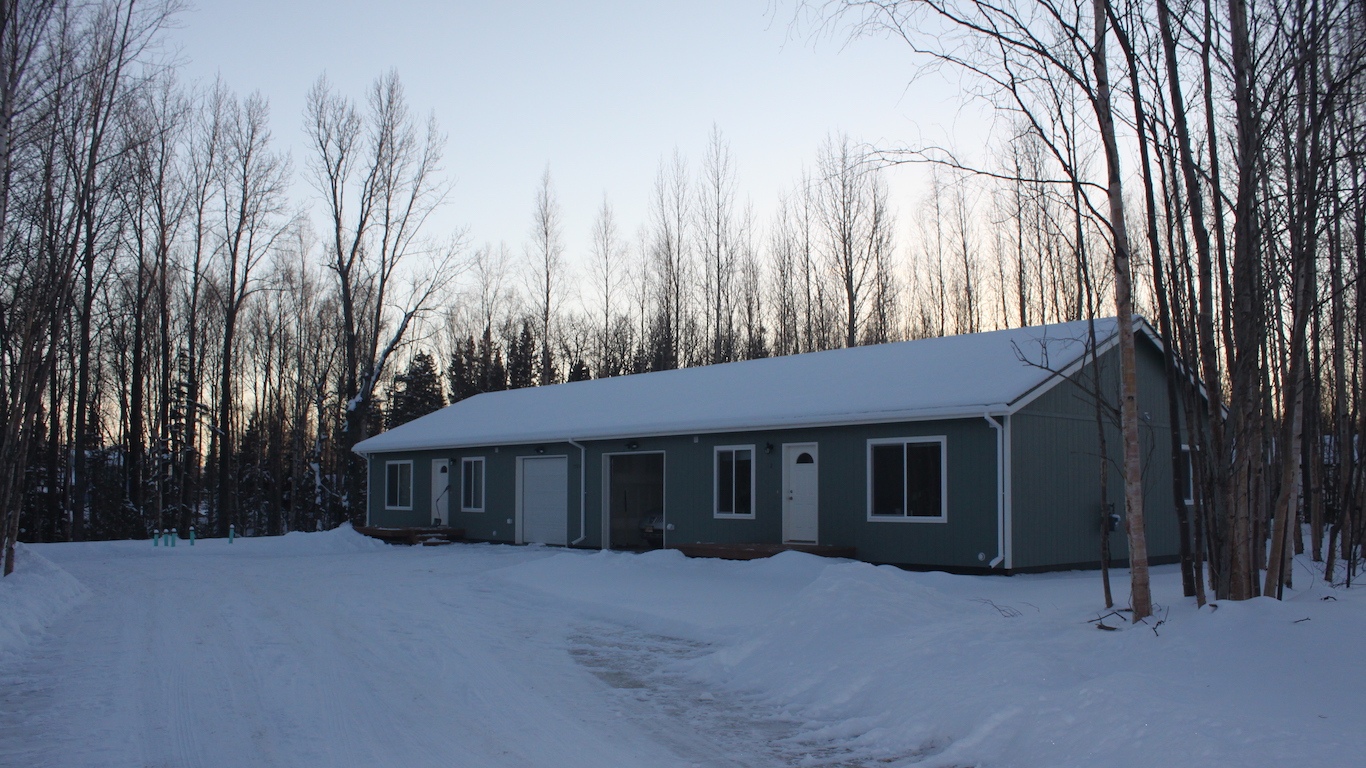
2. Alaska: Knik-Fairview
> 2010-2017 population change: +40.6% (state: +6.9%)
> Median household income: $87,093 (state: $76,114)
> Annual unemployment: 5.5% (state: 5.2%)
> Total population: 17,203
See all stories featuring: Alaska

3. Arizona: Queen Creek
> 2010-2017 population change: +44.4% (state: +9.0%)
> Median household income: $92,917 (state: $53,510)
> Annual unemployment: 2.4% (state: 4.2%)
> Total population: 33,298
See all stories featuring: Arizona
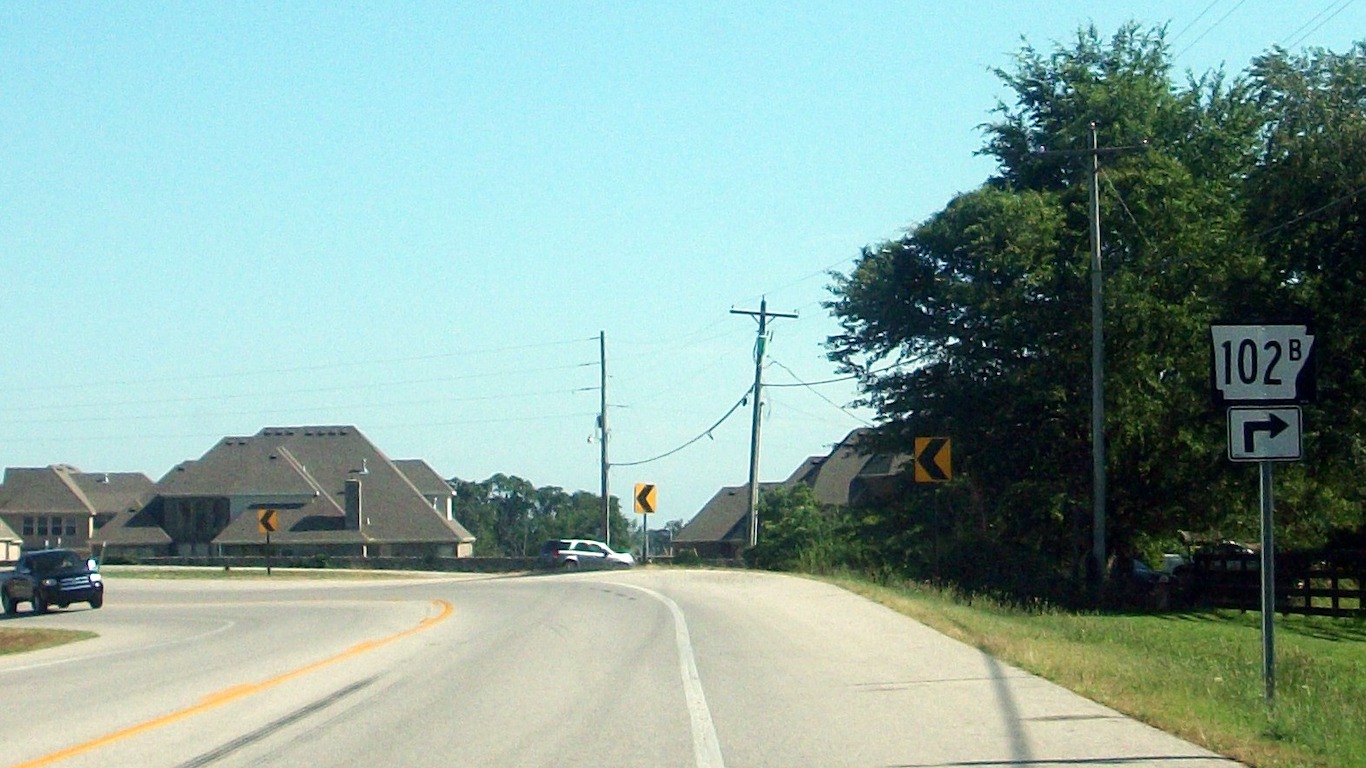
4. Arkansas: Centerton
> 2010-2017 population change: +46.5% (state: +3.7%)
> Median household income: $68,561 (state: $43,813)
> Annual unemployment: 1.3% (state: 3.6%)
> Total population: 12,178
See all stories featuring: Arkansas
[in-text-ad-2]

5. California: Ladera Ranch
> 2010-2017 population change: +58.3% (state: +6.4%)
> Median household income: $152,923 (state: $67,169)
> Annual unemployment: 3.5% (state: 4.8%)
> Total population: 28,769
See all stories featuring: California

6. Colorado: Johnstown
> 2010-2017 population change: +66.2% (state: +11.2%)
> Median household income: $85,339 (state: $65,458)
> Annual unemployment: 2.5% (state: 3.5%)
> Total population: 14,386
See all stories featuring: Colorado
[in-text-ad]

7. Connecticut: Cheshire Village
> 2010-2017 population change: +17.3% (state: +1.4%)
> Median household income: $100,994 (state: $73,781)
> Annual unemployment: 3.4% (state: 4.8%)
> Total population: 6,251
See all stories featuring: Connecticut
 24/7 Wall St.
8. Delaware: Middletown
> 2010-2017 population change: +24.7% (state: +7.1%)
> Median household income: $87,375 (state: $63,036)
> Annual unemployment: 2.4% (state: 4.0%)
> Total population: 20,754
See all stories featuring: Delaware

9. Florida: The Villages
> 2010-2017 population change: +85.0% (state: +9.5%)
> Median household income: $61,022 (state: $50,883)
> Annual unemployment: 0.6% (state: 4.2%)
> Total population: 74,618
See all stories featuring: Florida
[in-text-ad-2]

10. Georgia: Chamblee
> 2010-2017 population change: +191.6% (state: +7.7%)
> Median household income: $54,142 (state: $52,977)
> Annual unemployment: 3.8% (state: 4.7%)
> Total population: 28,433
See all stories featuring: Georgia
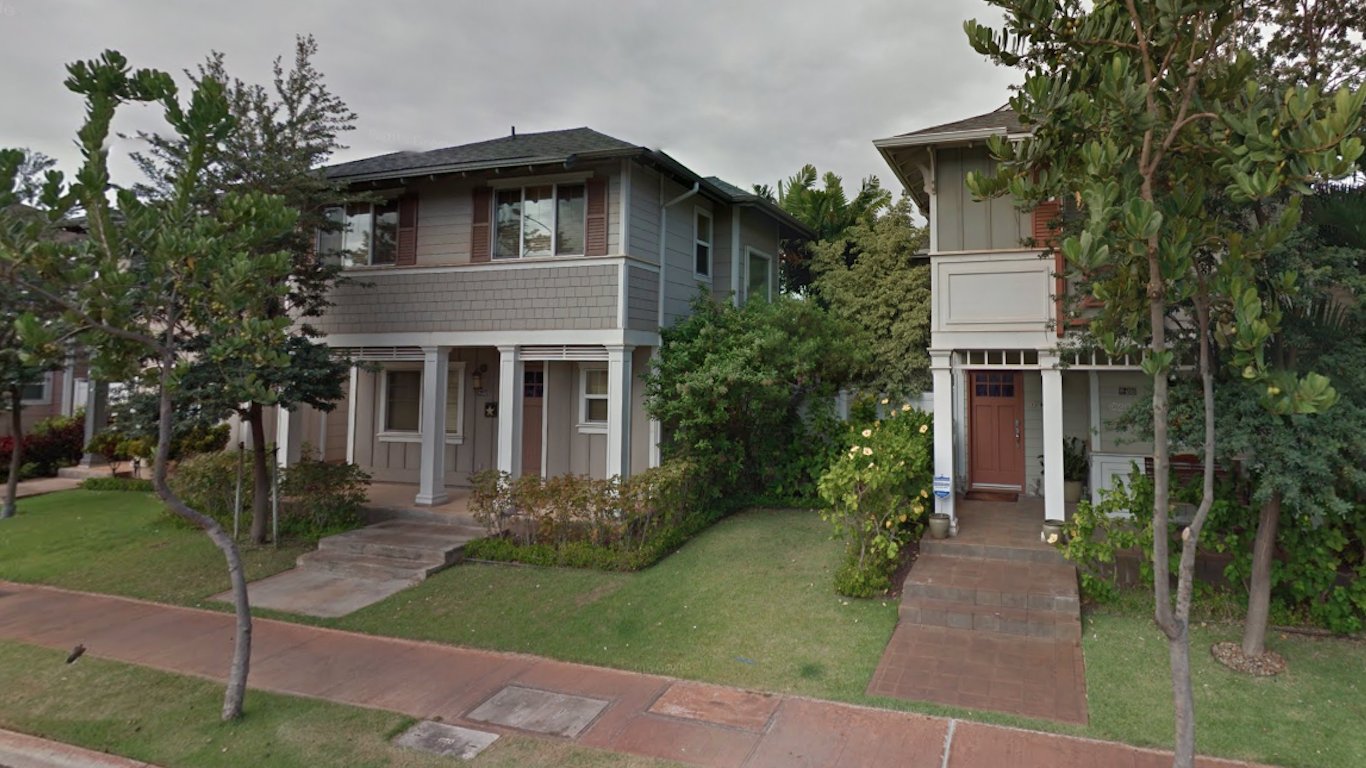
11. Hawaii: Ocean Pointe
> 2010-2017 population change: +123.4% (state: +6.6%)
> Median household income: $114,016 (state: $74,923)
> Annual unemployment: 2.7% (state: 3.0%)
> Total population: 13,579
See all stories featuring: Hawaii
[in-text-ad]

12. Idaho: Star
> 2010-2017 population change: +51.4% (state: +8.6%)
> Median household income: $55,674 (state: $50,985)
> Annual unemployment: 1.8% (state: 3.3%)
> Total population: 7,832
See all stories featuring: Idaho

13. Illinois: Pingree Grove
> 2010-2017 population change: +76.2% (state: +0.9%)
> Median household income: $78,433 (state: $61,229)
> Annual unemployment: 0% (state: 4.8%)
> Total population: 6,661
See all stories featuring: Illinois

14. Indiana: Zionsville
> 2010-2017 population change: +92.0% (state: +3.1%)
> Median household income: $127,152 (state: $52,182)
> Annual unemployment: 2.2% (state: 3.9%)
> Total population: 25,810
See all stories featuring: Indiana
[in-text-ad-2]

15. Iowa: Bondurant
> 2010-2017 population change: +56.5% (state: +3.4%)
> Median household income: $75,357 (state: $56,570)
> Annual unemployment: 0.4% (state: 2.8%)
> Total population: 5,457
See all stories featuring: Iowa

16. Kansas: Basehor
> 2010-2017 population change: +28.8% (state: +3.4%)
> Median household income: $77,755 (state: $55,477)
> Annual unemployment: 3.3% (state: 3.1%)
> Total population: 5,401
See all stories featuring: Kansas
[in-text-ad]
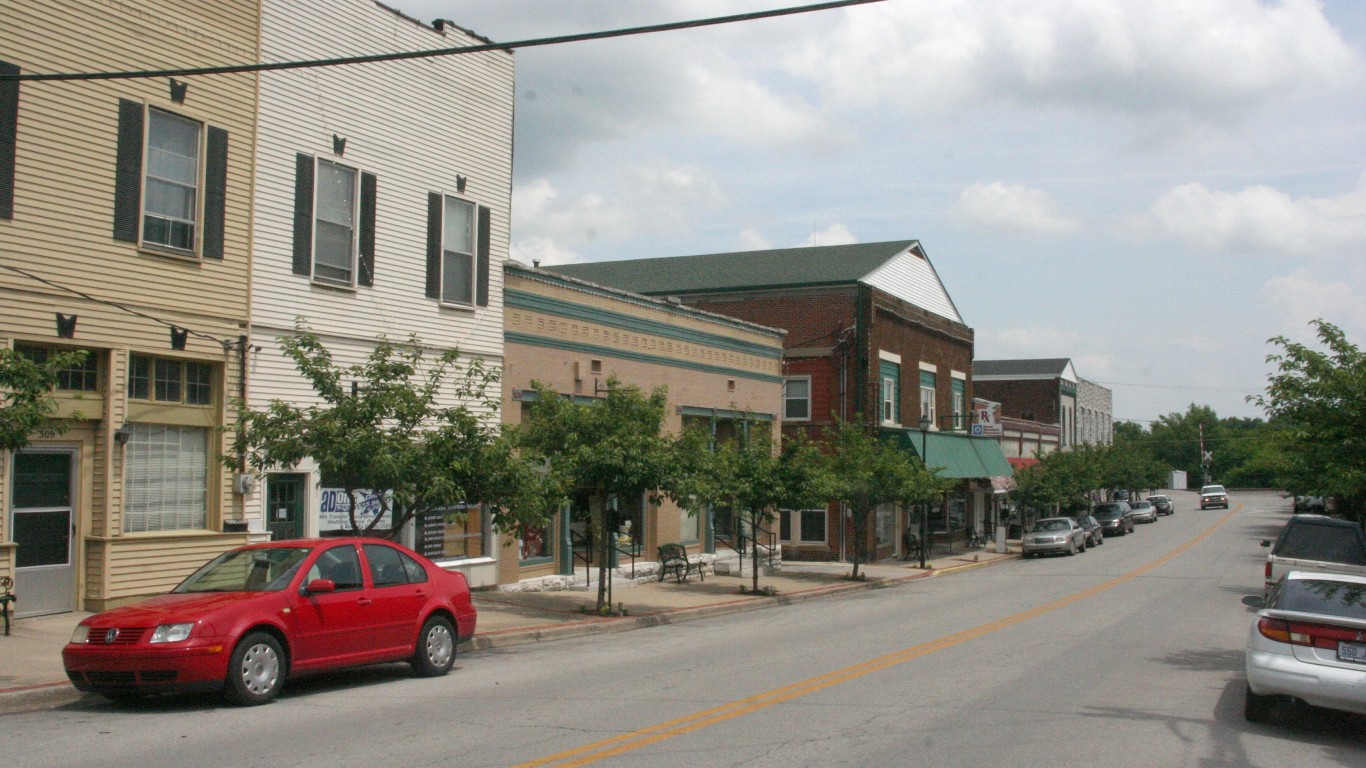
17. Kentucky: Wilmore
> 2010-2017 population change: +66.5% (state: +3.2%)
> Median household income: $46,833 (state: $46,535)
> Annual unemployment: 1.8% (state: 4.0%)
> Total population: 6,226
See all stories featuring: Kentucky

18. Louisiana: Chalmette
> 2010-2017 population change: +83.9% (state: +5.3%)
> Median household income: $43,590 (state: $46,710)
> Annual unemployment: 6.2% (state: 4.3%)
> Total population: 22,907
See all stories featuring: Louisiana

19. Maine: Sanford
> 2010-2017 population change: +97.5% (state: +9.5%)
> Median household income: $42,025 (state: $50,883)
> Annual unemployment: 6.3% (state: 4.2%)
> Total population: 57,979
See all stories featuring: Maine
[in-text-ad-2]

20. Maryland: Clarksburg
> 2010-2017 population change: +109.6% (state: +5.3%)
> Median household income: $135,203 (state: $78,916)
> Annual unemployment: 3.6% (state: 4.1%)
> Total population: 22,100
See all stories featuring: Maryland

21. Massachusetts: West Concord
> 2010-2017 population change: +23.2% (state: +4.8%)
> Median household income: $118,100 (state: $74,167)
> Annual unemployment: 2.3% (state: 4.0%)
> Total population: 7,646
See all stories featuring: Massachusetts
[in-text-ad]

22. Michigan: Byron Center
> 2010-2017 population change: +33.8% (state: -0.3%)
> Median household income: $72,708 (state: $52,668)
> Annual unemployment: 3.3% (state: 4.5%)
> Total population: 6,751
See all stories featuring: Michigan

23. Minnesota: Rogers
> 2010-2017 population change: +64.0% (state: +3.7%)
> Median household income: $54,172 (state: $43,813)
> Annual unemployment: 2% (state: 3.6%)
> Total population: 63,411
See all stories featuring: Minnesota

24. Mississippi: Bay St. Louis
> 2010-2017 population change: +27.5% (state: +1.5%)
> Median household income: $42,002 (state: $42,009)
> Annual unemployment: 5.3% (state: 5.0%)
> Total population: 11,918
See all stories featuring: Mississippi
[in-text-ad-2]

25. Missouri: Cottleville
> 2010-2017 population change: +56.2% (state: +2.6%)
> Median household income: $98,611 (state: $51,542)
> Annual unemployment: 2.9% (state: 3.6%)
> Total population: 4,551
See all stories featuring: Missouri

26. Montana: Sidney
> 2010-2017 population change: +28.5% (state: +5.8%)
> Median household income: $59,958 (state: $50,801)
> Annual unemployment: 1.5% (state: 3.0%)
> Total population: 6,491
See all stories featuring: Montana
[in-text-ad]

27. Nebraska: Ralston
> 2010-2017 population change: +23.3% (state: +5.3%)
> Median household income: $55,837 (state: $56,675)
> Annual unemployment: 3.7% (state: 2.6%)
> Total population: 7,348
See all stories featuring: Nebraska

28. Nevada: Enterprise
> 2010-2017 population change: +56.5% (state: +9.7%)
> Median household income: $74,139 (state: $55,434)
> Annual unemployment: 3.5% (state: 5.1%)
> Total population: 155,773
See all stories featuring: Nevada

29. New Hampshire: Durham
> 2010-2017 population change: +20.3% (state: +6.4%)
> Median household income: $81,372 (state: $67,169)
> Annual unemployment: 3.1% (state: 4.8%)
> Total population: 5,819
See all stories featuring: New Hampshire
[in-text-ad-2]

30. New Jersey: Princeton
> 2010-2017 population change: +145.1% (state: +2.7%)
> Median household income: $125,506 (state: $76,475)
> Annual unemployment: 2.6% (state: 4.6%)
> Total population: 30,722
See all stories featuring: New Jersey
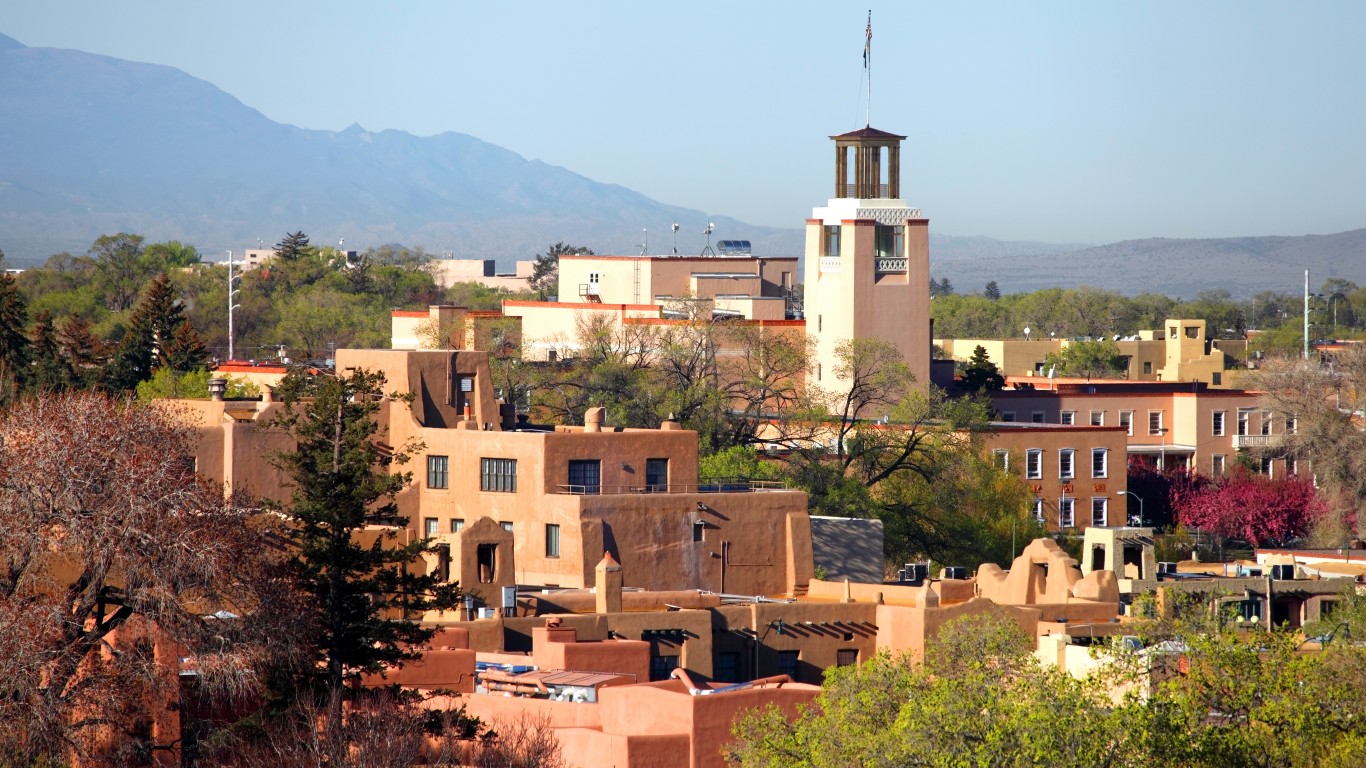
31. New Mexico: Santa Fe
> 2010-2017 population change: +22.8% (state: +3.6%)
> Median household income: $53,922 (state: $46,718)
> Annual unemployment: 3.5% (state: 4.5%)
> Total population: 82,980
See all stories featuring: New Mexico
[in-text-ad]

32. New York: Monsey
> 2010-2017 population change: +46.5% (state: +3.0%)
> Median household income: $37,925 (state: $62,765)
> Annual unemployment: 3.3% (state: 4.3%)
> Total population: 22,043
See all stories featuring: New York
 24/7 Wall St.
33. North Carolina: Rolesville
> 2010-2017 population change: +91.8% (state: +8.4%)
> Median household income: $96,384 (state: $50,320)
> Annual unemployment: 8% (state: 4.4%)
> Total population: 6,308
See all stories featuring: North Carolina

34. North Dakota: Williston
> 2010-2017 population change: +81.0% (state: +9.5%)
> Median household income: $35,000 (state: $50,883)
> Annual unemployment: 4.1% (state: 4.2%)
> Total population: 2,685
See all stories featuring: North Dakota
[in-text-ad-2]

35. Ohio: Fort Shawnee
> 2010-2017 population change: +56.3% (state: +0.8%)
> Median household income: $66,323 (state: $52,407)
> Annual unemployment: 4.4% (state: 4.1%)
> Total population: 5,875
See all stories featuring: Ohio

36. Oklahoma: Jenks
> 2010-2017 population change: +34.9% (state: +6.0%)
> Median household income: $90,039 (state: $49,767)
> Annual unemployment: 2.5% (state: 3.5%)
> Total population: 20,836
See all stories featuring: Oklahoma
[in-text-ad]

37. Oregon: Happy Valley
> 2010-2017 population change: +46.8% (state: +7.0%)
> Median household income: $115,718 (state: $56,119)
> Annual unemployment: 2.8% (state: 4.2%)
> Total population: 18,477
See all stories featuring: Oregon
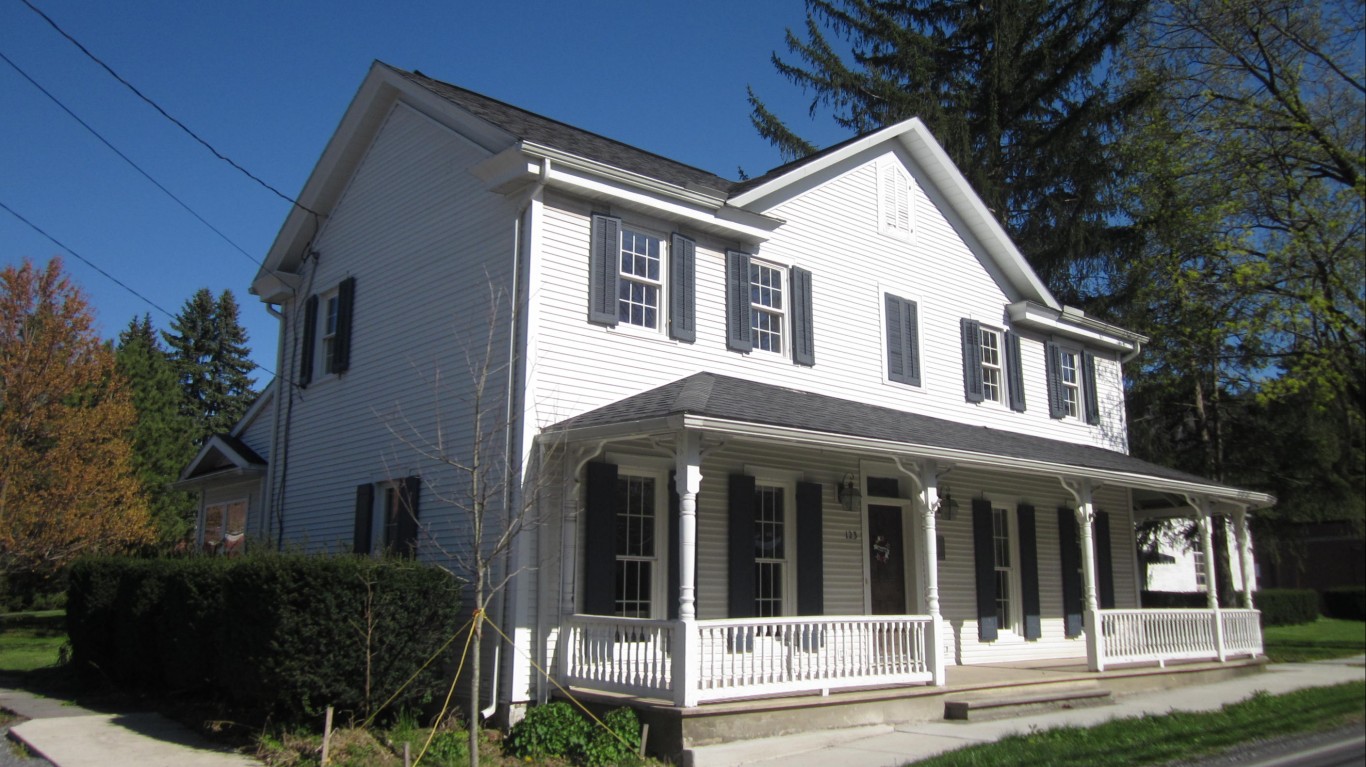
38. Pennsylvania: Boalsburg
> 2010-2017 population change: +23.1% (state: +1.4%)
> Median household income: $100,198 (state: $56,951)
> Annual unemployment: 0.9% (state: 4.1%)
> Total population: 4,533
See all stories featuring: Pennsylvania

39. Rhode Island: Tiverton
> 2010-2017 population change: +5.9% (state: +0.0%)
> Median household income: $71,615 (state: $61,043)
> Annual unemployment: 4.2% (state: 4.4%)
> Total population: 7,727
See all stories featuring: Rhode Island
[in-text-ad-2]
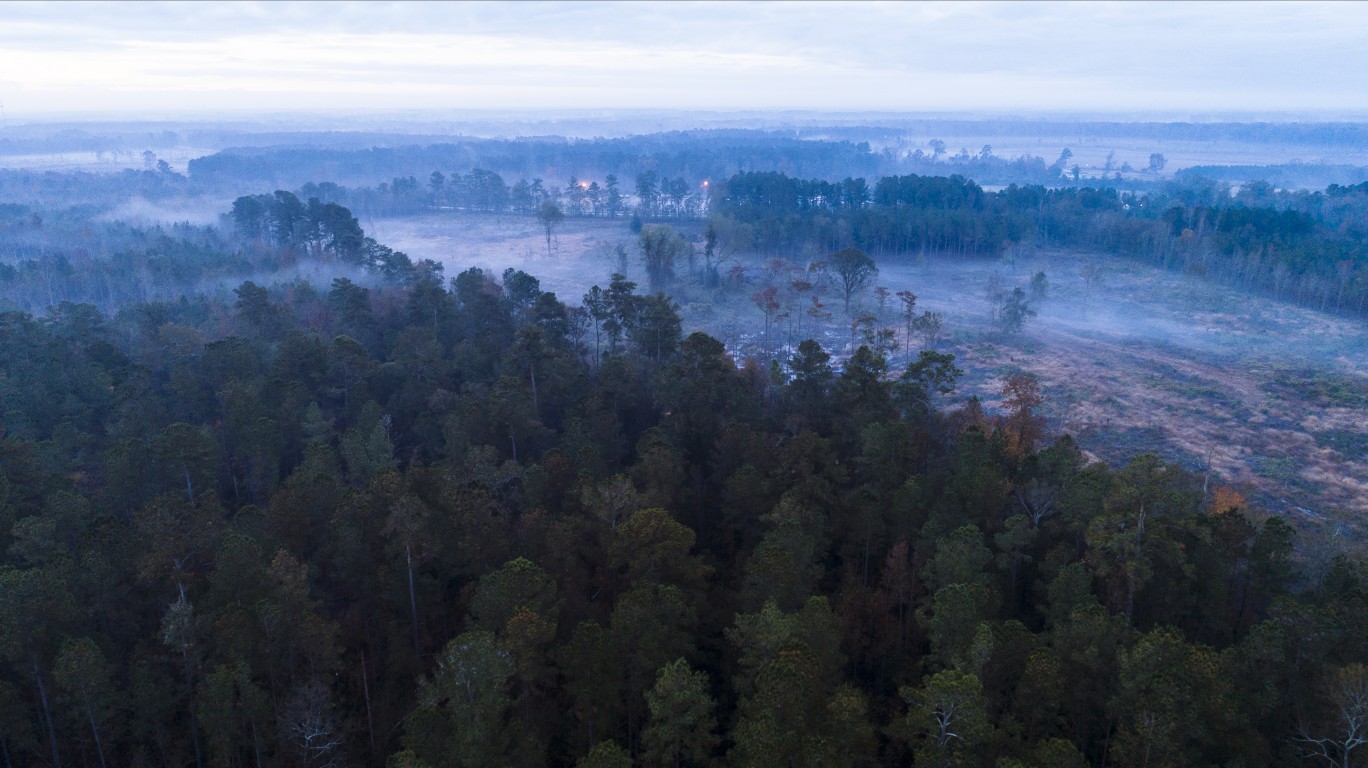
40. South Carolina: Hardeeville
> 2010-2017 population change: +70.3% (state: +8.5%)
> Median household income: $52,705 (state: $48,781)
> Annual unemployment: 3.8% (state: 4.3%)
> Total population: 5,084
See all stories featuring: South Carolina

41. South Dakota: Harrisburg
> 2010-2017 population change: +52.5% (state: +0.9%)
> Median household income: $35,609 (state: $61,229)
> Annual unemployment: 7.1% (state: 4.8%)
> Total population: 9,344
See all stories featuring: South Dakota
[in-text-ad]
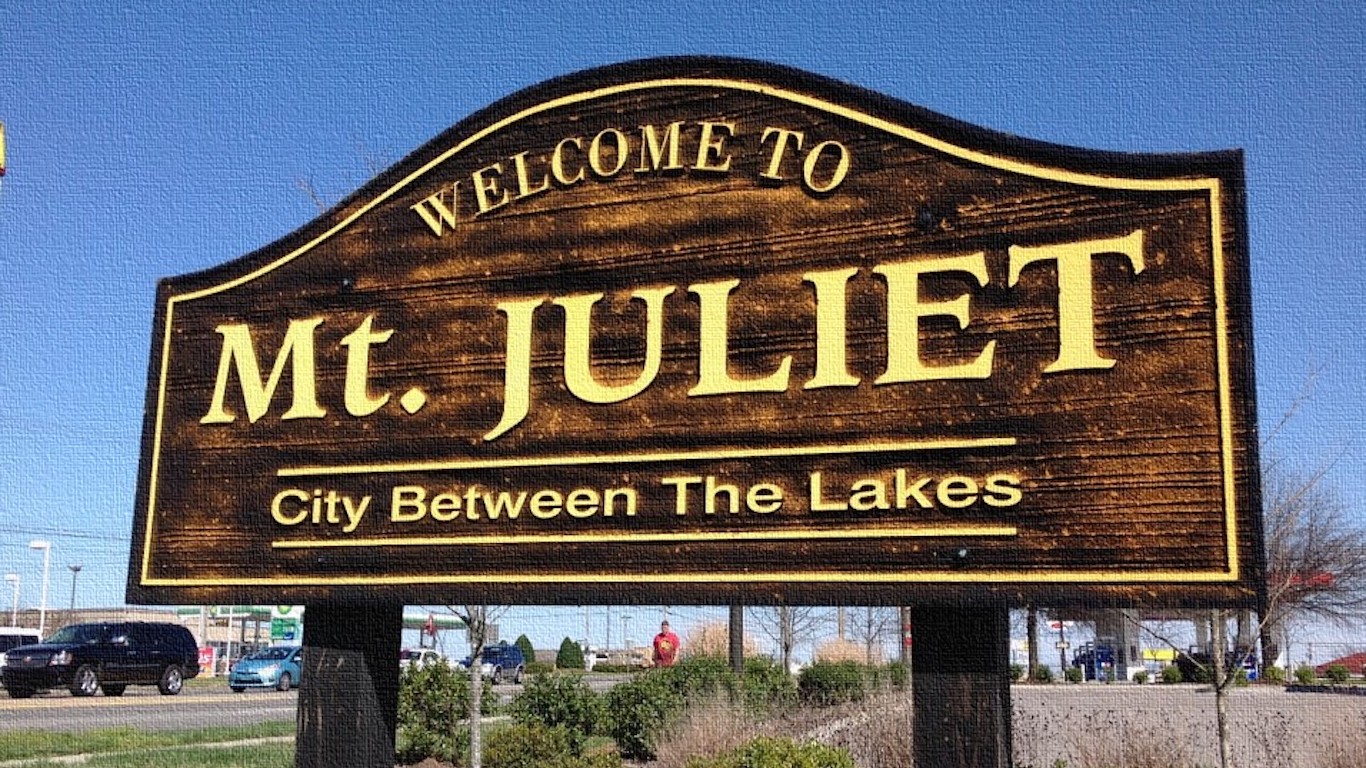
42. Tennessee: Mount Juliet
> 2010-2017 population change: +43.2% (state: +5.8%)
> Median household income: $80,130 (state: $48,708)
> Annual unemployment: 2.5% (state: 4.0%)
> Total population: 31,397
See all stories featuring: Tennessee
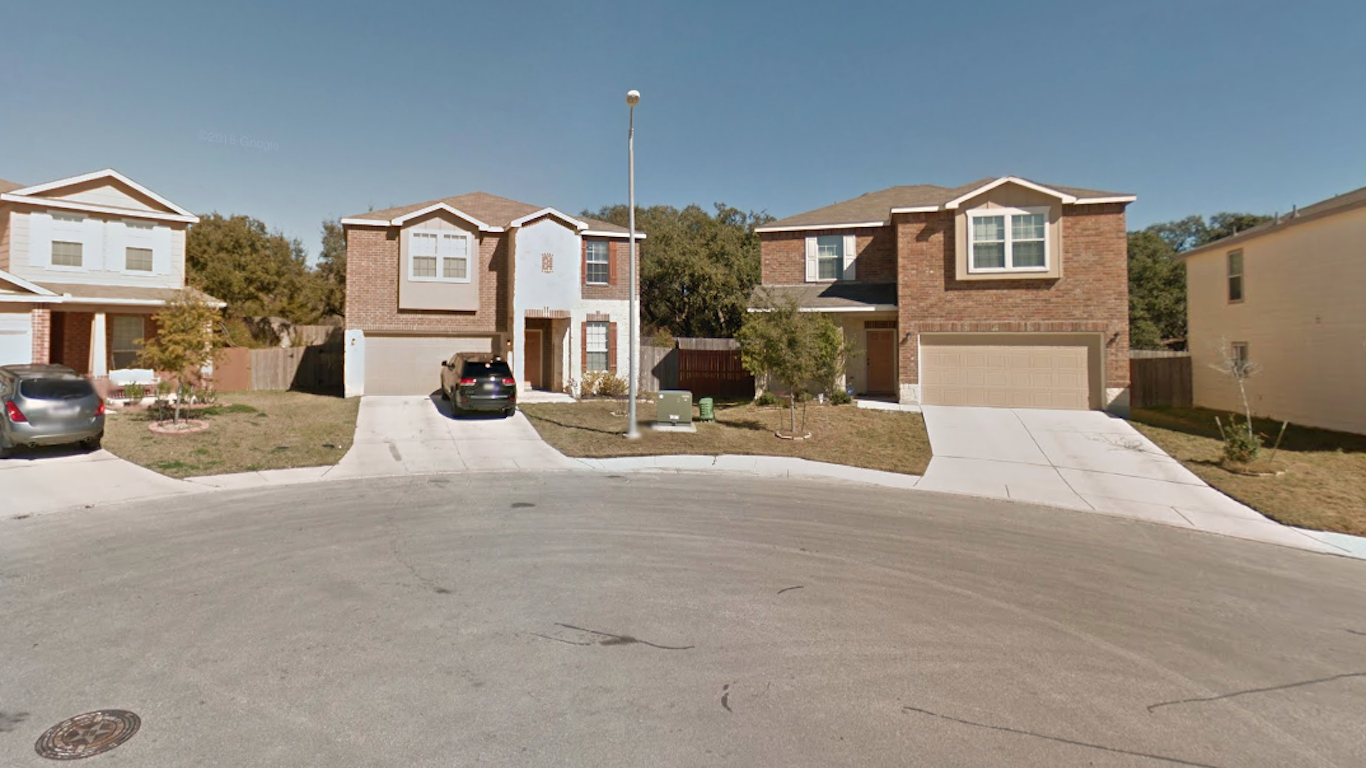
43. Texas: Timberwood Park
> 2010-2017 population change: +123.0% (state: +12.8%)
> Median household income: $113,331 (state: $57,051)
> Annual unemployment: 2.9% (state: 3.7%)
> Total population: 26,236
See all stories featuring: Texas

44. Utah: Saratoga Springs
> 2010-2017 population change: +74.7% (state: +3.0%)
> Median household income: $76,775 (state: $62,765)
> Annual unemployment: 3.9% (state: 4.3%)
> Total population: 27,682
See all stories featuring: Utah
[in-text-ad-2]
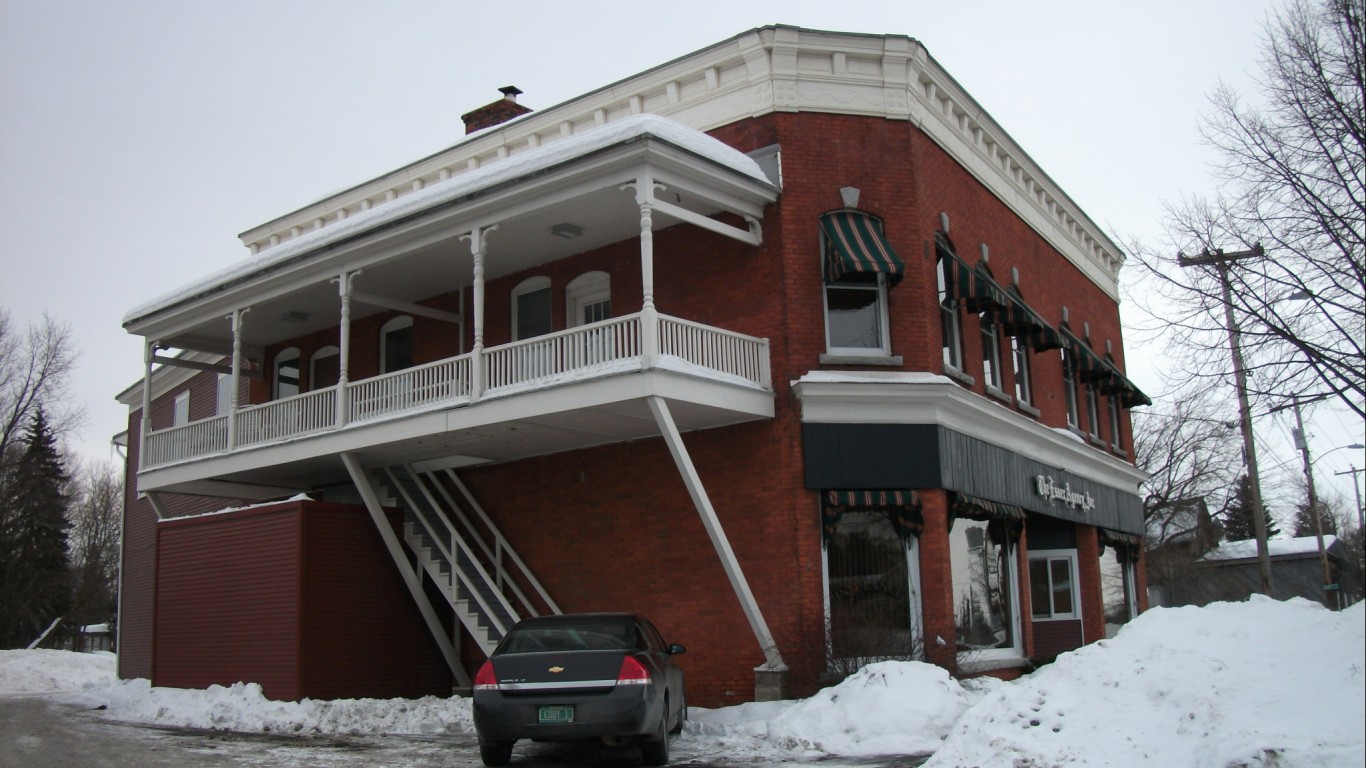
45. Vermont: Essex Junction
> 2010-2017 population change: +10.7% (state: +0.1%)
> Median household income: $63,948 (state: $57,808)
> Annual unemployment: 3.5% (state: 2.9%)
> Total population: 10,132
See all stories featuring: Vermont

46. Virginia: Brambleton
> 2010-2017 population change: +131.3% (state: +6.7%)
> Median household income: $173,690 (state: $68,766)
> Annual unemployment: 2.7% (state: 3.5%)
> Total population: 19,876
See all stories featuring: Virginia
[in-text-ad]

47. Washington: Kirkland
> 2010-2017 population change: +82.0% (state: +9.3%)
> Median household income: $104,319 (state: $66,174)
> Annual unemployment: 3.3% (state: 3.8%)
> Total population: 86,772
See all stories featuring: Washington

48. West Virginia: Cheat Lake
> 2010-2017 population change: +24.9% (state: -0.2%)
> Median household income: $87,125 (state: $44,061)
> Annual unemployment: 1.7% (state: 3.8%)
> Total population: 9,540
See all stories featuring: West Virginia
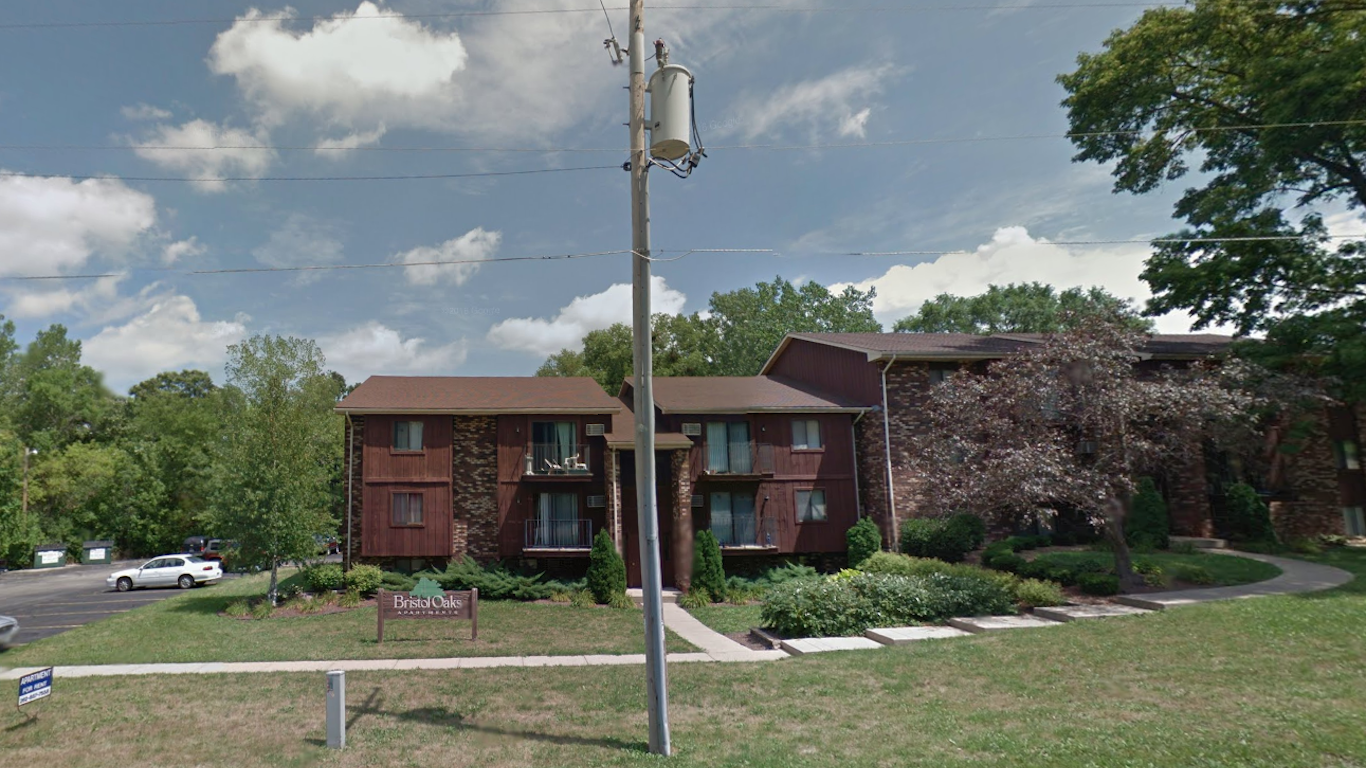
49. Wisconsin: Bristol
> 2010-2017 population change: +93.9% (state: +2.2%)
> Median household income: $66,788 (state: $56,759)
> Annual unemployment: 3% (state: 3.1%)
> Total population: 4,970
See all stories featuring: Wisconsin
[in-text-ad-2]

50. Wyoming: Evansville
> 2010-2017 population change: +18.3% (state: +6.9%)
> Median household income: $42,140 (state: $60,938)
> Annual unemployment: 4% (state: 3.1%)
> Total population: 2,929
See all stories featuring: Wyoming
Methodology
To identify the fastest growing place in every state, 24/7 Wall St. reviewed population change from 2010 to 2017 in nearly 15,000 cities, towns, villages, and Census designated places with populations of at least 1,000. We only considered places where the margin of error for population was less than 10%. All data are five-year estimates from the U.S. Census Bureau’s American Community Survey. We also reviewed data on median household income and annual unemployment for 2017 from the ACS.
Travel Cards Are Getting Too Good To Ignore (sponsored)
Credit card companies are pulling out all the stops, with the issuers are offering insane travel rewards and perks.
We’re talking huge sign-up bonuses, points on every purchase, and benefits like lounge access, travel credits, and free hotel nights. For travelers, these rewards can add up to thousands of dollars in flights, upgrades, and luxury experiences every year.
It’s like getting paid to travel — and it’s available to qualified borrowers who know where to look.
We’ve rounded up some of the best travel credit cards on the market. Click here to see the list. Don’t miss these offers — they won’t be this good forever.
Thank you for reading! Have some feedback for us?
Contact the 24/7 Wall St. editorial team.
Latest from 24/7


Our expert who first called NVIDIA in 2009 is predicting 2025 will see a historic AI breakthrough.
You can follow him investing $500,000 of his own money on our top AI stocks for free.