
U.S. population growth slowed to just 0.6% in 2018 — the lowest growth rate in 80 years. The last time the annual population growth was this low, the nation was in the throes of the Great Depression, when job opportunities were limited and there was little optimism about the future.
While the national population growth just hit a historic low, there are towns and cities across the country where even a small 0.6% population bump would be a welcome change. In these places, population decline has been a defining demographic trend for years.
24/7 Wall St. reviewed population changes between 2010 and 2017 in nearly 15,000 cities, towns, villages, and Census designated places to identify the fastest shrinking place in every state. We only considered areas with populations of at least 1,000. To ensure accuracy, we did not consider places where the margin of error for population was greater than 10%. All data are five-year estimates from the U.S. Census Bureau’s American Community Survey.
National population growth is slowing primarily because the country’s population is aging. This also appears to be a factor in many of the cities and towns on this list.
In the fastest shrinking town in 38 states, the median age exceeds the national median of 37.8 years. Similarly, in the vast majority of places on this list, the share of residents 65 and older is greater than the comparable share statewide. While these places tend to have large shares of retirement-age residents, they are not necessarily the places with the oldest populations in their state. These are the oldest counties in every state.
Just like during the Great Depression, when population growth slowed nationwide, in many of these areas, economic conditions are lagging. In the majority of cities and towns on this list, the median household income is lower than it is across their respective state as a whole. This is in stark contrast to the fastest growing place in every state — which tend to be relatively affluent areas.
Click here to see the fastest shrinking place in every state
Click here to see the fastest growing place in every state
Click here to read our methodology

1. Alabama: Tuskegee
> 2010-2017 population change: -13.1% (state: +2.9%)
> Median household income: $27,314 (state: $46,472)
> Annual unemployment: 10.1% (state: 4.3%)
> Total population: 8,852
See all stories featuring: Alabama
[in-text-ad]

2. Alaska: Valdez
> 2010-2017 population change: -0.4% (state: +6.9%)
> Median household income: $94,003 (state: $76,114)
> Annual unemployment: 6.5% (state: 5.2%)
> Total population: 3,921
See all stories featuring: Alaska
3. Arizona: New Kingman-Butler
> 2010-2017 population change: -9.9% (state: +9.0%)
> Median household income: $31,923 (state: $53,510)
> Annual unemployment: 9.3% (state: 4.2%)
> Total population: 13,060
See all stories featuring: Arizona
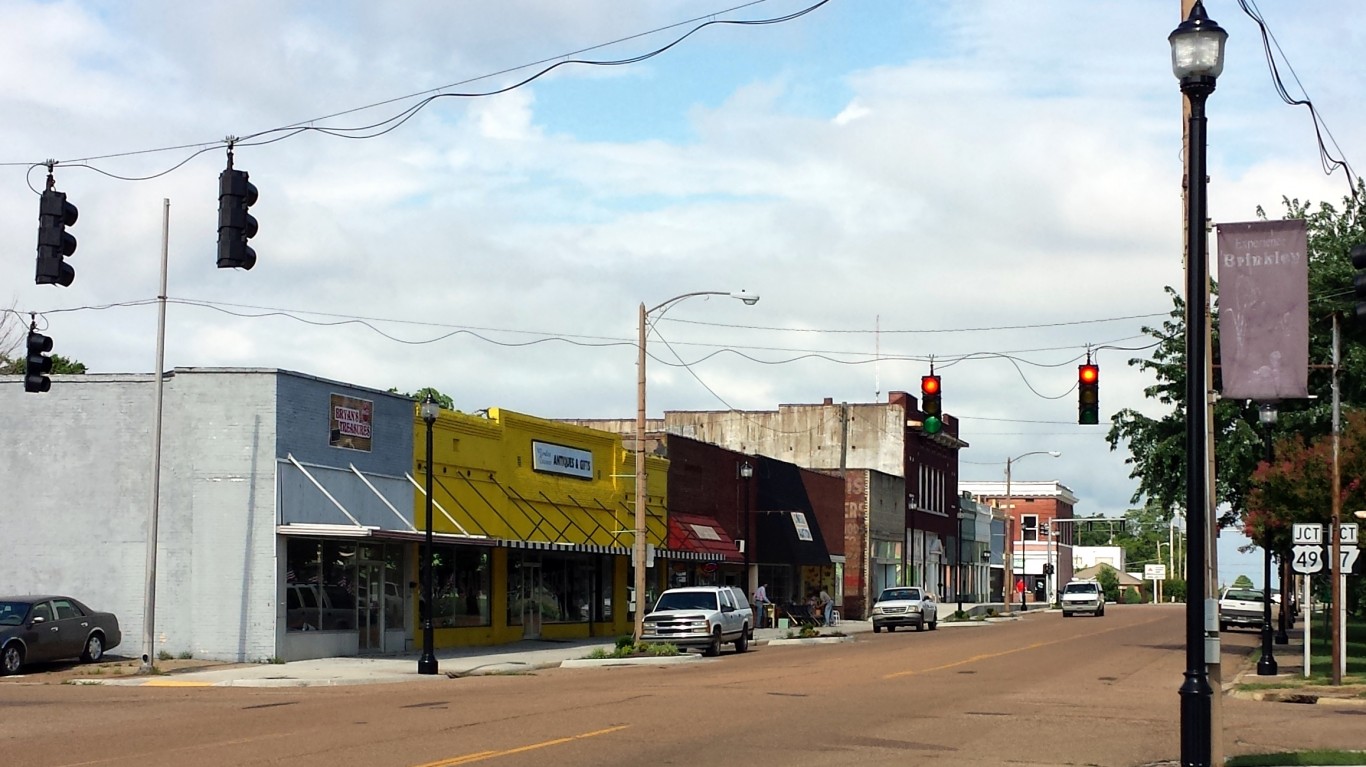
4. Arkansas: Brinkley
> 2010-2017 population change: -14.1% (state: +3.7%)
> Median household income: $31,694 (state: $43,813)
> Annual unemployment: 5.5% (state: 3.6%)
> Total population: 2,854
See all stories featuring: Arkansas
[in-text-ad-2]

5. California: Willowbrook
> 2010-2017 population change: -35.6% (state: +6.4%)
> Median household income: $40,279 (state: $67,169)
> Annual unemployment: 7.3% (state: 4.8%)
> Total population: 22,654
See all stories featuring: California

6. Colorado: Air Force Academy
> 2010-2017 population change: -26.1% (state: +11.2%)
> Median household income: $70,179 (state: $65,458)
> Annual unemployment: 0.3% (state: 3.5%)
> Total population: 6,098
See all stories featuring: Colorado
[in-text-ad]

7. Connecticut: Pawcatuck
> 2010-2017 population change: -13.8% (state: +1.4%)
> Median household income: $57,780 (state: $73,781)
> Annual unemployment: 5.2% (state: 4.8%)
> Total population: 4,999
See all stories featuring: Connecticut
 24/7 Wall St.
8. Delaware: North Star
> 2010-2017 population change: -6.8% (state: +7.1%)
> Median household income: $141,618 (state: $63,036)
> Annual unemployment: 1.3% (state: 4.0%)
> Total population: 7,390
See all stories featuring: Delaware

9. Florida: Zephyrhills West
> 2010-2017 population change: -19.2% (state: +9.5%)
> Median household income: $33,558 (state: $50,883)
> Annual unemployment: 3.1% (state: 4.2%)
> Total population: 4,734
See all stories featuring: Florida
[in-text-ad-2]

10. Georgia: Reidsville
> 2010-2017 population change: -38.2% (state: +7.7%)
> Median household income: $24,500 (state: $52,977)
> Annual unemployment: 1.6% (state: 4.7%)
> Total population: 2,652
See all stories featuring: Georgia

11. Hawaii: Ahuimanu
> 2010-2017 population change: -17.2% (state: +6.6%)
> Median household income: $103,825 (state: $74,923)
> Annual unemployment: 2.8% (state: 3.0%)
> Total population: 8,085
See all stories featuring: Hawaii
[in-text-ad]

12. Idaho: Kamiah
> 2010-2017 population change: -12.3% (state: +8.6%)
> Median household income: $36,905 (state: $50,985)
> Annual unemployment: 5.3% (state: 3.3%)
> Total population: 1,267
See all stories featuring: Idaho
 24/7 Wall St.
13. Illinois: Mount Carroll
> 2010-2017 population change: -19.1% (state: +0.9%)
> Median household income: $42,404 (state: $61,229)
> Annual unemployment: 3% (state: 4.8%)
> Total population: 1,475
See all stories featuring: Illinois

14. Indiana: Shorewood Forest
> 2010-2017 population change: -16.7% (state: +3.1%)
> Median household income: $102,950 (state: $52,182)
> Annual unemployment: 1% (state: 3.9%)
> Total population: 2,512
See all stories featuring: Indiana
[in-text-ad-2]

15. Iowa: Reinbeck
> 2010-2017 population change: -17.1% (state: +3.4%)
> Median household income: $59,453 (state: $56,570)
> Annual unemployment: 4% (state: 2.8%)
> Total population: 1,628
See all stories featuring: Iowa

16. Kansas: Belleville
> 2010-2017 population change: -15.9% (state: +0.9%)
> Median household income: $42,406 (state: $61,229)
> Annual unemployment: 4.5% (state: 4.8%)
> Total population: 42,283
See all stories featuring: Kansas
[in-text-ad]

17. Kentucky: Fort Knox
> 2010-2017 population change: -23.8% (state: +3.2%)
> Median household income: $55,196 (state: $46,535)
> Annual unemployment: 1.6% (state: 4.0%)
> Total population: 9,092
See all stories featuring: Kentucky

18. Louisiana: Jefferson
> 2010-2017 population change: -13.1% (state: +5.3%)
> Median household income: $46,199 (state: $46,710)
> Annual unemployment: 3.8% (state: 4.3%)
> Total population: 10,469
See all stories featuring: Louisiana

19. Maine: Madawaska
> 2010-2017 population change: -18.4% (state: +0.2%)
> Median household income: $37,753 (state: $53,024)
> Annual unemployment: 0% (state: 3.3%)
> Total population: 2,816
See all stories featuring: Maine
[in-text-ad-2]

20. Maryland: Friendship Heights Village
> 2010-2017 population change: -12.4% (state: +5.3%)
> Median household income: $92,593 (state: $78,916)
> Annual unemployment: 2.6% (state: 4.1%)
> Total population: 5,051
See all stories featuring: Maryland

21. Massachusetts: North Scituate
> 2010-2017 population change: -11.0% (state: +4.8%)
> Median household income: $104,159 (state: $74,167)
> Annual unemployment: 4% (state: 4.0%)
> Total population: 4,890
See all stories featuring: Massachusetts
[in-text-ad]
22. Michigan: Beecher
> 2010-2017 population change: -19.9% (state: -0.3%)
> Median household income: $23,856 (state: $52,668)
> Annual unemployment: 11.3% (state: 4.5%)
> Total population: 9,490
See all stories featuring: Michigan
 24/7 Wall St.
23. Minnesota: Appleton
> 2010-2017 population change: -33.5% (state: +4.7%)
> Median household income: $35,300 (state: $65,699)
> Annual unemployment: 5.6% (state: 3.0%)
> Total population: 1,449
See all stories featuring: Minnesota

24. Mississippi: Winona
> 2010-2017 population change: -12.3% (state: +4.7%)
> Median household income: $43,551 (state: $65,699)
> Annual unemployment: 4.8% (state: 3.0%)
> Total population: 27,153
See all stories featuring: Mississippi
[in-text-ad-2]
25. Missouri: Spanish Lake
> 2010-2017 population change: -15.1% (state: +2.6%)
> Median household income: $37,929 (state: $51,542)
> Annual unemployment: 10.6% (state: 3.6%)
> Total population: 18,511
See all stories featuring: Missouri

26. Montana: Malmstrom AFB
> 2010-2017 population change: -18.5% (state: +5.8%)
> Median household income: $48,787 (state: $50,801)
> Annual unemployment: 1.8% (state: 3.0%)
> Total population: 3,929
See all stories featuring: Montana
[in-text-ad]

27. Nebraska: Fairbury
> 2010-2017 population change: -6.3% (state: +0.9%)
> Median household income: $42,808 (state: $61,229)
> Annual unemployment: 3.2% (state: 4.8%)
> Total population: 3,558
See all stories featuring: Nebraska

28. Nevada: Hawthorne
> 2010-2017 population change: -26.1% (state: +9.7%)
> Median household income: $42,250 (state: $55,434)
> Annual unemployment: 11.4% (state: 5.1%)
> Total population: 2,689
See all stories featuring: Nevada

29. New Hampshire: Exeter
> 2010-2017 population change: -3.4% (state: +1.4%)
> Median household income: $66,412 (state: $71,305)
> Annual unemployment: 3.2% (state: 3.0%)
> Total population: 9,130
See all stories featuring: New Hampshire
[in-text-ad-2]

30. New Jersey: Leisure Village East
> 2010-2017 population change: -24.4% (state: +2.7%)
> Median household income: $43,915 (state: $76,475)
> Annual unemployment: 3.6% (state: 4.6%)
> Total population: 3,526
See all stories featuring: New Jersey

31. New Mexico: Nambe
> 2010-2017 population change: -11.4% (state: +3.6%)
> Median household income: $45,750 (state: $46,718)
> Annual unemployment: 4.1% (state: 4.5%)
> Total population: 1,876
See all stories featuring: New Mexico
[in-text-ad]

32. New York: West Point
> 2010-2017 population change: -30.8% (state: +3.0%)
> Median household income: $100,039 (state: $62,765)
> Annual unemployment: 0.5% (state: 4.3%)
> Total population: 6,536
See all stories featuring: New York

33. North Carolina: Plymouth
> 2010-2017 population change: -8.0% (state: +8.4%)
> Median household income: $18,314 (state: $50,320)
> Annual unemployment: 4.5% (state: 4.4%)
> Total population: 3,599
See all stories featuring: North Carolina

34. North Dakota: Carrington
> 2010-2017 population change: -9.5% (state: +13.0%)
> Median household income: $54,722 (state: $61,285)
> Annual unemployment: 0.1% (state: 1.9%)
> Total population: 1,923
See all stories featuring: North Dakota
[in-text-ad-2]
35. Ohio: Wheelersburg
> 2010-2017 population change: -12.9% (state: +0.8%)
> Median household income: $52,500 (state: $52,407)
> Annual unemployment: 2% (state: 4.1%)
> Total population: 6,183
See all stories featuring: Ohio

36. Oklahoma: Watonga
> 2010-2017 population change: -42.9% (state: +6.0%)
> Median household income: $51,891 (state: $49,767)
> Annual unemployment: 1.2% (state: 3.5%)
> Total population: 2,932
See all stories featuring: Oklahoma
[in-text-ad]

37. Oregon: Altamont
> 2010-2017 population change: -6.9% (state: +7.0%)
> Median household income: $41,048 (state: $56,119)
> Annual unemployment: 5% (state: 4.2%)
> Total population: 18,975
See all stories featuring: Oregon

38. Pennsylvania: West Wyomissing
> 2010-2017 population change: -18.9% (state: +1.4%)
> Median household income: $62,612 (state: $56,951)
> Annual unemployment: 2.9% (state: 4.1%)
> Total population: 3,195
See all stories featuring: Pennsylvania

39. Rhode Island: Greenville
> 2010-2017 population change: -4.3% (state: +0.0%)
> Median household income: $77,219 (state: $61,043)
> Annual unemployment: 3.6% (state: 4.4%)
> Total population: 8,388
See all stories featuring: Rhode Island
[in-text-ad-2]

40. South Carolina: Allendale
> 2010-2017 population change: -14.0% (state: +8.5%)
> Median household income: $19,420 (state: $48,781)
> Annual unemployment: 14.8% (state: 4.3%)
> Total population: 3,120
See all stories featuring: South Carolina

41. South Dakota: Fort Thompson
> 2010-2017 population change: -11.0% (state: +7.0%)
> Median household income: $25,125 (state: $54,126)
> Annual unemployment: 9.4% (state: 2.6%)
> Total population: 1,271
See all stories featuring: South Dakota
[in-text-ad]

42. Tennessee: Belle Meade
> 2010-2017 population change: -10.6% (state: +5.8%)
> Median household income: $195,000 (state: $48,708)
> Annual unemployment: 0.2% (state: 4.0%)
> Total population: 2,584
See all stories featuring: Tennessee

43. Texas: San Elizario
> 2010-2017 population change: -35.5% (state: +12.8%)
> Median household income: $26,807 (state: $57,051)
> Annual unemployment: 6.3% (state: 3.7%)
> Total population: 9,213
See all stories featuring: Texas

44. Utah: Richmond
> 2010-2017 population change: -2.3% (state: +6.4%)
> Median household income: $61,045 (state: $67,169)
> Annual unemployment: 5.7% (state: 4.8%)
> Total population: 108,853
See all stories featuring: Utah
[in-text-ad-2]

45. Vermont: St. Johnsbury
> 2010-2017 population change: -13.9% (state: +0.1%)
> Median household income: $36,958 (state: $57,808)
> Annual unemployment: 2.6% (state: 2.9%)
> Total population: 5,789
See all stories featuring: Vermont

46. Virginia: Gloucester Point
> 2010-2017 population change: -10.7% (state: +6.7%)
> Median household income: $55,600 (state: $68,766)
> Annual unemployment: 1.9% (state: 3.5%)
> Total population: 9,291
See all stories featuring: Virginia
[in-text-ad]

47. Washington: Davenport
> 2010-2017 population change: -22.4% (state: +9.5%)
> Median household income: $42,015 (state: $50,883)
> Annual unemployment: 2.4% (state: 4.2%)
> Total population: 3,665
See all stories featuring: Washington

48. West Virginia: Bethlehem
> 2010-2017 population change: -13.1% (state: -0.2%)
> Median household income: $70,288 (state: $44,061)
> Annual unemployment: 3.5% (state: 3.8%)
> Total population: 2,459
See all stories featuring: West Virginia
49. Wisconsin: Park Falls
> 2010-2017 population change: -15.2% (state: +2.2%)
> Median household income: $36,250 (state: $56,759)
> Annual unemployment: 1.7% (state: 3.1%)
> Total population: 2,294
See all stories featuring: Wisconsin
[in-text-ad-2]

50. Wyoming: Thermopolis
> 2010-2017 population change: -5.8% (state: +6.9%)
> Median household income: $50,417 (state: $60,938)
> Annual unemployment: 2.3% (state: 3.1%)
> Total population: 2,935
See all stories featuring: Wyoming
Methodology
To identify the fastest-shrinking place in every state, 24/7 Wall St. reviewed population change from 2010 to 2017 in nearly 15,000 cities, towns, villages, and Census designated places with populations of at least 1,000. We only considered places where the margin of error for population was less than 10%. All data are five-year estimates from the U.S. Census Bureau’s American Community Survey. We also reviewed data on median household income and annual unemployment for 2017 from the ACS.
It’s Your Money, Your Future—Own It (sponsor)
Are you ahead, or behind on retirement? For families with more than $500,000 saved for retirement, finding a financial advisor who puts your interest first can be the difference, and today it’s easier than ever. SmartAsset’s free tool matches you with up to three fiduciary financial advisors who serve your area in minutes. Each advisor has been carefully vetted and must act in your best interests. Start your search now.
If you’ve saved and built a substantial nest egg for you and your family, don’t delay; get started right here and help your retirement dreams become a retirement reality.
Thank you for reading! Have some feedback for us?
Contact the 24/7 Wall St. editorial team.
Latest from 24/7


Our expert who first called NVIDIA in 2009 is predicting 2025 will see a historic AI breakthrough.
You can follow him investing $500,000 of his own money on our top AI stocks for free.