
Everyone has different weather preferences. Some people enjoy the crisp, cool air of an autumn morning, while others look forward to a hot summer day so they can go to the beach. But nearly everyone can agree that sweltering temperatures over 100 degrees, or blizzards occurring in sub-zero temperatures are no fun.
Most people enjoy their weather in a Goldilocks zone — not too hot, not too cold; not too rainy, but not too dry either. 24/7 Wall St. reviewed weather records from the National Oceanic and Atmospheric Administration’s Global Historical Climatology Network to determine the cities with the best weather. We selected places with climates that rarely get excessively hot, cold, rainy, or dry, among other factors.
While the cities on this list may have the most pleasant weather in the country right now, that may not be the case for much longer. We are already feeling the effects of climate change, as winters grow more intense and summer heat waves get hotter and longer than ever before. In fact, June 2019 was the hottest month in world history. While some effects will be felt the world over, certain areas will face major changes. These cities will have unrecognizable weather in 30 years.
Severe weather events are not just unpleasant, but they can also be dangerous and even deadly. States spend millions of dollars ensuring that their infrastructure can withstand high winds, heavy rains, or huge snowfalls. But not every place is equally prepared to deal with a natural disaster. These are the states least prepared for a weather emergency.
Click here to see the cities with the best weather
Methodology
To determine the cities with the best weather, we created an index of minimum, maximum, and average temperature, precipitation, cloud cover, wind, humidity, and more. While many people would choose a warm climate over a freezing cold one, for many there are some climates that are just too hot. We rewarded places with fewer rainy days per year, as most people prefer a precipitation-free, sunny day over rain or snow. We also penalized places that get too little precipitation, however, as an arid climate can hurt vegetation and lead to wildfires and water restrictions. All values were indexed using min-max normalization to create a composite score for each city. Any city missing data for five or more measures was excluded from consideration. All data was derived from the National Oceanic and Atmospheric Administration’s (NOAA) 2018 Comparative Climate Data and The 30-Year Climate Normals for 1980-2010, maintained by the Global Historical Climatology Network (GHCN).

25. Washington, D.C.
> Avg. annual temperature: 58.1 °F
> Avg. days of rain per year: 114 days
> Avg. days below freezing per year: 67 days
> Avg. sunny days per year: 96 days
[in-text-ad]

24. El Paso, Texas
> Avg. annual temperature: 64.5 °F
> Avg. days of rain per year: 48 days
> Avg. days below freezing per year: 54 days
> Avg. sunny days per year: 193 days
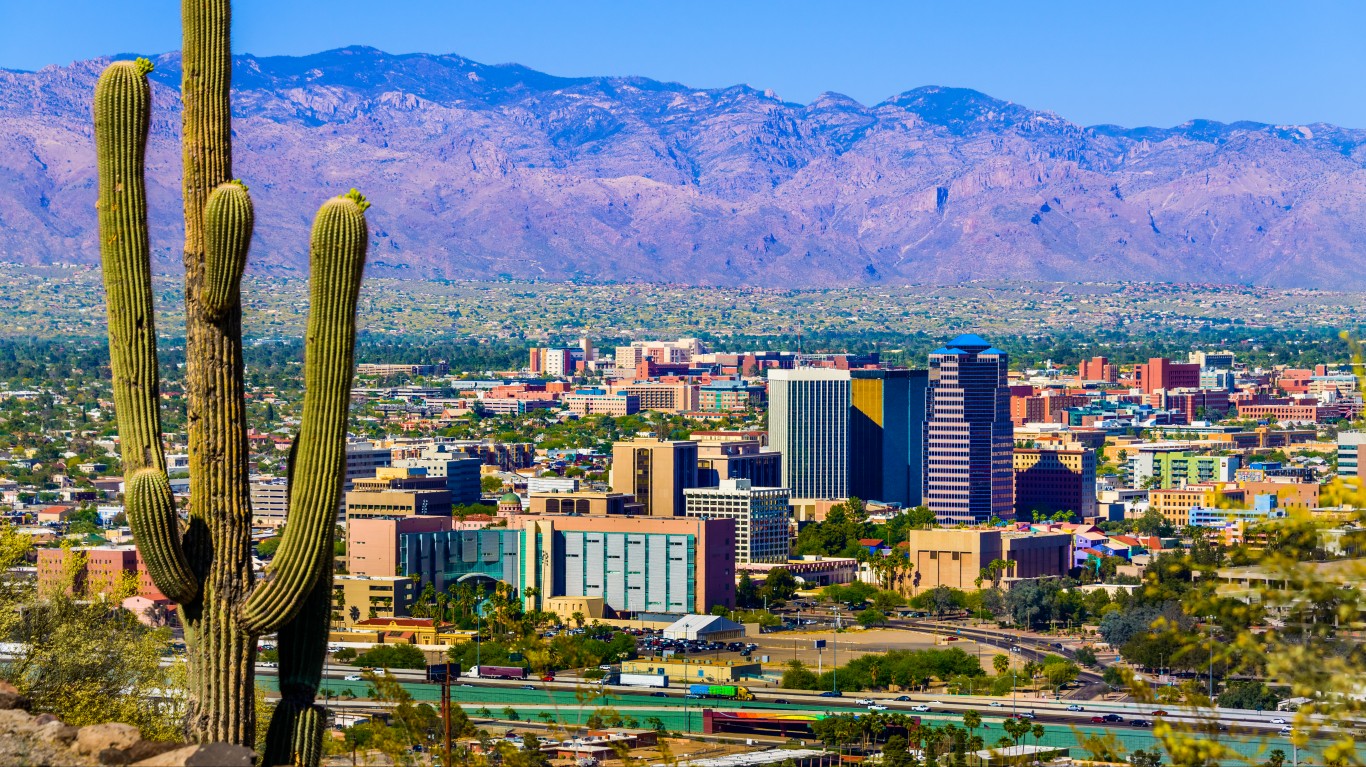
23. Tucson, Arizona
> Avg. annual temperature: 69.2 °F
> Avg. days of rain per year: 51 days
> Avg. days below freezing per year: 16 days
> Avg. sunny days per year: 193 days
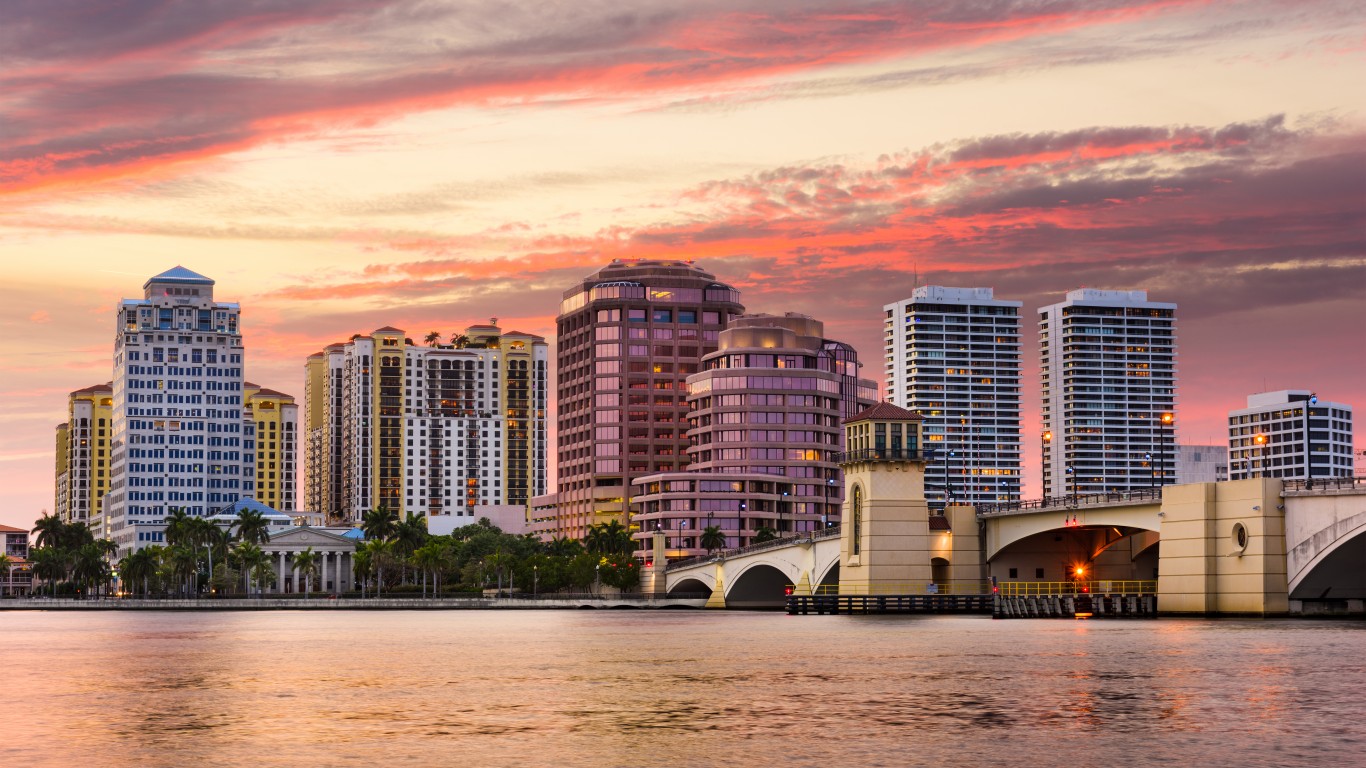
22. West Palm Beach, Florida
> Avg. annual temperature: 75.4 °F
> Avg. days of rain per year: 133 days
> Avg. days below freezing per year: 0 days
> Avg. sunny days per year: 75 days
[in-text-ad-2]

21. Brownsville, Texas
> Avg. annual temperature: 74.5 °F
> Avg. days of rain per year: 72 days
> Avg. days below freezing per year: 2 days
> Avg. sunny days per year: 96 days
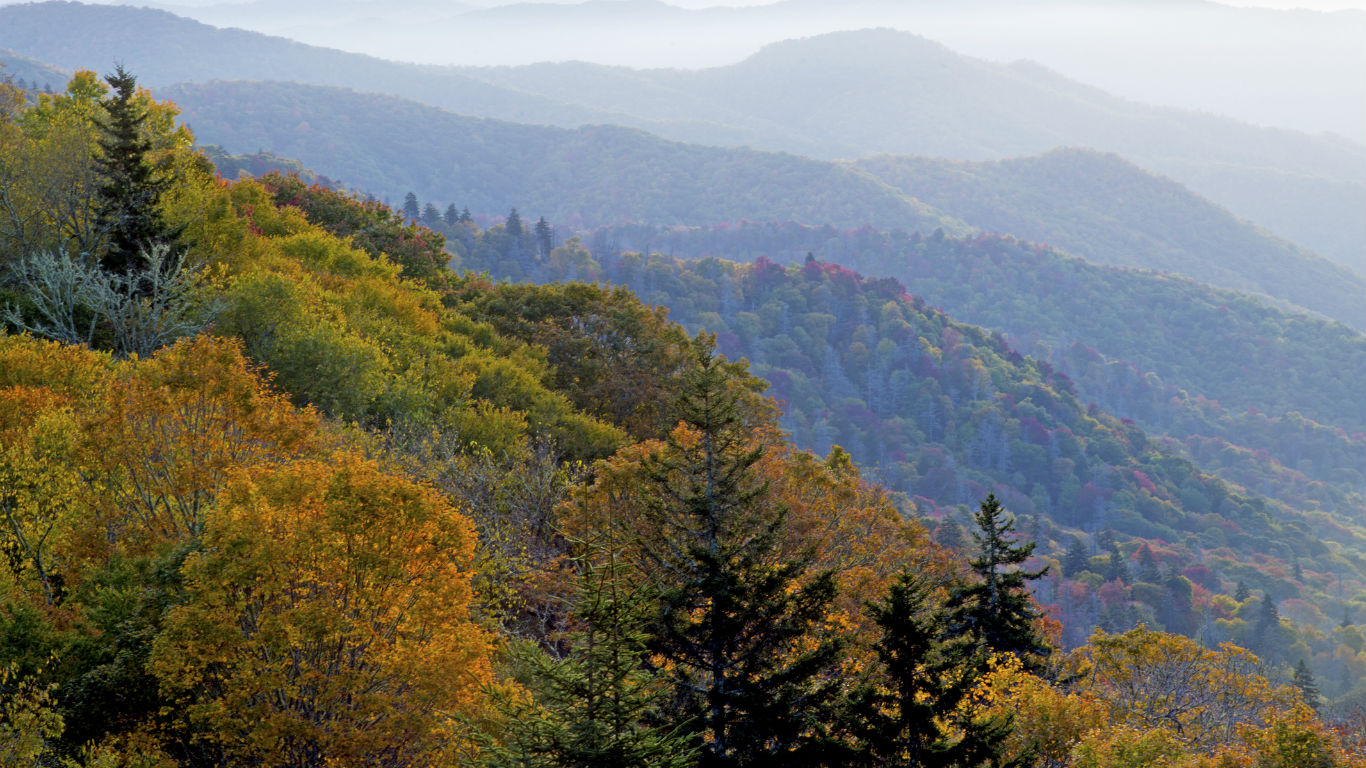
20. Oak Ridge, Tennessee
> Avg. annual temperature: 58.5 °F
> Avg. days of rain per year: 129 days
> Avg. days below freezing per year: 83 days
> Avg. sunny days per year: 109 days
[in-text-ad]

19. Sacramento, California
> Avg. annual temperature: 61.0 °F
> Avg. days of rain per year: 57 days
> Avg. days below freezing per year: 18 days
> Avg. sunny days per year: 188 days
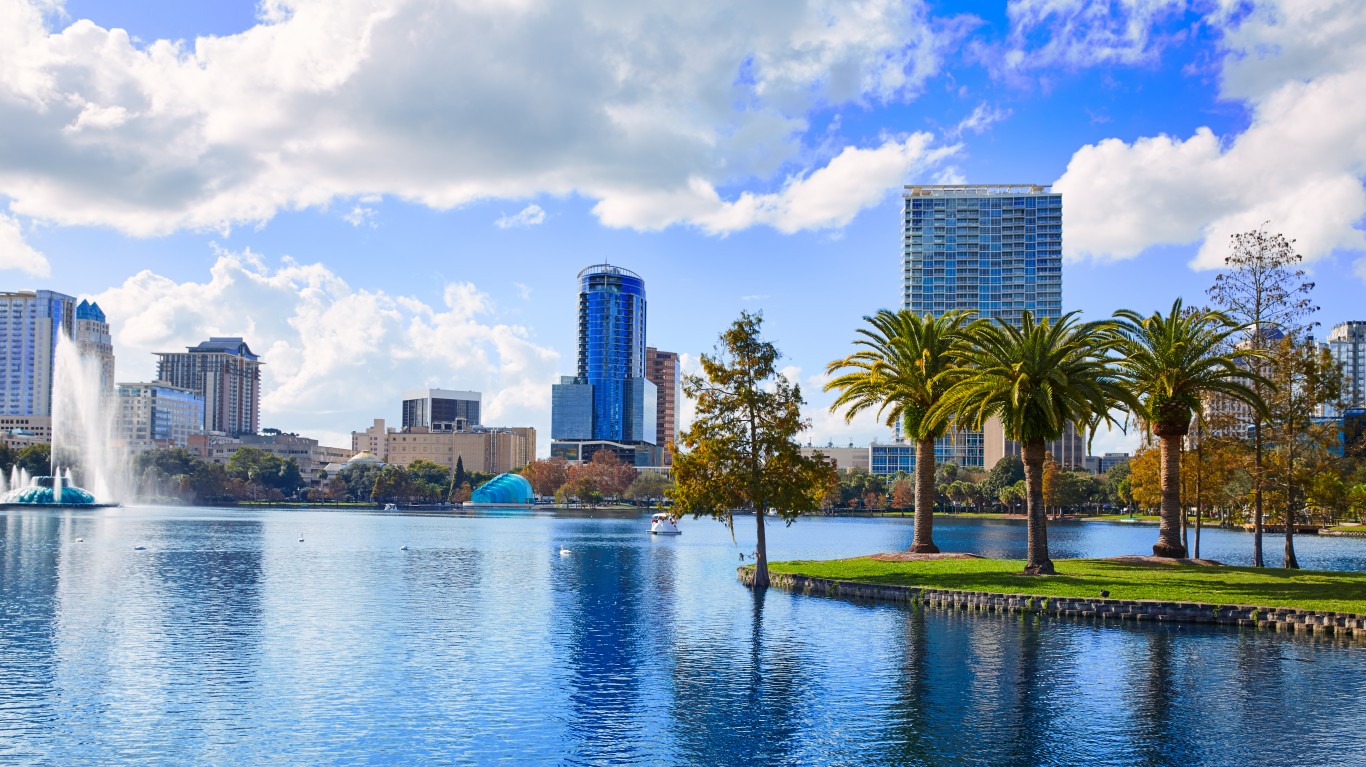
18. Orlando, Florida
> Avg. annual temperature: 73.3 °F
> Avg. days of rain per year: 117 days
> Avg. days below freezing per year: 2 days
> Avg. sunny days per year: 89 days

17. Bakersfield, California
> Avg. annual temperature: 65.2 °F
> Avg. days of rain per year: 37 days
> Avg. days below freezing per year: 13 days
> Avg. sunny days per year: 191 days
[in-text-ad-2]

16. Las Vegas, Nevada
> Avg. annual temperature: 68.3 °F
> Avg. days of rain per year: 26 days
> Avg. days below freezing per year: 26 days
> Avg. sunny days per year: 210 days
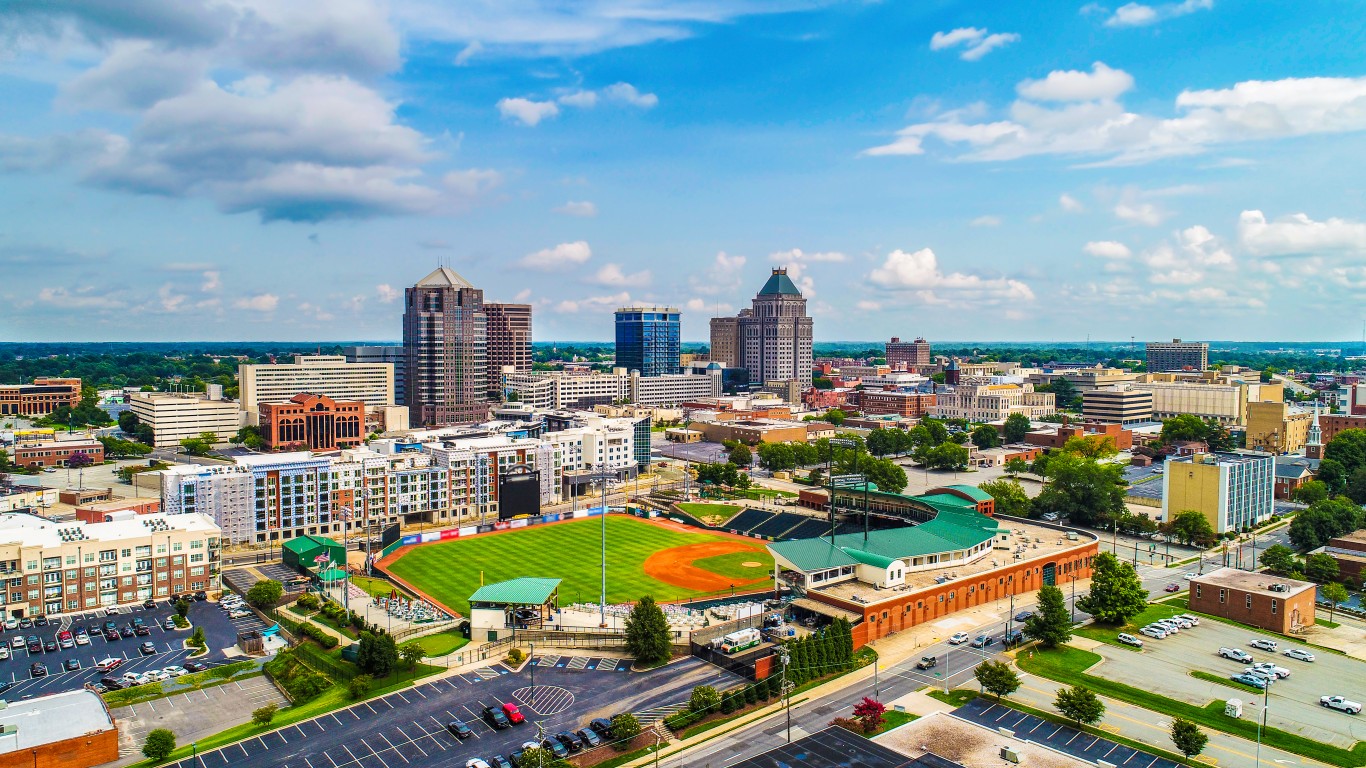
15. Greensboro, North Carolina
> Avg. annual temperature: 59.1 °F
> Avg. days of rain per year: 116 days
> Avg. days below freezing per year: 81 days
> Avg. sunny days per year: 109 days
[in-text-ad]

14. Fort Myers, Florida
> Avg. annual temperature: 75.1 °F
> Avg. days of rain per year: 112 days
> Avg. days below freezing per year: 1 days
> Avg. sunny days per year: 98 days

13. San Francisco, California
> Avg. annual temperature: 58.2 °F
> Avg. days of rain per year: 67 days
> Avg. days below freezing per year: 0 days
> Avg. sunny days per year: 160 days
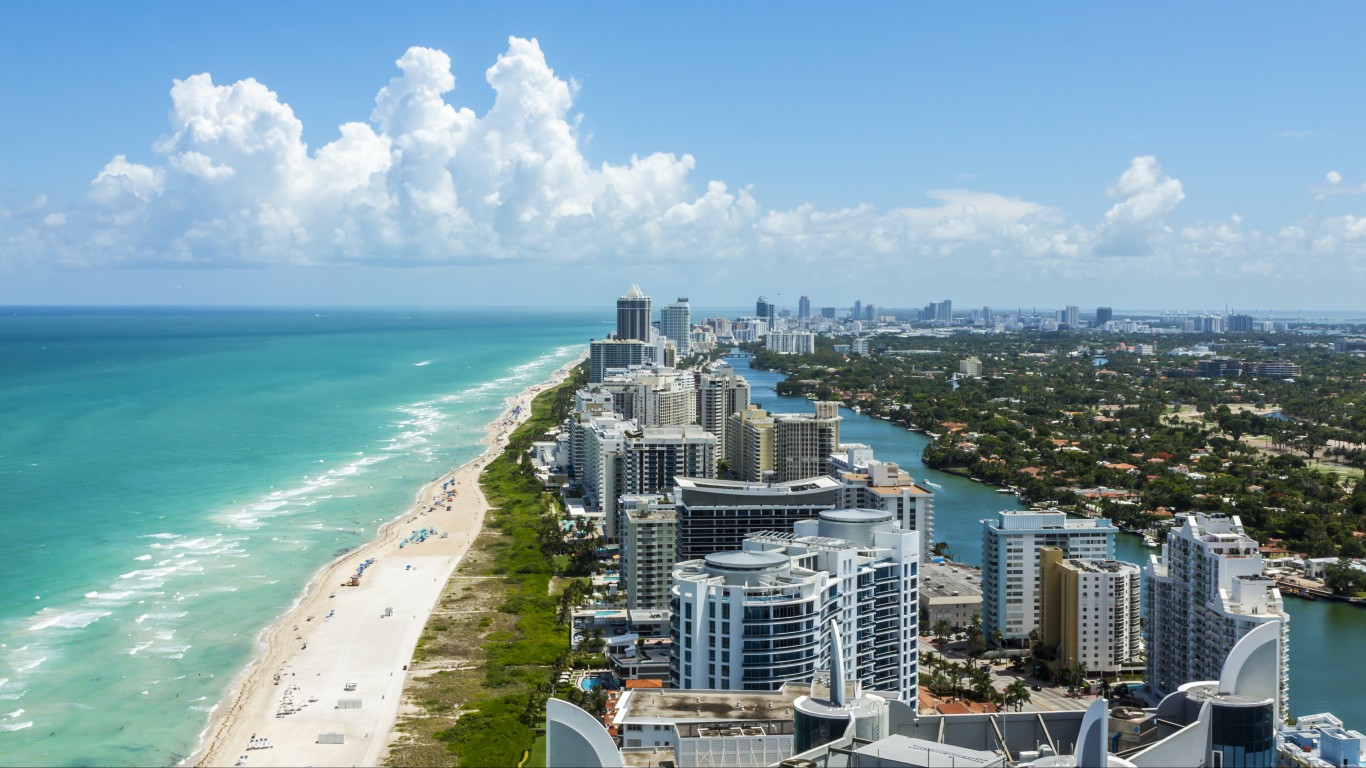
12. Miami, Florida
> Avg. annual temperature: 77.2 °F
> Avg. days of rain per year: 133 days
> Avg. days below freezing per year: 0 days
> Avg. sunny days per year: 74 days
[in-text-ad-2]
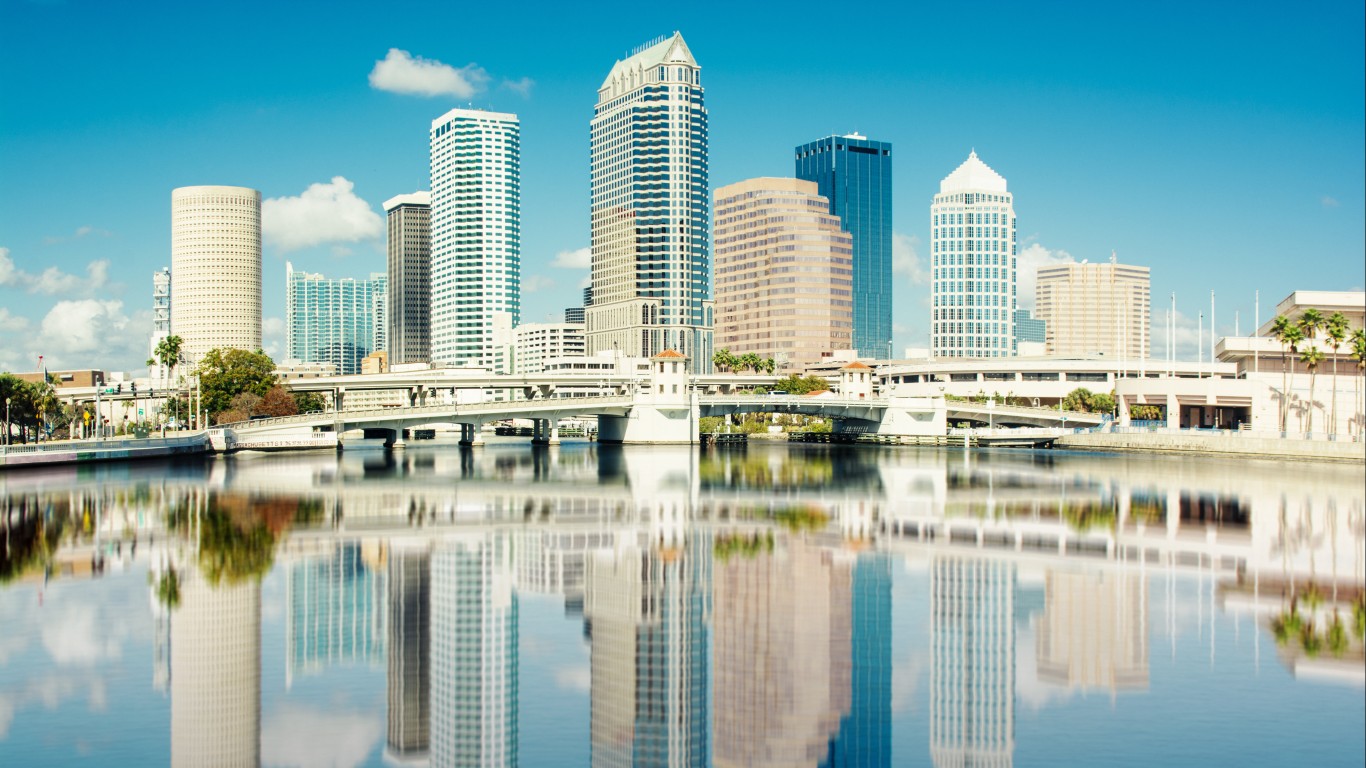
11. Tampa, Florida
> Avg. annual temperature: 73.4 °F
> Avg. days of rain per year: 107 days
> Avg. days below freezing per year: 2 days
> Avg. sunny days per year: 101 days
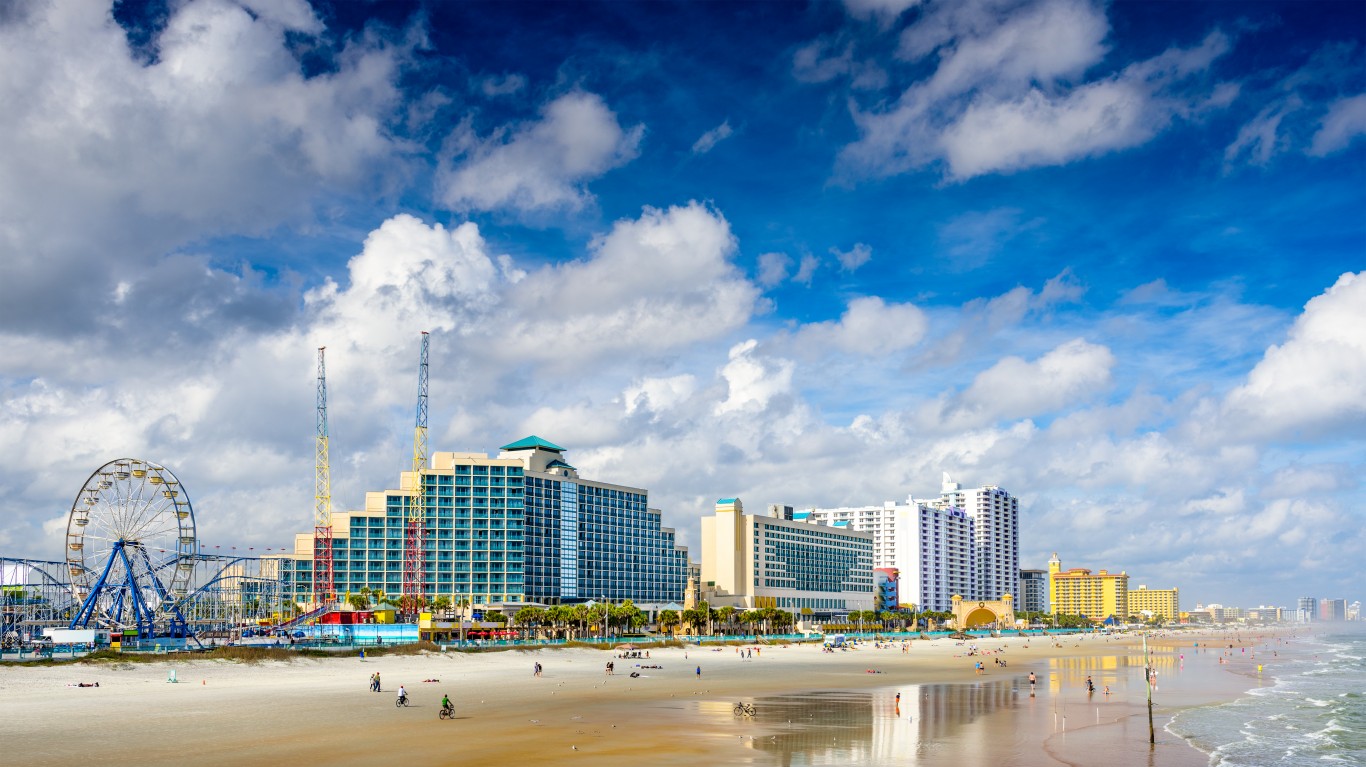
10. Daytona Beach, Florida
> Avg. annual temperature: 70.8 °F
> Avg. days of rain per year: 116 days
> Avg. days below freezing per year: 5 days
> Avg. sunny days per year: 97 days
[in-text-ad]

9. Key West, Florida
> Avg. annual temperature: 78.0 °F
> Avg. days of rain per year: 107 days
> Avg. days below freezing per year: 0 days
> Avg. sunny days per year: 104 days

8. Santa Maria, California
> Avg. annual temperature: 57.5 °F
> Avg. days of rain per year: 46 days
> Avg. days below freezing per year: 15 days
> Avg. sunny days per year: 176 days

7. Lihue, Hawaii
> Avg. annual temperature: 75.8 °F
> Avg. days of rain per year: 196 days
> Avg. days below freezing per year: 0 days
> Avg. sunny days per year: 56 days
[in-text-ad-2]

6. Kahului, Hawaii
> Avg. annual temperature: 75.8 °F
> Avg. days of rain per year: 88 days
> Avg. days below freezing per year: 0 days
> Avg. sunny days per year: 131 days

5. San Diego, California
> Avg. annual temperature: 63.6 °F
> Avg. days of rain per year: 41 days
> Avg. days below freezing per year: 0 days
> Avg. sunny days per year: 146 days
[in-text-ad]

4. Long Beach, California
> Avg. annual temperature: 64.7 °F
> Avg. days of rain per year: 34 days
> Avg. days below freezing per year: 1 days
> Avg. sunny days per year: 159 days
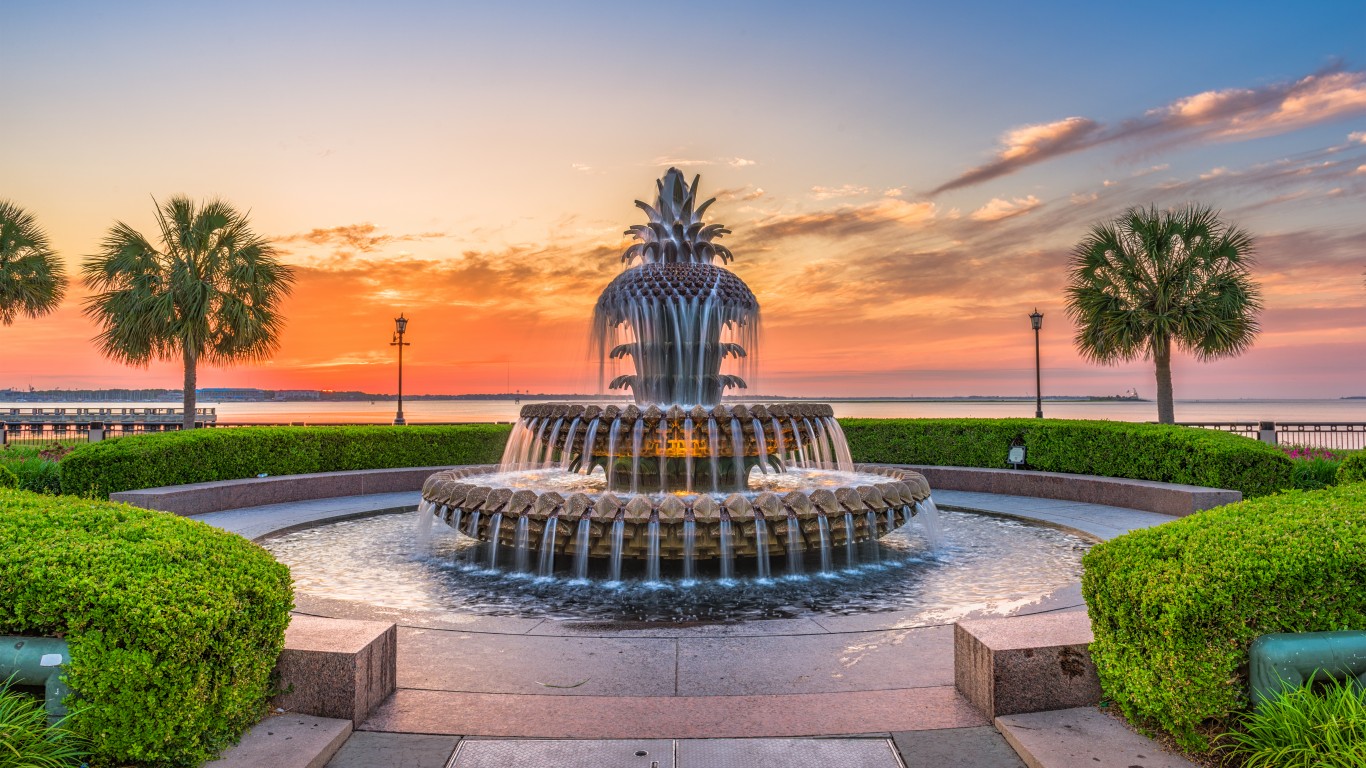
3. Charleston, South Carolina
> Avg. annual temperature: 65.8 °F
> Avg. days of rain per year: 107 days
> Avg. days below freezing per year: 10 days
> Avg. sunny days per year: 102 days

2. Honolulu, Hawaii
> Avg. annual temperature: 77.7 °F
> Avg. days of rain per year: 93 days
> Avg. days below freezing per year: 0 days
> Avg. sunny days per year: 90 days
[in-text-ad-2]

1. Los Angeles, California
> Avg. annual temperature: 62.6 °F
> Avg. days of rain per year: 35 days
> Avg. days below freezing per year: 0 days
> Avg. sunny days per year: 147 days
“The Next NVIDIA” Could Change Your Life
If you missed out on NVIDIA’s historic run, your chance to see life-changing profits from AI isn’t over.
The 24/7 Wall Street Analyst who first called NVIDIA’s AI-fueled rise in 2009 just published a brand-new research report named “The Next NVIDIA.”
Click here to download your FREE copy.
Thank you for reading! Have some feedback for us?
Contact the 24/7 Wall St. editorial team.
 24/7 Wall St.
 24/7 Wall St.
 24/7 Wall St.
 24/7 Wall St.

