Special Report
The Fastest Growing and Shrinking State Economies

Published:
Last Updated:

The pace of economic growth in the United States slowed to 2.1% in the sec ond quarter, down from 3.1% in the first three months of 2019. The relatively modest second quarter growth was nonetheless historic, marking over 10 years of economic expansion — the longest continual stretch on record.
The U.S. economy is no more than the sum of its parts, and the unprecedented GDP growth nationwide is attributable to local economic success stories across the 50 states. Of course, not all state economies are growing at the same rate — or even at all.
Using data from the Bureau of Economic Analysis, 24/7 Wall St. reviewed 2018 GDP growth by state to identify the fastest growing and shrinking state economies. States are ranked from weakest GDP growth to strongest.
The professional and business services industry contributed more to overall economic growth than any other industry last year. While much has been made of the decline of the American manufacturing industry in recent years, manufacturing was the second largest economic driver in 2018. In just over half of all states, the manufacturing sector contributed more to GDP growth than any other industry. These states include Illinois, Indiana, and Michigan — states that are home to some of America’s most iconic manufacturing hubs. These are the cities where manufacturing is making a comeback.
It is important to note that GDP growth is not the only indicator of a state’s economic vitality. Other factors like the unemployment rate, poverty rate, incomes, and education level of the labor force are also useful in any assessment of a given state economy’s strengths and weaknesses. Still, rapid GDP growth is often indicative of strong fundamentals, and many of the highest ranking states on this list have healthy economies overall. Based on these broader measures, these are the states with the best and worst economies.
Click here to see the fastest growing and shrinking state economies
Click here to read our methodology

50. Alaska
> 2018 GDP change: -0.3%
> 2018 GDP: $52.3 billion (6th smallest)
> Largest contributor to growth: Educational services, health care, and social assistance
> 1-yr. pop. change: -0.3% (4th lowest)
[in-text-ad]

49. Wyoming
> 2018 GDP change: +0.3%
> 2018 GDP: $38.4 billion (2nd smallest)
> Largest contributor to growth: Real estate and rental and leasing
> 1-yr. pop. change: -1.1% (the lowest)

48. Delaware
> 2018 GDP change: +0.3%
> 2018 GDP: $63.9 billion (9th smallest)
> Largest contributor to growth: Manufacturing
> 1-yr. pop. change: +1.0% (13th highest)

47. Rhode Island
> 2018 GDP change: +0.6%
> 2018 GDP: $53.7 billion (7th smallest)
> Largest contributor to growth: Real estate and rental and leasing
> 1-yr. pop. change: +0.3% (15th lowest)
[in-text-ad-2]

46. Montana
> 2018 GDP change: +0.9%
> 2018 GDP: $44.8 billion (3rd smallest)
> Largest contributor to growth: Real estate and rental and leasing
> 1-yr. pop. change: +0.8% (16th highest)

45. Arkansas
> 2018 GDP change: +0.9%
> 2018 GDP: $115.9 billion (17th smallest)
> Largest contributor to growth: Manufacturing
> 1-yr. pop. change: +0.5% (24th highest)
[in-text-ad]

44. Connecticut
> 2018 GDP change: +1.0%
> 2018 GDP: $242.2 billion (23rd largest)
> Largest contributor to growth: Manufacturing
> 1-yr. pop. change: +0.3% (16th lowest)

43. Hawaii
> 2018 GDP change: +1.0%
> 2018 GDP: $80.8 billion (13th smallest)
> Largest contributor to growth: Real estate and rental and leasing
> 1-yr. pop. change: -0.1% (7th lowest)

42. Mississippi
> 2018 GDP change: +1.0%
> 2018 GDP: $101.6 billion (15th smallest)
> Largest contributor to growth: Educational services, health care, and social assistance
> 1-yr. pop. change: -0.2% (5th lowest)
[in-text-ad-2]

41. Louisiana
> 2018 GDP change: +1.1%
> 2018 GDP: $231.2 billion (24th largest)
> Largest contributor to growth: Professional and business services
> 1-yr. pop. change: +0.1% (9th lowest)

40. Vermont
> 2018 GDP change: +1.2%
> 2018 GDP: $30.0 billion (the smallest)
> Largest contributor to growth: Manufacturing
> 1-yr. pop. change: -0.2% (6th lowest)
[in-text-ad]

39. South Dakota
> 2018 GDP change: +1.3%
> 2018 GDP: $45.9 billion (4th smallest)
> Largest contributor to growth: Manufacturing
> 1-yr. pop. change: +0.5% (24th lowest)

38. Kentucky
> 2018 GDP change: +1.4%
> 2018 GDP: $186.1 billion (22nd smallest)
> Largest contributor to growth: Manufacturing
> 1-yr. pop. change: +0.4% (23rd lowest)
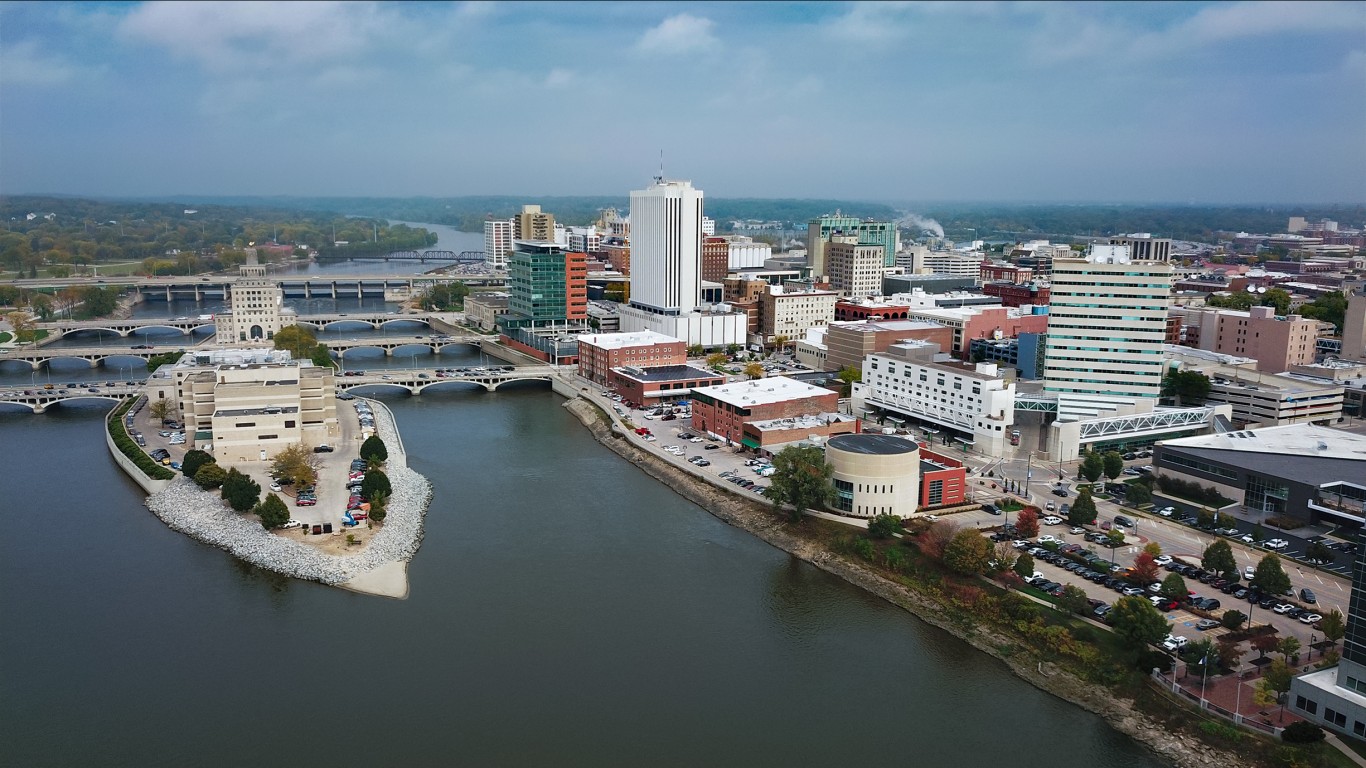
37. Iowa
> 2018 GDP change: +1.4%
> 2018 GDP: $170.7 billion (21st smallest)
> Largest contributor to growth: Manufacturing
> 1-yr. pop. change: +0.4% (21st lowest)
[in-text-ad-2]

36. Nebraska
> 2018 GDP change: +1.5%
> 2018 GDP: $112.2 billion (16th smallest)
> Largest contributor to growth: Manufacturing
> 1-yr. pop. change: +0.7% (21st highest)

35. Maryland
> 2018 GDP change: +1.6%
> 2018 GDP: $367.9 billion (15th largest)
> Largest contributor to growth: Professional and business services
> 1-yr. pop. change: +0.6% (23rd highest)
[in-text-ad]

34. South Carolina
> 2018 GDP change: +1.6%
> 2018 GDP: $202.8 billion (25th smallest)
> Largest contributor to growth: Manufacturing
> 1-yr. pop. change: +1.3% (7th highest)

33. New Mexico
> 2018 GDP change: +1.8%
> 2018 GDP: $92.6 billion (14th smallest)
> Largest contributor to growth: Mining, quarrying, and oil and gas extraction
> 1-yr. pop. change: +0.3% (19th lowest)

32. Ohio
> 2018 GDP change: +1.8%
> 2018 GDP: $601.5 billion (7th largest)
> Largest contributor to growth: Manufacturing
> 1-yr. pop. change: +0.4% (22nd lowest)
[in-text-ad-2]

31. Oklahoma
> 2018 GDP change: +1.8%
> 2018 GDP: $193.0 billion (23rd smallest)
> Largest contributor to growth: Manufacturing
> 1-yr. pop. change: +0.2% (11th lowest)

30. Indiana
> 2018 GDP change: +1.9%
> 2018 GDP: $326.1 billion (18th largest)
> Largest contributor to growth: Manufacturing
> 1-yr. pop. change: +0.5% (25th lowest)
[in-text-ad]

29. Kansas
> 2018 GDP change: +1.9%
> 2018 GDP: $152.3 billion (19th smallest)
> Largest contributor to growth: Manufacturing
> 1-yr. pop. change: +0.2% (12th lowest)

28. Maine
> 2018 GDP change: +1.9%
> 2018 GDP: $56.7 billion (8th smallest)
> Largest contributor to growth: Professional and business services
> 1-yr. pop. change: +0.3% (17th lowest)

27. New Jersey
> 2018 GDP change: +2.0%
> 2018 GDP: $554.7 billion (8th largest)
> Largest contributor to growth: Professional and business services
> 1-yr. pop. change: +0.7% (20th highest)
[in-text-ad-2]

26. Alabama
> 2018 GDP change: +2.0%
> 2018 GDP: $196.9 billion (24th smallest)
> Largest contributor to growth: Manufacturing
> 1-yr. pop. change: +0.2% (13th lowest)

25. New York
> 2018 GDP change: +2.1%
> 2018 GDP: $1.4 trillion (3rd largest)
> Largest contributor to growth: Information
> 1-yr. pop. change: +0.5% (25th highest)
[in-text-ad]

24. Pennsylvania
> 2018 GDP change: +2.1%
> 2018 GDP: $712.1 billion (6th largest)
> Largest contributor to growth: Information
> 1-yr. pop. change: +0.2% (10th lowest)

23. Illinois
> 2018 GDP change: +2.1%
> 2018 GDP: $764.2 billion (5th largest)
> Largest contributor to growth: Manufacturing
> 1-yr. pop. change: +0.0% (8th lowest)

22. Minnesota
> 2018 GDP change: +2.2%
> 2018 GDP: $331.4 billion (17th largest)
> Largest contributor to growth: Manufacturing
> 1-yr. pop. change: +1.0% (14th highest)
[in-text-ad-2]

21. New Hampshire
> 2018 GDP change: +2.2%
> 2018 GDP: $75.6 billion (12th smallest)
> Largest contributor to growth: Manufacturing
> 1-yr. pop. change: +0.6% (22nd highest)

20. Missouri
> 2018 GDP change: +2.3%
> 2018 GDP: $282.2 billion (22nd largest)
> Largest contributor to growth: Manufacturing
> 1-yr. pop. change: +0.3% (18th lowest)
[in-text-ad]

19. West Virginia
> 2018 GDP change: +2.4%
> 2018 GDP: $71.3 billion (11th smallest)
> Largest contributor to growth: Construction
> 1-yr. pop. change: -0.8% (2nd lowest)

18. North Dakota
> 2018 GDP change: +2.5%
> 2018 GDP: $51.2 billion (5th smallest)
> Largest contributor to growth: Mining, quarrying, and oil and gas extraction
> 1-yr. pop. change: -0.3% (3rd lowest)

17. Wisconsin
> 2018 GDP change: +2.5%
> 2018 GDP: $299.8 billion (21st largest)
> Largest contributor to growth: Manufacturing
> 1-yr. pop. change: +0.3% (14th lowest)
[in-text-ad-2]

16. Georgia
> 2018 GDP change: +2.6%
> 2018 GDP: $522.4 billion (9th largest)
> Largest contributor to growth: Manufacturing
> 1-yr. pop. change: +1.2% (12th highest)

15. Massachusetts
> 2018 GDP change: +2.7%
> 2018 GDP: $501.3 billion (11th largest)
> Largest contributor to growth: Professional and business services
> 1-yr. pop. change: +0.7% (18th highest)
[in-text-ad]

14. Michigan
> 2018 GDP change: +2.7%
> 2018 GDP: $468.4 billion (14th largest)
> Largest contributor to growth: Manufacturing
> 1-yr. pop. change: +0.3% (20th lowest)

13. Virginia
> 2018 GDP change: +2.8%
> 2018 GDP: $476.4 billion (13th largest)
> Largest contributor to growth: Professional and business services
> 1-yr. pop. change: +0.7% (19th highest)

12. North Carolina
> 2018 GDP change: +2.9%
> 2018 GDP: $496.1 billion (12th largest)
> Largest contributor to growth: Manufacturing
> 1-yr. pop. change: +1.2% (8th highest)
[in-text-ad-2]

11. Tennessee
> 2018 GDP change: +3.0%
> 2018 GDP: $322.9 billion (19th largest)
> Largest contributor to growth: Professional and business services
> 1-yr. pop. change: +1.0% (15th highest)

10. Texas
> 2018 GDP change: +3.2%
> 2018 GDP: $1.7 trillion (2nd largest)
> Largest contributor to growth: Professional and business services
> 1-yr. pop. change: +1.6% (6th highest)
[in-text-ad]

9. Nevada
> 2018 GDP change: +3.2%
> 2018 GDP: $146.2 billion (18th smallest)
> Largest contributor to growth: Manufacturing
> 1-yr. pop. change: +2.0% (2nd highest)

8. Oregon
> 2018 GDP change: +3.4%
> 2018 GDP: $213.7 billion (25th largest)
> Largest contributor to growth: Manufacturing
> 1-yr. pop. change: +1.2% (10th highest)
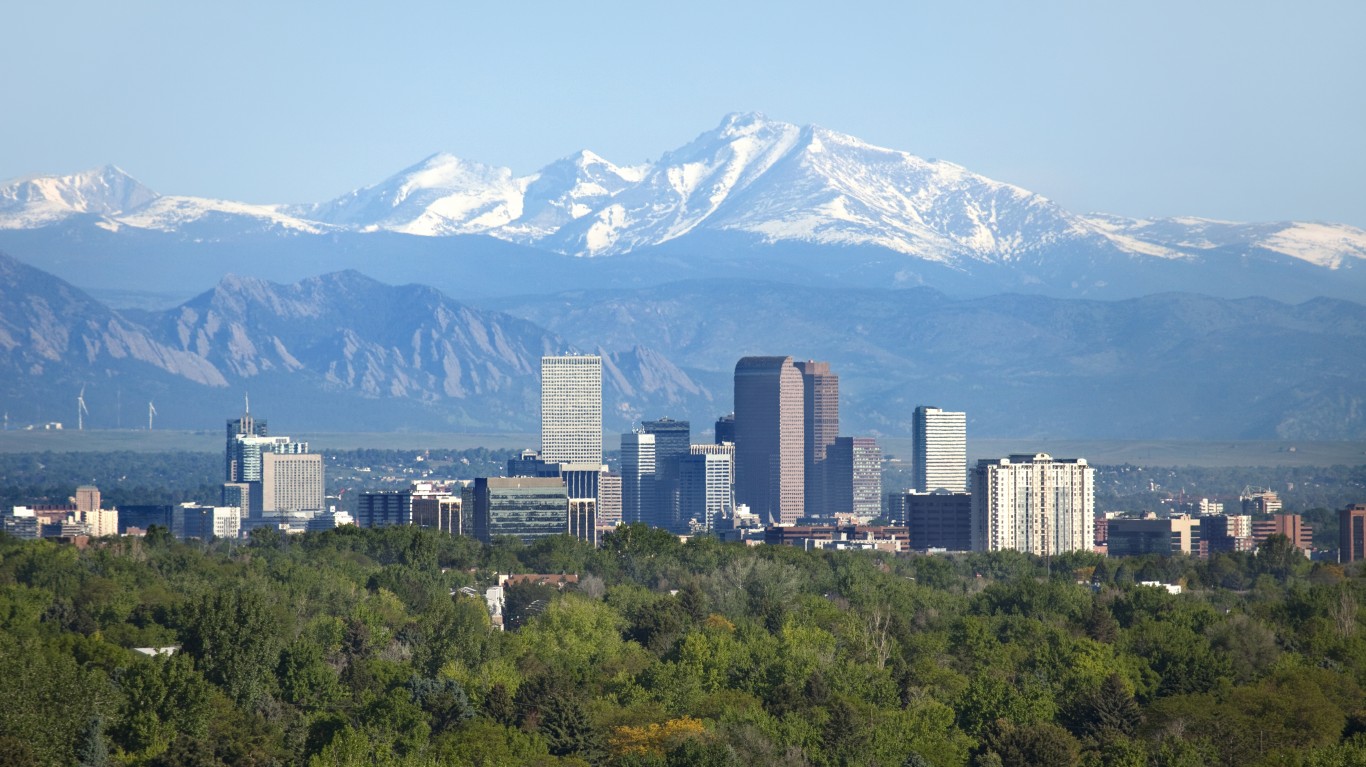
7. Colorado
> 2018 GDP change: +3.5%
> 2018 GDP: $336.4 billion (16th largest)
> Largest contributor to growth: Professional and business services
> 1-yr. pop. change: +1.2% (11th highest)
[in-text-ad-2]

6. California
> 2018 GDP change: +3.5%
> 2018 GDP: $2.7 trillion (the largest)
> Largest contributor to growth: Information
> 1-yr. pop. change: +0.7% (17th highest)

5. Florida
> 2018 GDP change: +3.5%
> 2018 GDP: $917.0 billion (4th largest)
> Largest contributor to growth: Professional and business services
> 1-yr. pop. change: +1.8% (3rd highest)
[in-text-ad]
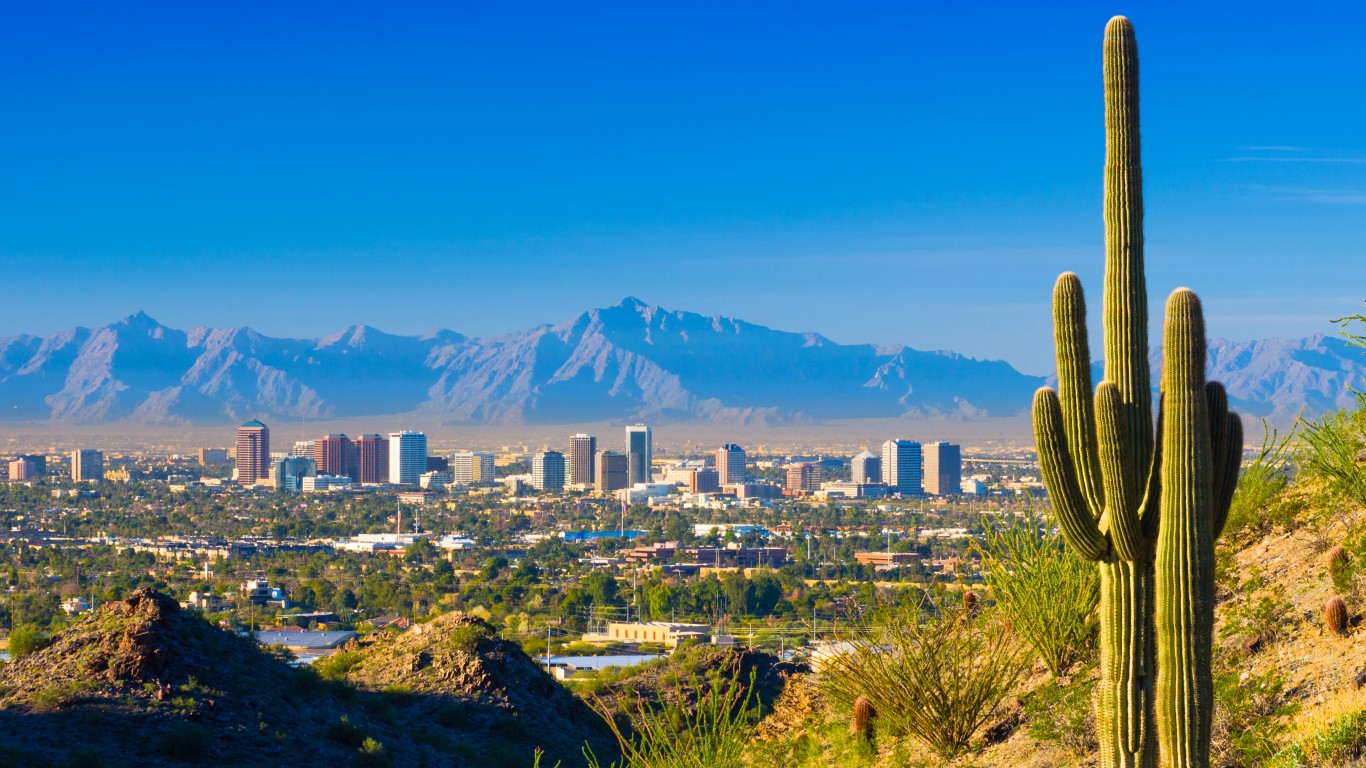
4. Arizona
> 2018 GDP change: +4.0%
> 2018 GDP: $309.1 billion (20th largest)
> Largest contributor to growth: Manufacturing
> 1-yr. pop. change: +1.2% (9th highest)

3. Idaho
> 2018 GDP change: +4.1%
> 2018 GDP: $69.9 billion (10th smallest)
> Largest contributor to growth: Manufacturing
> 1-yr. pop. change: +2.0% (the highest)

2. Utah
> 2018 GDP change: +4.3%
> 2018 GDP: $157.2 billion (20th smallest)
> Largest contributor to growth: Professional and business services
> 1-yr. pop. change: +1.7% (4th highest)
[in-text-ad-2]

1. Washington
> 2018 GDP change: +5.7%
> 2018 GDP: $506.7 billion (10th largest)
> Largest contributor to growth: Information
> 1-yr. pop. change: +1.6% (5th highest)
Methodology
To determine the states with the fastest growing and fastest shrinking economies, 24/7 Wall St. reviewed 2018 real GDP growth rates for all 50 states based on data from the Bureau of Economic Analysis. The real gross domestic product measurement accounts for the effects of inflation on growth. Real GDP and industry-specific GDP figures also came from the BEA. GDP figures published by the BEA for 2018 are preliminary and subject to annual revision. Real GDP figures for past years have already been revised. Population estimates and one-year change in median household income, poverty rate, and other census measures were derived from the American Community Survey 2017 1-Year Estimates. One-year change in employment is from the Bureau of Labor Statistics.
Are you ahead, or behind on retirement? For families with more than $500,000 saved for retirement, finding a financial advisor who puts your interest first can be the difference, and today it’s easier than ever. SmartAsset’s free tool matches you with up to three fiduciary financial advisors who serve your area in minutes. Each advisor has been carefully vetted and must act in your best interests. Start your search now.
If you’ve saved and built a substantial nest egg for you and your family, don’t delay; get started right here and help your retirement dreams become a retirement reality.
Thank you for reading! Have some feedback for us?
Contact the 24/7 Wall St. editorial team.