
Americans’ lifestyle is mostly determined by their income. Another factor, however, is where they live. The cost of everyday necessities, like food, transportation, and rent, varies considerably nationwide and can impact how far an income can stretch.
The cost of living even among the cities considered the most expensive places in their state also varies widely. In the most expensive place in Alabama, a dollar goes about as far as it would in the least expensive place in California. This is the value of a dollar in every state.
These differences in cost of living can be stark not just from state to state, but also city to city within the same state. 24/7 Wall St. compared regional price parity among metropolitan areas, with data from the Bureau of Economic Analysis, to determine the most expensive city in every state.
In some states, even the most expensive metro area has a cheaper cost of living than the state as a whole, indicating that goods and services are more expensive outside of major metro areas. Several states, like Delaware, New Hampshire, and Rhode Island, have only one metropolitan statistical area, so these places are the most expensive by default.
A higher than average cost of living can indicate that a given city is an especially desirable place to live. However, the most expensive city in a state is not necessarily the best city to live in that state. Based on over two dozen measures that can impact overall quality of life, these are the best cities to live in every state.
Click here to see the most expensive city in every state
Click here to read our methodology
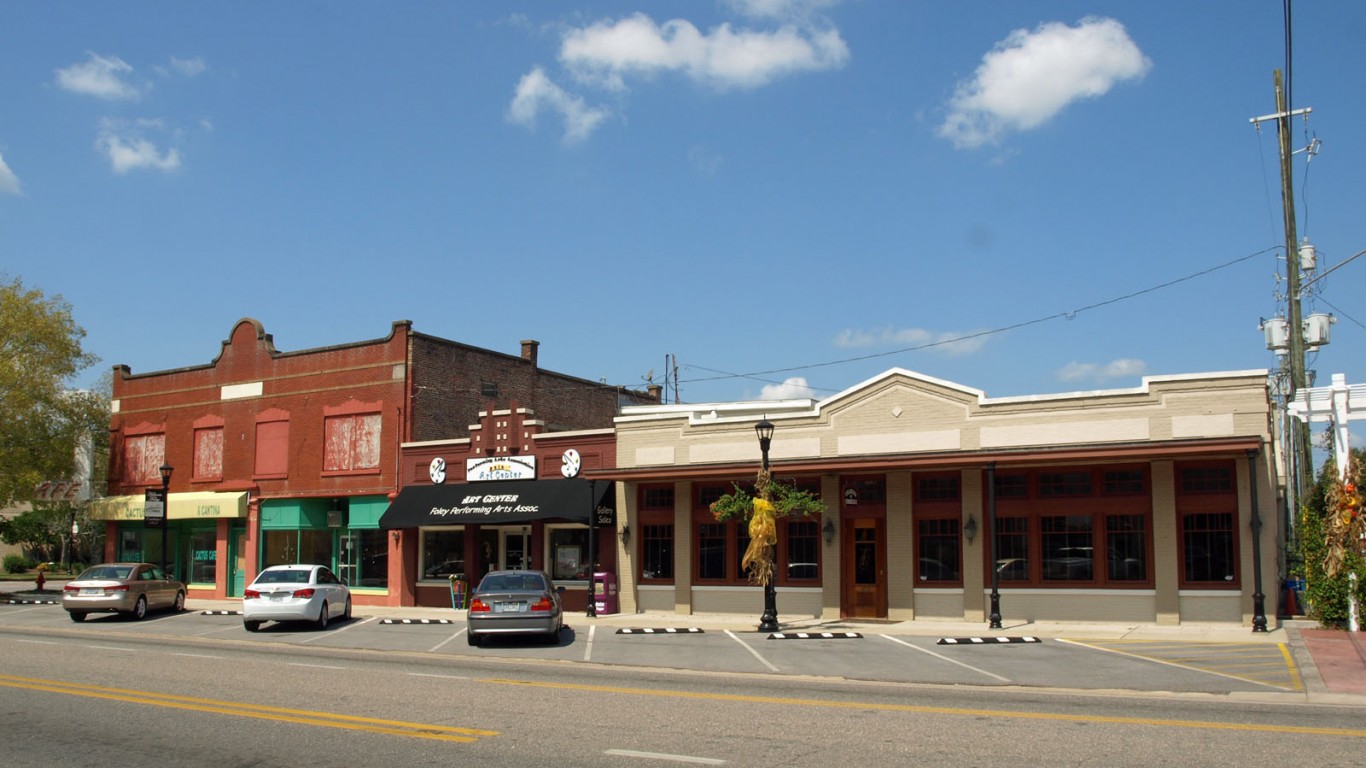
Alabama: Daphne-Fairhope-Foley
> Cost of living in Daphne-Fairhope-Foley: 9.2% less expensive than avg.
> Cost of living in Alabama: 13.3% less expensive than avg.
> Poverty rate: 9.4%
> Median household income: $55,342
See all stories featuring: Alabama
[in-text-ad]
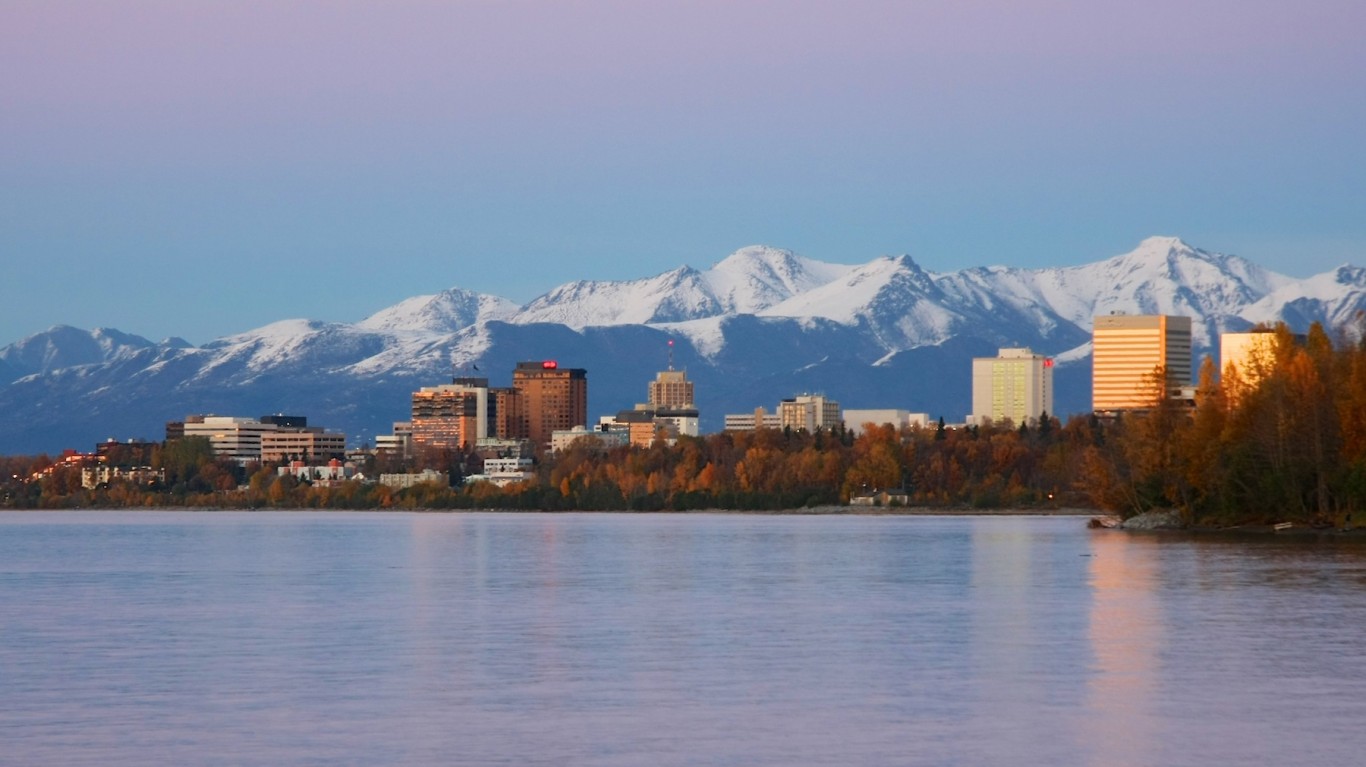
Alaska: Anchorage
> Cost of living in Anchorage: 7.9% more expensive than avg.
> Cost of living in Alaska: 4.4% more expensive than avg.
> Poverty rate: 10.4%
> Median household income: $76,871
See all stories featuring: Alaska

Arizona: Flagstaff
> Cost of living in Flagstaff: 1.1% less expensive than avg.
> Cost of living in Arizona: 3.6% less expensive than avg.
> Poverty rate: 19.0%
> Median household income: $54,893
See all stories featuring: Arizona

Arkansas: Little Rock-North Little Rock-Conway
> Cost of living in Little Rock-North Little Rock-Conway: 9.4% less expensive than avg.
> Cost of living in Arkansas: 13.5% less expensive than avg.
> Poverty rate: 13.0%
> Median household income: $53,173
See all stories featuring: Arkansas
[in-text-ad-2]

California: San Jose-Sunnyvale-Santa Clara
> Cost of living in San Jose-Sunnyvale-Santa Clara: 30.9% more expensive than avg.
> Cost of living in California: 14.8% more expensive than avg.
> Poverty rate: 7.3%
> Median household income: $117,474
See all stories featuring: California

Colorado: Boulder
> Cost of living in Boulder: 8.7% more expensive than avg.
> Cost of living in Colorado: 3.2% more expensive than avg.
> Poverty rate: 13.4%
> Median household income: $80,834
See all stories featuring: Colorado
[in-text-ad]

Connecticut: Bridgeport-Stamford-Norwalk
> Cost of living in Bridgeport-Stamford-Norwalk: 19.1% more expensive than avg.
> Cost of living in Connecticut: 8.0% more expensive than avg.
> Poverty rate: 8.8%
> Median household income: $91,198
See all stories featuring: Connecticut

Delaware: Dover
> Cost of living in Dover: 6.7% less expensive than avg.
> Cost of living in Delaware: 0.1% more expensive than avg.
> Poverty rate: 13.8%
> Median household income: $57,608
See all stories featuring: Delaware
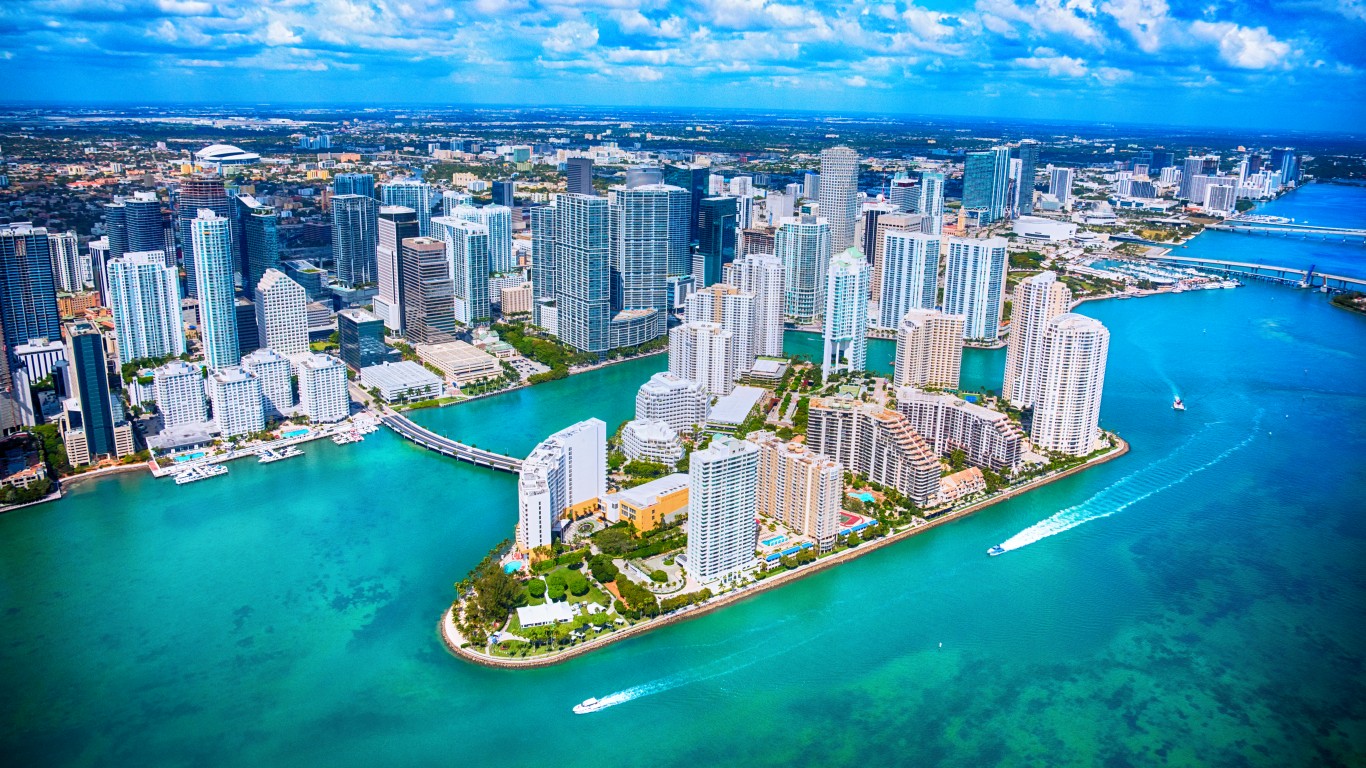
Florida: Miami-Fort Lauderdale-West Palm Beach
> Cost of living in Miami-Fort Lauderdale-West Palm Beach: 8.4% more expensive than avg.
> Cost of living in Florida: 0.1% less expensive than avg.
> Poverty rate: 14.3%
> Median household income: $54,284
See all stories featuring: Florida
[in-text-ad-2]

Georgia: Atlanta-Sandy Springs-Roswell
> Cost of living in Atlanta-Sandy Springs-Roswell: 3.2% less expensive than avg.
> Cost of living in Georgia: 7.5% less expensive than avg.
> Poverty rate: 12.0%
> Median household income: $65,381
See all stories featuring: Georgia

Hawaii: Urban Honolulu
> Cost of living in Urban Honolulu: 24.7% more expensive than avg.
> Cost of living in Hawaii: 18.5% more expensive than avg.
> Poverty rate: 8.4%
> Median household income: $81,284
See all stories featuring: Hawaii
[in-text-ad]

Idaho: Coeur d’Alene
> Cost of living in Coeur d’Alene: 5.5% less expensive than avg.
> Cost of living in Idaho: 7.0% less expensive than avg.
> Poverty rate: 10.1%
> Median household income: $57,219
See all stories featuring: Idaho

Illinois: Chicago-Naperville-Elgin
> Cost of living in Chicago-Naperville-Elgin: 3.4% more expensive than avg.
> Cost of living in Illinois: 1.5% less expensive than avg.
> Poverty rate: 11.8%
> Median household income: $68,403
See all stories featuring: Illinois

Indiana: Bloomington
> Cost of living in Bloomington: 7.5% less expensive than avg.
> Cost of living in Indiana: 10.2% less expensive than avg.
> Poverty rate: 22.7%
> Median household income: $49,043
See all stories featuring: Indiana
[in-text-ad-2]

Iowa: Iowa City
> Cost of living in Iowa City: 5.7% less expensive than avg.
> Cost of living in Iowa: 10.2% less expensive than avg.
> Poverty rate: 15.7%
> Median household income: $60,888
See all stories featuring: Iowa
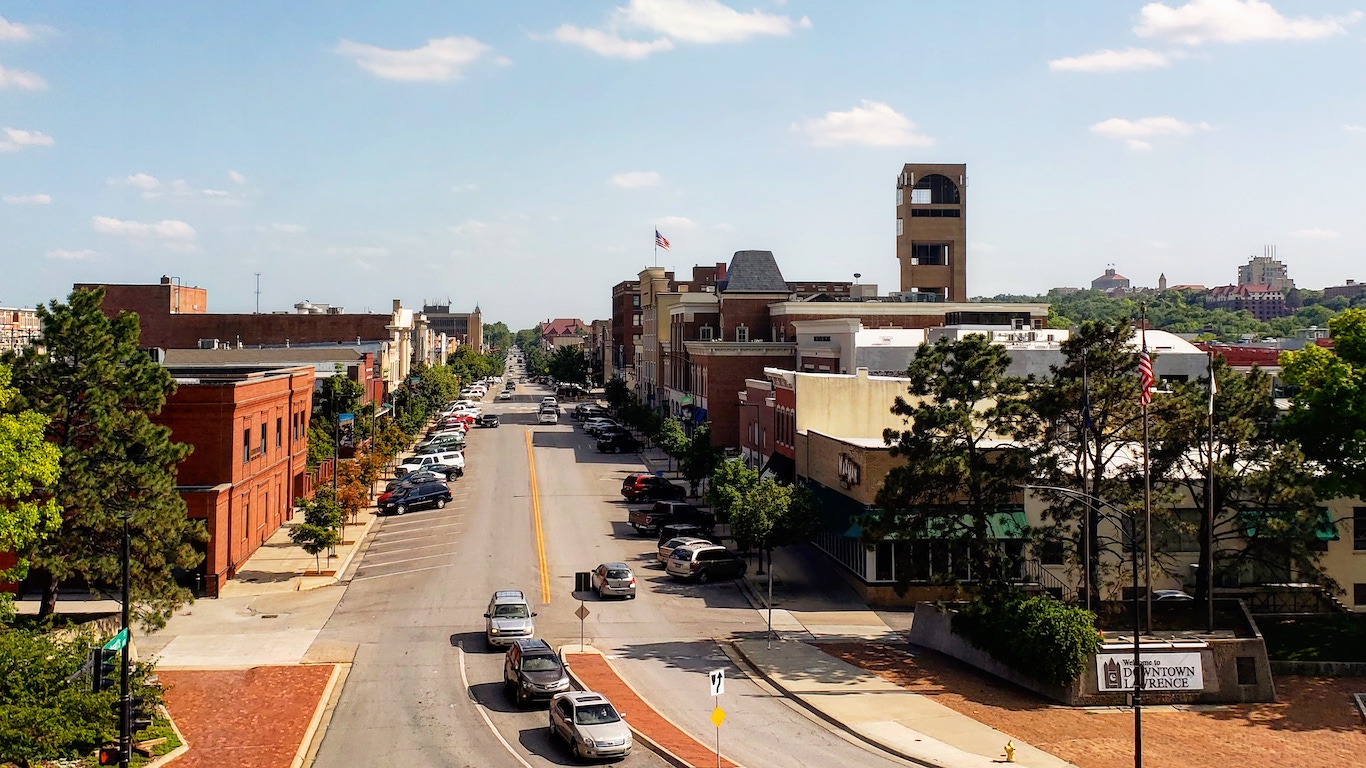
Kansas: Lawrence
> Cost of living in Lawrence: 8.5% less expensive than avg.
> Cost of living in Kansas: 10.0% less expensive than avg.
> Poverty rate: 17.4%
> Median household income: $55,646
See all stories featuring: Kansas
[in-text-ad]
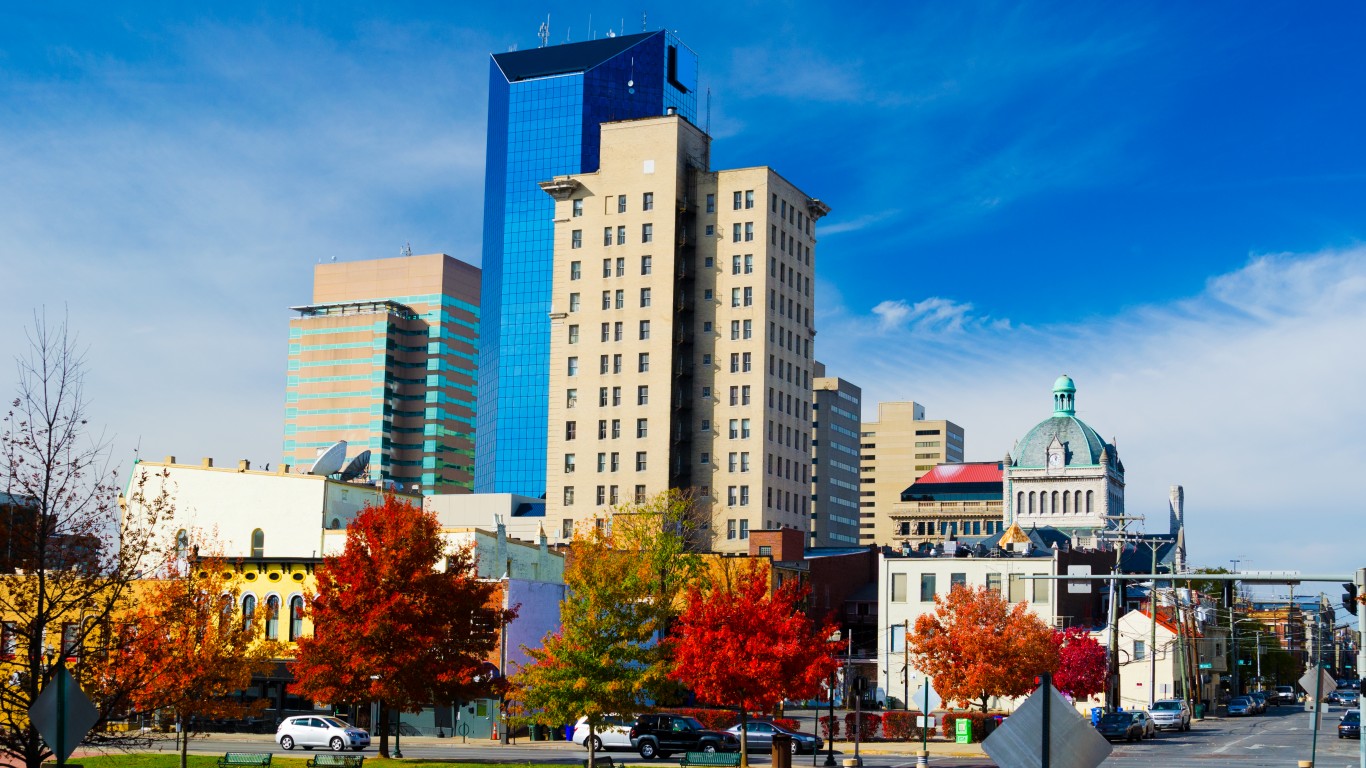
Kentucky: Lexington-Fayette
> Cost of living in Lexington-Fayette: 8.8% less expensive than avg.
> Cost of living in Kentucky: 12.1% less expensive than avg.
> Poverty rate: 15.8%
> Median household income: $58,069
See all stories featuring: Kentucky

Louisiana: New Orleans-Metairie
> Cost of living in New Orleans-Metairie: 4.8% less expensive than avg.
> Cost of living in Louisiana: 9.9% less expensive than avg.
> Poverty rate: 18.6%
> Median household income: $50,528
See all stories featuring: Louisiana

Maine: Portland-South Portland
> Cost of living in Portland-South Portland: 2.3% more expensive than avg.
> Cost of living in Maine: 1.6% less expensive than avg.
> Poverty rate: 7.8%
> Median household income: $68,570
See all stories featuring: Maine
[in-text-ad-2]

Maryland: Baltimore-Columbia-Towson
> Cost of living in Baltimore-Columbia-Towson: 7.2% more expensive than avg.
> Cost of living in Maryland: 9.4% more expensive than avg.
> Poverty rate: 10.2%
> Median household income: $77,394
See all stories featuring: Maryland

Massachusetts: Boston-Cambridge-Newton
> Cost of living in Boston-Cambridge-Newton: 11.8% more expensive than avg.
> Cost of living in Massachusetts: 7.9% more expensive than avg.
> Poverty rate: 9.6%
> Median household income: $85,691
See all stories featuring: Massachusetts
[in-text-ad]
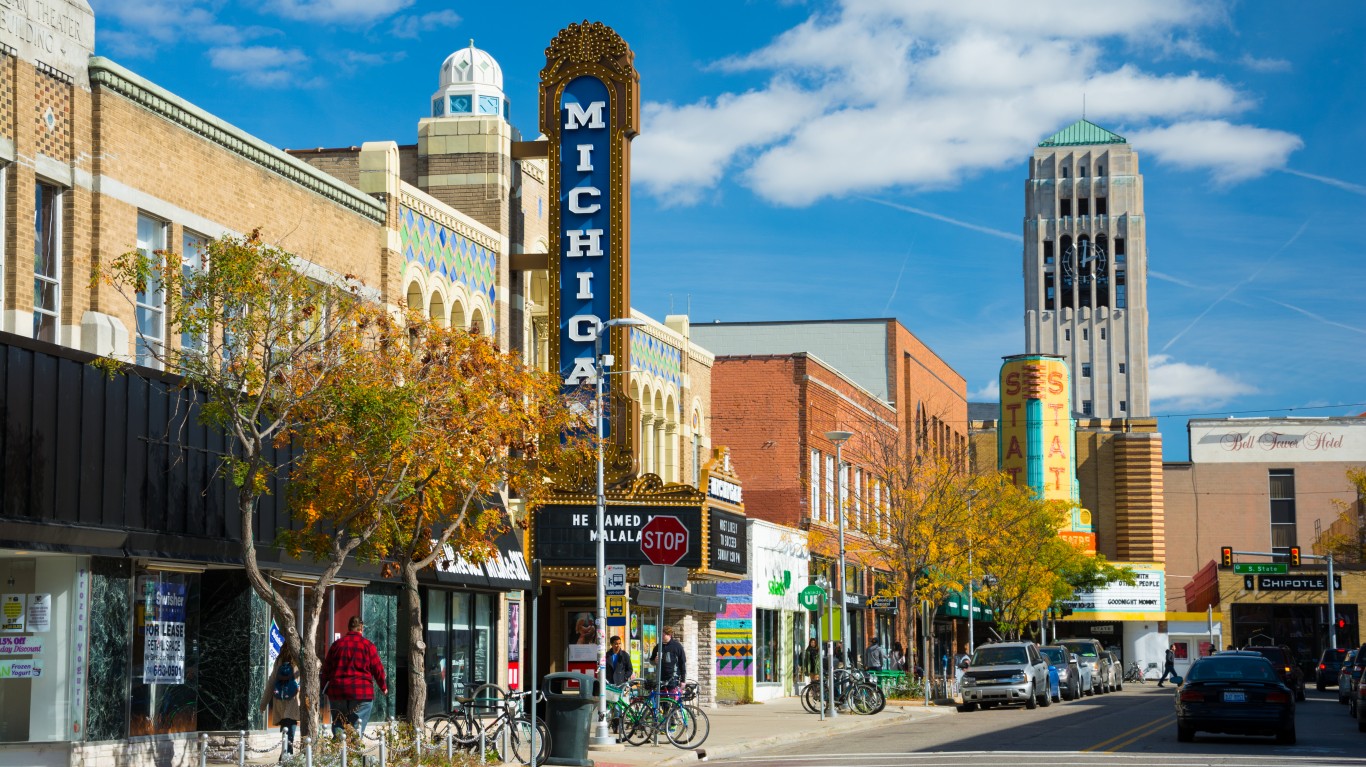
Michigan: Ann Arbor
> Cost of living in Ann Arbor: 1.7% more expensive than avg.
> Cost of living in Michigan: 7.0% less expensive than avg.
> Poverty rate: 13.0%
> Median household income: $70,286
See all stories featuring: Michigan

Minnesota: Minneapolis-St. Paul-Bloomington
> Cost of living in Minneapolis-St. Paul-Bloomington: 2.2% more expensive than avg.
> Cost of living in Minnesota: 2.5% less expensive than avg.
> Poverty rate: 8.1%
> Median household income: $76,856
See all stories featuring: Minnesota

Mississippi: Jackson
> Cost of living in Jackson: 9.8% less expensive than avg.
> Cost of living in Mississippi: 14.3% less expensive than avg.
> Poverty rate: 15.4%
> Median household income: $52,434
See all stories featuring: Mississippi
[in-text-ad-2]

Missouri: Kansas City
> Cost of living in Kansas City: 6.9% less expensive than avg.
> Cost of living in Missouri: 10.5% less expensive than avg.
> Poverty rate: 10.0%
> Median household income: $63,404
See all stories featuring: Missouri
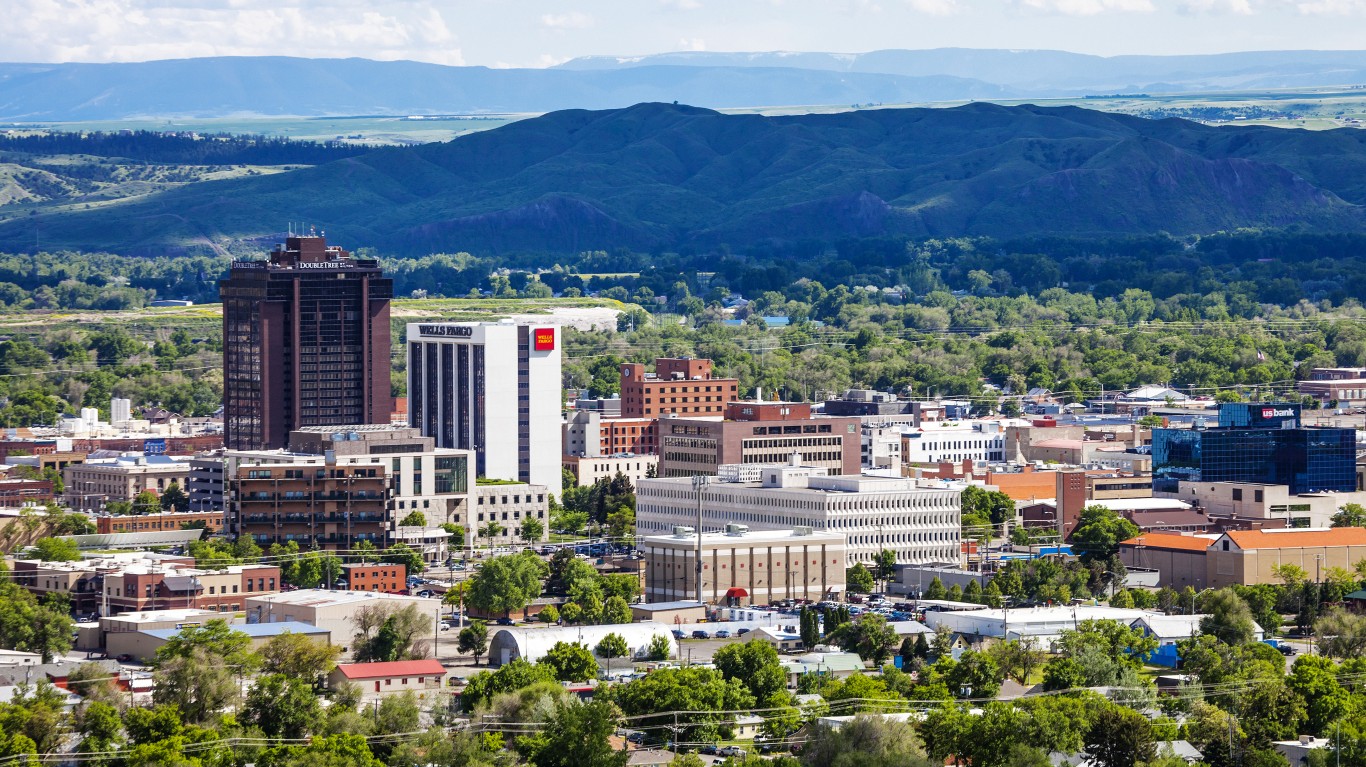
Montana: Billings
> Cost of living in Billings: 2.7% less expensive than avg.
> Cost of living in Montana: 5.4% less expensive than avg.
> Poverty rate: 9.7%
> Median household income: $58,085
See all stories featuring: Montana
[in-text-ad]

Nebraska: Omaha-Council Bluffs
> Cost of living in Omaha-Council Bluffs: 7.5% less expensive than avg.
> Cost of living in Nebraska: 10.4% less expensive than avg.
> Poverty rate: 9.6%
> Median household income: $65,619
See all stories featuring: Nebraska
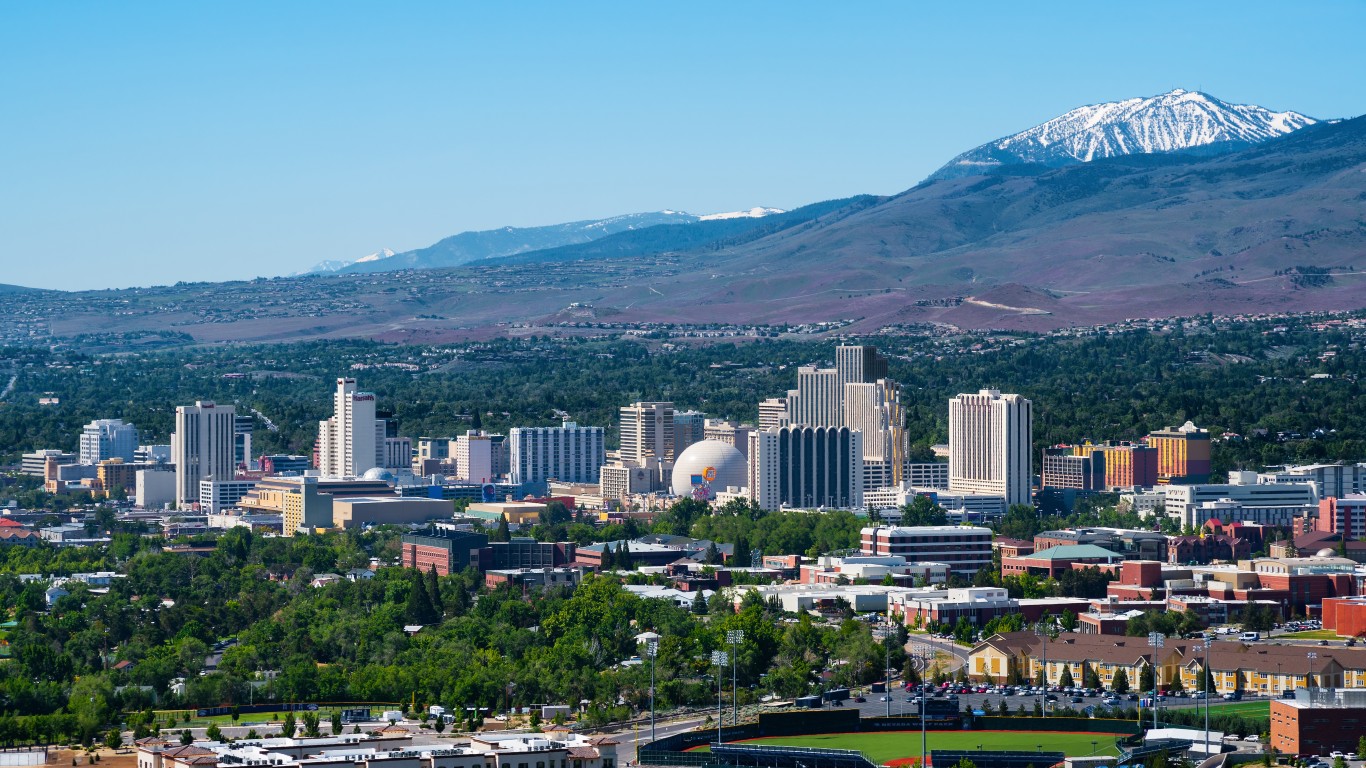
Nevada: Reno
> Cost of living in Reno: 1.2% less expensive than avg.
> Cost of living in Nevada: 2.4% less expensive than avg.
> Poverty rate: 10.8%
> Median household income: $61,360
See all stories featuring: Nevada

New Hampshire: Manchester-Nashua
> Cost of living in Manchester-Nashua: 8.4% more expensive than avg.
> Cost of living in New Hampshire: 5.8% more expensive than avg.
> Poverty rate: 8.2%
> Median household income: $78,769
See all stories featuring: New Hampshire
[in-text-ad-2]

New Jersey: Trenton
> Cost of living in Trenton: 11.6% more expensive than avg.
> Cost of living in New Jersey: 12.9% more expensive than avg.
> Poverty rate: 11.7%
> Median household income: $79,173
See all stories featuring: New Jersey
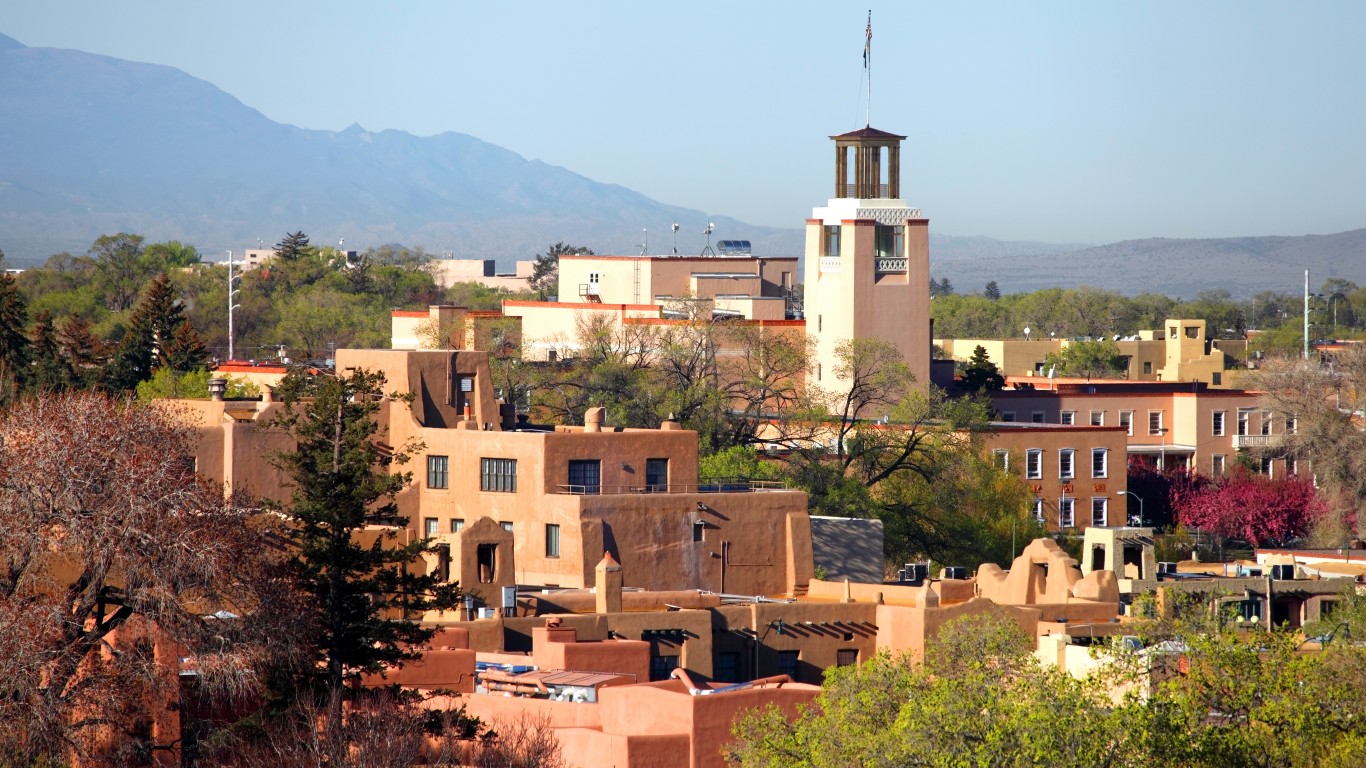
New Mexico: Santa Fe
> Cost of living in Santa Fe: 1.3% less expensive than avg.
> Cost of living in New Mexico: 6.7% less expensive than avg.
> Poverty rate: 11.8%
> Median household income: $58,821
See all stories featuring: New Mexico
[in-text-ad]

New York: New York-Newark-Jersey City
> Cost of living in New York-Newark-Jersey City: 22.3% more expensive than avg.
> Cost of living in New York: 15.8% more expensive than avg.
> Poverty rate: 12.8%
> Median household income: $75,368
See all stories featuring: New York

North Carolina: Raleigh
> Cost of living in Raleigh: 3.8% less expensive than avg.
> Cost of living in North Carolina: 8.7% less expensive than avg.
> Poverty rate: 10.5%
> Median household income: $72,576
See all stories featuring: North Carolina
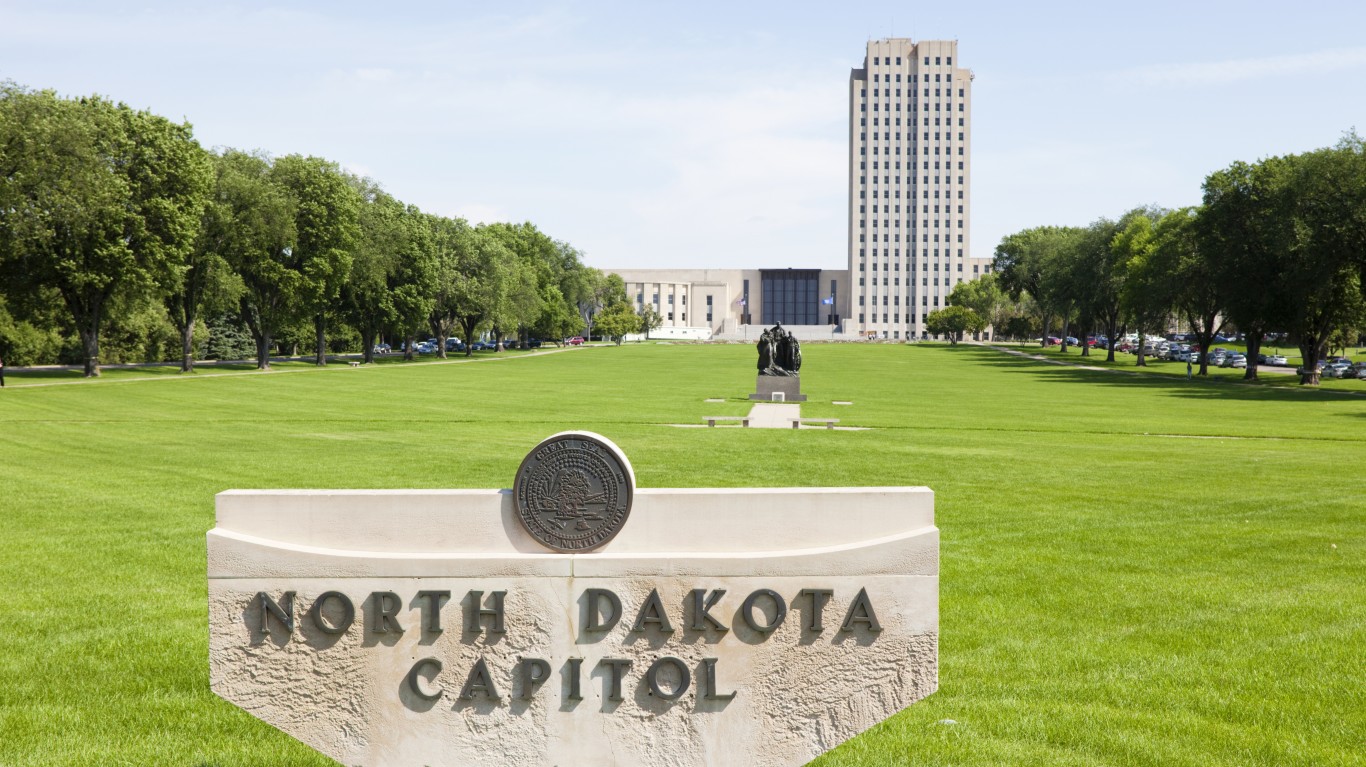
North Dakota: Bismarck
> Cost of living in Dismarck: 7.0% less expensive than avg.
> Cost of living in North Dakota: 9.9% less expensive than avg.
> Poverty rate: 9.1%
> Median household income: $66,087
See all stories featuring: North Dakota
[in-text-ad-2]

Ohio: Columbus
> Cost of living in Columbus: 7.7% less expensive than avg.
> Cost of living in Ohio: 11.1% less expensive than avg.
> Poverty rate: 13.1%
> Median household income: $63,764
See all stories featuring: Ohio

Oklahoma: Oklahoma City
> Cost of living in Oklahoma City: 8.6% less expensive than avg.
> Cost of living in Oklahoma: 11.0% less expensive than avg.
> Poverty rate: 13.9%
> Median household income: $56,260
See all stories featuring: Oklahoma
[in-text-ad]

Oregon: Portland-Vancouver-Hillsboro
> Cost of living in Portland-Vancouver-Hillsboro: 1.7% more expensive than avg.
> Cost of living in Oregon: 0.5% less expensive than avg.
> Poverty rate: 10.9%
> Median household income: $71,931
See all stories featuring: Oregon

Pennsylvania: Philadelphia-Camden-Wilmington
> Cost of living in Philadelphia-Camden-Wilmington: 5.4% more expensive than avg.
> Cost of living in Pennsylvania: 2.1% less expensive than avg.
> Poverty rate: 12.8%
> Median household income: $68,572
See all stories featuring: Pennsylvania

Rhode Island: Providence-Warwick
> Cost of living in Providence-Warwick: 0.3% less expensive than avg.
> Cost of living in Rhode Island: 1.4% less expensive than avg.
> Poverty rate: 11.4%
> Median household income: $65,226
See all stories featuring: Rhode Island
[in-text-ad-2]
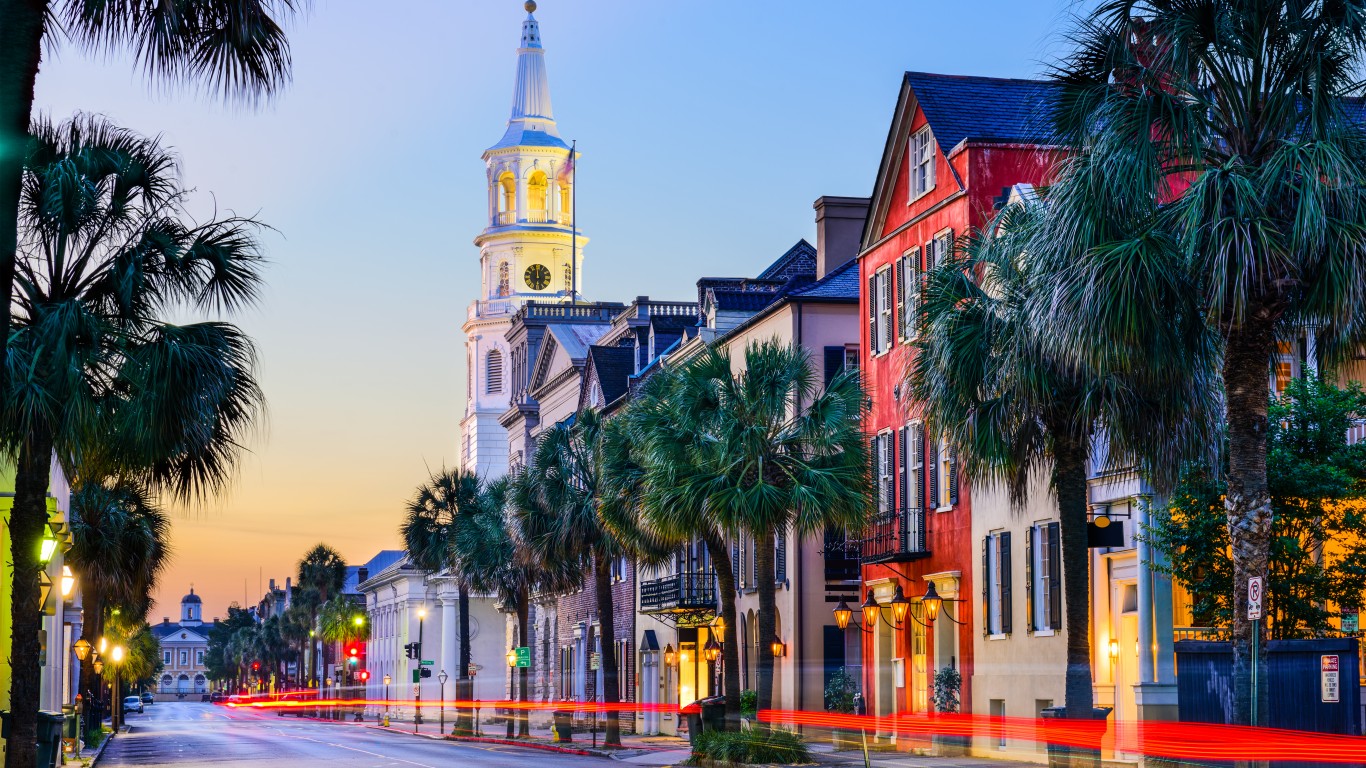
South Carolina: Charleston-North Charleston
> Cost of living in Charleston-North Charleston: 3.8% less expensive than avg.
> Cost of living in South Carolina: 9.6% less expensive than avg.
> Poverty rate: 11.9%
> Median household income: $60,546
See all stories featuring: South Carolina

South Dakota: Sioux Falls
> Cost of living in Sioux Falls: 8.4% less expensive than avg.
> Cost of living in South Dakota: 11.8% less expensive than avg.
> Poverty rate: 6.8%
> Median household income: $64,882
See all stories featuring: South Dakota
[in-text-ad]

Tennessee: Nashville-Davidson-Murfreesboro-Franklin
> Cost of living in Nashville-Davidson-Murfreesboro-Franklin: 4.7% less expensive than avg.
> Cost of living in Tennessee: 9.6% less expensive than avg.
> Poverty rate: 10.9%
> Median household income: $63,939
See all stories featuring: Tennessee

Texas: Houston-The Woodlands-Sugar Land
> Cost of living in Houston-The Woodlands-Sugar Land: 1.7% more expensive than avg.
> Cost of living in Texas: 3.0% less expensive than avg.
> Poverty rate: 13.9%
> Median household income: $63,802
See all stories featuring: Texas
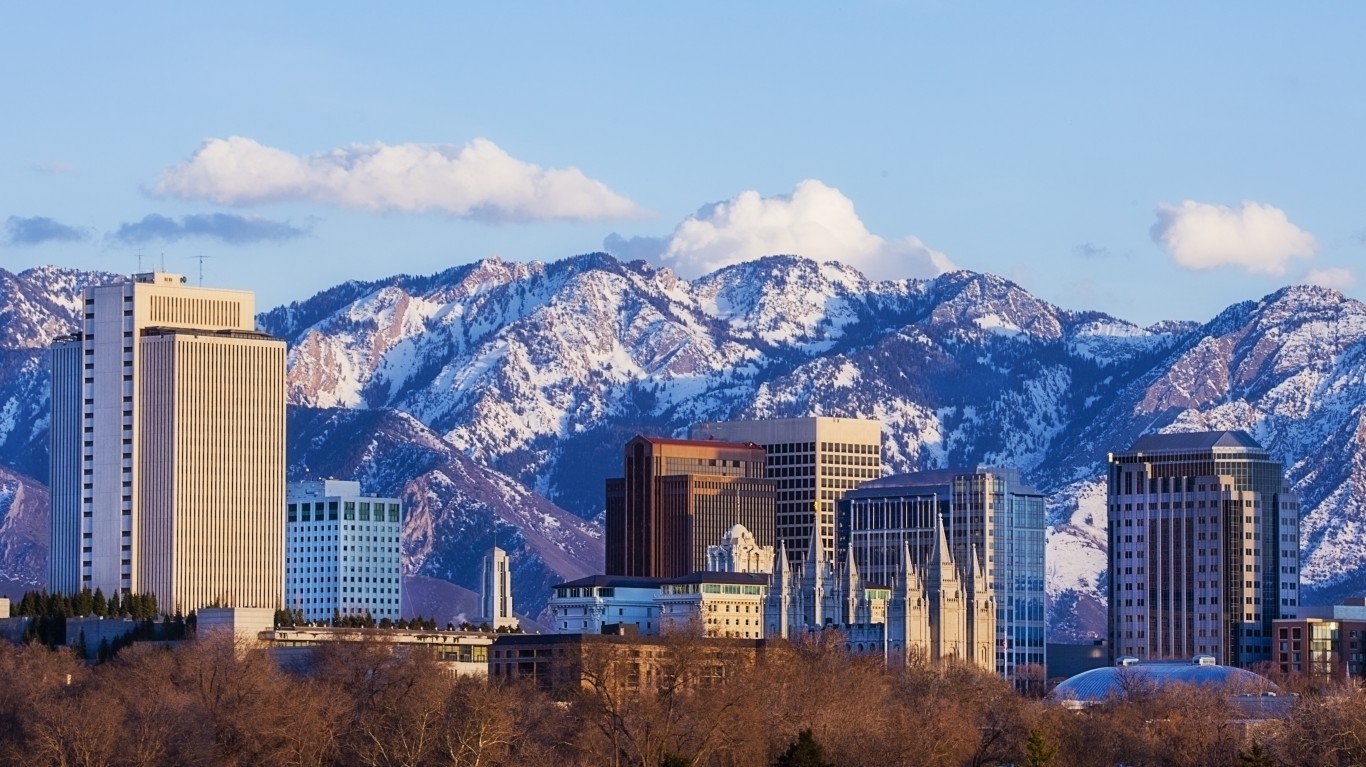
Utah: Salt Lake City
> Cost of living in Salt Lake City: 0.9% less expensive than avg.
> Cost of living in Utah: 3.0% less expensive than avg.
> Poverty rate: 8.9%
> Median household income: $71,510
See all stories featuring: Utah
[in-text-ad-2]
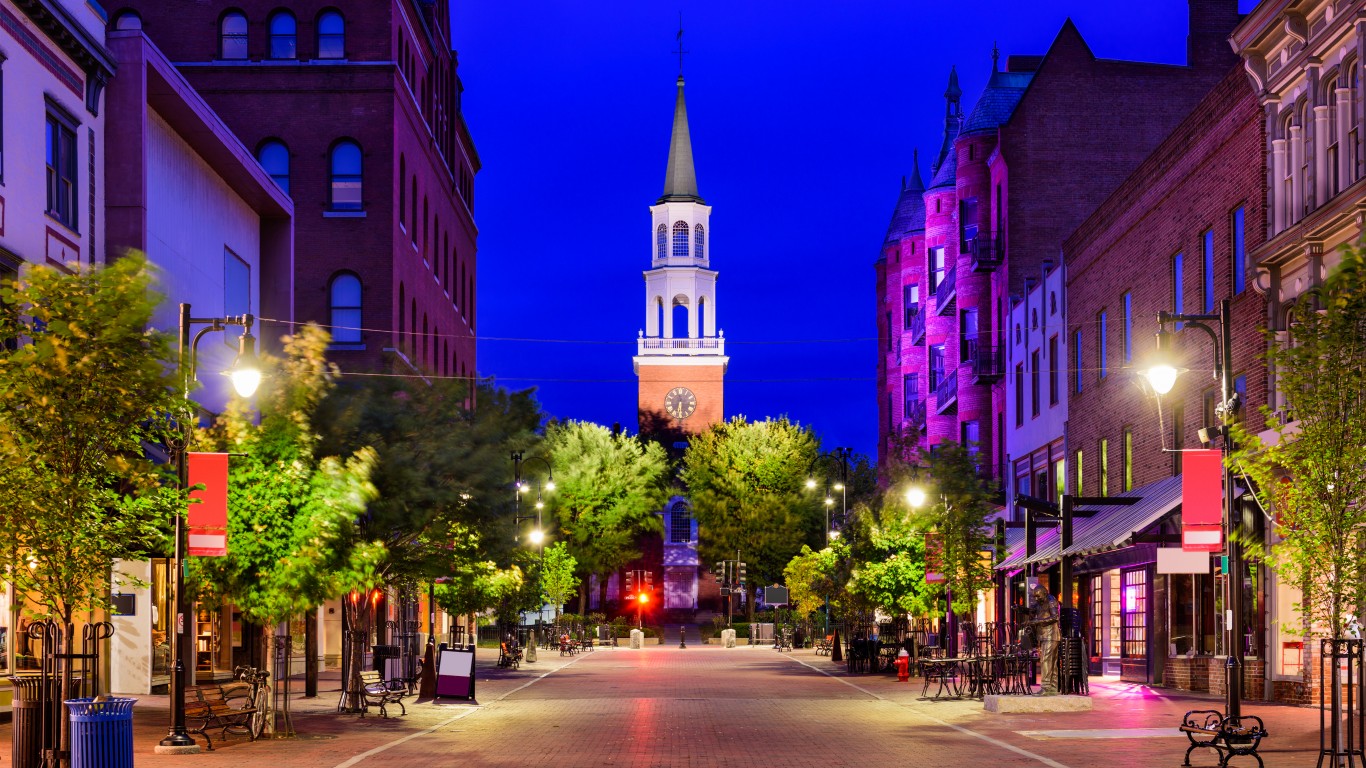
Vermont: Burlington-South Burlington
> Cost of living in Burlington-South Burlington: 5.0% more expensive than avg.
> Cost of living in Vermont: 2.5% more expensive than avg.
> Poverty rate: 11.3%
> Median household income: $63,160
See all stories featuring: Vermont
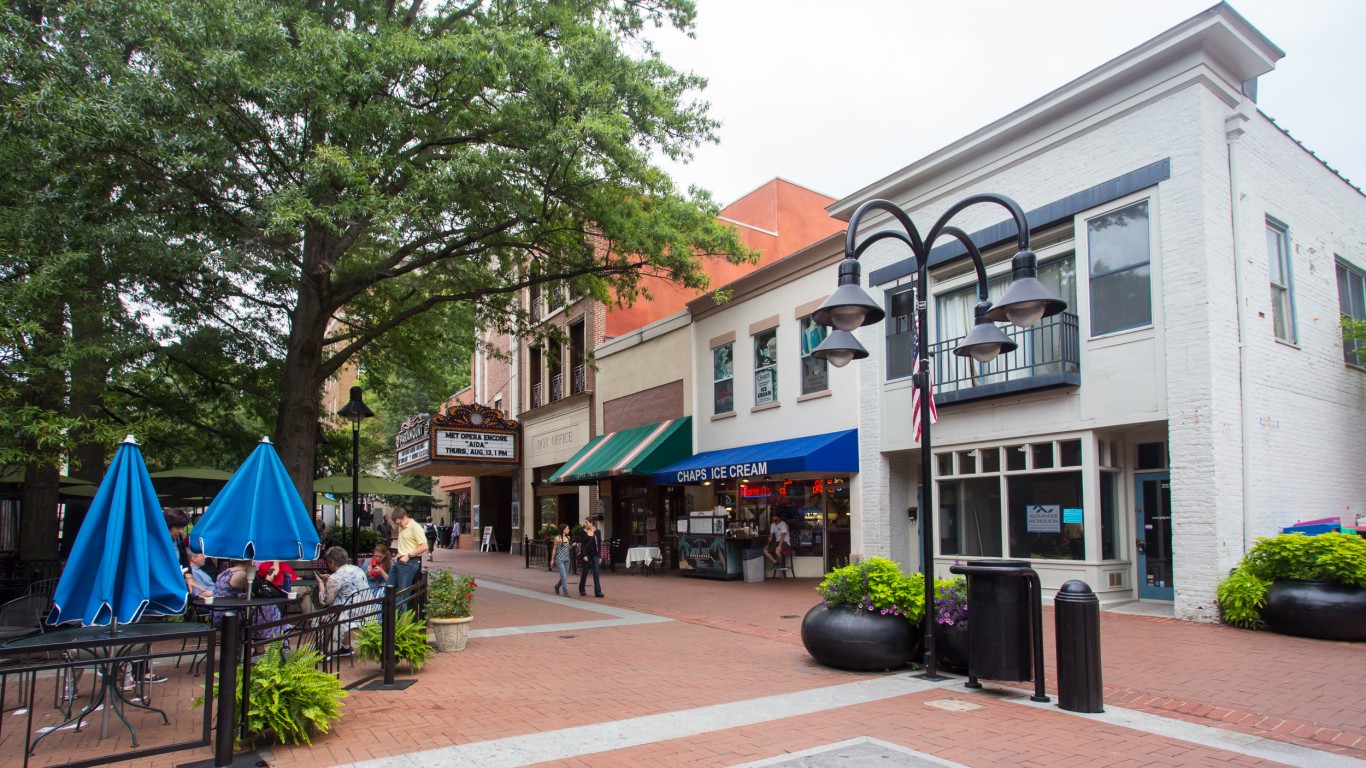
Virginia: Charlottesville
> Cost of living in Charlottesville: 1.8% less expensive than avg.
> Cost of living in Virginia: 2.1% more expensive than avg.
> Poverty rate: 11.6%
> Median household income: $66,853
See all stories featuring: Virginia
[in-text-ad]

Washington: Seattle-Tacoma-Bellevue
> Cost of living in Seattle-Tacoma-Bellevue: 11.8% more expensive than avg.
> Cost of living in Washington: 6.4% more expensive than avg.
> Poverty rate: 9.0%
> Median household income: $82,133
See all stories featuring: Washington

West Virginia: Morgantown
> Cost of living in Morgantown: 9.3% less expensive than avg.
> Cost of living in West Virginia: 13.0% less expensive than avg.
> Poverty rate: 18.5%
> Median household income: $49,475
See all stories featuring: West Virginia

Wisconsin: Madison
> Cost of living in Madison: 3.2% less expensive than avg.
> Cost of living in Wisconsin: 7.6% less expensive than avg.
> Poverty rate: 11.0%
> Median household income: $71,301
See all stories featuring: Wisconsin
[in-text-ad-2]
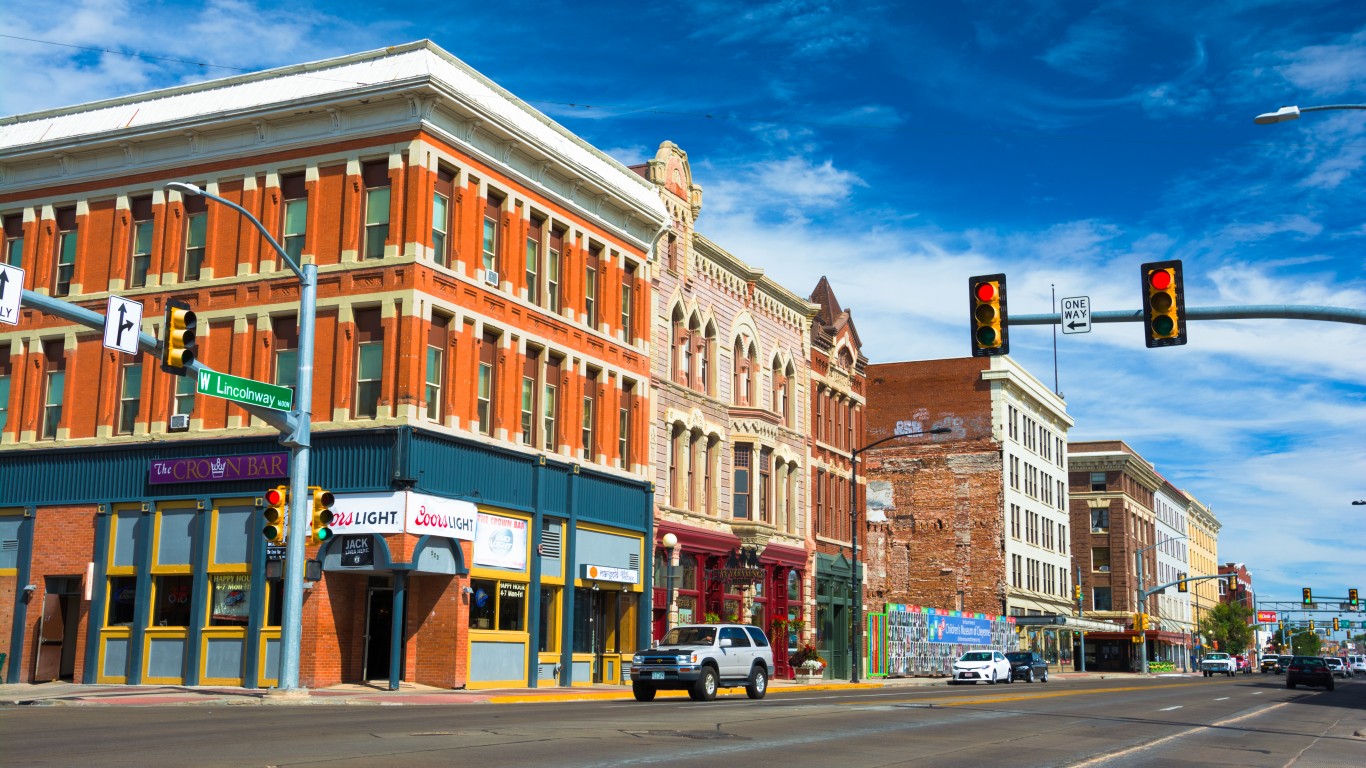
Wyoming: Cheyenne
> Cost of living in Cheyenne: 3.2% less expensive than avg.
> Cost of living in Wyoming: 4.8% less expensive than avg.
> Poverty rate: 9.9%
> Median household income: $61,961
See all stories featuring: Wyoming
Methodology
To determine the most expensive city in each state, 24/7 Wall St. reviewed 2017 regional price parities among U.S. metropolitan statistical areas as calculated by the Bureau of Economic Analysis. An RPP is a weighted average of the price level of goods and services for the average consumer in one geographic region compared to all other regions in the U.S. The cost of living for each state also comes from the BEA. Poverty rates and median household income for each MSA come from the U.S. Census Bureau’s 2017 American Community Survey and are one year estimates.
Is Your Money Earning the Best Possible Rate? (Sponsor)
Let’s face it: If your money is just sitting in a checking account, you’re losing value every single day. With most checking accounts offering little to no interest, the cash you worked so hard to save is gradually being eroded by inflation.
However, by moving that money into a high-yield savings account, you can put your cash to work, growing steadily with little to no effort on your part. In just a few clicks, you can set up a high-yield savings account and start earning interest immediately.
There are plenty of reputable banks and online platforms that offer competitive rates, and many of them come with zero fees and no minimum balance requirements. Click here to see if you’re earning the best possible rate on your money!
Thank you for reading! Have some feedback for us?
Contact the 24/7 Wall St. editorial team.
 24/7 Wall St.
 24/7 Wall St.
 24/7 Wall St.
 24/7 Wall St.


