
As autumn approaches, those still looking for a summer tan may find that the days begin to get shorter. And in some of the less sunny parts of the country, sunbathers get more than two hours less of strong sunshine on an average day.
The Northeast and Midwest receive, respectively, 14.7% and 8.9% less daily sunshine than the U.S. average, while the West and South receive 4.8% and 4.7% more.
Of the 30 cities that get the least sun, eight are in New York, six are in Washington, and five are in Pennsylvania. Maine, Ohio, and Wisconsin are each home to two cities, while Idaho, Michigan, Minnesota, Vermont, and West Virginia are each home to one. The majority of cities on this list are in states that get the most rain.
24/7 Wall St. reviewed the metropolitan statistical areas with the fewest hours of peak sun per day using data from the Centers for Disease Control and Prevention’s North America Land Data Assimilation System (NLDAS). A peak sun-hour is a period during which the intensity of sunlight exceeds 1,000 watts per square meter.
While sunshine can be a boon to recreation and summer fun, climate change has contributed to its intensity and harmful effects on the environment. Here is a list of places where weather is getting worse due to climate change, and a list of summer getaways we’re losing to climate change.
Click here to see the U.S. cities that get the least sun
Click here to read our methodology
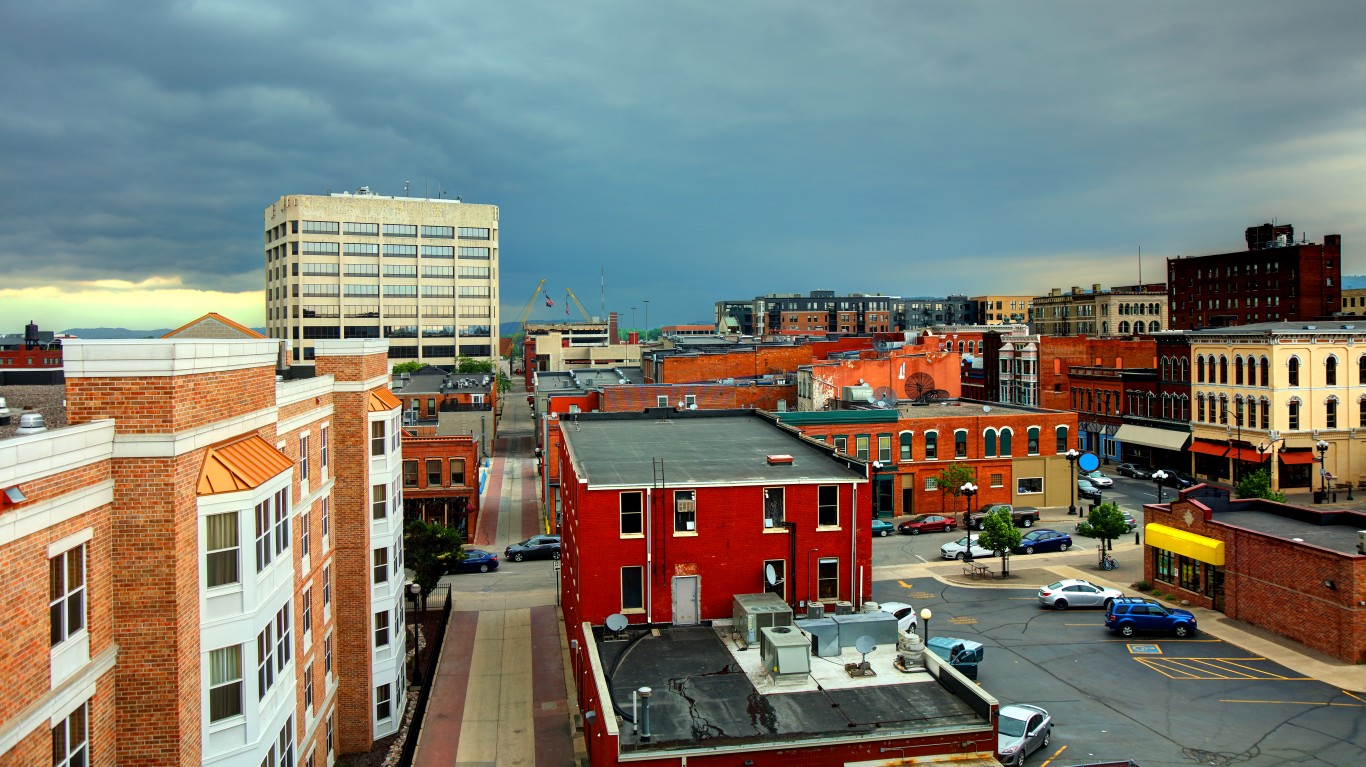
30. La Crosse-Onalaska, WI-MN
> Avg. hours of full-sun per day: 3 hours, 56 minutes
> Avg. daily max temperature: 54.1 degrees
> Avg. annual precipitation: 35.2 inches
> Population: 136,934
[in-text-ad]
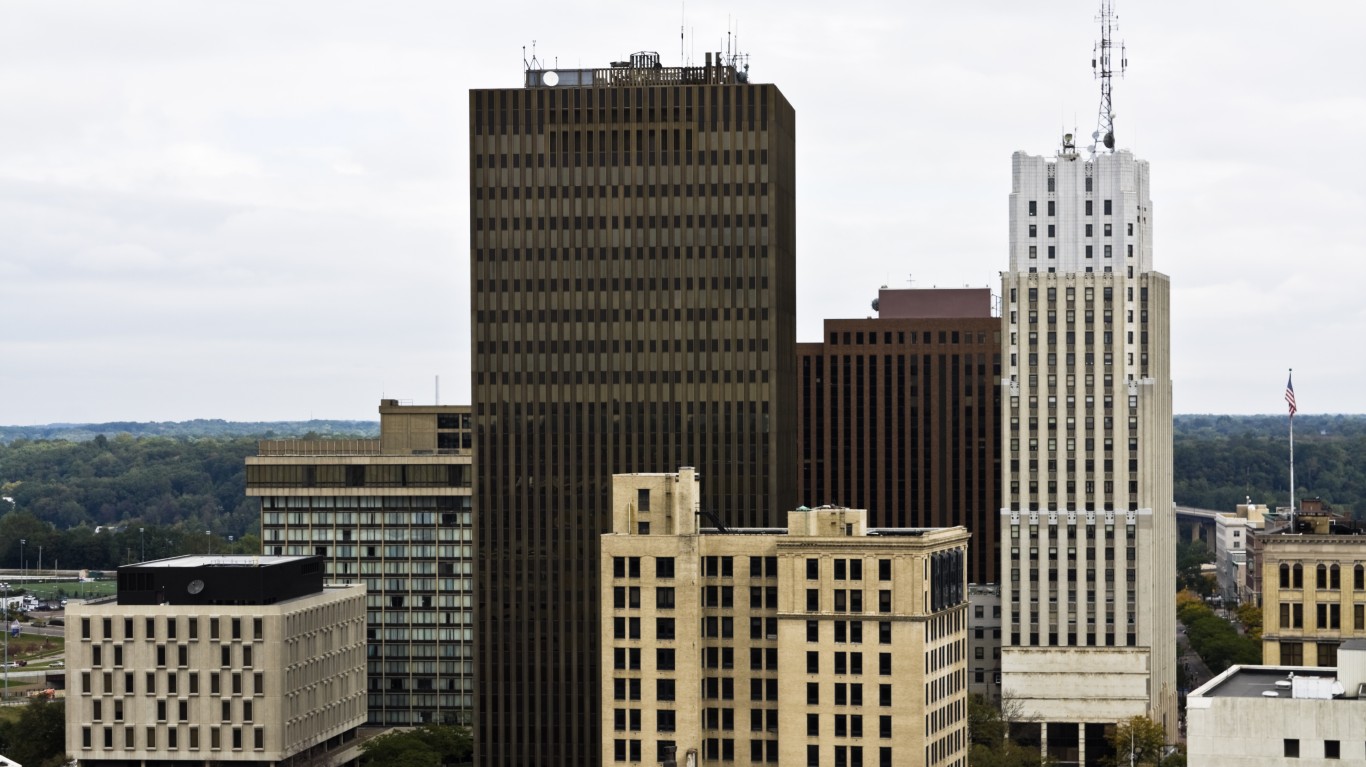
29. Akron, OH
> Avg. hours of full-sun per day: 3 hours, 55 minutes
> Avg. daily max temperature: 57.4 degrees
> Avg. annual precipitation: 39.5 inches
> Population: 703,505
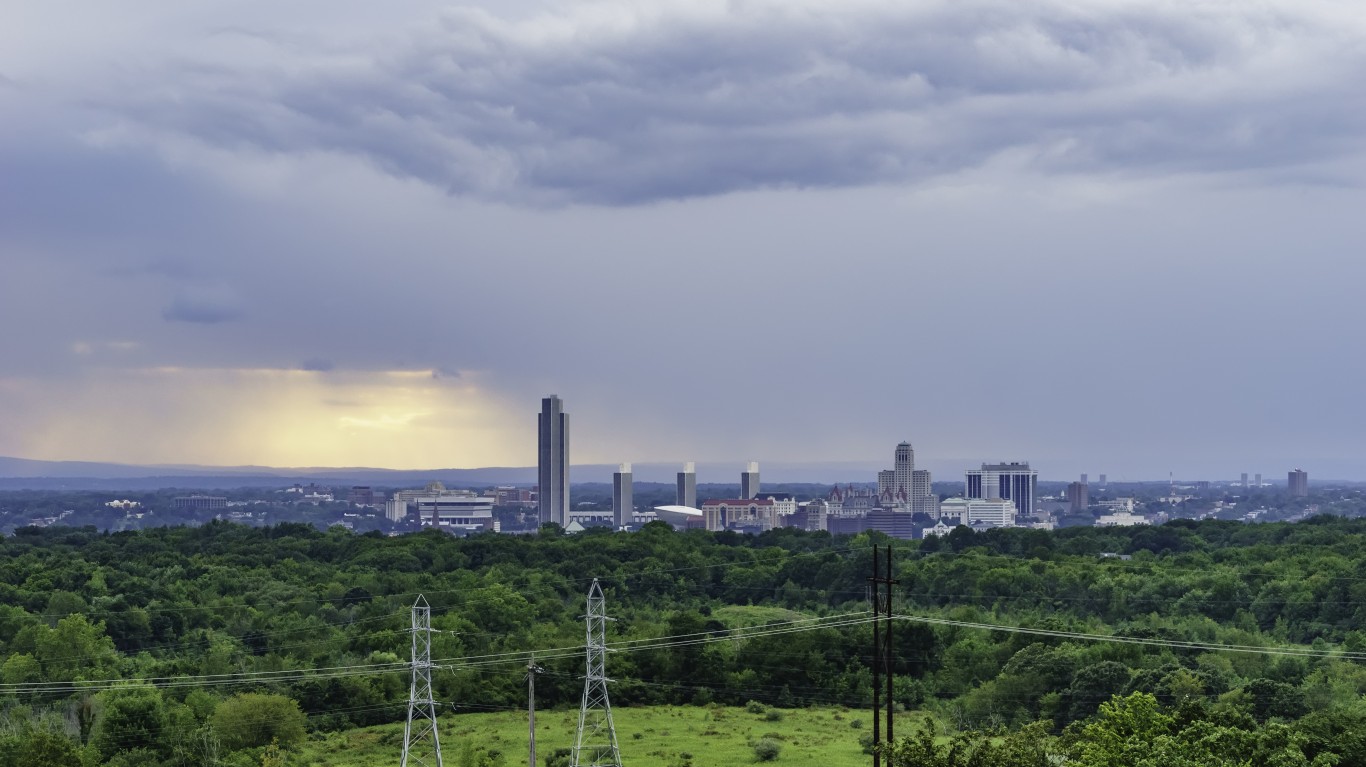
28. Albany-Schenectady-Troy, NY
> Avg. hours of full-sun per day: 3 hours, 55 minutes
> Avg. daily max temperature: 53.4 degrees
> Avg. annual precipitation: 43.2 inches
> Population: 886,188
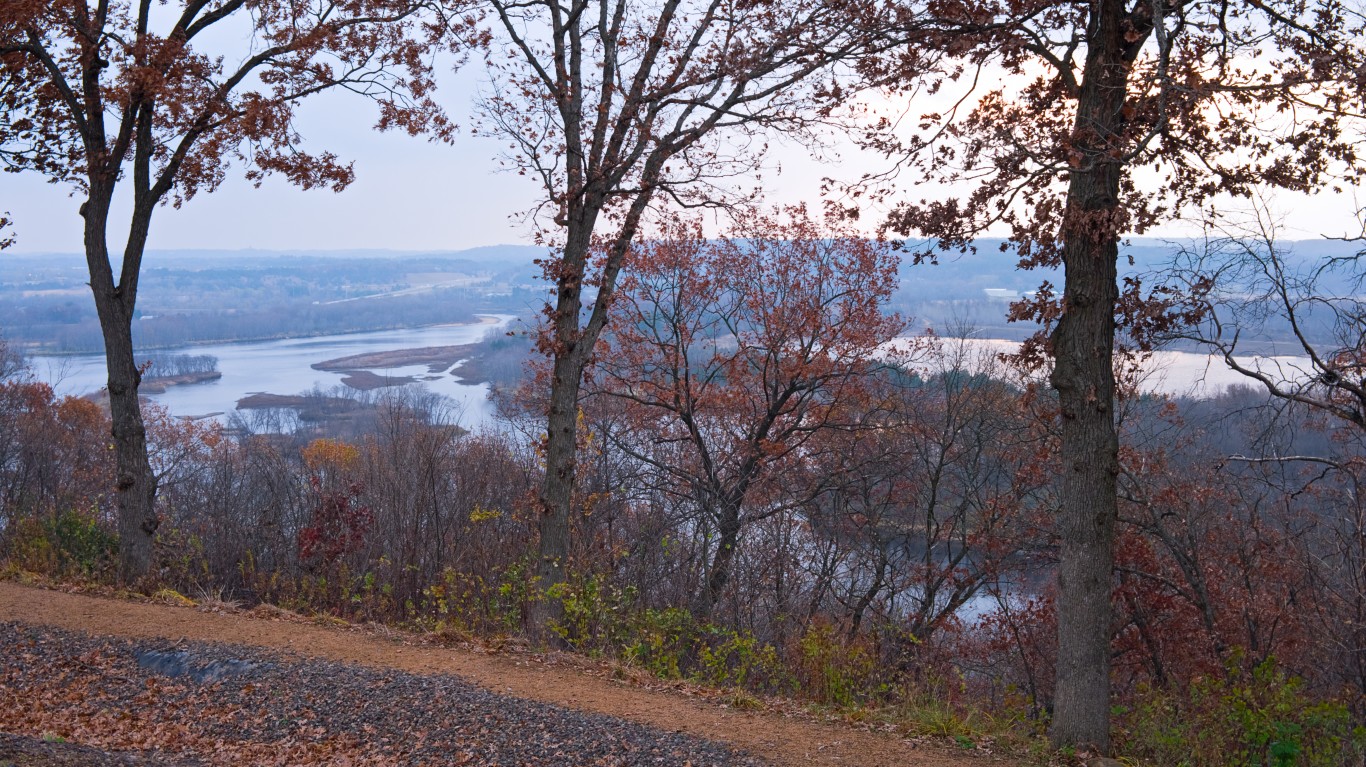
27. Eau Claire, WI
> Avg. hours of full-sun per day: 3 hours, 55 minutes
> Avg. daily max temperature: 52.2 degrees
> Avg. annual precipitation: 33.6 inches
> Population: 167,484
[in-text-ad-2]

26. Scranton–Wilkes-Barre–Hazleton, PA
> Avg. hours of full-sun per day: 3 hours, 55 minutes
> Avg. daily max temperature: 55.1 degrees
> Avg. annual precipitation: 44.1 inches
> Population: 555,426
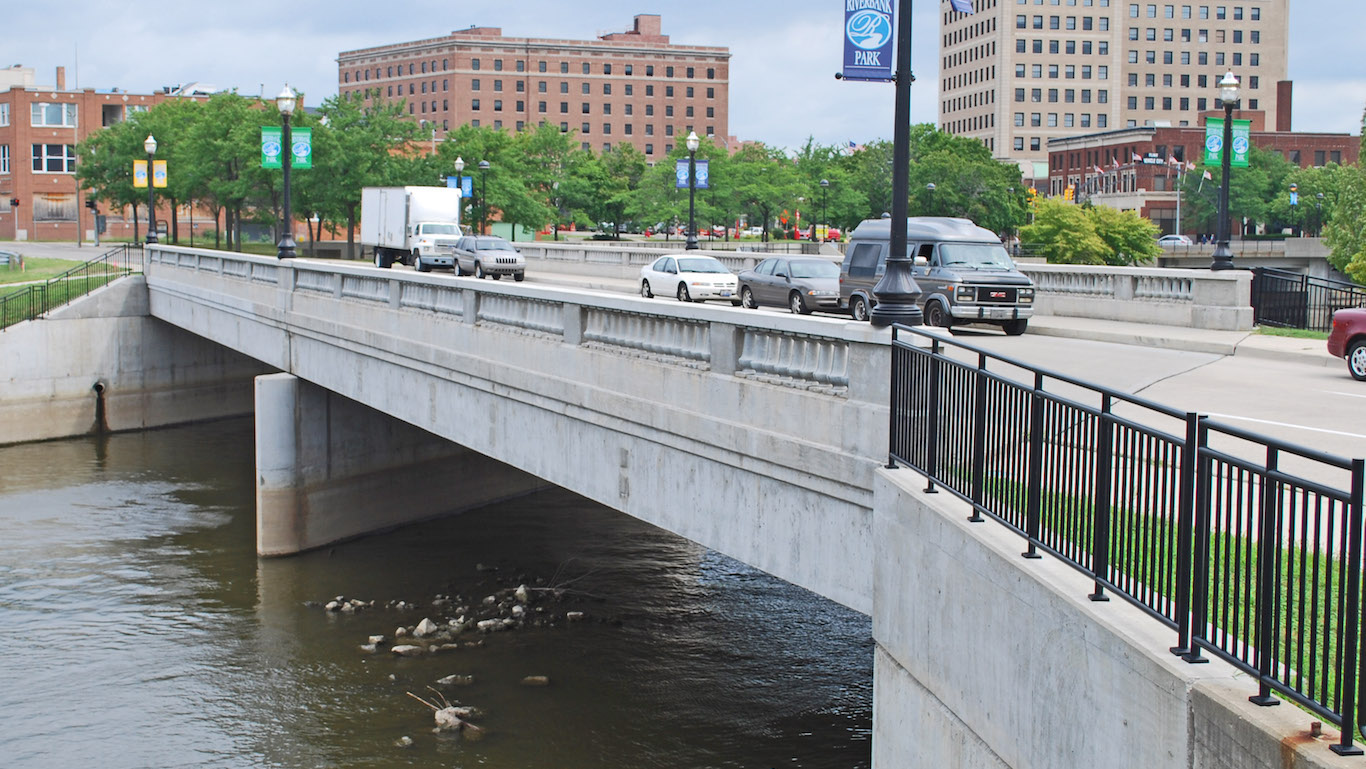
25. Flint, MI
> Avg. hours of full-sun per day: 3 hours, 55 minutes
> Avg. daily max temperature: 55.3 degrees
> Avg. annual precipitation: 32.8 inches
> Population: 407,385
[in-text-ad]
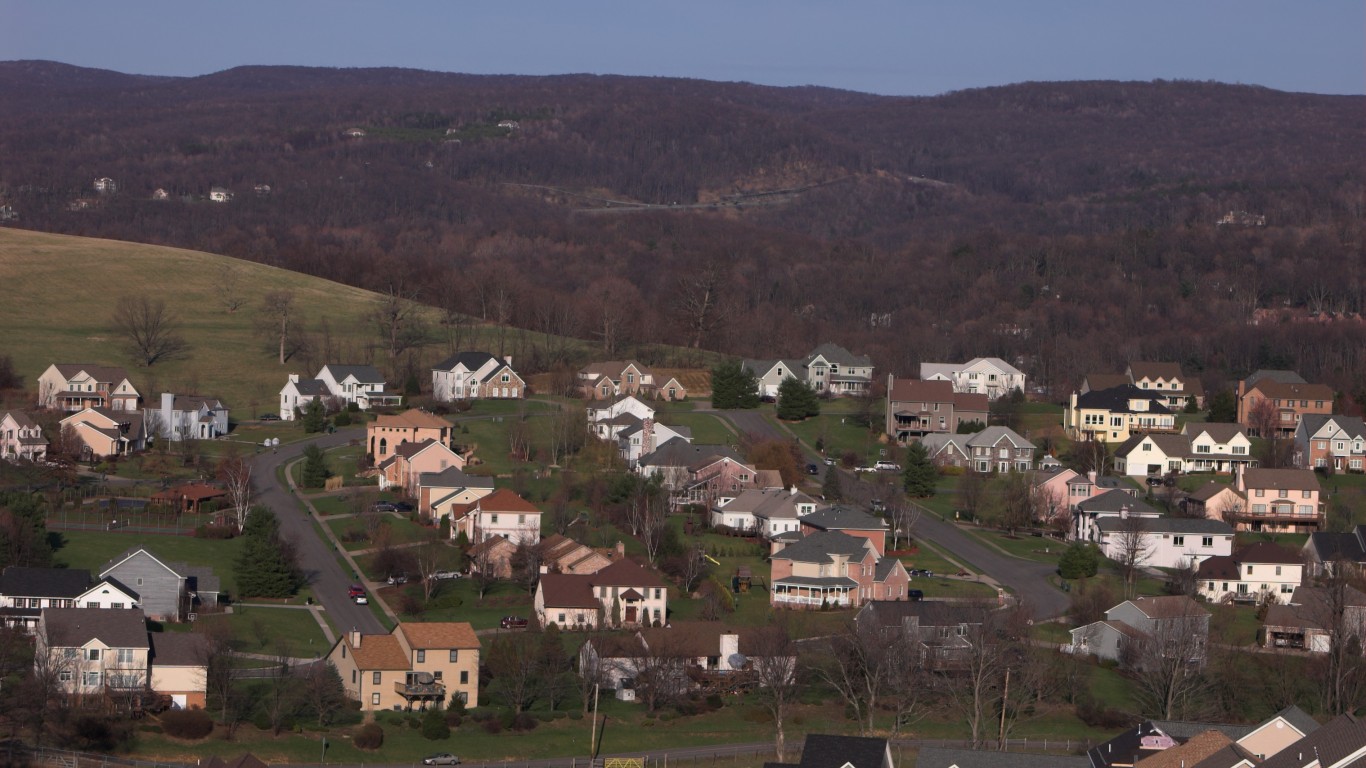
24. Morgantown, WV
> Avg. hours of full-sun per day: 3 hours, 55 minutes
> Avg. daily max temperature: 58.0 degrees
> Avg. annual precipitation: 47.4 inches
> Population: 138,709
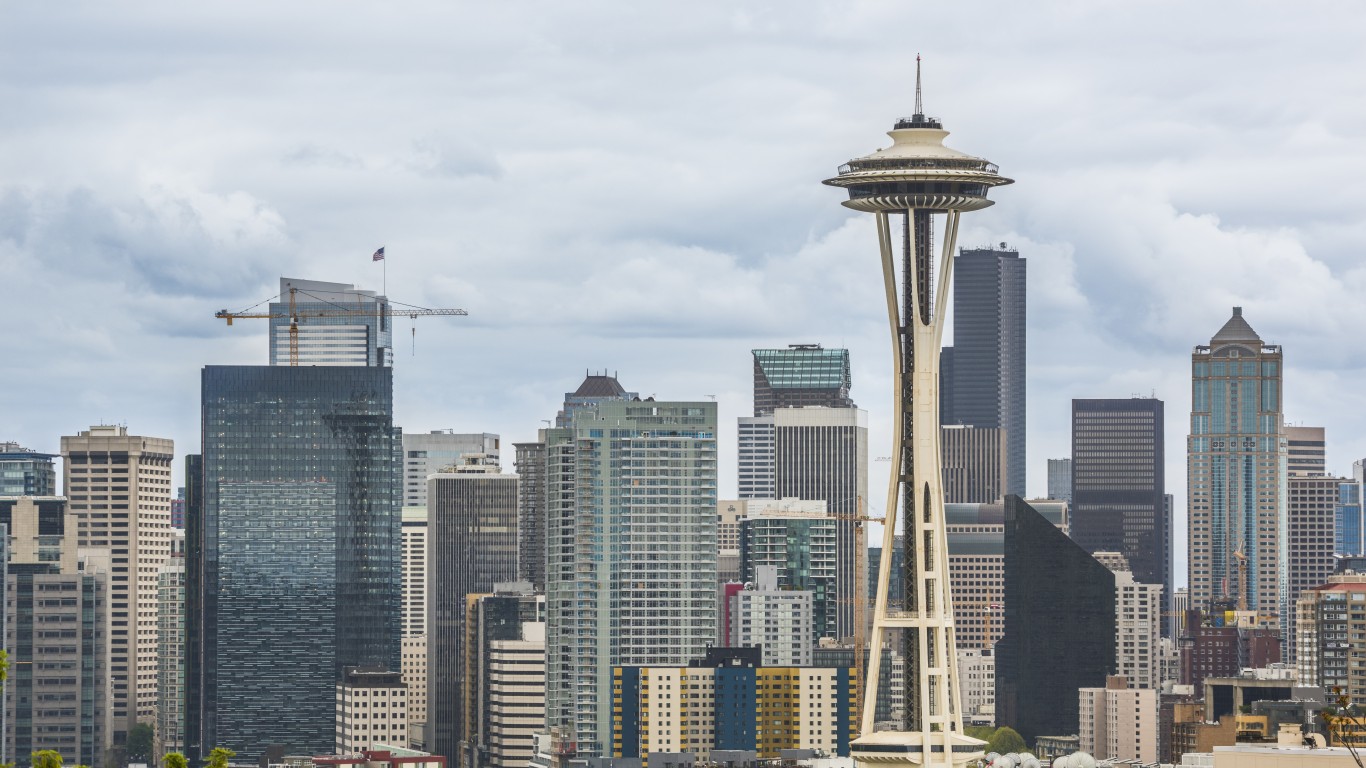
23. Seattle-Tacoma-Bellevue, WA
> Avg. hours of full-sun per day: 3 hours, 54 minutes
> Avg. daily max temperature: 52.8 degrees
> Avg. annual precipitation: 73.9 inches
> Population: 3,867,046
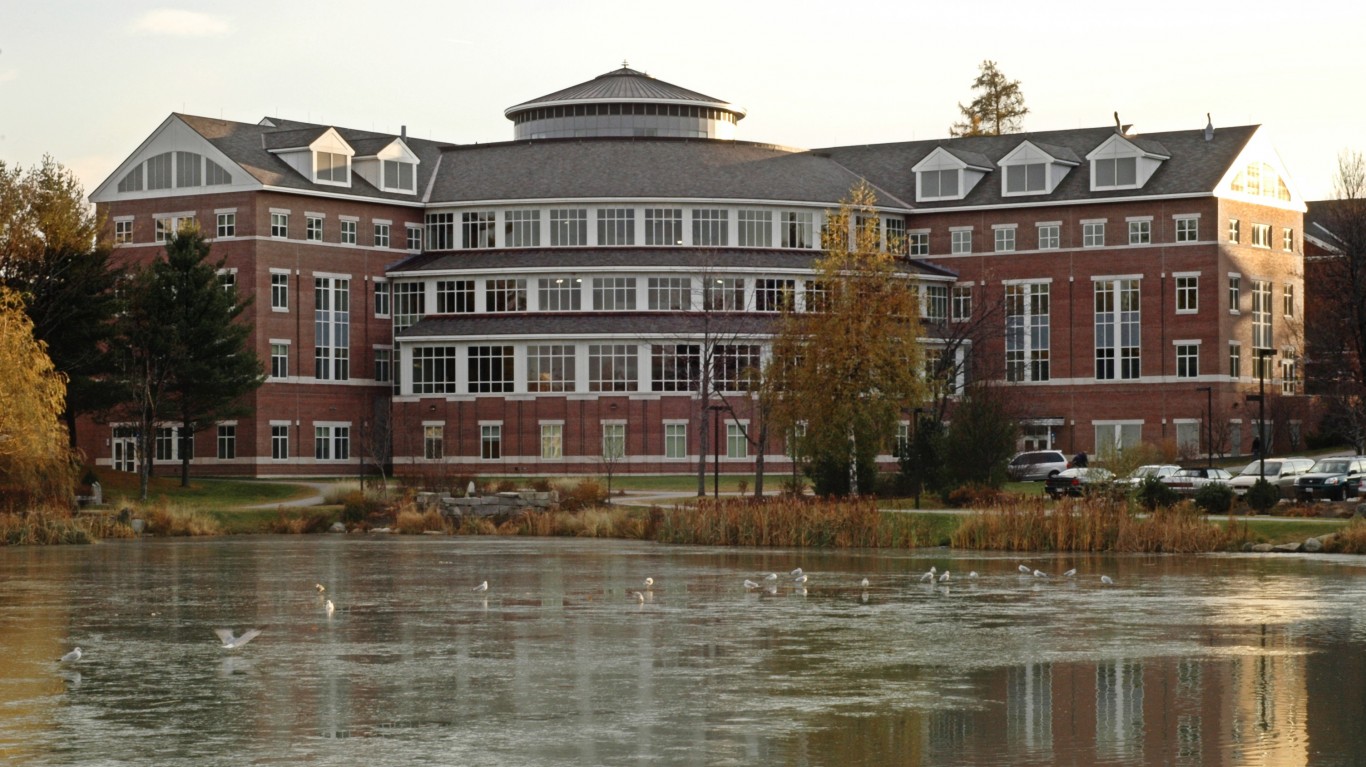
22. Lewiston-Auburn, ME
> Avg. hours of full-sun per day: 3 hours, 54 minutes
> Avg. daily max temperature: 52.2 degrees
> Avg. annual precipitation: 47.3 inches
> Population: 107,651
[in-text-ad-2]

21. Pittsburgh, PA
> Avg. hours of full-sun per day: 3 hours, 54 minutes
> Avg. daily max temperature: 58.0 degrees
> Avg. annual precipitation: 40.5 inches
> Population: 2,333,367

20. Johnstown, PA
> Avg. hours of full-sun per day: 3 hours, 53 minutes
> Avg. daily max temperature: 54.9 degrees
> Avg. annual precipitation: 43.7 inches
> Population: 133,054
[in-text-ad]
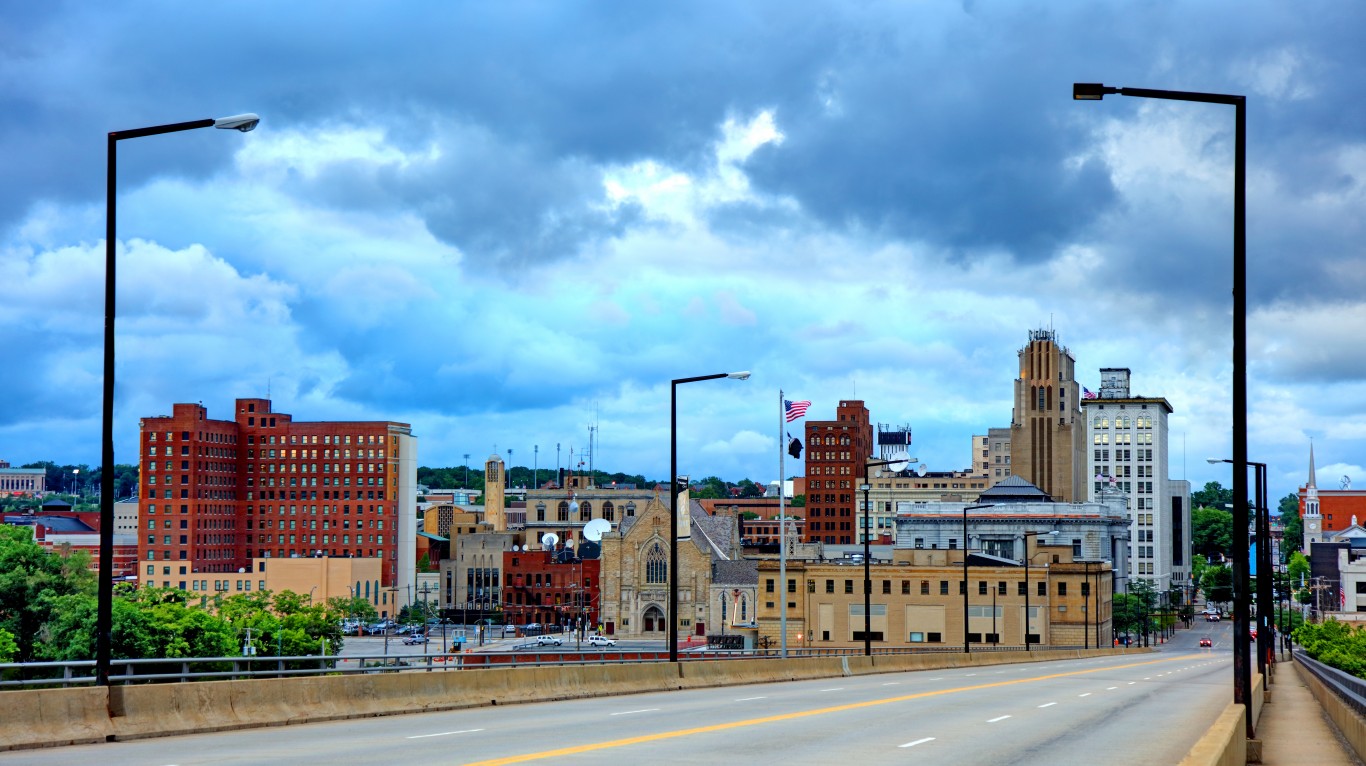
19. Youngstown-Warren-Boardman, OH-PA
> Avg. hours of full-sun per day: 3 hours, 53 minutes
> Avg. daily max temperature: 57.1 degrees
> Avg. annual precipitation: 39.2 inches
> Population: 541,926

18. State College, PA
> Avg. hours of full-sun per day: 3 hours, 53 minutes
> Avg. daily max temperature: 55.7 degrees
> Avg. annual precipitation: 41.1 inches
> Population: 162,660
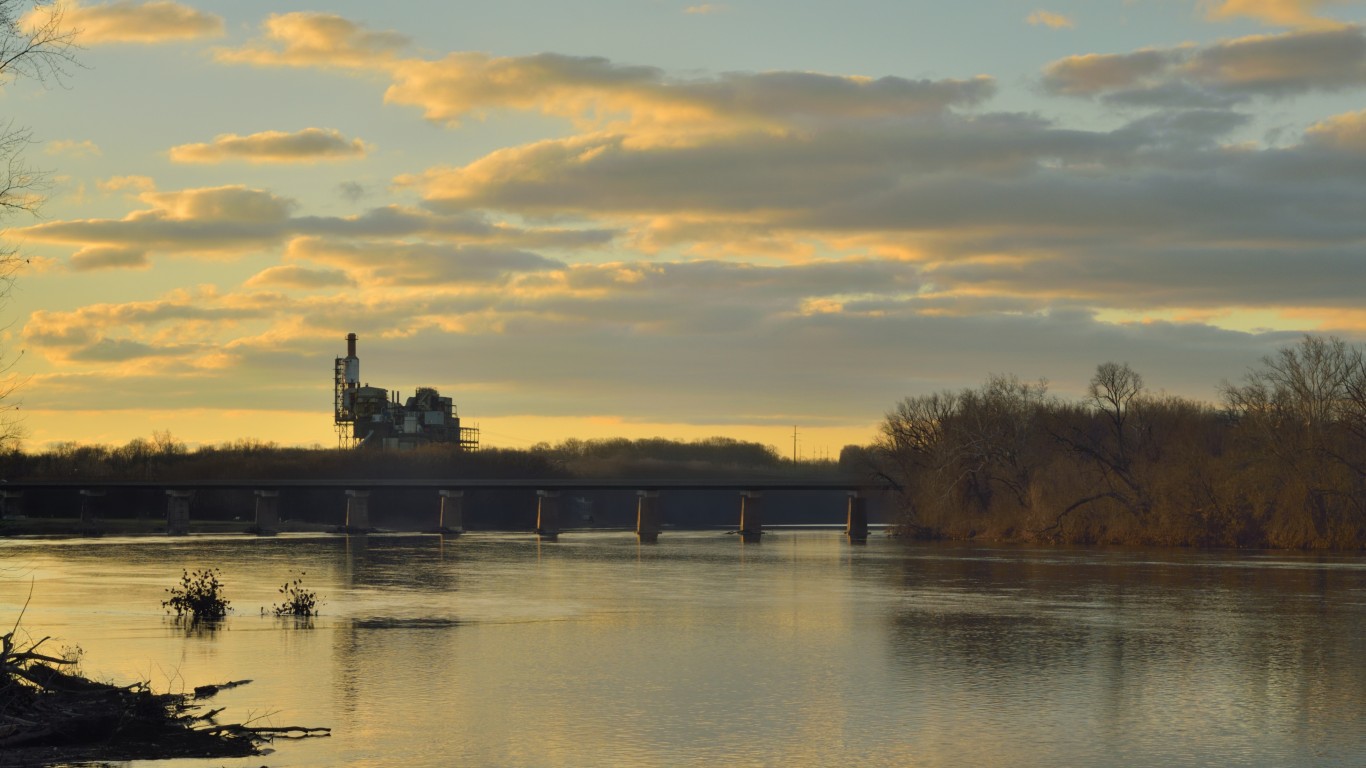
17. Williamsport, PA
> Avg. hours of full-sun per day: 3 hours, 52 minutes
> Avg. daily max temperature: 55.7 degrees
> Avg. annual precipitation: 42.2 inches
> Population: 113,841
[in-text-ad-2]
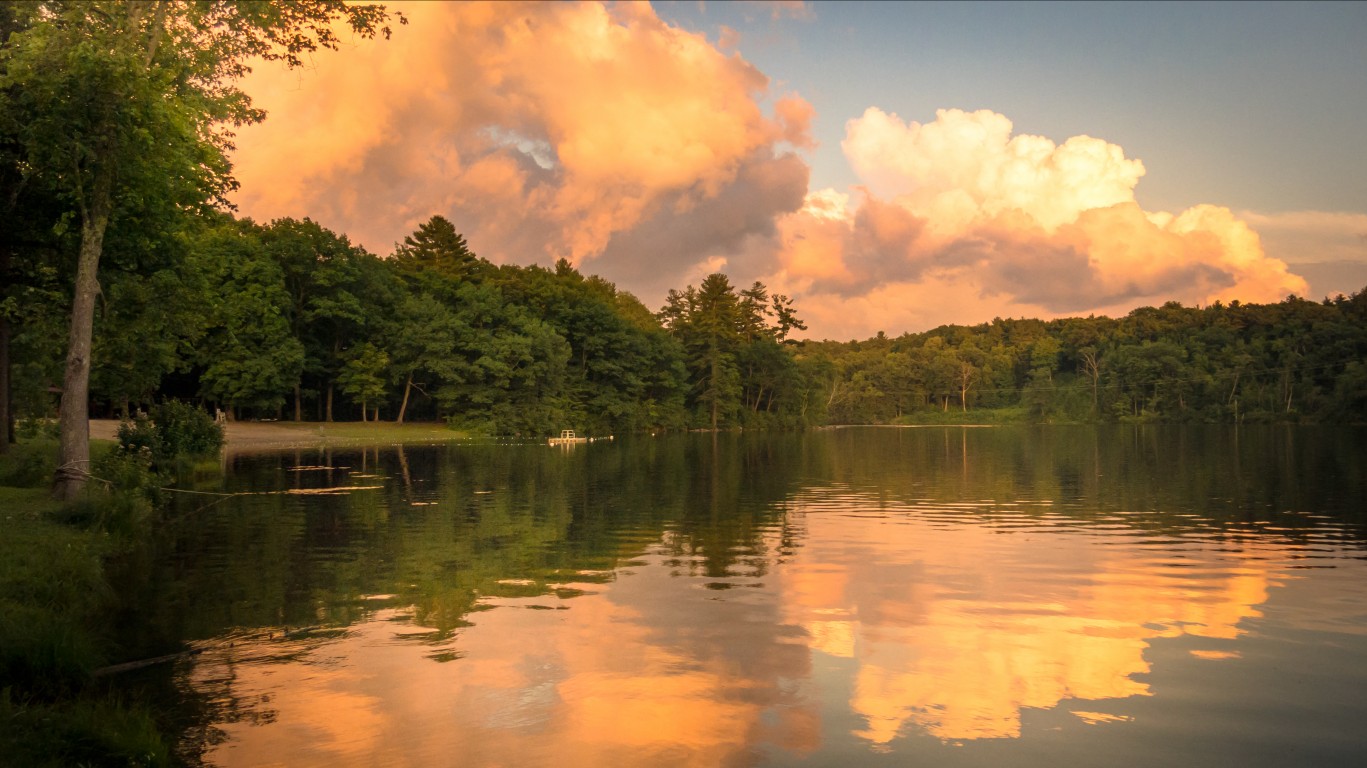
16. Glens Falls, NY
> Avg. hours of full-sun per day: 3 hours, 51 minutes
> Avg. daily max temperature: 52.1 degrees
> Avg. annual precipitation: 44.0 inches
> Population: 126,152
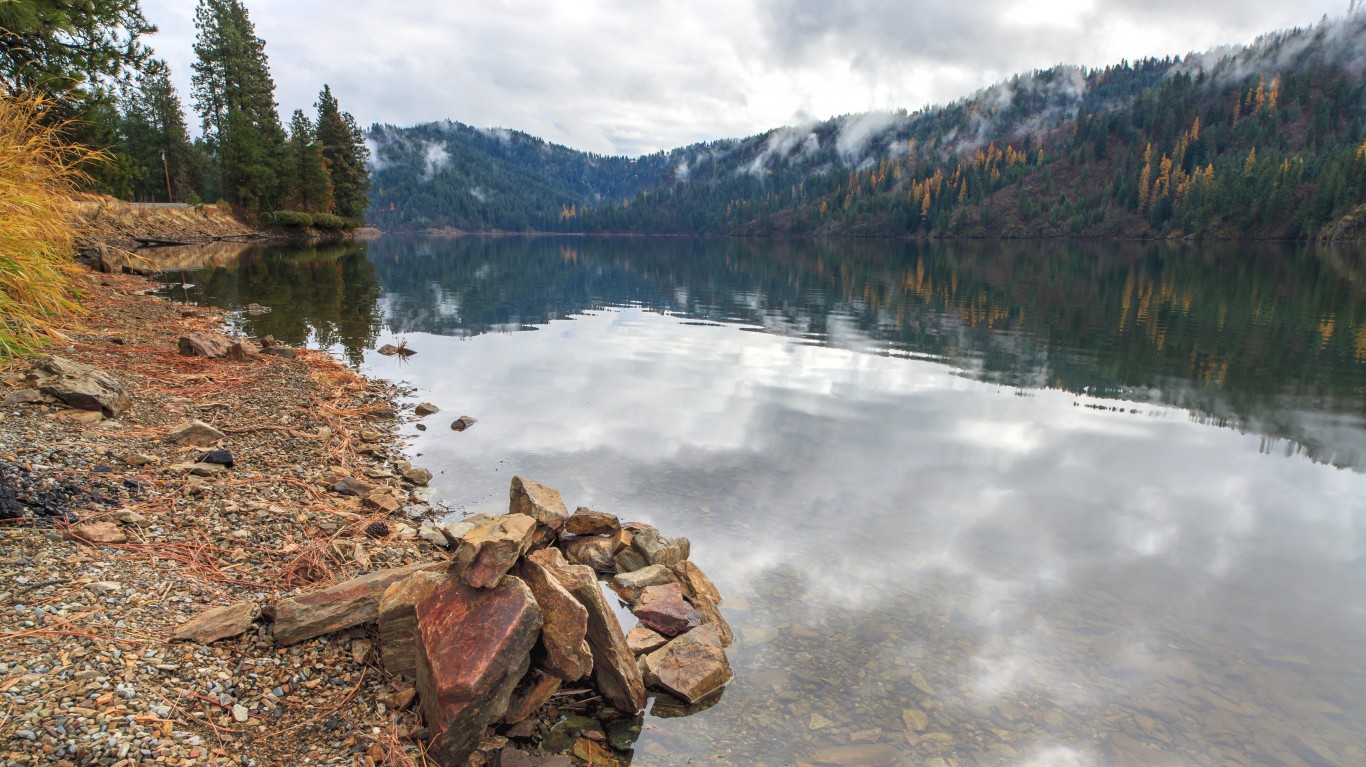
15. Coeur d’Alene, ID
> Avg. hours of full-sun per day: 3 hours, 50 minutes
> Avg. daily max temperature: 55.0 degrees
> Avg. annual precipitation: 34.2 inches
> Population: 157,637
[in-text-ad]
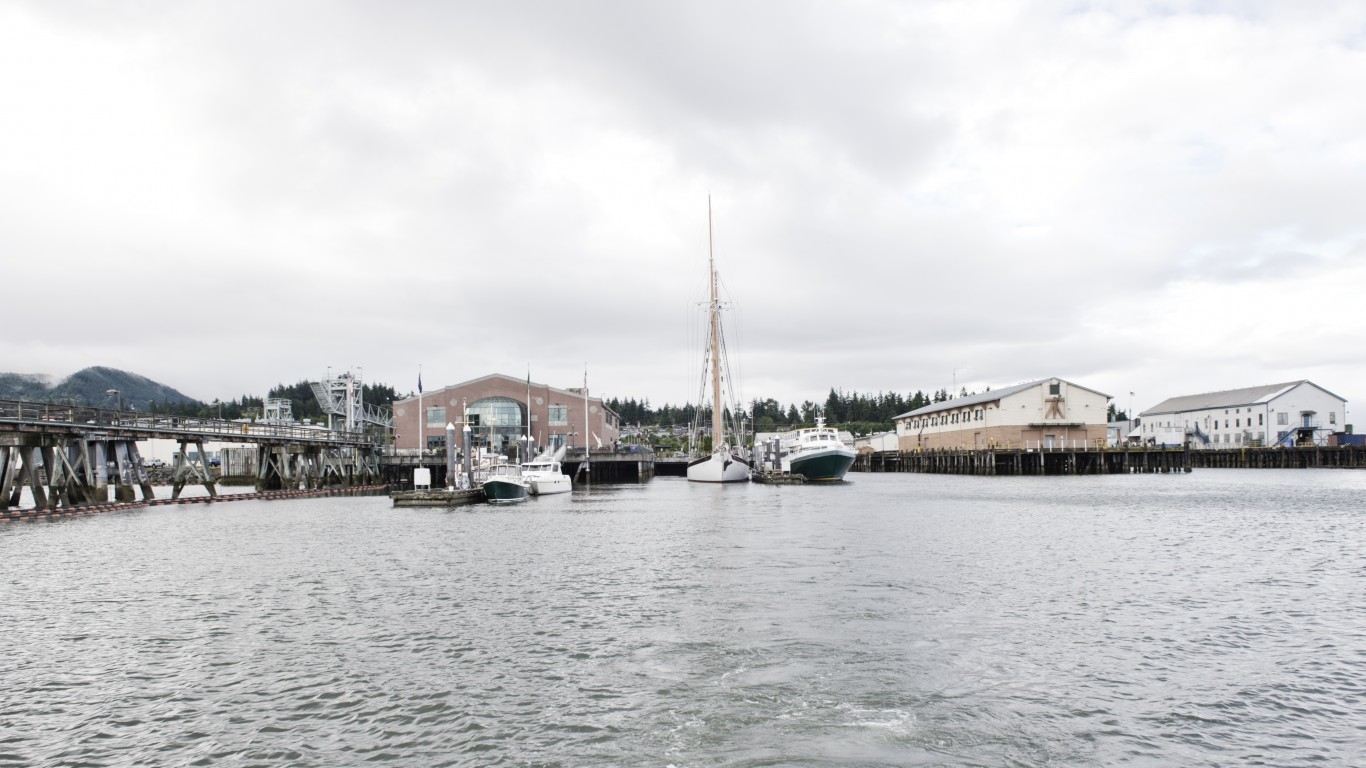
14. Bellingham, WA
> Avg. hours of full-sun per day: 3 hours, 49 minutes
> Avg. daily max temperature: 49.0 degrees
> Avg. annual precipitation: 72.6 inches
> Population: 221,404
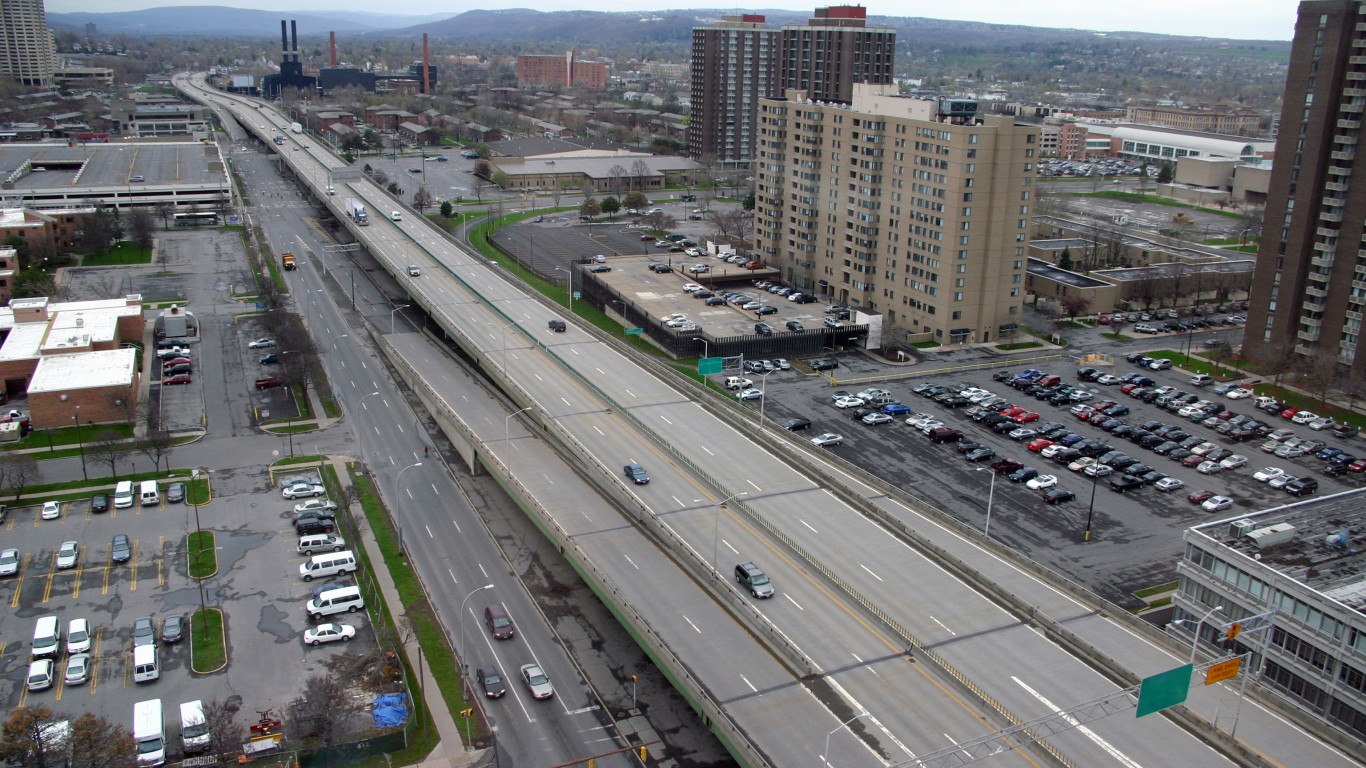
13. Syracuse, NY
> Avg. hours of full-sun per day: 3 hours, 49 minutes
> Avg. daily max temperature: 52.8 degrees
> Avg. annual precipitation: 43.3 inches
> Population: 654,841
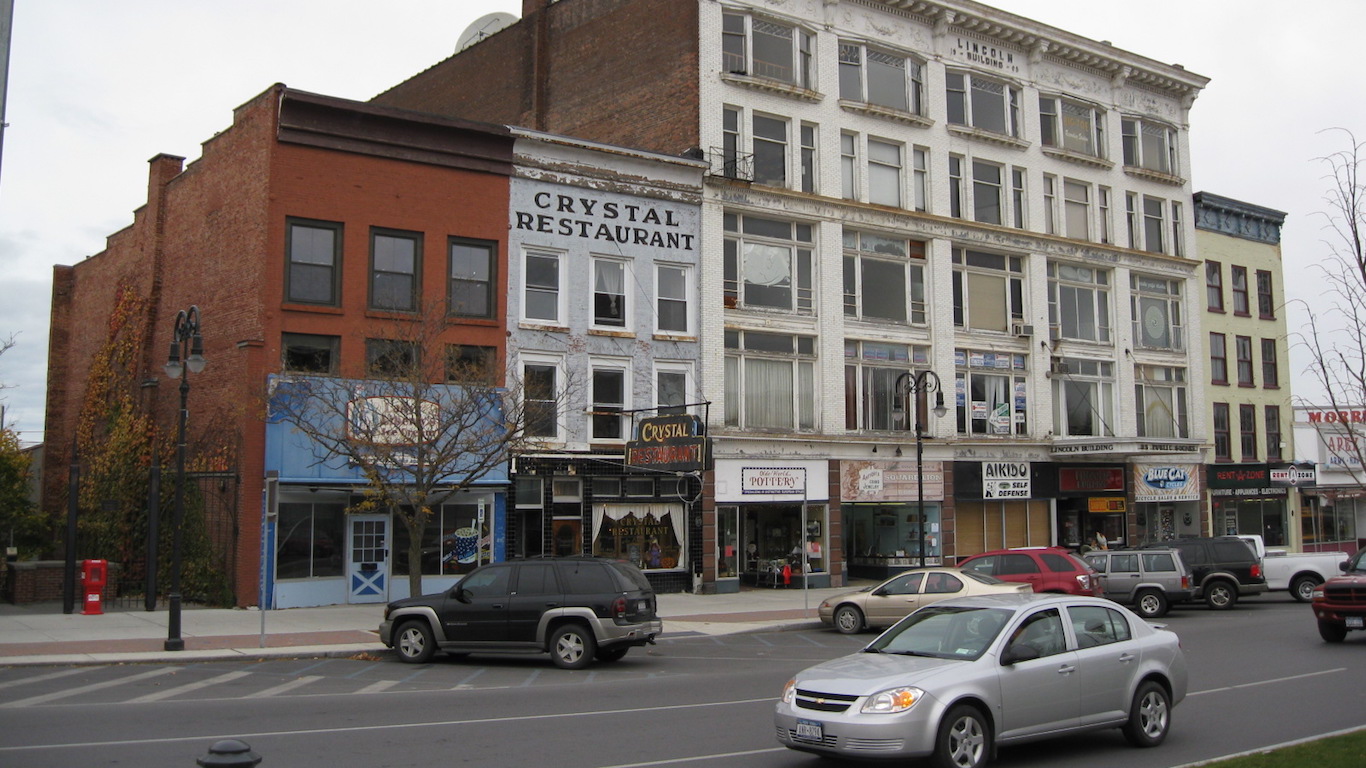
12. Watertown-Fort Drum, NY
> Avg. hours of full-sun per day: 3 hours, 49 minutes
> Avg. daily max temperature: 51.9 degrees
> Avg. annual precipitation: 39.8 inches
> Population: 114,187
[in-text-ad-2]
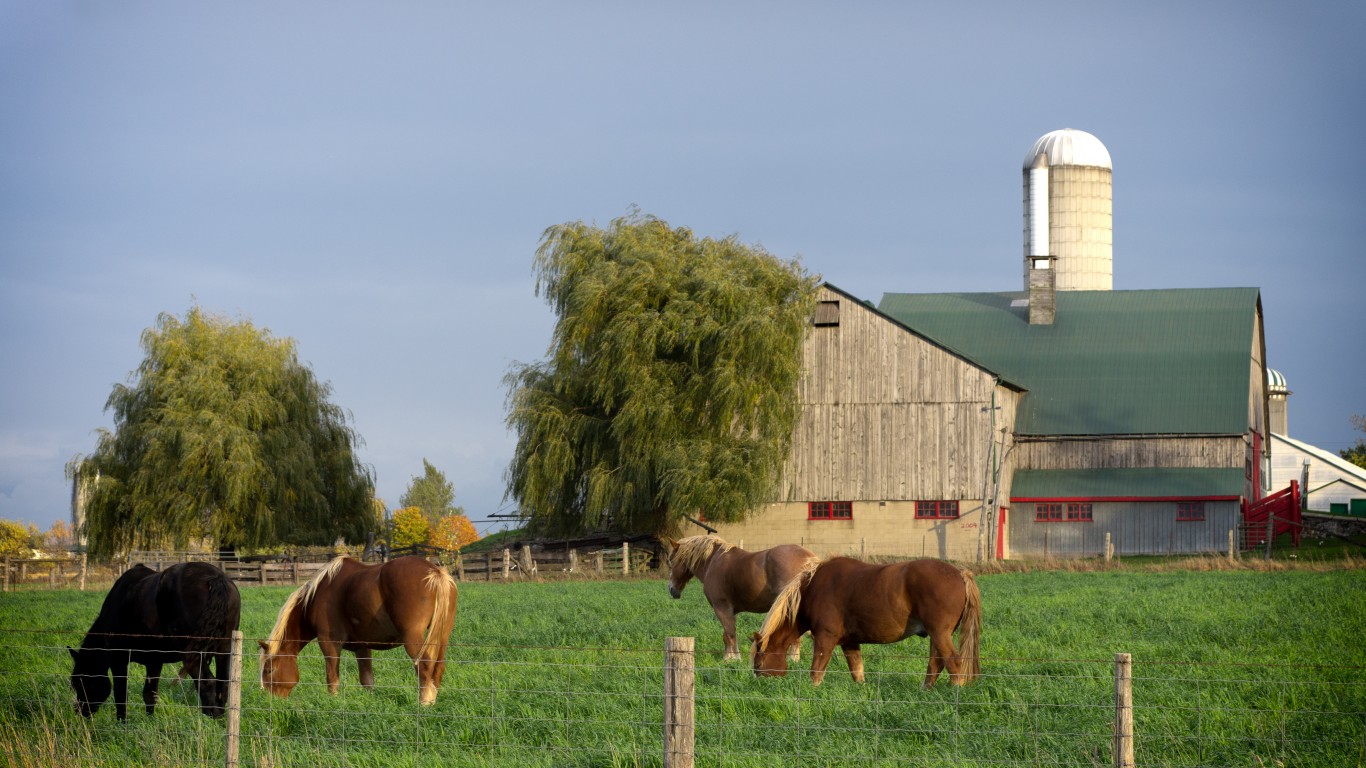
11. Elmira, NY
> Avg. hours of full-sun per day: 3 hours, 49 minutes
> Avg. daily max temperature: 54.1 degrees
> Avg. annual precipitation: 36.4 inches
> Population: 85,557

10. Mount Vernon-Anacortes, WA
> Avg. hours of full-sun per day: 3 hours, 49 minutes
> Avg. daily max temperature: 50.1 degrees
> Avg. annual precipitation: 80.2 inches
> Population: 125,619
[in-text-ad]
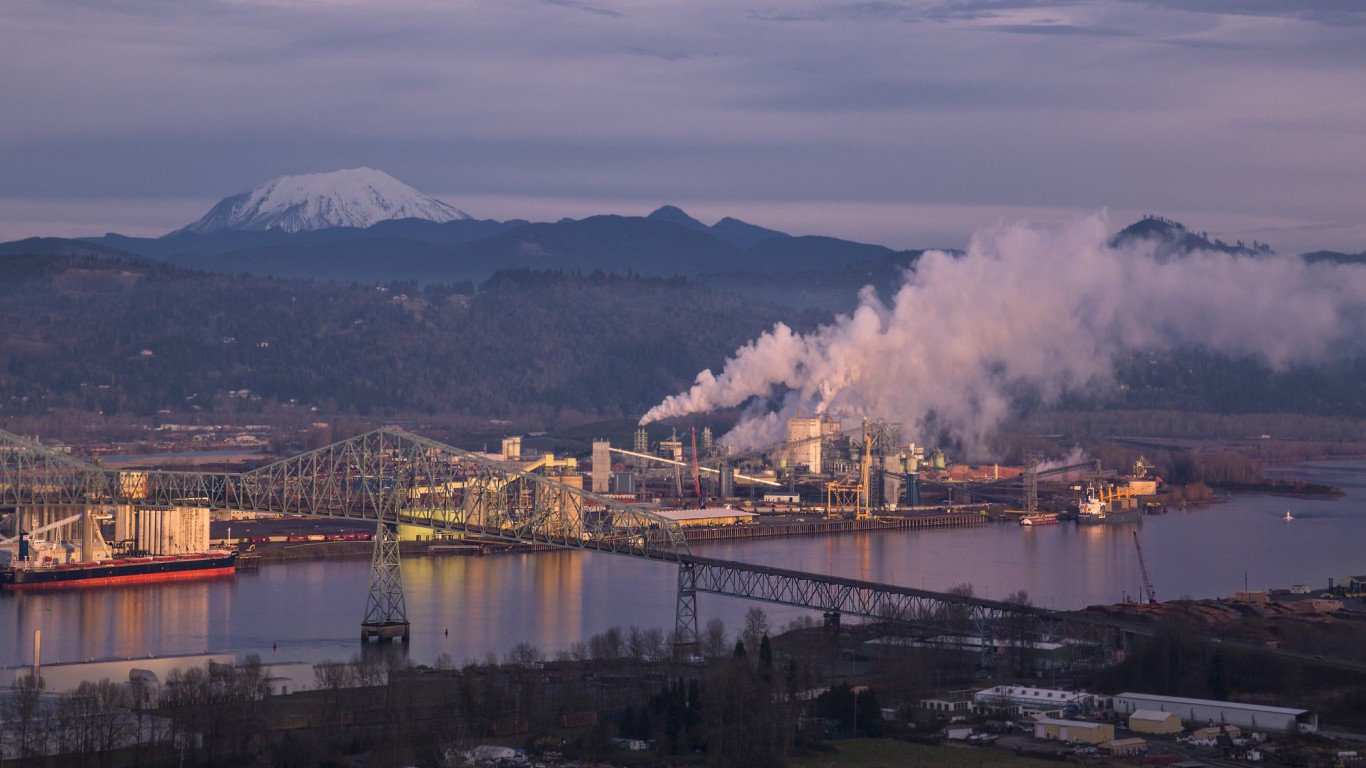
9. Longview, WA
> Avg. hours of full-sun per day: 3 hours, 48 minutes
> Avg. daily max temperature: 56.6 degrees
> Avg. annual precipitation: 75.0 inches
> Population: 106,910
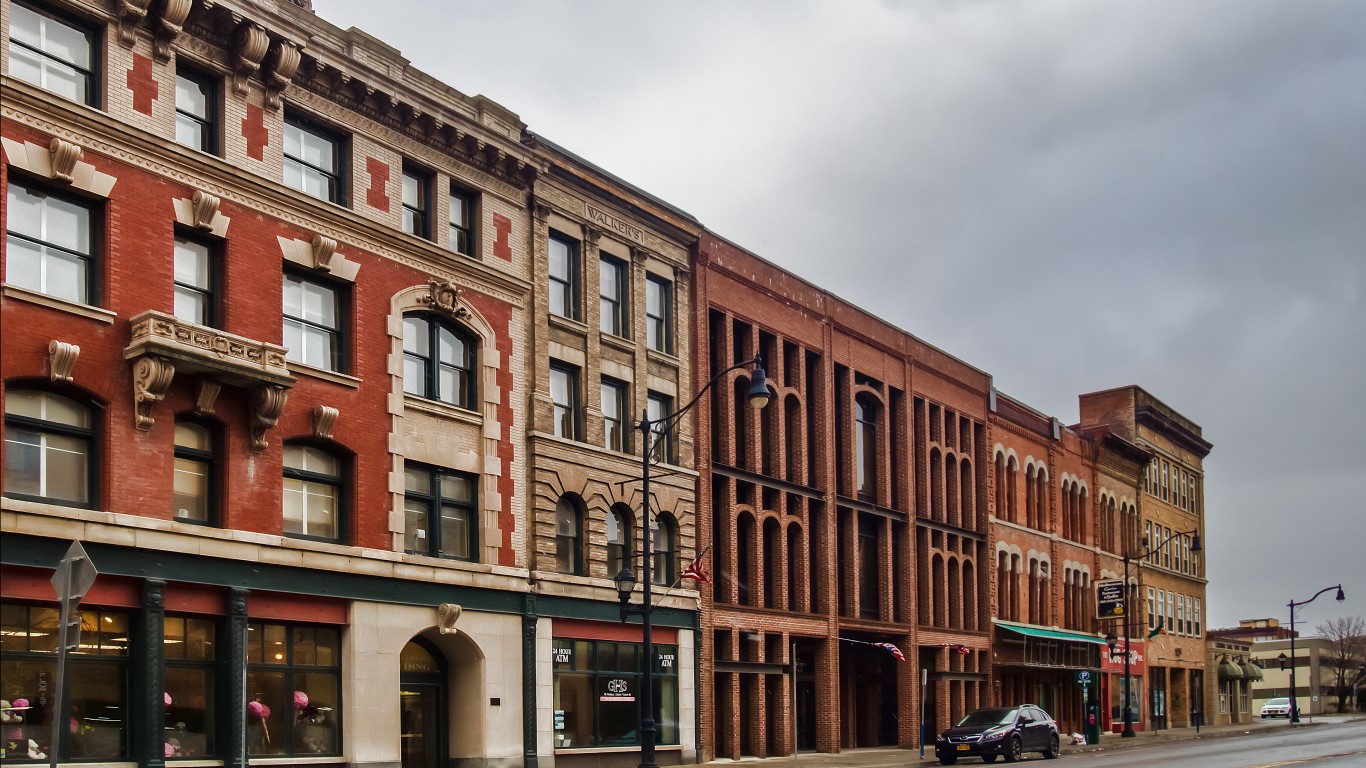
8. Binghamton, NY
> Avg. hours of full-sun per day: 3 hours, 48 minutes
> Avg. daily max temperature: 53.8 degrees
> Avg. annual precipitation: 40.1 inches
> Population: 242,217
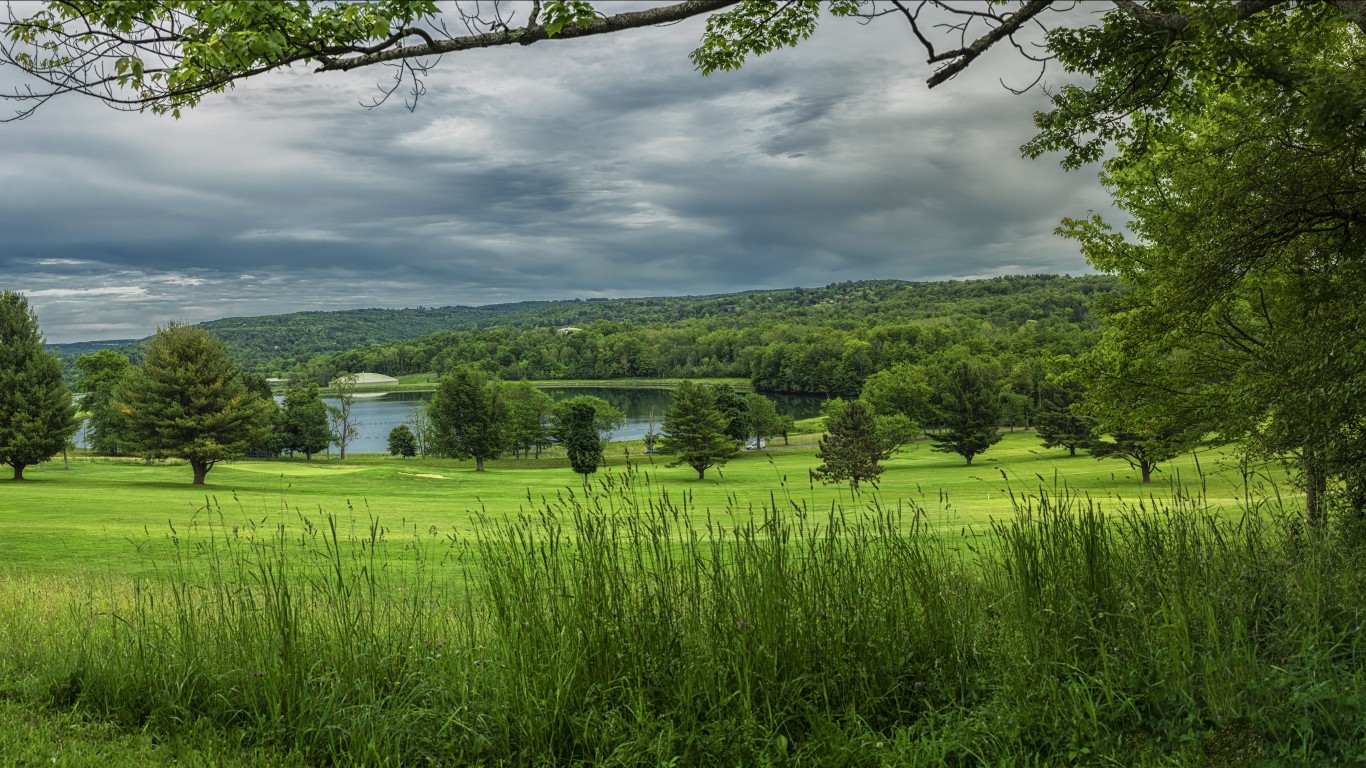
7. Utica-Rome, NY
> Avg. hours of full-sun per day: 3 hours, 47 minutes
> Avg. daily max temperature: 51.4 degrees
> Avg. annual precipitation: 49.3 inches
> Population: 293,572
[in-text-ad-2]
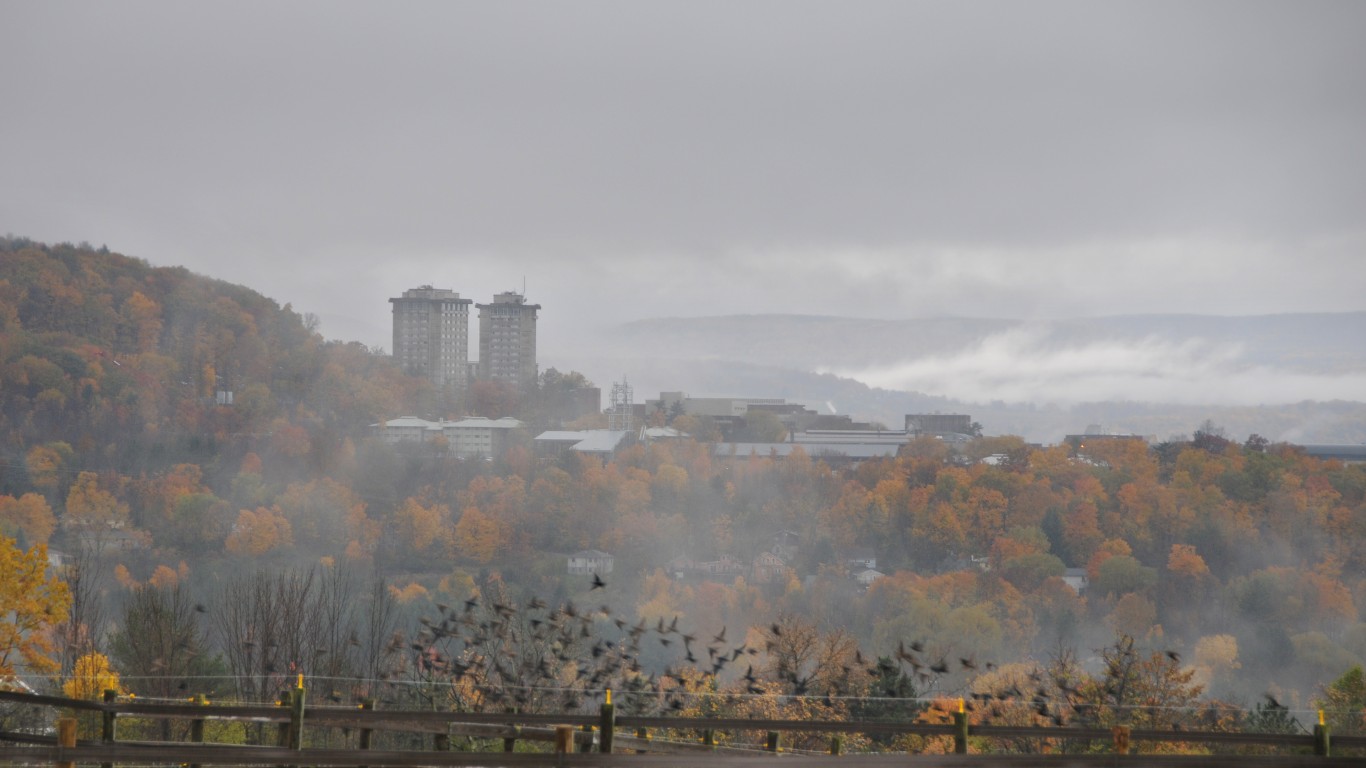
6. Ithaca, NY
> Avg. hours of full-sun per day: 3 hours, 47 minutes
> Avg. daily max temperature: 53.5 degrees
> Avg. annual precipitation: 38.5 inches
> Population: 104,802

5. Duluth, MN-WI
> Avg. hours of full-sun per day: 3 hours, 46 minutes
> Avg. daily max temperature: 48.1 degrees
> Avg. annual precipitation: 28.3 inches
> Population: 278,782
[in-text-ad]
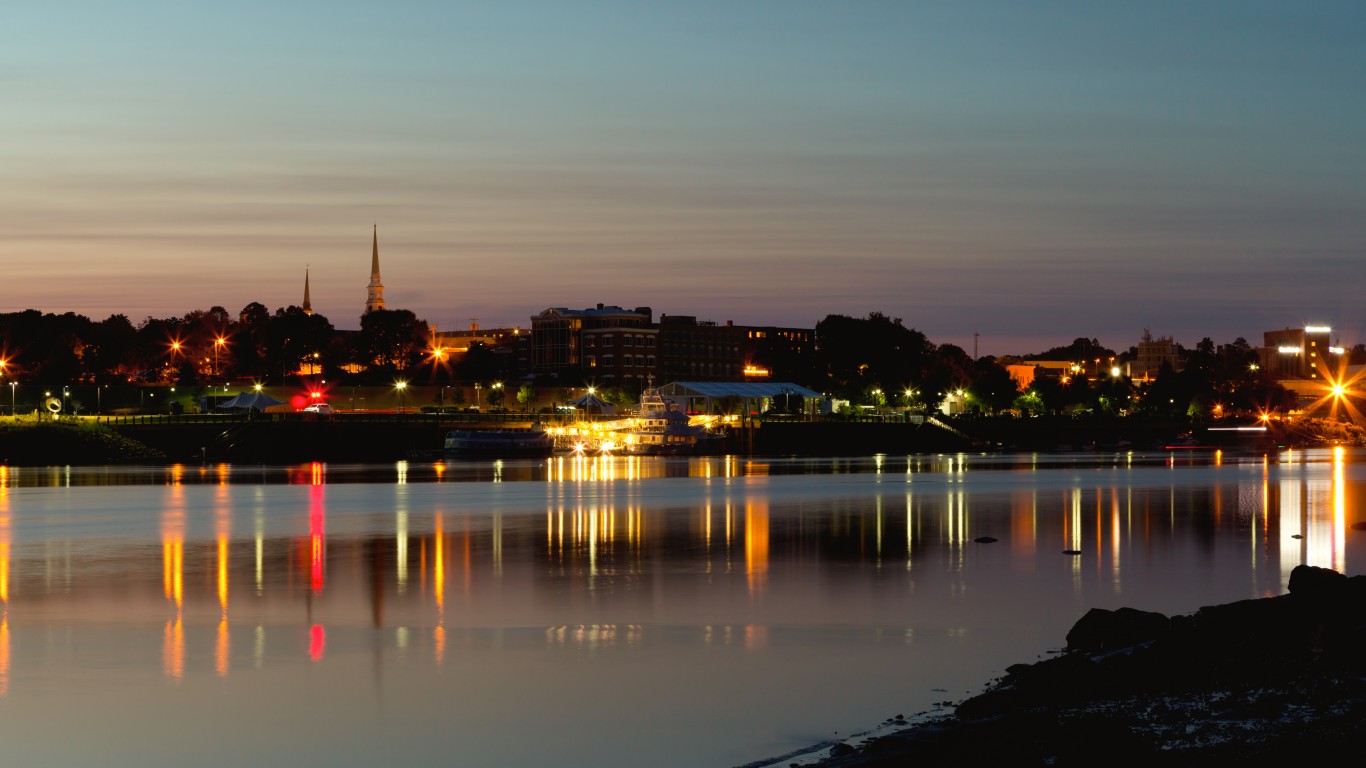
4. Bangor, ME
> Avg. hours of full-sun per day: 3 hours, 45 minutes
> Avg. daily max temperature: 50.3 degrees
> Avg. annual precipitation: 45.0 inches
> Population: 151,957
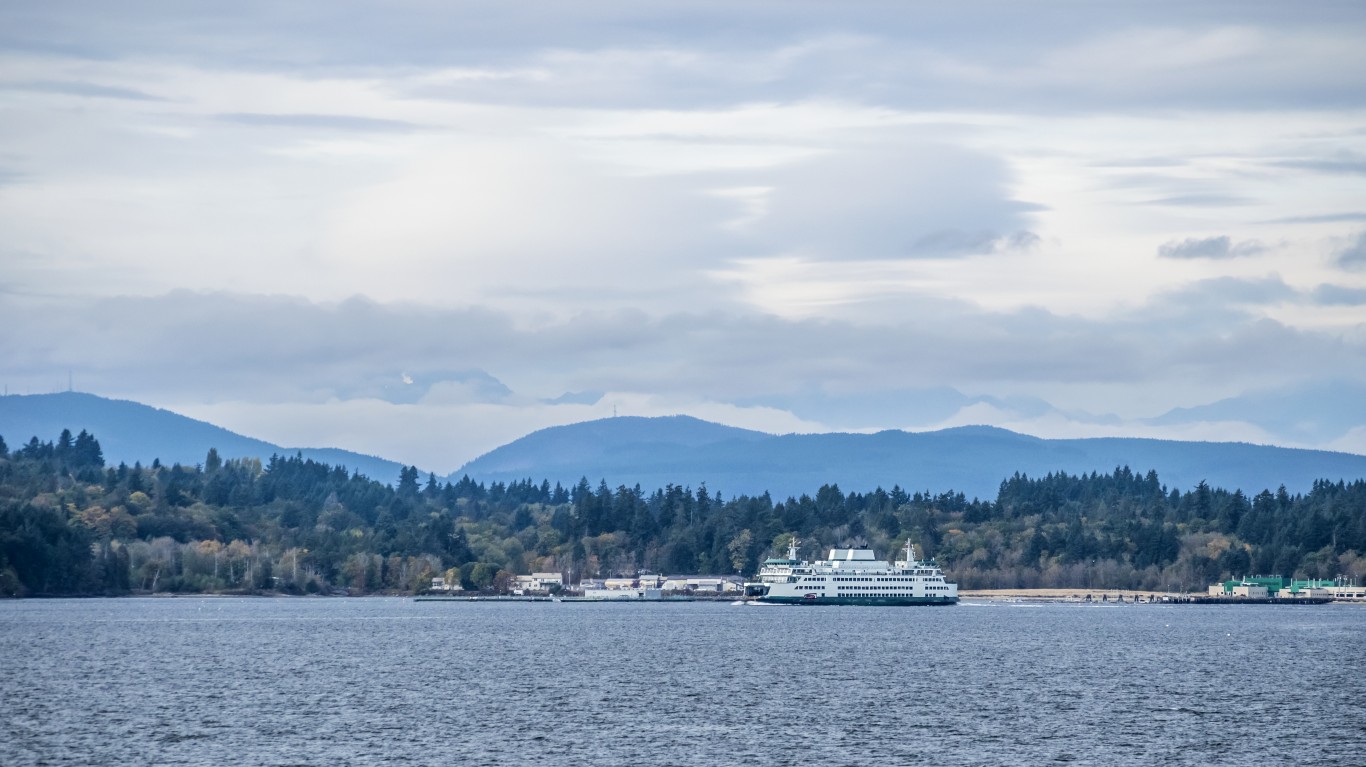
3. Bremerton-Silverdale, WA
> Avg. hours of full-sun per day: 3 hours, 44 minutes
> Avg. daily max temperature: 59.2 degrees
> Avg. annual precipitation: 48.9 inches
> Population: 266,414
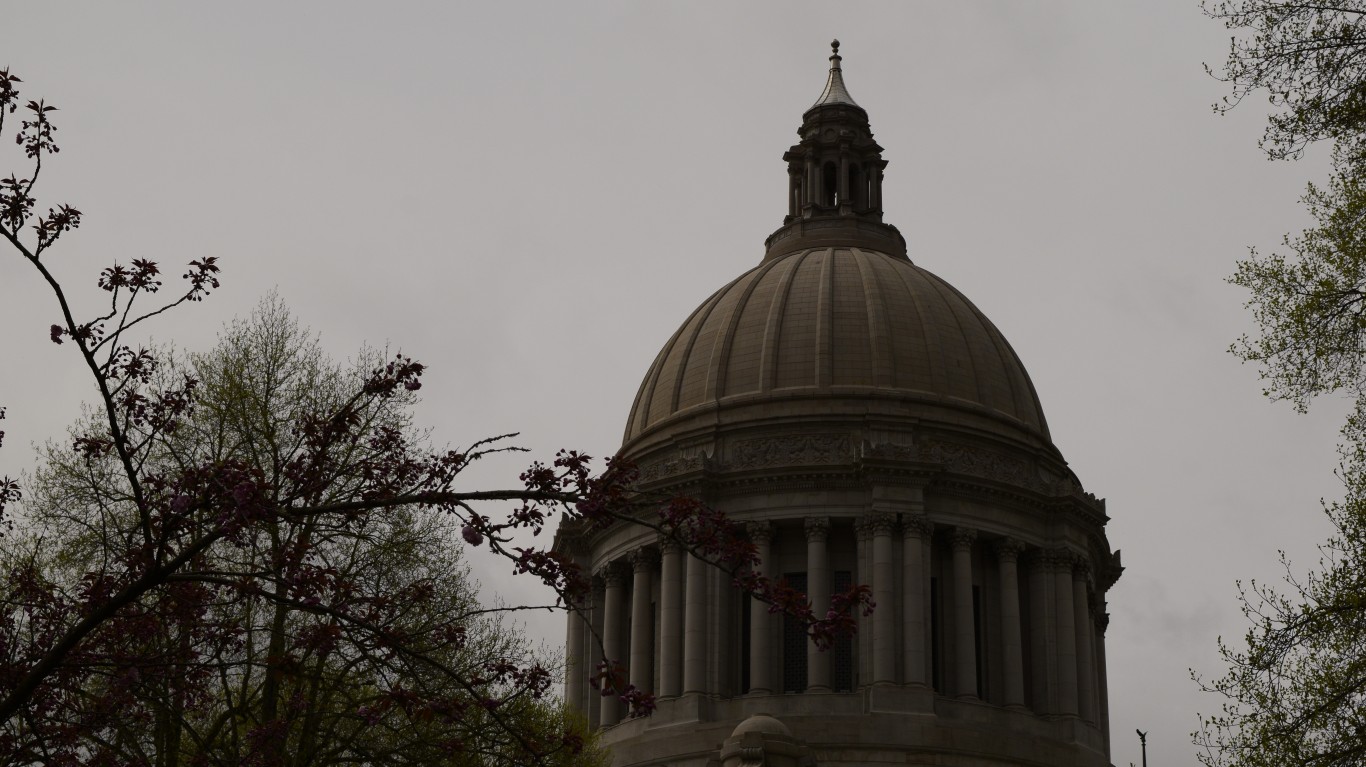
2. Olympia-Tumwater, WA
> Avg. hours of full-sun per day: 3 hours, 44 minutes
> Avg. daily max temperature: 58.8 degrees
> Avg. annual precipitation: 52.9 inches
> Population: 280,588
[in-text-ad-2]
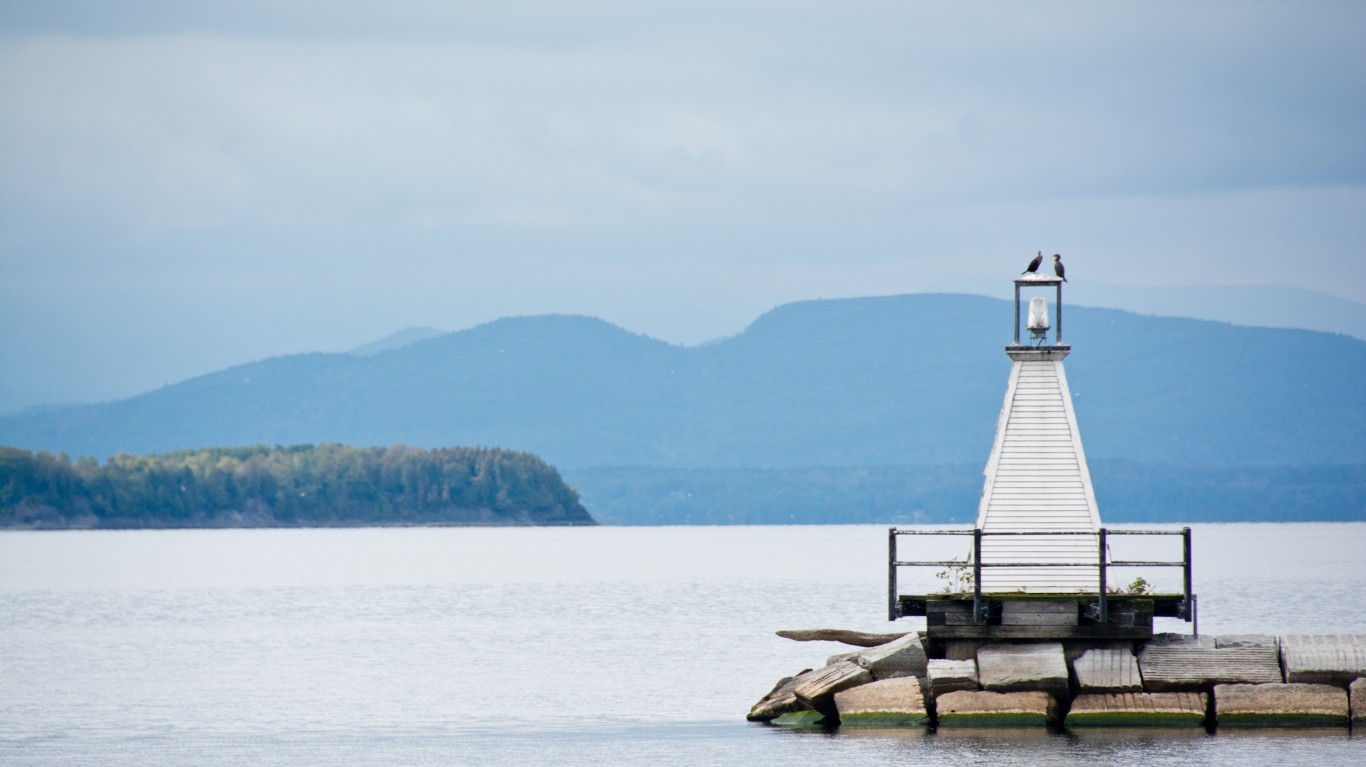
1. Burlington-South Burlington, VT
> Avg. hours of full-sun per day: 3 hours, 40 minutes
> Avg. daily max temperature: 50.9 degrees
> Avg. annual precipitation: 41.0 inches
> Population: 218,341
Methodology
To determine the U.S. cities that get the least sun, 24/7 Wall St. reviewed the metropolitan statistical areas with the fewest hours of peak sun per day. A peak sun-hour is a period during which the intensity of sunlight exceeds 1,000 watts per square meter.
We calculated hours of peak sun from the average kilowatt-hours of sunshine per square meter, or peak sun hours, for all metropolitan areas in the contiguous United States.
Data on kilojoules of sunshine per square meter for the years 1979 to 2011 came from the Centers for Disease Control and Prevention’s North America Land Data Assimilation System (NLDAS) and were converted to kilowatt-hours per square meter and aggregated from the county level to metropolitan statistical area using boundary definitions and land area measurements from the U.S. Census Bureau.
Data on maximum average temperature and rainfall also came from CDC NLDAS and are for the years 1979 to 2011. Population statistics came from the Census Bureau’s 2017 American Community Survey.
100 Million Americans Are Missing This Crucial Retirement Tool
The thought of burdening your family with a financial disaster is most Americans’ nightmare. However, recent studies show that over 100 million Americans still don’t have proper life insurance in the event they pass away.
Life insurance can bring peace of mind – ensuring your loved ones are safeguarded against unforeseen expenses and debts. With premiums often lower than expected and a variety of plans tailored to different life stages and health conditions, securing a policy is more accessible than ever.
A quick, no-obligation quote can provide valuable insight into what’s available and what might best suit your family’s needs. Life insurance is a simple step you can take today to help secure peace of mind for your loved ones tomorrow.
Click here to learn how to get a quote in just a few minutes.
Thank you for reading! Have some feedback for us?
Contact the 24/7 Wall St. editorial team.
 24/7 Wall St.


