
As autumn approaches, those still looking for a summer tan may find that the days begin to get shorter. In some of the sunnier parts of the country, however, sunbathers get more than two extra hours of strong sunshine on an average day.
24/7 Wall St. reviewed the metropolitan statistical areas with the fewest hours of peak sun per day using data from the Centers for Disease Control and Prevention’s North America Land Data Assimilation System (NLDAS). A peak sun-hour is a period during which the intensity of sunlight exceeds 1,000 watts per square meter.
The West and South receive, respectively, 4.8% and 4.7% more daily sunshine than the average nationwide, while the Northeast and Midwest receive 14.7% and 8.9% less.
Of the 30 cities that get the most sun, 15 are in California, six are in Florida, five in Arizona, and two in Texas. Nevada and New Mexico are each home to one city. Many of the cities that get the most sun are also among the hottest cities in America and among places where weather is getting worse because of climate change.
Click here to see the U.S. cities that get the most sun
Click here to read our methodology
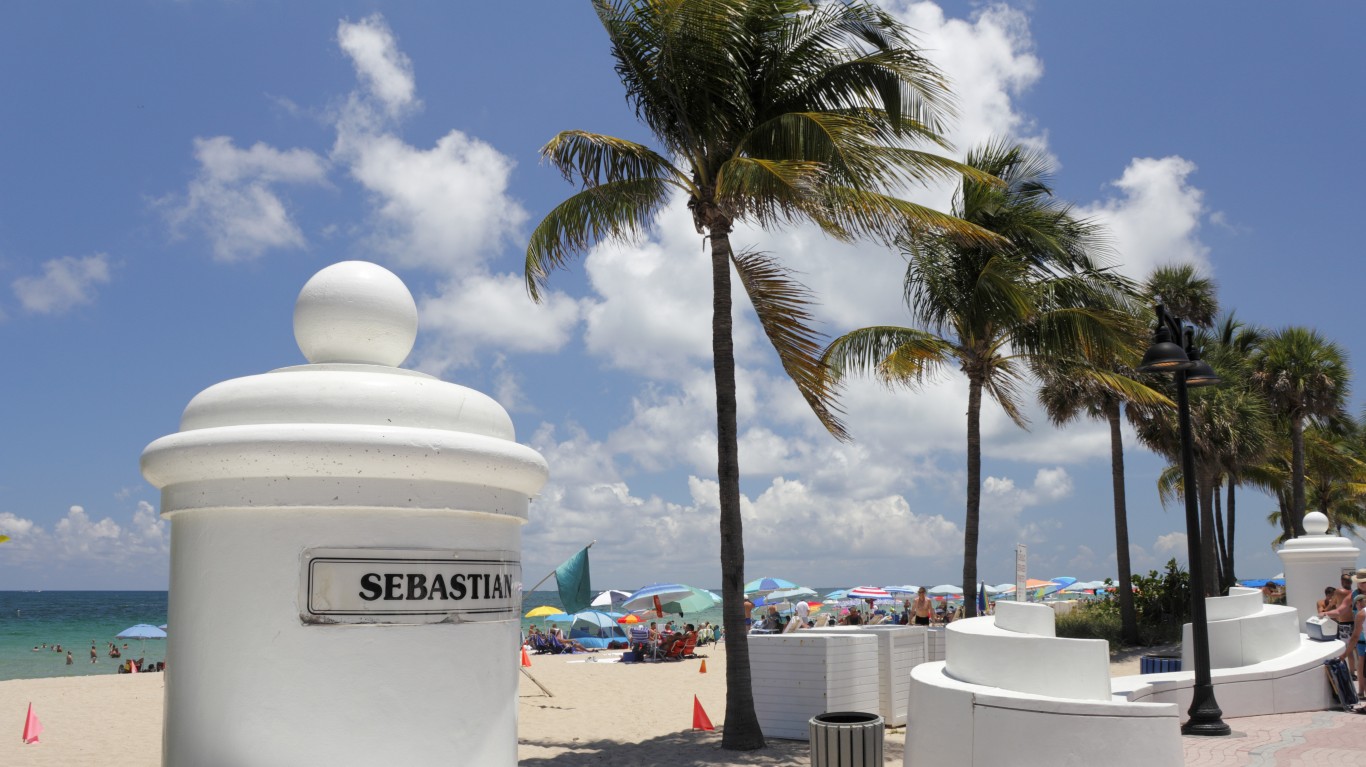
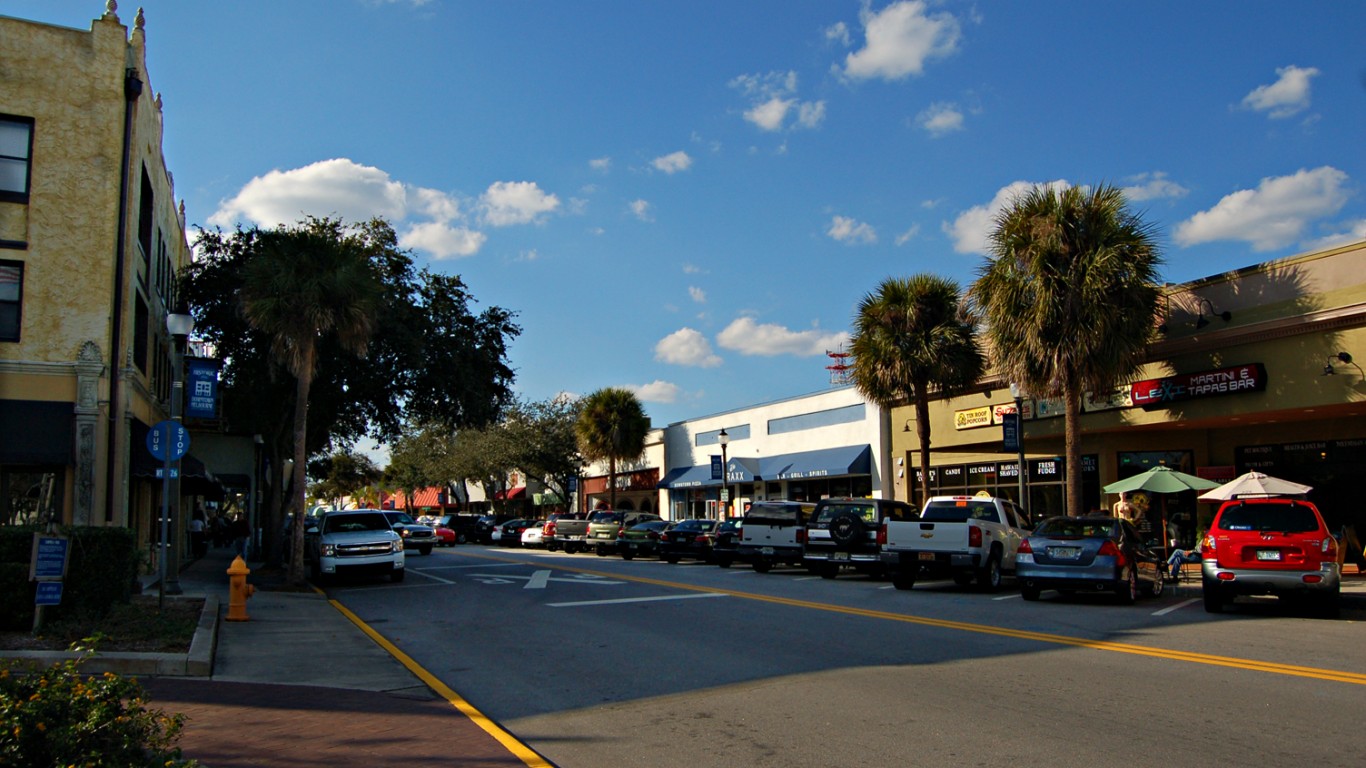
30. Sebastian-Vero Beach, FL
> Avg. hours of full-sun per day: 5 hours, 21 minutes
> Avg. daily max temperature: 82.1 degrees
> Avg. annual precipitation: 54.6 inches
> Population: 154,383
[in-text-ad]

29. Modesto, CA
> Avg. hours of full-sun per day: 5 hours, 22 minutes
> Avg. daily max temperature: 75.9 degrees
> Avg. annual precipitation: 13.5 inches
> Population: 547,899
[recirclink id=564787]

28. Miami-Fort Lauderdale-West Palm Beach, FL
> Avg. hours of full-sun per day: 5 hours, 22 minutes
> Avg. daily max temperature: 82.4 degrees
> Avg. annual precipitation: 52.1 inches
> Population: 6,158,824

27. Punta Gorda, FL
> Avg. hours of full-sun per day: 5 hours, 22 minutes
> Avg. daily max temperature: 81.5 degrees
> Avg. annual precipitation: 49.1 inches
> Population: 182,033
[in-text-ad-2]

26. Port St. Lucie, FL
> Avg. hours of full-sun per day: 5 hours, 22 minutes
> Avg. daily max temperature: 81.0 degrees
> Avg. annual precipitation: 51.3 inches
> Population: 473,429

25. Fresno, CA
> Avg. hours of full-sun per day: 5 hours, 23 minutes
> Avg. daily max temperature: 68.1 degrees
> Avg. annual precipitation: 20.8 inches
> Population: 989,255
[in-text-ad]

24. Naples-Immokalee-Marco Island, FL
> Avg. hours of full-sun per day: 5 hours, 23 minutes
> Avg. daily max temperature: 82.8 degrees
> Avg. annual precipitation: 52.6 inches
> Population: 372,880
[recirclink id=467830]
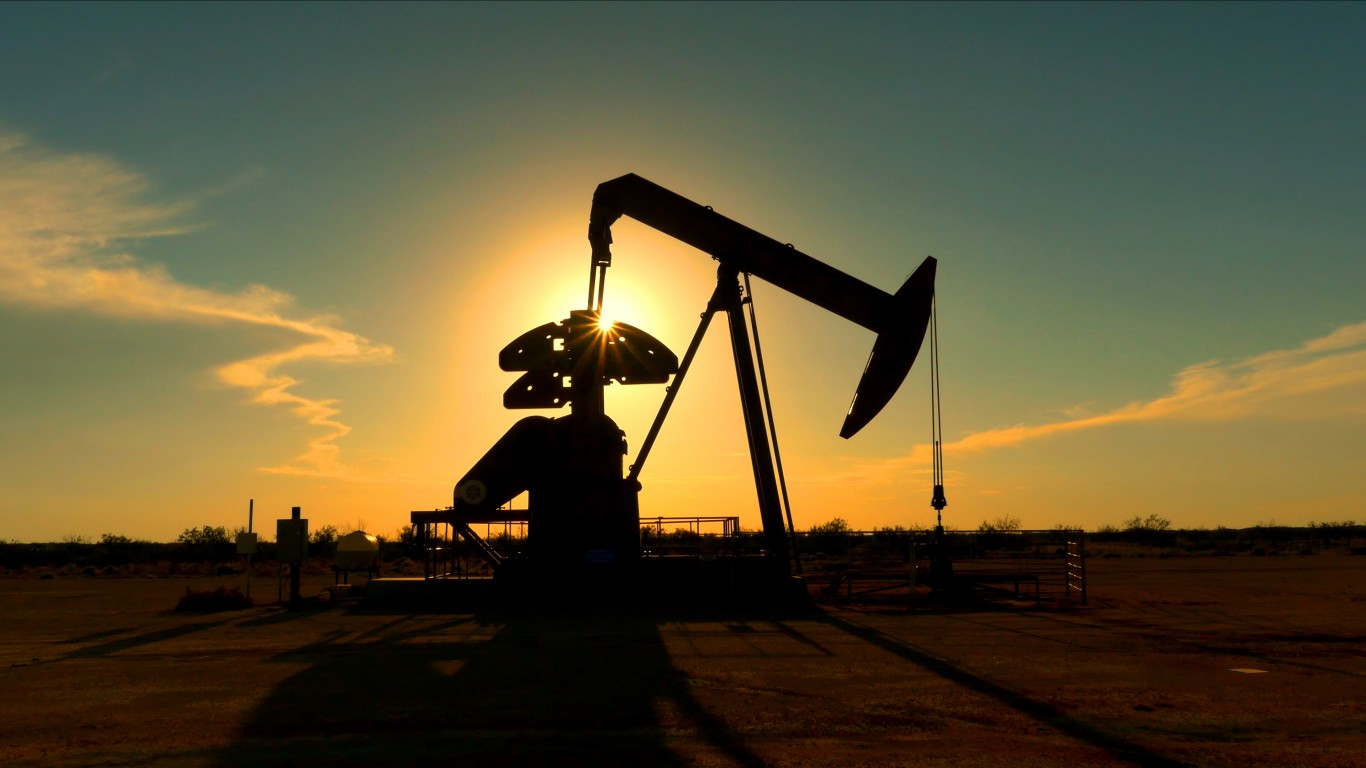
23. Odessa, TX
> Avg. hours of full-sun per day: 5 hours, 23 minutes
> Avg. daily max temperature: 77.9 degrees
> Avg. annual precipitation: 15.5 inches
> Population: 157,087

22. Lake Havasu City-Kingman, AZ
> Avg. hours of full-sun per day: 5 hours, 24 minutes
> Avg. daily max temperature: 72.4 degrees
> Avg. annual precipitation: 10.5 inches
> Population: 207,200
[in-text-ad-2]

21. Las Vegas-Henderson-Paradise, NV
> Avg. hours of full-sun per day: 5 hours, 24 minutes
> Avg. daily max temperature: 74.6 degrees
> Avg. annual precipitation: 7.6 inches
> Population: 2,204,079

20. Merced, CA
> Avg. hours of full-sun per day: 5 hours, 24 minutes
> Avg. daily max temperature: 77.4 degrees
> Avg. annual precipitation: 12.4 inches
> Population: 272,673
[in-text-ad]

19. Visalia-Porterville, CA
> Avg. hours of full-sun per day: 5 hours, 25 minutes
> Avg. daily max temperature: 66.1 degrees
> Avg. annual precipitation: 19.5 inches
> Population: 464,493
[recirclink id=503672]

18. San Jose-Sunnyvale-Santa Clara, CA
> Avg. hours of full-sun per day: 5 hours, 25 minutes
> Avg. daily max temperature: 70.8 degrees
> Avg. annual precipitation: 18.1 inches
> Population: 1,998,463

17. Hanford-Corcoran, CA
> Avg. hours of full-sun per day: 5 hours, 27 minutes
> Avg. daily max temperature: 80.5 degrees
> Avg. annual precipitation: 7.9 inches
> Population: 150,101
[in-text-ad-2]

16. Salinas, CA
> Avg. hours of full-sun per day: 5 hours, 31 minutes
> Avg. daily max temperature: 69.6 degrees
> Avg. annual precipitation: 19.3 inches
> Population: 437,907
15. Bakersfield, CA
> Avg. hours of full-sun per day: 5 hours, 32 minutes
> Avg. daily max temperature: 75.2 degrees
> Avg. annual precipitation: 9.3 inches
> Population: 893,119
[in-text-ad]

14. El Paso, TX
> Avg. hours of full-sun per day: 5 hours, 33 minutes
> Avg. daily max temperature: 74.9 degrees
> Avg. annual precipitation: 11.2 inches
> Population: 842,677
[recirclink id=558149]
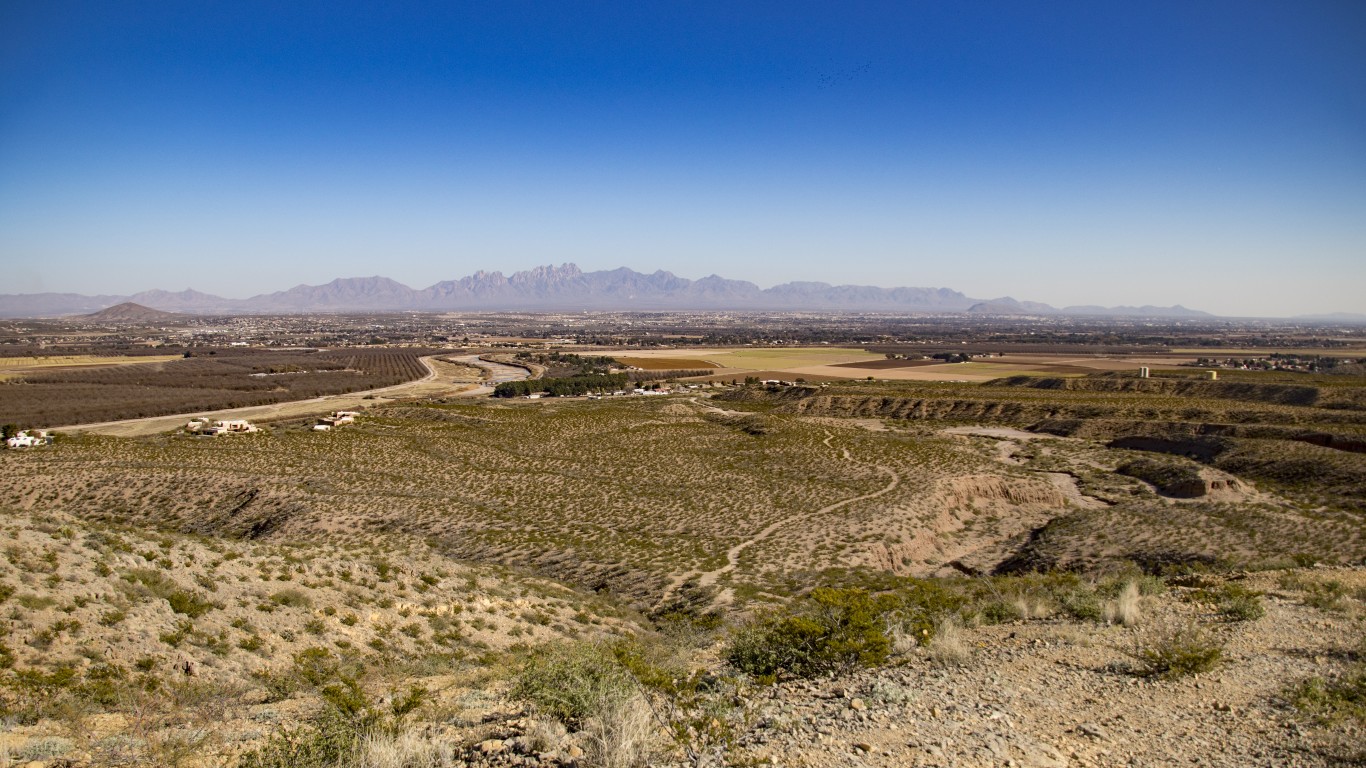
13. Las Cruces, NM
> Avg. hours of full-sun per day: 5 hours, 33 minutes
> Avg. daily max temperature: 74.3 degrees
> Avg. annual precipitation: 10.8 inches
> Population: 215,579

12. San Luis Obispo-Paso Robles-Arroyo Grande, CA
> Avg. hours of full-sun per day: 5 hours, 34 minutes
> Avg. daily max temperature: 70.9 degrees
> Avg. annual precipitation: 16.1 inches
> Population: 283,405
[in-text-ad-2]

11. Oxnard-Thousand Oaks-Ventura, CA
> Avg. hours of full-sun per day: 5 hours, 36 minutes
> Avg. daily max temperature: 70.7 degrees
> Avg. annual precipitation: 19.4 inches
> Population: 854,223

10. Los Angeles-Long Beach-Anaheim, CA
> Avg. hours of full-sun per day: 5 hours, 37 minutes
> Avg. daily max temperature: 71.1 degrees
> Avg. annual precipitation: 15.2 inches
> Population: 13,353,907
[in-text-ad]

9. Riverside-San Bernardino-Ontario, CA
> Avg. hours of full-sun per day: 5 hours, 37 minutes
> Avg. daily max temperature: 77.6 degrees
> Avg. annual precipitation: 7.2 inches
> Population: 4,580,670
[recirclink id=563463]

8. Sierra Vista-Douglas, AZ
> Avg. hours of full-sun per day: 5 hours, 37 minutes
> Avg. daily max temperature: 73.5 degrees
> Avg. annual precipitation: 14.4 inches
> Population: 124,756
7. Palm Bay-Melbourne-Titusville, FL
> Avg. hours of full-sun per day: 5 hours, 39 minutes
> Avg. daily max temperature: 80.6 degrees
> Avg. annual precipitation: 52.9 inches
> Population: 589,162
[in-text-ad-2]
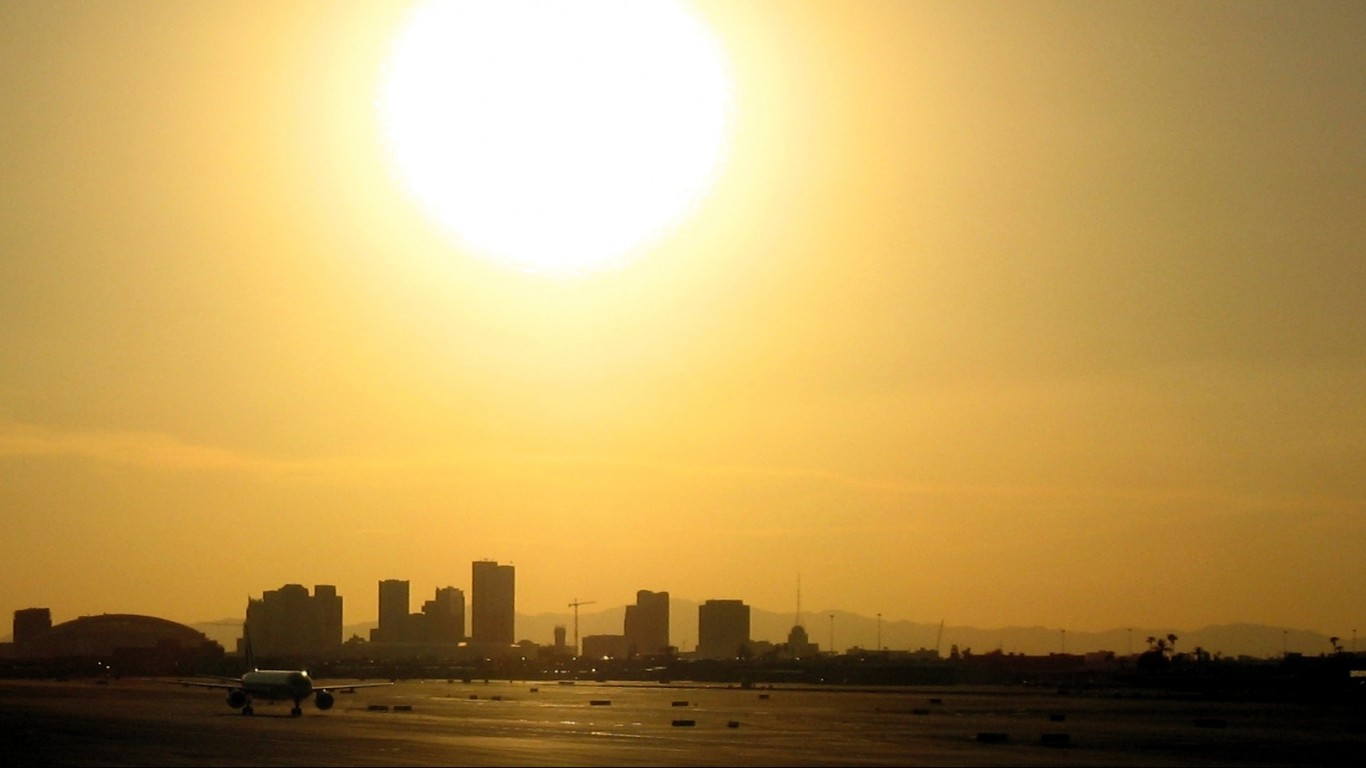
6. Phoenix-Mesa-Scottsdale, AZ
> Avg. hours of full-sun per day: 5 hours, 40 minutes
> Avg. daily max temperature: 81.7 degrees
> Avg. annual precipitation: 10.3 inches
> Population: 4,737,270
5. Yuma, AZ
> Avg. hours of full-sun per day: 5 hours, 41 minutes
> Avg. daily max temperature: 84.3 degrees
> Avg. annual precipitation: 4.9 inches
> Population: 207,534
[in-text-ad]

4. Tucson, AZ
> Avg. hours of full-sun per day: 5 hours, 41 minutes
> Avg. daily max temperature: 78.9 degrees
> Avg. annual precipitation: 11.8 inches
> Population: 1,022,769
[recirclink id=554609]
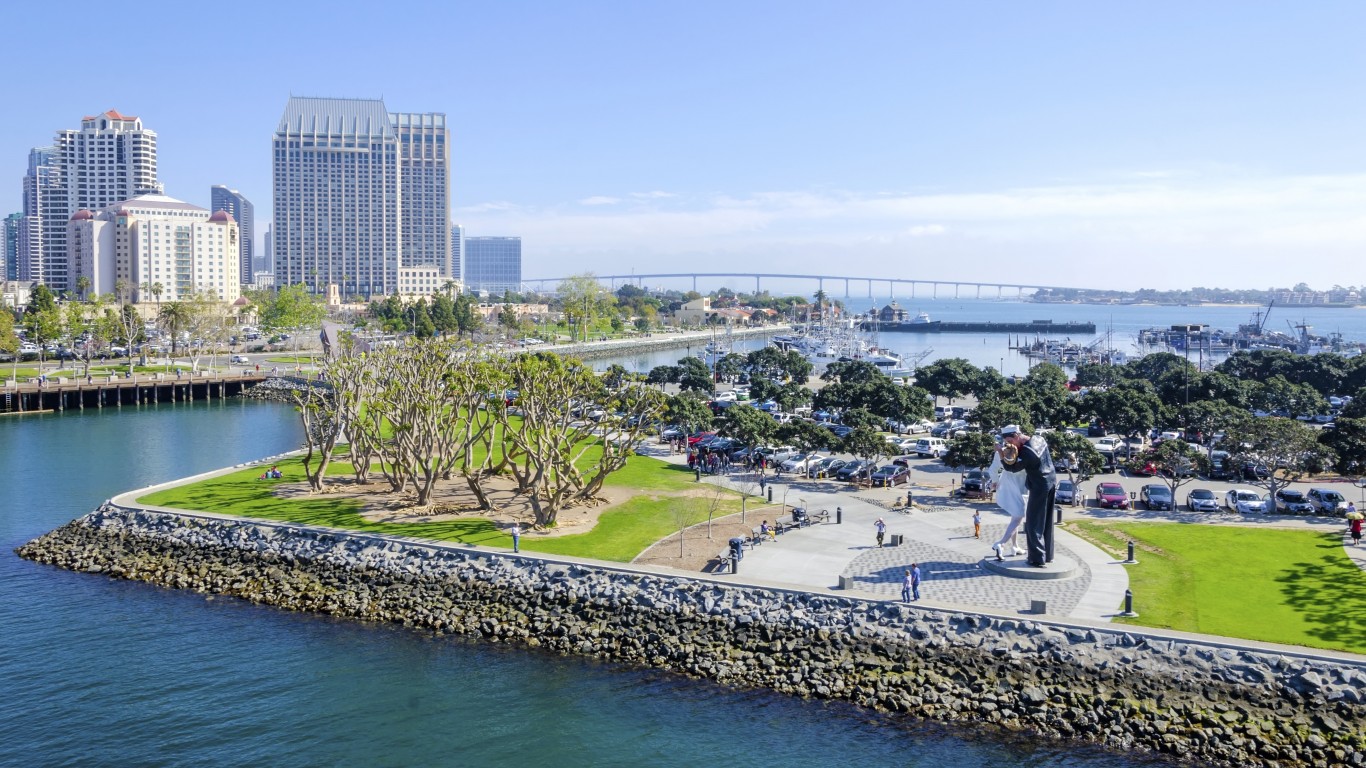
3. San Diego-Carlsbad, CA
> Avg. hours of full-sun per day: 5 hours, 42 minutes
> Avg. daily max temperature: 72.2 degrees
> Avg. annual precipitation: 14.5 inches
> Population: 3,337,685

2. Santa Maria-Santa Barbara, CA
> Avg. hours of full-sun per day: 5 hours, 42 minutes
> Avg. daily max temperature: 69.6 degrees
> Avg. annual precipitation: 20.7 inches
> Population: 448,150
[in-text-ad-2]
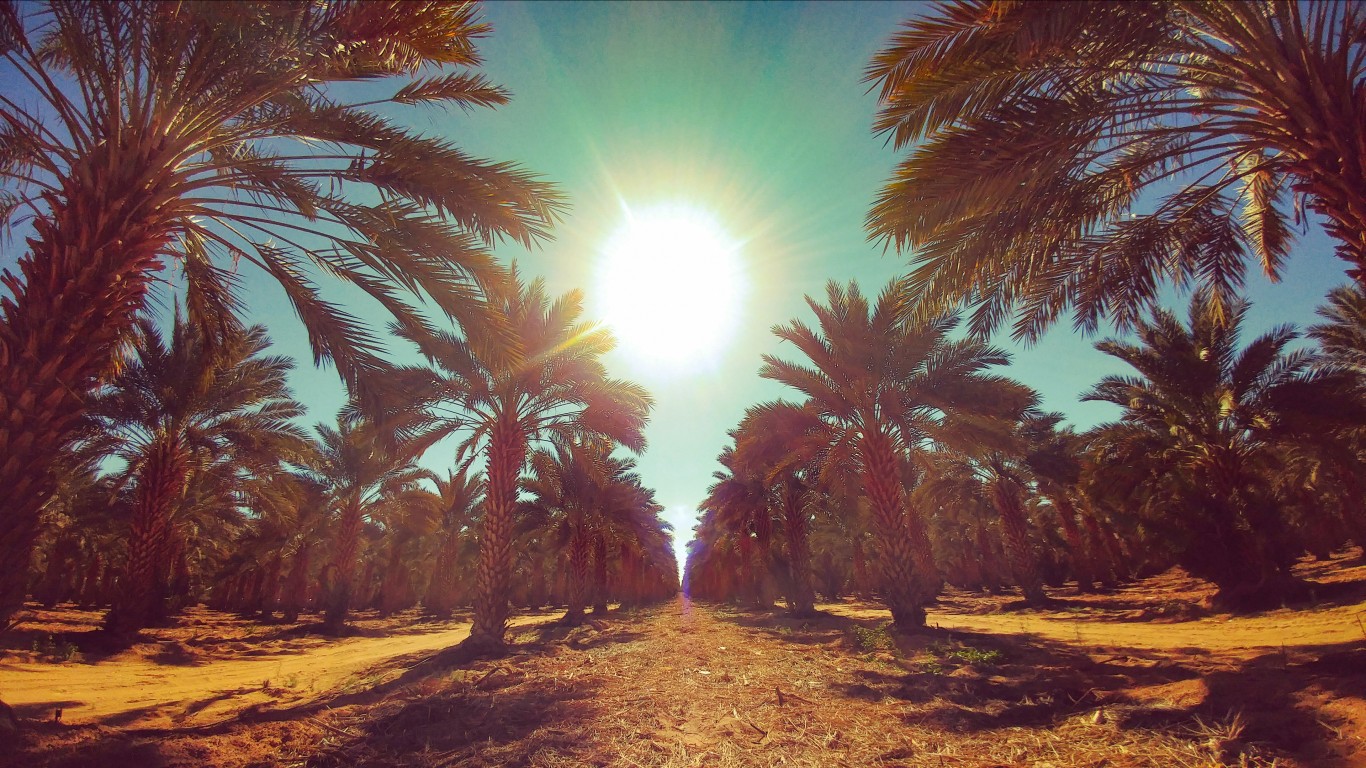
1. El Centro, CA
> Avg. hours of full-sun per day: 5 hours, 46 minutes
> Avg. daily max temperature: 86.5 degrees
> Avg. annual precipitation: 3.6 inches
> Population: 182,830
Methodology
To determine the U.S. cities that get the least sun, 24/7 Wall St. reviewed the metropolitan statistical areas with the fewest hours of peak sun per day. A peak sun-hour is a period during which the intensity of sunlight exceeds 1,000 watts per square meter.
We calculated hours of peak sun from the average kilowatt-hours of sunshine per square meter, or peak sun hours, for all metropolitan areas in the contiguous United States.
Data on kilojoules of sunshine per square meter for the years 1979 to 2011 came from the Centers for Disease Control and Prevention’s North America Land Data Assimilation System (NLDAS) and were converted to kilowatt-hours per square meter and aggregated from the county level to metropolitan statistical area using boundary definitions and land area measurements from the U.S. Census Bureau.
Data on maximum average temperature and rainfall also came from CDC NLDAS and are for the years 1979 to 2011. Population statistics came from the Census Bureau’s 2017 American Community Survey.