Fewer than two out of every three Americans lived in an urban area in the middle of the 20th century. Since then, millions of Americans have flocked to cities — and that trend is expected to continue for the foreseeable future. According to United Nations projections, some 87.4% of Americans will live in an urban area in 2050.
For many younger Americans moving to big cities, the draw is often job and career opportunities. Older Americans may choose to relocate to an urban area for walkability, access to services, shopping, and other amenities.
No matter the reason, moving can be an expensive undertaking — especially for those looking to move to certain cities. Using data from the U.S. Census Bureau and Move, Inc., a relocation planning resource, 24/7 Wall St. identified the 25 most expensive cities to move to. Cities were ranked based on the average cost to move household goods as well median monthly rent and a security deposit.
The high costs often do not end with the move, especially in many of these metro areas. In 19 of the 25 cities on this list, the average cost of goods and services is higher than it is nationwide on average. Many of these cities rank among the most expensive places to live in the country. Here is a list of the most expensive city in every state.
These higher moving costs and higher costs of living, however, can often be offset with higher paying jobs in many of these cities. In all but three metro areas on this list, the typical household earns more than the median annual household income of $60,336 nationwide. Several even rank among the richest cities in America, with the majority of households earning six figures annually. Here is a full list of America’s 25 richest cities.
Click here to see the 25 most expensive cities to move to
Click here to read our methodology

25. Chicago-Naperville-Elgin, IL-IN-WI Metro Area
> Avg. total moving cost: $3,536
> 1st month’s rent and deposit: $2,156
> Median household income: $55,295
> Population change from migration (2010-2018): -3.8%
[in-text-ad]

24. New Haven-Milford, CT Metro Area
> Avg. total moving cost: $3,550
> 1st month’s rent and deposit: $2,214
> Median household income: $44,445
> Population change from migration (2010-2018): -1.7%

23. Virginia Beach-Norfolk-Newport News, VA-NC Metro Area
> Avg. total moving cost: $3,559
> 1st month’s rent and deposit: $2,248
> Median household income: $72,586
> Population change from migration (2010-2018): -1.2%

22. Atlanta-Sandy Springs-Roswell, GA Metro Area
> Avg. total moving cost: $3,560
> 1st month’s rent and deposit: $2,230
> Median household income: $57,597
> Population change from migration (2010-2018): +6.0%
[in-text-ad-2]

21. Colorado Springs, CO Metro Area
> Avg. total moving cost: $3,609
> 1st month’s rent and deposit: $2,292
> Median household income: $59,514
> Population change from migration (2010-2018): +6.9%

20. Orlando-Kissimmee-Sanford, FL Metro Area
> Avg. total moving cost: $3,613
> 1st month’s rent and deposit: $2,302
> Median household income: $47,594
> Population change from migration (2010-2018): +13.7%
[in-text-ad]

19. Stockton-Lodi, CA Metro Area
> Avg. total moving cost: $3,635
> 1st month’s rent and deposit: $2,296
> Median household income: $51,336
> Population change from migration (2010-2018): +3.7%

18. North Port-Sarasota-Bradenton, FL Metro Area
> Avg. total moving cost: $3,647
> 1st month’s rent and deposit: $2,342
> Median household income: $53,662
> Population change from migration (2010-2018): +17.5%

17. Austin-Round Rock, TX Metro Area
> Avg. total moving cost: $3,762
> 1st month’s rent and deposit: $2,446
> Median household income: $67,755
> Population change from migration (2010-2018): +14.7%
[in-text-ad-2]

16. Baltimore-Columbia-Towson, MD Metro Area
> Avg. total moving cost: $3,830
> 1st month’s rent and deposit: $2,482
> Median household income: $47,131
> Population change from migration (2010-2018): +0.5%

15. Sacramento–Roseville–Arden-Arcade, CA Metro Area
> Avg. total moving cost: $3,831
> 1st month’s rent and deposit: $2,492
> Median household income: $56,943
> Population change from migration (2010-2018): +4.7%
[in-text-ad]

14. Portland-Vancouver-Hillsboro, OR-WA Metro Area
> Avg. total moving cost: $3,846
> 1st month’s rent and deposit: $2,476
> Median household income: $66,187
> Population change from migration (2010-2018): +6.6%

13. Riverside-San Bernardino-Ontario, CA Metro Area
> Avg. total moving cost: $3,858
> 1st month’s rent and deposit: $2,536
> Median household income: $66,928
> Population change from migration (2010-2018): +2.9%
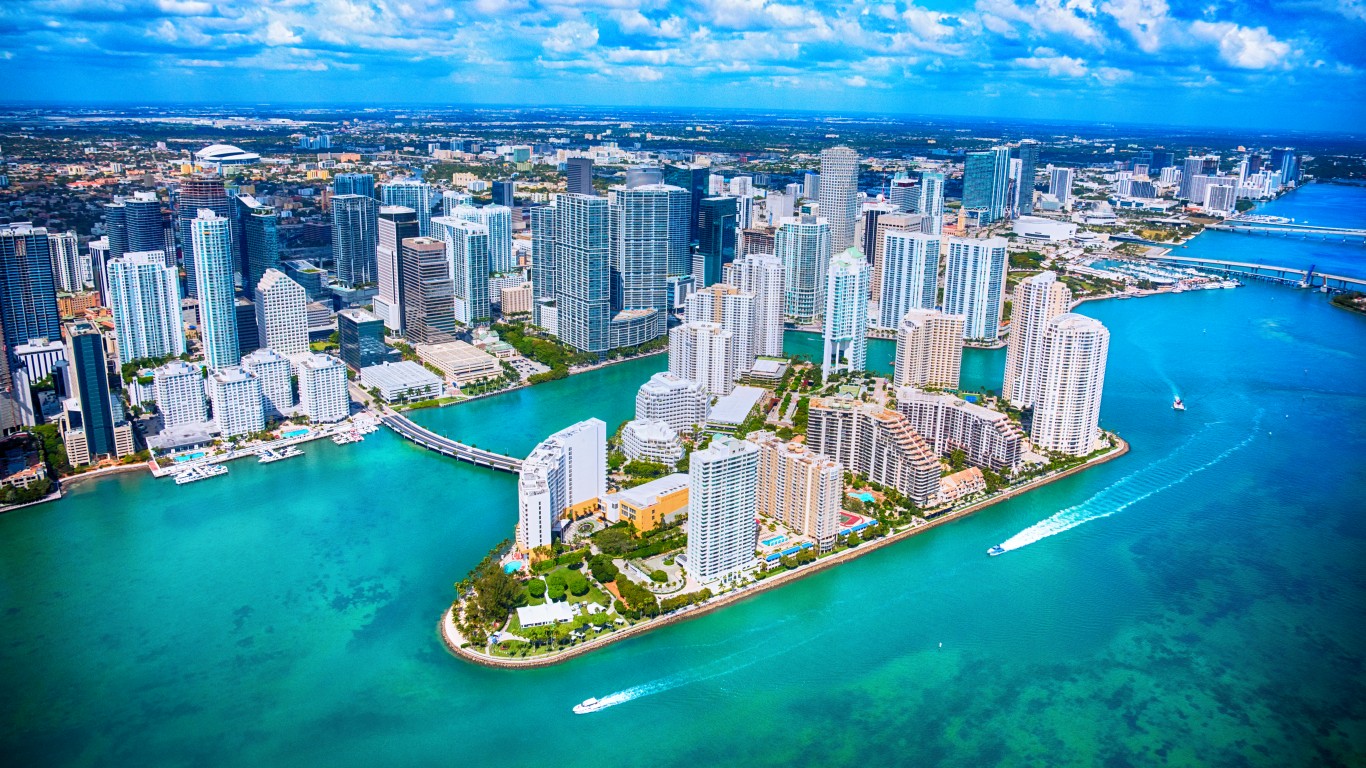
12. Miami-Fort Lauderdale-West Palm Beach, FL Metro Area
> Avg. total moving cost: $3,966
> 1st month’s rent and deposit: $2,632
> Median household income: $40,327
> Population change from migration (2010-2018): +7.7%
[in-text-ad-2]

11. Denver-Aurora-Lakewood, CO Metro Area
> Avg. total moving cost: $4,054
> 1st month’s rent and deposit: $2,704
> Median household income: $65,224
> Population change from migration (2010-2018): +8.2%

10. Boston-Cambridge-Newton, MA-NH Metro Area
> Avg. total moving cost: $4,177
> 1st month’s rent and deposit: $2,794
> Median household income: $66,758
> Population change from migration (2010-2018): +4.1%
[in-text-ad]

9. Seattle-Tacoma-Bellevue, WA Metro Area
> Avg. total moving cost: $4,248
> 1st month’s rent and deposit: $2,886
> Median household income: $86,822
> Population change from migration (2010-2018): +8.2%

8. Los Angeles-Long Beach-Anaheim, CA Metro Area
> Avg. total moving cost: $4,333
> 1st month’s rent and deposit: $2,952
> Median household income: $60,197
> Population change from migration (2010-2018): -1.7%

7. New York-Newark-Jersey City, NY-NJ-PA Metro Area
> Avg. total moving cost: $4,337
> 1st month’s rent and deposit: $2,758
> Median household income: $60,879
> Population change from migration (2010-2018): -2.2%
[in-text-ad-2]
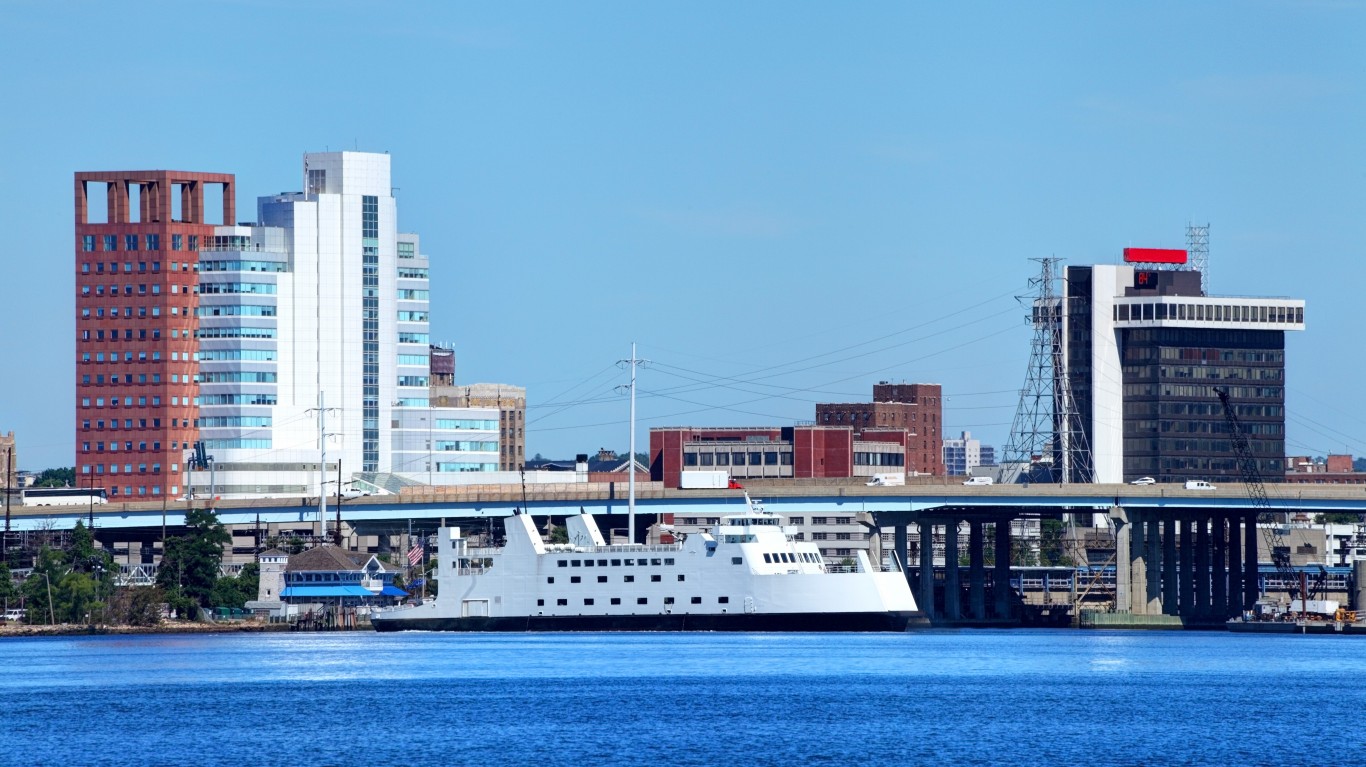
6. Bridgeport-Stamford-Norwalk, CT Metro Area
> Avg. total moving cost: $4,365
> 1st month’s rent and deposit: $2,876
> Median household income: $45,048
> Population change from migration (2010-2018): -0.1%

5. San Diego-Carlsbad, CA Metro Area
> Avg. total moving cost: $4,594
> 1st month’s rent and deposit: $3,196
> Median household income: $76,662
> Population change from migration (2010-2018): +1.9%
[in-text-ad]

4. Washington-Arlington-Alexandria, DC-VA-MD-WV Metro Area
> Avg. total moving cost: $4,626
> 1st month’s rent and deposit: $3,258
> Median household income: $82,372
> Population change from migration (2010-2018): +3.6%

3. Oxnard-Thousand Oaks-Ventura, CA Metro Area
> Avg. total moving cost: $4,855
> 1st month’s rent and deposit: $3,472
> Median household income: $68,994
> Population change from migration (2010-2018): -1.3%

2. San Francisco-Oakland-Hayward, CA Metro Area
> Avg. total moving cost: $5,089
> 1st month’s rent and deposit: $3,706
> Median household income: $110,816
> Population change from migration (2010-2018): +4.5%
[in-text-ad-2]

1. San Jose-Sunnyvale-Santa Clara, CA Metro Area
> Avg. total moving cost: $5,809
> 1st month’s rent and deposit: $4,426
> Median household income: $104,675
> Population change from migration (2010-2018): +2.4%
Methodology
To determine the 25 most expensive cities to move, 24/7 Wall St. calculated the total cost of moving, one month’s rent, and a security deposit. The rent is for a three-bedroom housing unit, and the security deposit is equivalent to one month’s rent. The estimated moving cost is within the most populated zip code in the principal city of each metro area and is based on the average cost of a three bedroom move. Packing costs were not included in the estimate. The median price of rent comes from the U.S. Census Bureau’s 2017 American Community Survey 1-Year Estimates. The moving cost was determined using data from real estate data company Moving Inc. The 2017 median household income data and 2010-2018 population change from migration are based on one-year estimates from the U.S. Census Bureau’s American Community Survey. The Urban Honolulu metro area in Hawaii is the only place that lacked data on moving costs, so it was omitted from the list.
It’s Your Money, Your Future—Own It (sponsor)
Retirement can be daunting, but it doesn’t need to be.
Imagine having an expert in your corner to help you with your financial goals. Someone to help you determine if you’re ahead, behind, or right on track. With SmartAsset, that’s not just a dream—it’s reality. This free tool connects you with pre-screened financial advisors who work in your best interests. It’s quick, it’s easy, so take the leap today and start planning smarter!
Don’t waste another minute; get started right here and help your retirement dreams become a retirement reality.
Thank you for reading! Have some feedback for us?
Contact the 24/7 Wall St. editorial team.
 24/7 Wall St.
 24/7 Wall St.
 24/7 Wall St.
