
Climate change is one of the most serious public health issues facing America today. As temperatures continue to rise, water will evaporate at a faster rate, ultimately causing more prolonged periods of drought and — in some areas — more extreme rainfall.
Rainfall is affected by local climate conditions and varies heavily throughout the United States. 24/7 Wall St. reviewed metropolitan areas with the highest average annual precipitation using data from the Centers for Disease Control and Prevention’s North America Land Data Assimilation System (NLDAS) for 1979 to 2011.
The Northeast and South receive, respectively, 46.0% and 40.8% more rain than the average nationwide. The Midwest receives 0.9% more, and the West receives 34.1% less.
Of the 30 cities that get the most rain, however, 10 are in Western states: six in Oregon, and four in Washington. The rest of the cities are in the South, with seven in Louisiana, five in Florida, three in Mississippi, and two in Alabama. Arkansas, and Tennessee are each home to one. Many of the cities that get the most rain are also among the U.S. cities that get the least sun and the places where weather is getting worse because of climate change.
Click here to learn more about the rainiest cities in the United States.
To determine the rainiest cities in the United States, 24/7 Wall St. reviewed the metropolitan statistical areas with the highest average annual precipitation using data from the CDC’s North America Land Data Assimilation System (NLDAS) for the years 1979 to 2011. Data was aggregated from the county level to MSAs using boundary definitions and land area measurements from the U.S. Census Bureau.
Data on average maximum temperature and average number of kilowatt-hours of sun per square meter also came from CDC NLDAS and figures are for the years 1979 to 2011. Population statistics came from the Census Bureau’s 2017 American Community Survey.

30. Sebastian-Vero Beach, FL
> Avg. annual precipitation: 54.6 inches
> Avg. hours of full-sun per day: 5 hours, 21 minutes
> Avg. daily max temperature: 82.1 degrees
> Population: 154,383
[in-text-ad]

29. Chattanooga, TN-GA
> Avg. annual precipitation: 54.7 inches
> Avg. hours of full-sun per day: 4 hours, 28 minutes
> Avg. daily max temperature: 67.4 degrees
> Population: 554,876
 24/7 Wall St.
28. Grants Pass, OR
> Avg. annual precipitation: 55.0 inches
> Avg. hours of full-sun per day: 4 hours, 44 minutes
> Avg. daily max temperature: 59.6 degrees
> Population: 86,352

27. Hot Springs, AR
> Avg. annual precipitation: 55.3 inches
> Avg. hours of full-sun per day: 4 hours, 33 minutes
> Avg. daily max temperature: 71.3 degrees
> Population: 98,658
[in-text-ad-2]

26. Beaumont-Port Arthur, TX
> Avg. annual precipitation: 55.7 inches
> Avg. hours of full-sun per day: 4 hours, 54 minutes
> Avg. daily max temperature: 77.4 degrees
> Population: 411,339
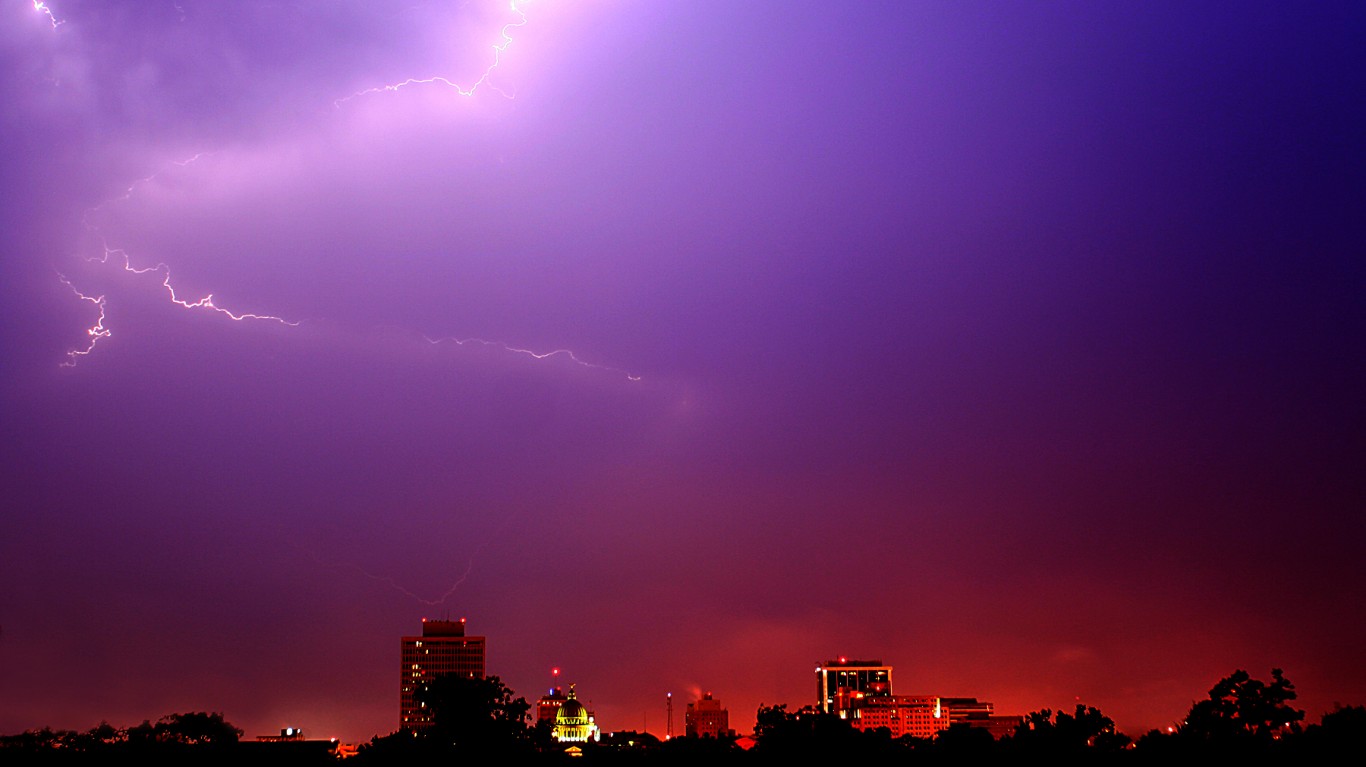
25. Jackson, MS
> Avg. annual precipitation: 55.9 inches
> Avg. hours of full-sun per day: 4 hours, 46 minutes
> Avg. daily max temperature: 74.4 degrees
> Population: 578,794
[in-text-ad]

24. Tallahassee, FL
> Avg. annual precipitation: 56.1 inches
> Avg. hours of full-sun per day: 4 hours, 59 minutes
> Avg. daily max temperature: 76.9 degrees
> Population: 385,473
 24/7 Wall St.
23. Alexandria, LA
> Avg. annual precipitation: 57.3 inches
> Avg. hours of full-sun per day: 4 hours, 48 minutes
> Avg. daily max temperature: 76.9 degrees
> Population: 153,984

22. Hattiesburg, MS
> Avg. annual precipitation: 58.7 inches
> Avg. hours of full-sun per day: 4 hours, 49 minutes
> Avg. daily max temperature: 75.7 degrees
> Population: 146,530
[in-text-ad-2]

21. Lake Charles, LA
> Avg. annual precipitation: 59.7 inches
> Avg. hours of full-sun per day: 5 hours, 11 minutes
> Avg. daily max temperature: 76.7 degrees
> Population: 210,962
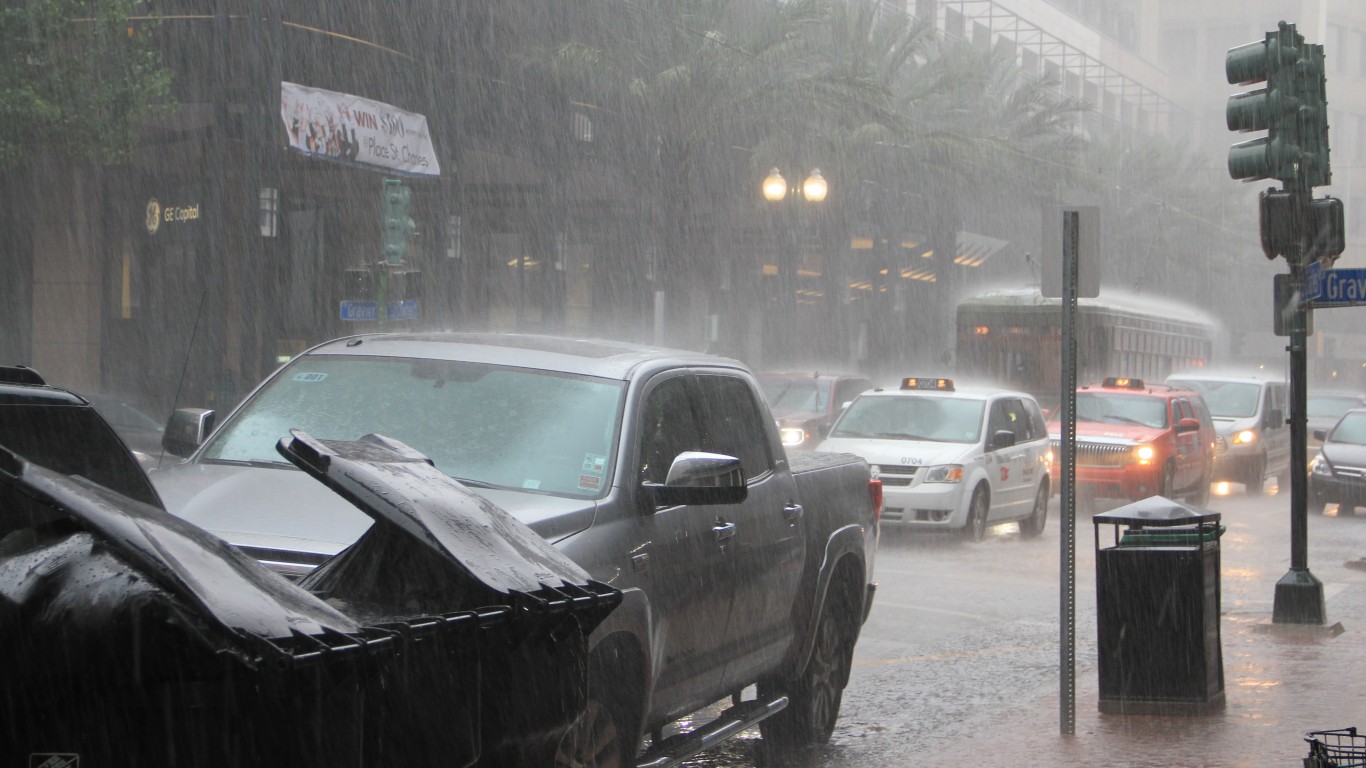
20. New Orleans-Metairie, LA
> Avg. annual precipitation: 59.9 inches
> Avg. hours of full-sun per day: 5 hours, 8 minutes
> Avg. daily max temperature: 76.7 degrees
> Population: 1.3 million
[in-text-ad]
19. Panama City, FL
> Avg. annual precipitation: 60.2 inches
> Avg. hours of full-sun per day: 4 hours, 59 minutes
> Avg. daily max temperature: 76.7 degrees
> Population: 202,236
 24/7 Wall St.
18. Houma-Thibodaux, LA
> Avg. annual precipitation: 60.7 inches
> Avg. hours of full-sun per day: 5 hours, 3 minutes
> Avg. daily max temperature: 77.2 degrees
> Population: 210,512

17. Corvallis, OR
> Avg. annual precipitation: 60.9 inches
> Avg. hours of full-sun per day: 4 hours, 7 minutes
> Avg. daily max temperature: 60.0 degrees
> Population: 90,951
[in-text-ad-2]

16. Lafayette, LA
> Avg. annual precipitation: 61.2 inches
> Avg. hours of full-sun per day: 5 hours, 1 minute
> Avg. daily max temperature: 76.9 degrees
> Population: 491,558
15. Crestview-Fort Walton Beach-Destin, FL
> Avg. annual precipitation: 61.2 inches
> Avg. hours of full-sun per day: 4 hours, 54 minutes
> Avg. daily max temperature: 76.5 degrees
> Population: 271,346
[in-text-ad]
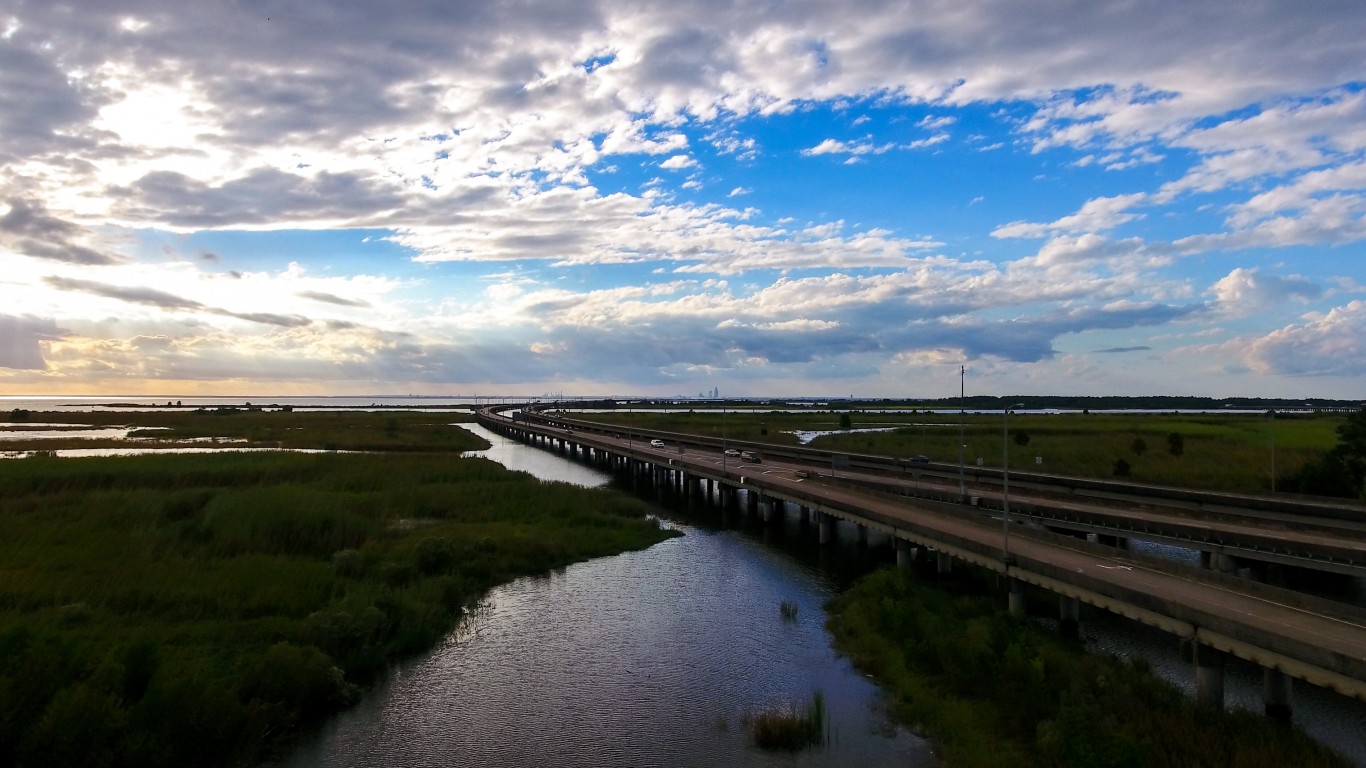
14. Mobile, AL
> Avg. annual precipitation: 61.2 inches
> Avg. hours of full-sun per day: 4 hours, 53 minutes
> Avg. daily max temperature: 76.0 degrees
> Population: 413,955
 24/7 Wall St.
13. Hammond, LA
> Avg. annual precipitation: 61.9 inches
> Avg. hours of full-sun per day: 4 hours, 54 minutes
> Avg. daily max temperature: 77.0 degrees
> Population: 132,497

12. Baton Rouge, LA
> Avg. annual precipitation: 62.0 inches
> Avg. hours of full-sun per day: 4 hours, 50 minutes
> Avg. daily max temperature: 77.2 degrees
> Population: 834,159
[in-text-ad-2]

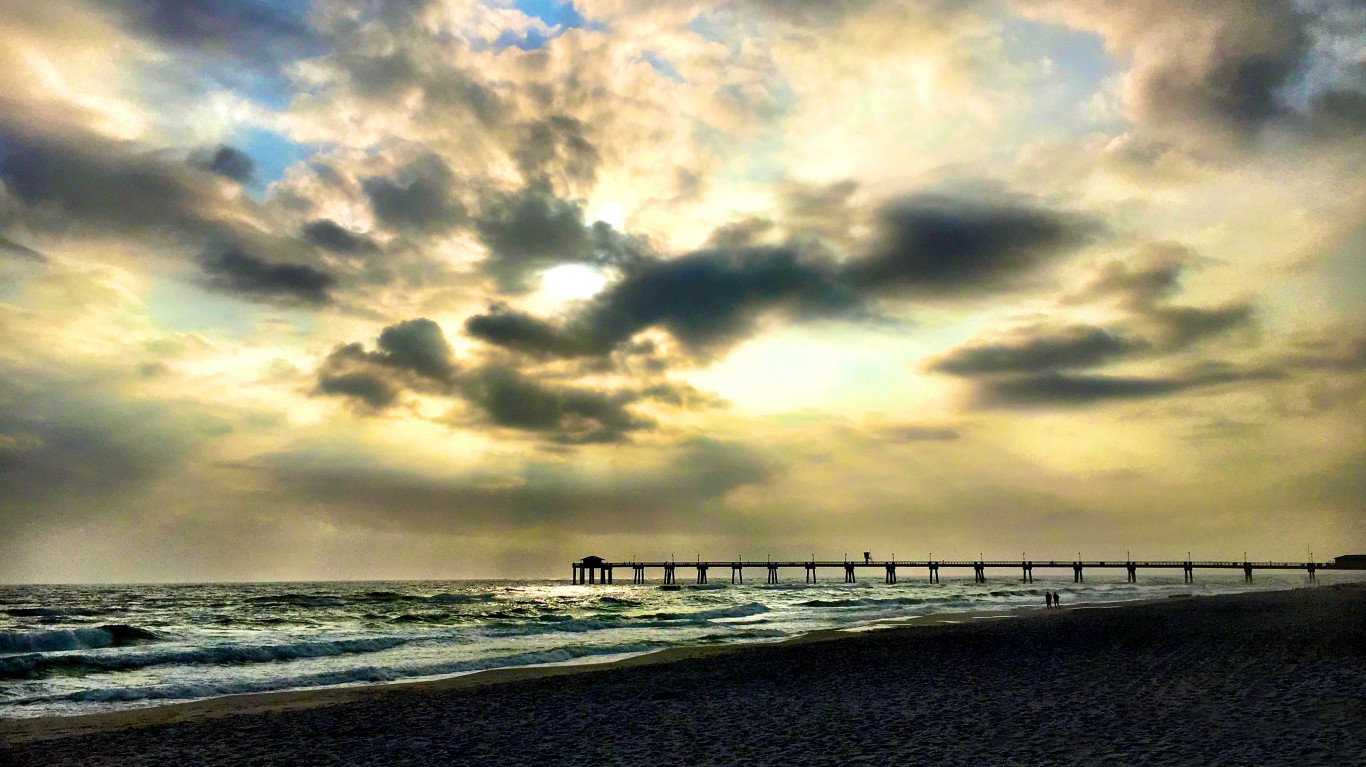
11. Pensacola-Ferry Pass-Brent, FL
> Avg. annual precipitation: 62.1 inches
> Avg. hours of full-sun per day: 4 hours, 54 minutes
> Avg. daily max temperature: 75.3 degrees
> Population: 487,784
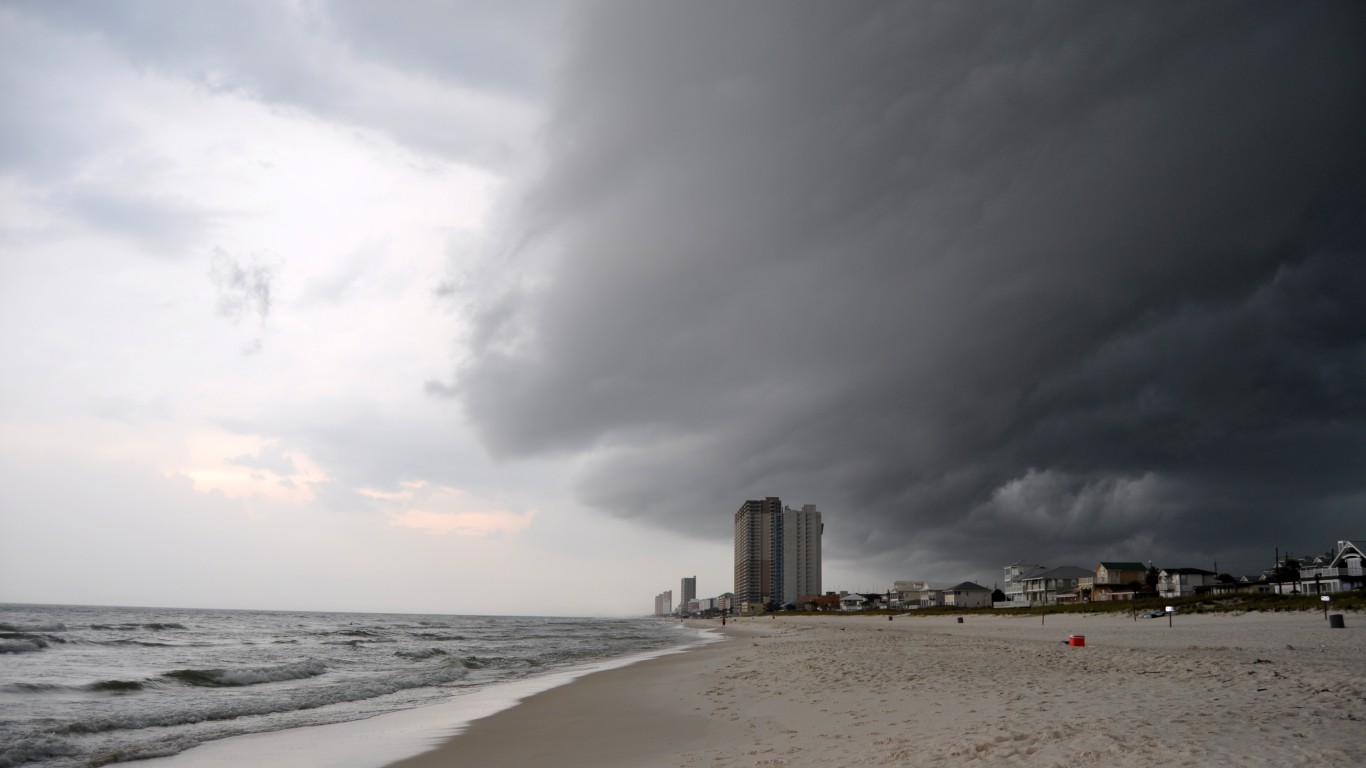
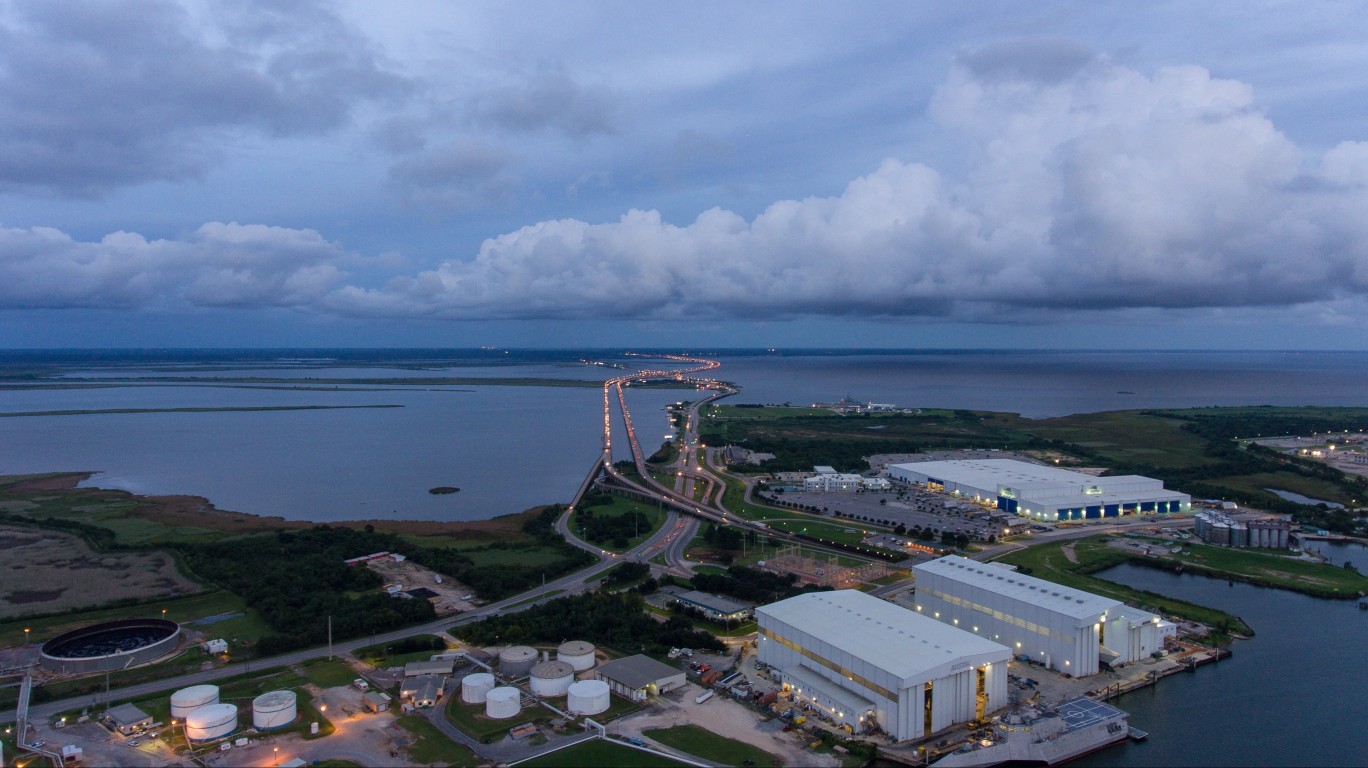
10. Daphne-Fairhope-Foley, AL
> Avg. annual precipitation: 62.4 inches
> Avg. hours of full-sun per day: 4 hours, 54 minutes
> Avg. daily max temperature: 75.4 degrees
> Population: 212,628
[in-text-ad]
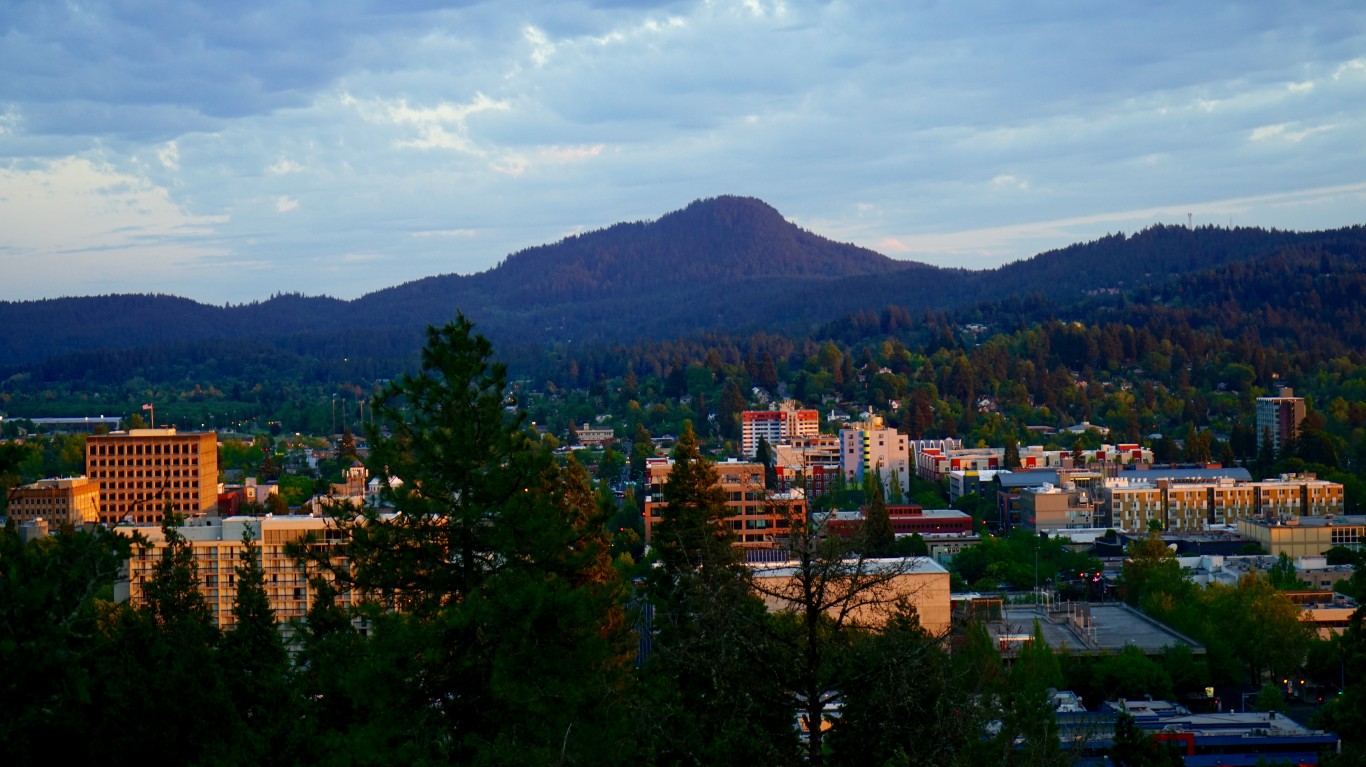
9. Eugene, OR
> Avg. annual precipitation: 62.8 inches
> Avg. hours of full-sun per day: 4 hours, 19 minutes
> Avg. daily max temperature: 57.6 degrees
> Population: 374,748
 24/7 Wall St.
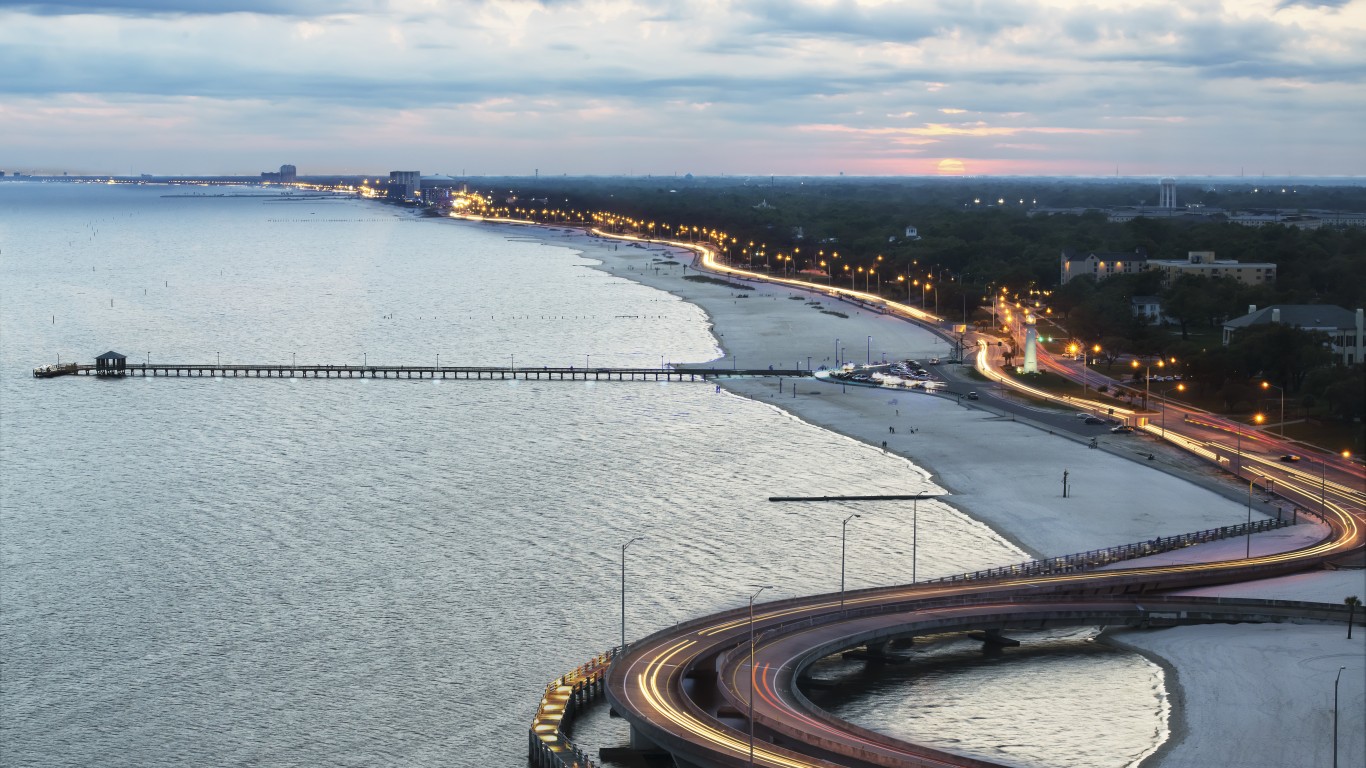
8. Gulfport-Biloxi-Pascagoula, MS
> Avg. annual precipitation: 63.2 inches
> Avg. hours of full-sun per day: 4 hours, 56 minutes
> Avg. daily max temperature: 76.3 degrees
> Population: 394,232

7. Salem, OR
> Avg. annual precipitation: 64.2 inches
> Avg. hours of full-sun per day: 4 hours, 5 minutes
> Avg. daily max temperature: 58.4 degrees
> Population: 424,982
[in-text-ad-2]

6. Portland-Vancouver-Hillsboro, OR-WA
> Avg. annual precipitation: 68.0 inches
> Avg. hours of full-sun per day: 4 hours, 4 minutes
> Avg. daily max temperature: 56.4 degrees
> Population: 2.5 million

5. Albany, OR
> Avg. annual precipitation: 69.4 inches
> Avg. hours of full-sun per day: 4 hours, 11 minutes
> Avg. daily max temperature: 57.6 degrees
> Population: 125,047
[in-text-ad]

4. Bellingham, WA
> Avg. annual precipitation: 72.6 inches
> Avg. hours of full-sun per day: 3 hours, 49 minutes
> Avg. daily max temperature: 49.0 degrees
> Population: 221,404

3. Seattle-Tacoma-Bellevue, WA
> Avg. annual precipitation: 73.9 inches
> Avg. hours of full-sun per day: 3 hours, 54 minutes
> Avg. daily max temperature: 52.8 degrees
> Population: 3.9 million
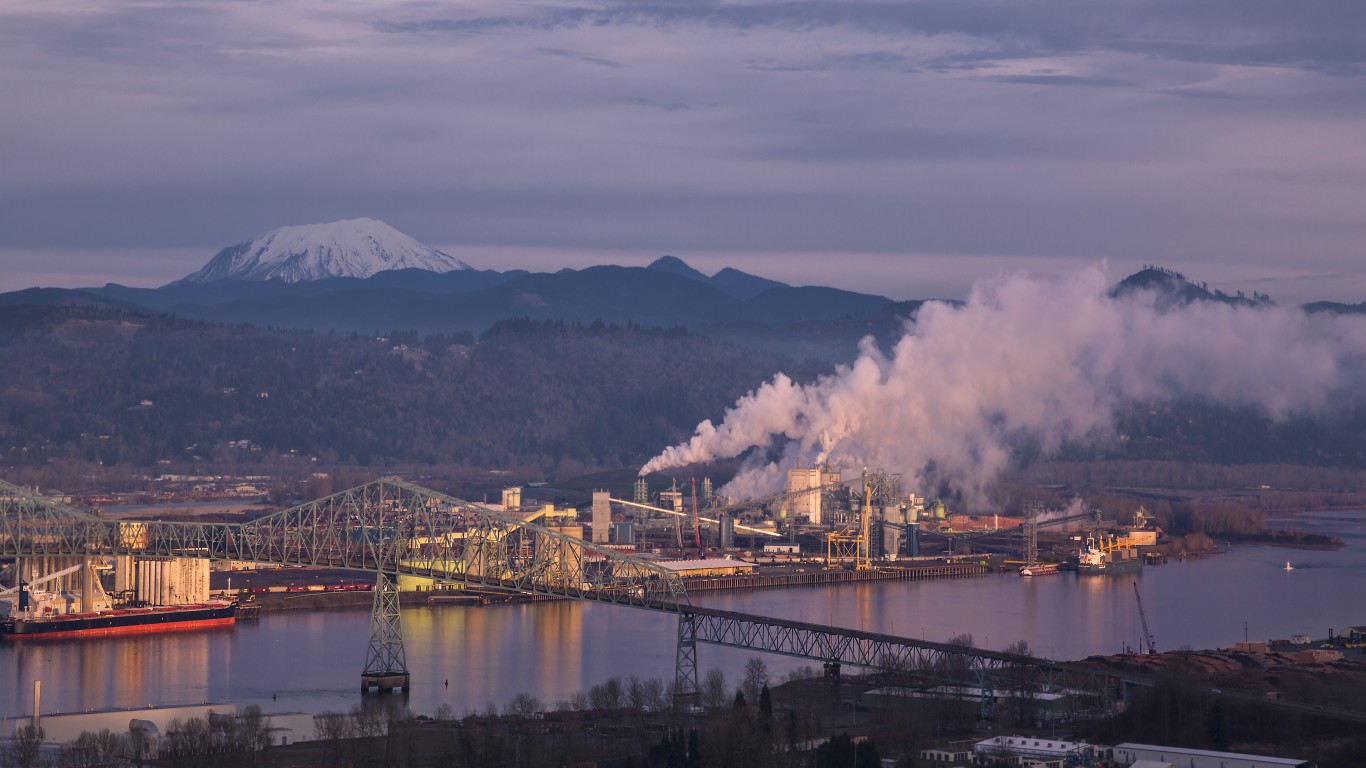
2. Longview, WA
> Avg. annual precipitation: 75.0 inches
> Avg. hours of full-sun per day: 3 hours, 48 minutes
> Avg. daily max temperature: 56.6 degrees
> Population: 106,910
[in-text-ad-2]

1. Mount Vernon-Anacortes, WA
> Avg. annual precipitation: 80.2 inches
> Avg. hours of full-sun per day: 3 hours, 49 minutes
> Avg. daily max temperature: 50.1 degrees
> Population: 125,619
Want to Retire Early? Start Here (Sponsor)
Want retirement to come a few years earlier than you’d planned? Or are you ready to retire now, but want an extra set of eyes on your finances?
Now you can speak with up to 3 financial experts in your area for FREE. By simply clicking here you can begin to match with financial professionals who can help you build your plan to retire early. And the best part? The first conversation with them is free.
Click here to match with up to 3 financial pros who would be excited to help you make financial decisions.
Have questions about retirement or personal finance? Email us at [email protected]!
By emailing your questions to 24/7 Wall St., you agree to have them published anonymously on a673b.bigscoots-temp.com.
By submitting your story, you understand and agree that we may use your story, or versions of it, in all media and platforms, including via third parties.
Thank you for reading! Have some feedback for us?
Contact the 24/7 Wall St. editorial team.
Latest from 24/7


Our expert who first called NVIDIA in 2009 is predicting 2025 will see a historic AI breakthrough.
You can follow him investing $500,000 of his own money on our top AI stocks for free.