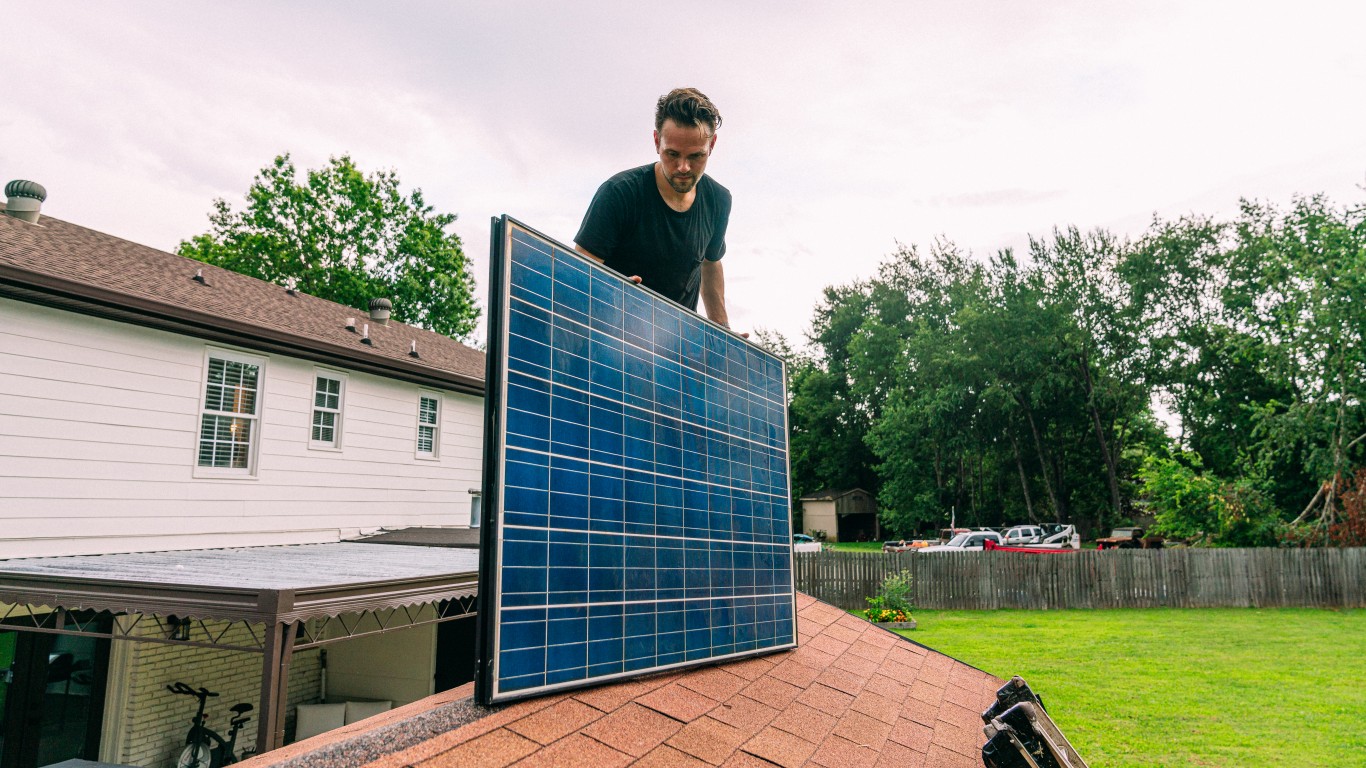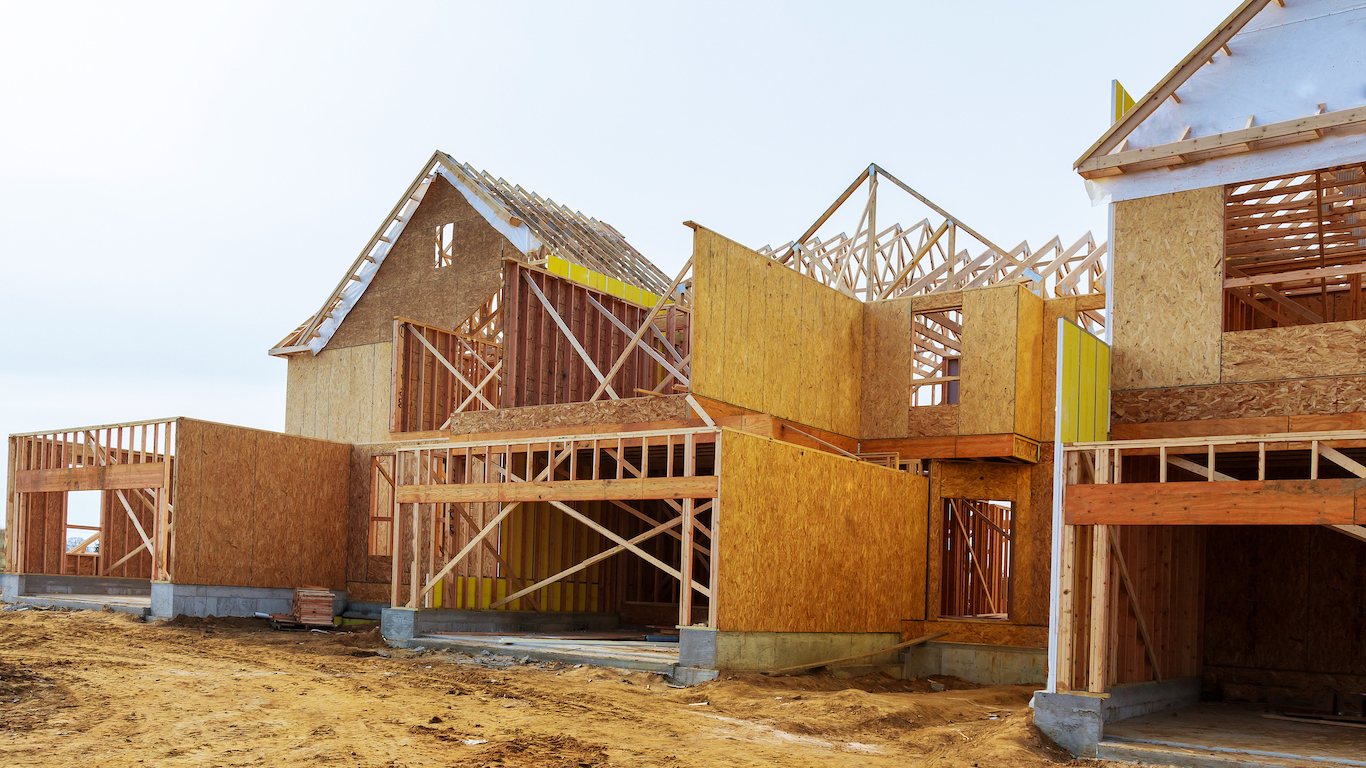
The U.S. housing market is close to its highest value ever. The median sale price of a home sold in the second quarter of 2019 was $279,600, a 4.3% increase compared to the same period in 2018 and well above the market’s peak prior to the housing crisis.
While all but a handful of metropolitan housing markets have increased in value, some grew at an impressive rate relative to the national market. One market even gained nearly 25% in value in the last year.
Based on median single-family home price changes over the year through the second quarter of 2019 from the National Association of Realtors, 24/7 Wall St. reviewed the fastest growing housing markets. Single-family home price data for the 180 metropolitan areas reviewed came from the National Association of Realtors. Income data came from the U.S. Census Bureau’s American Community Survey.
Growing housing prices tend to reflect growing demand for homes in an area, usually tied to a healthy job market and a growing population and often the result of a steady economy. These are characteristics of some of the cities on this list. At times, however, the cost of living in these places — especially housing — can become too high. These are America’s 25 least affordable housing markets.
Many of the housing markets on this list do not fit the description of a highly in-demand housing market. These are places in the Northeast and Midwest that have long struggled economically in the post-industrial U.S. economy. They include cities like Elmira, New York and Youngstown, Ohio. Even after increasing in value in the past year, the typical home price in these places is less than $120,000 — among the lowest in the country.
It remains to be seen if the short-term growth in these markets represents a sign of economic revitalization or a temporary reversal of a continuing negative trend. If it is the former, these places have a lot of ground to make up. Based on population decline since 2000, both Elmira and Youngstown are among America’s fastest shrinking cities.
Click here to see the fastest growing housing markets
Click here to see the fastest shrinking housing markets
To identify the fastest growing housing markets, 24/7 Wall St. reviewed the largest change in median home prices over the 12 months through the second quarter of 2019. Single-family home price data for the 180 metropolitan areas reviewed came from the National Association of Realtors. Income data came from the U.S. Census Bureau’s American Community Survey.

25. Florence, SC
> 1-yr. chg. in median home sale price: +8.8%
> Median home sale price 2018 Q2: $136,100
> Median home sale price 2019 Q2: $148,100
> Median household income: $40,562
[in-text-ad]
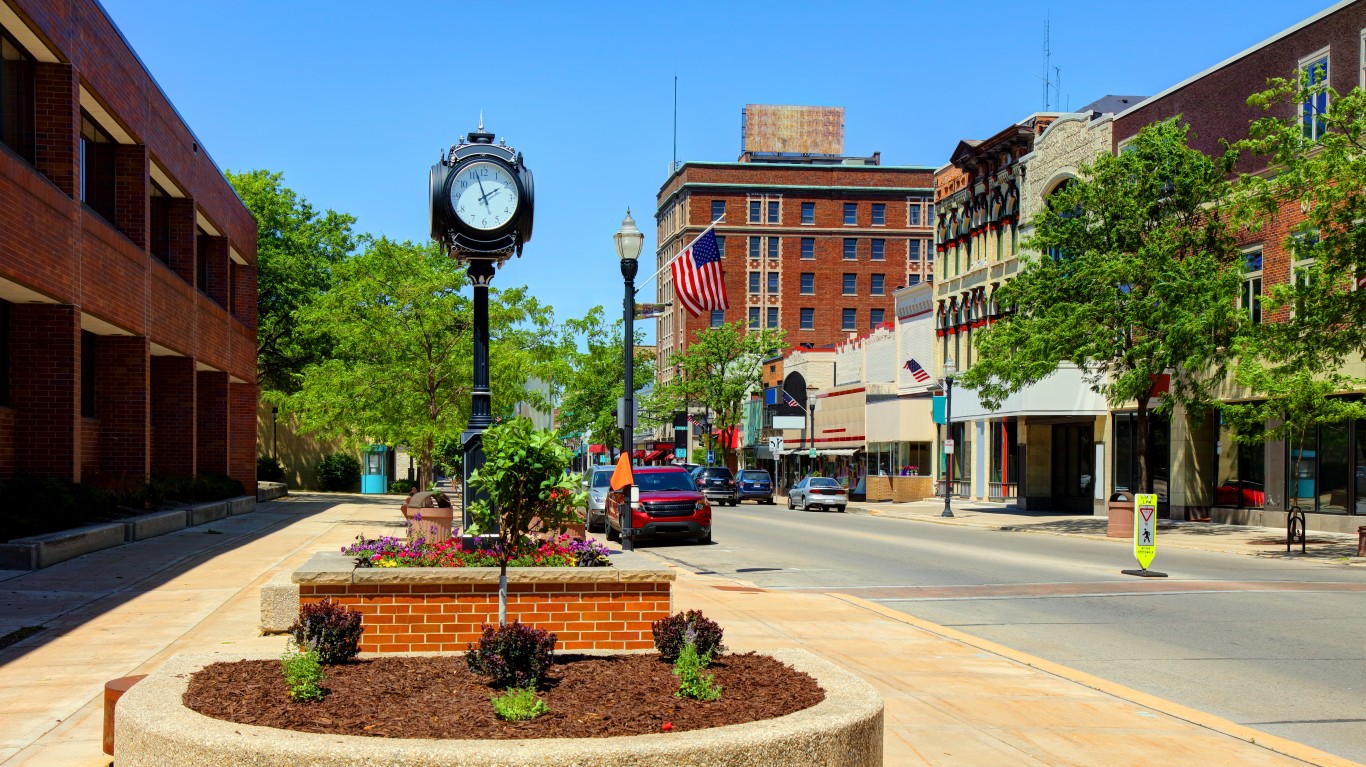
24. Fond du Lac, WI
> 1-yr. chg. in median home sale price: +8.9%
> Median home sale price 2018 Q2: $134,600
> Median home sale price 2019 Q2: $146,600
> Median household income: $61,417

23. Durham-Chapel Hill, NC
> 1-yr. chg. in median home sale price: +8.9%
> Median home sale price 2018 Q2: $288,500
> Median home sale price 2019 Q2: $314,300
> Median household income: $61,271
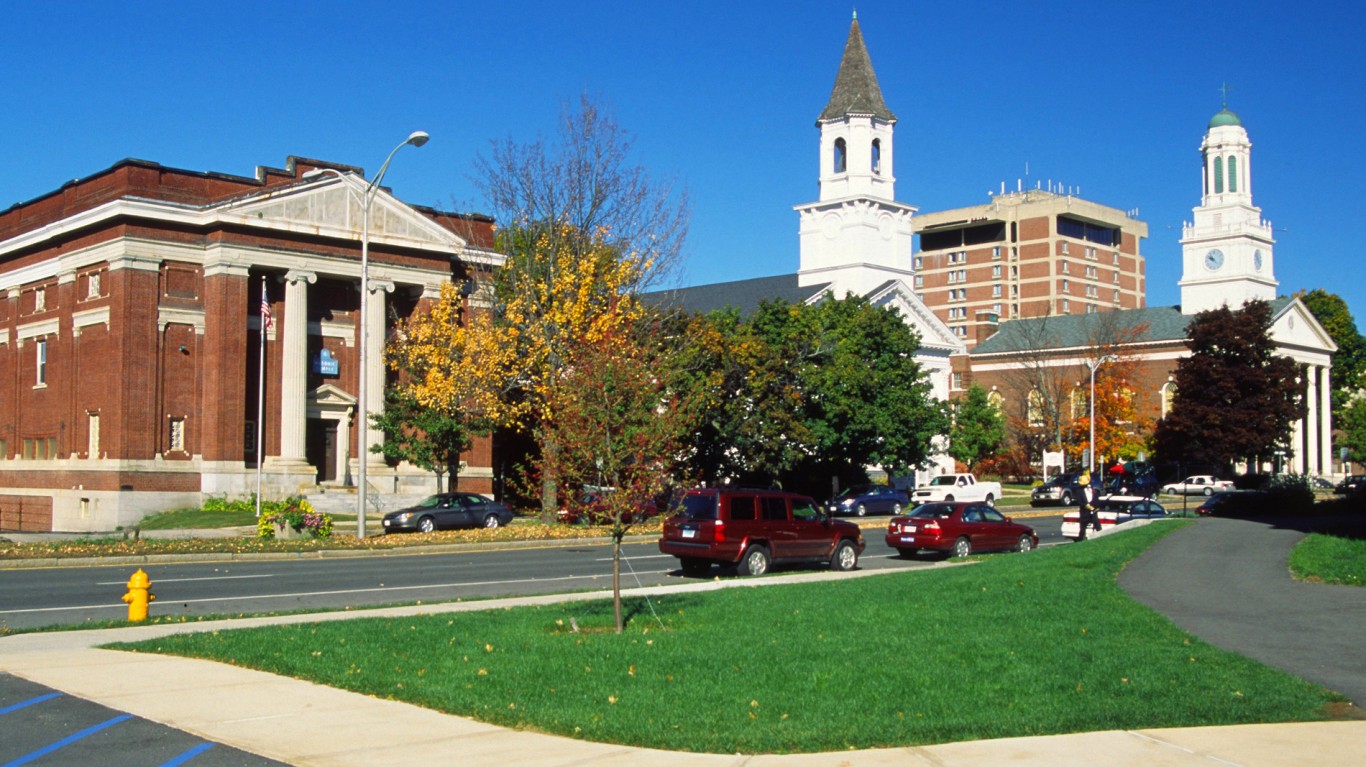
22. Pittsfield, MA
> 1-yr. chg. in median home sale price: +9.0%
> Median home sale price 2018 Q2: $205,600
> Median home sale price 2019 Q2: $224,100
> Median household income: $57,054
[in-text-ad-2]
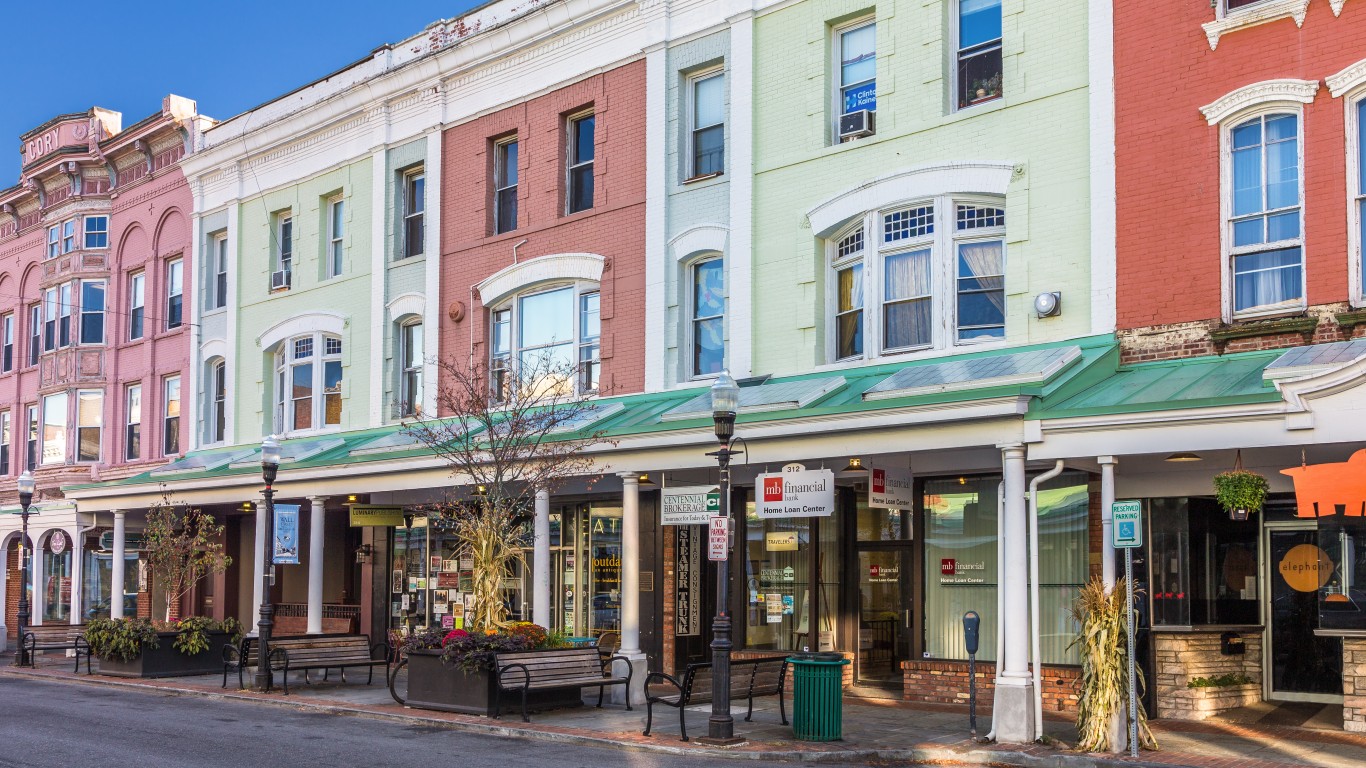
21. Kingston, NY
> 1-yr. chg. in median home sale price: +9.1%
> Median home sale price 2018 Q2: $215,200
> Median home sale price 2019 Q2: $234,700
> Median household income: $63,621
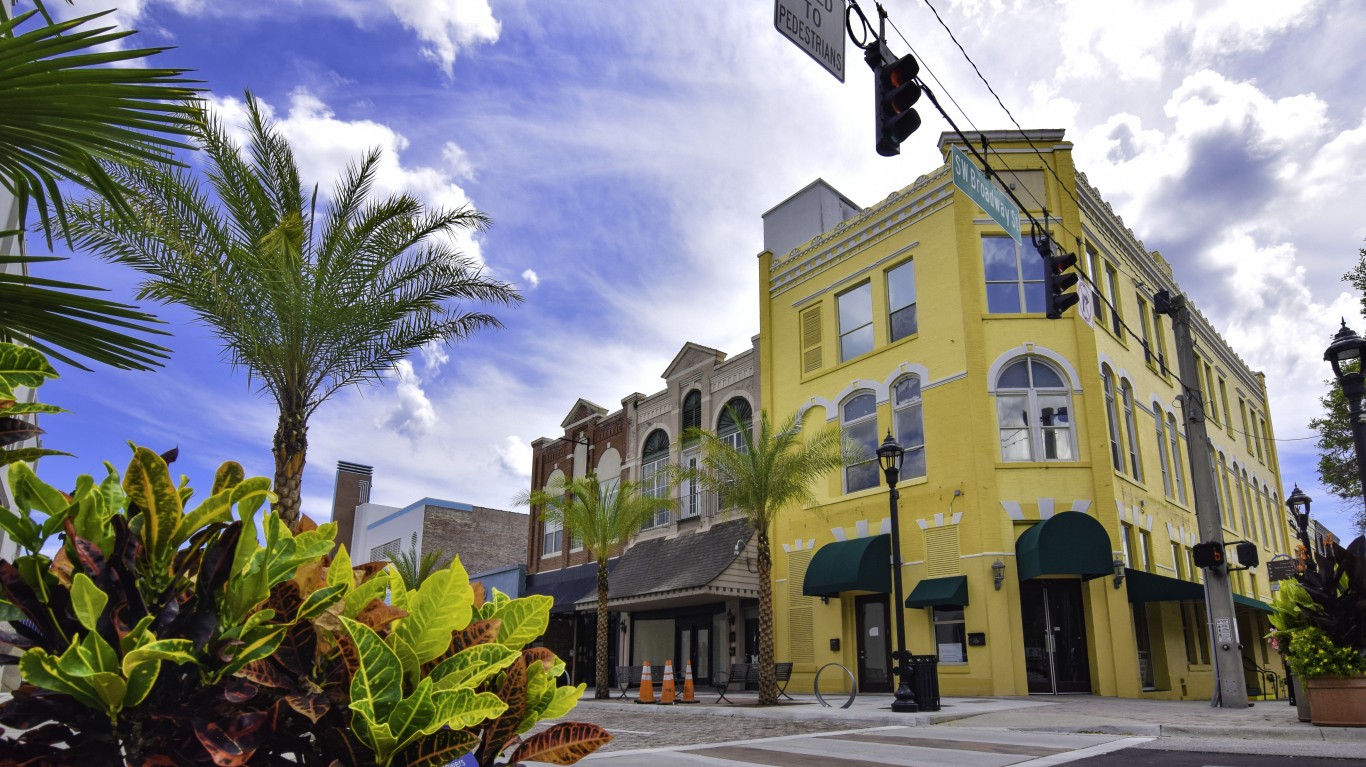
20. Ocala, FL
> 1-yr. chg. in median home sale price: +9.2%
> Median home sale price 2018 Q2: $158,000
> Median home sale price 2019 Q2: $172,500
> Median household income: $43,910
[in-text-ad]

19. Greensboro-High Point, NC
> 1-yr. chg. in median home sale price: +9.2%
> Median home sale price 2018 Q2: $166,700
> Median home sale price 2019 Q2: $182,100
> Median household income: $50,285

18. Spokane-Spokane Valley, WA
> 1-yr. chg. in median home sale price: +9.3%
> Median home sale price 2018 Q2: $242,900
> Median home sale price 2019 Q2: $265,600
> Median household income: $53,321

17. Columbus, OH
> 1-yr. chg. in median home sale price: +9.4%
> Median home sale price 2018 Q2: $208,600
> Median home sale price 2019 Q2: $228,300
> Median household income: $63,764
[in-text-ad-2]

16. Fort Wayne, IN
> 1-yr. chg. in median home sale price: +9.5%
> Median home sale price 2018 Q2: $145,000
> Median home sale price 2019 Q2: $158,800
> Median household income: $52,908

15. Farmington, NM
> 1-yr. chg. in median home sale price: +9.6%
> Median home sale price 2018 Q2: $176,100
> Median home sale price 2019 Q2: $193,000
> Median household income: $45,942
[in-text-ad]

14. Kennewick-Richland, WA
> 1-yr. chg. in median home sale price: +9.8%
> Median home sale price 2018 Q2: $276,300
> Median home sale price 2019 Q2: $303,300
> Median household income: $63,617

13. Columbia, SC
> 1-yr. chg. in median home sale price: +9.8%
> Median home sale price 2018 Q2: $171,600
> Median home sale price 2019 Q2: $188,500
> Median household income: $54,480

12. South Bend-Mishawaka, IN-MI
> 1-yr. chg. in median home sale price: +9.9%
> Median home sale price 2018 Q2: $132,900
> Median home sale price 2019 Q2: $146,000
> Median household income: $51,880
[in-text-ad-2]

11. Wichita, KS
> 1-yr. chg. in median home sale price: +9.9%
> Median home sale price 2018 Q2: $148,900
> Median home sale price 2019 Q2: $163,700
> Median household income: $54,432

10. Glens Falls, NY
> 1-yr. chg. in median home sale price: +10.1%
> Median home sale price 2018 Q2: $163,800
> Median home sale price 2019 Q2: $180,400
> Median household income: $58,723
[in-text-ad]
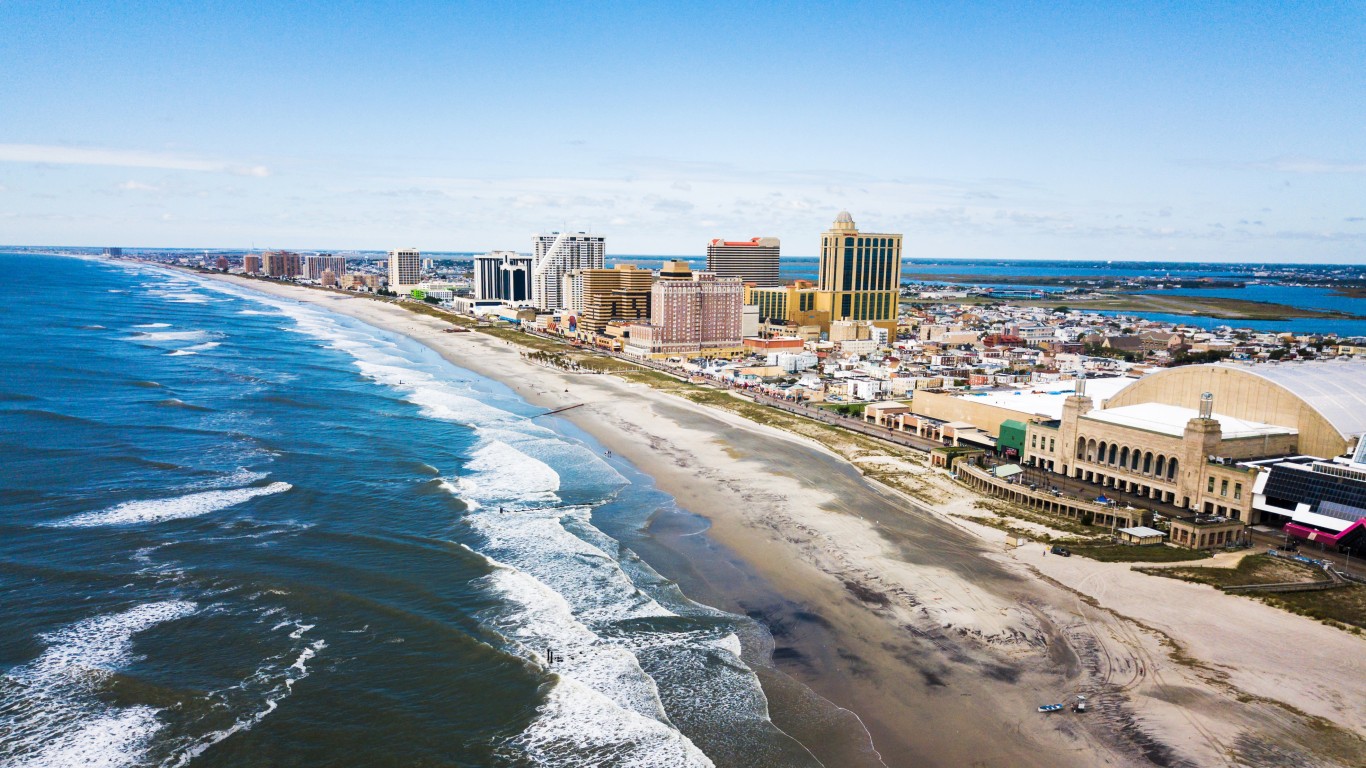
9. Atlantic City-Hammonton, NJ
> 1-yr. chg. in median home sale price: +10.4%
> Median home sale price 2018 Q2: $193,200
> Median home sale price 2019 Q2: $213,200
> Median household income: $61,777
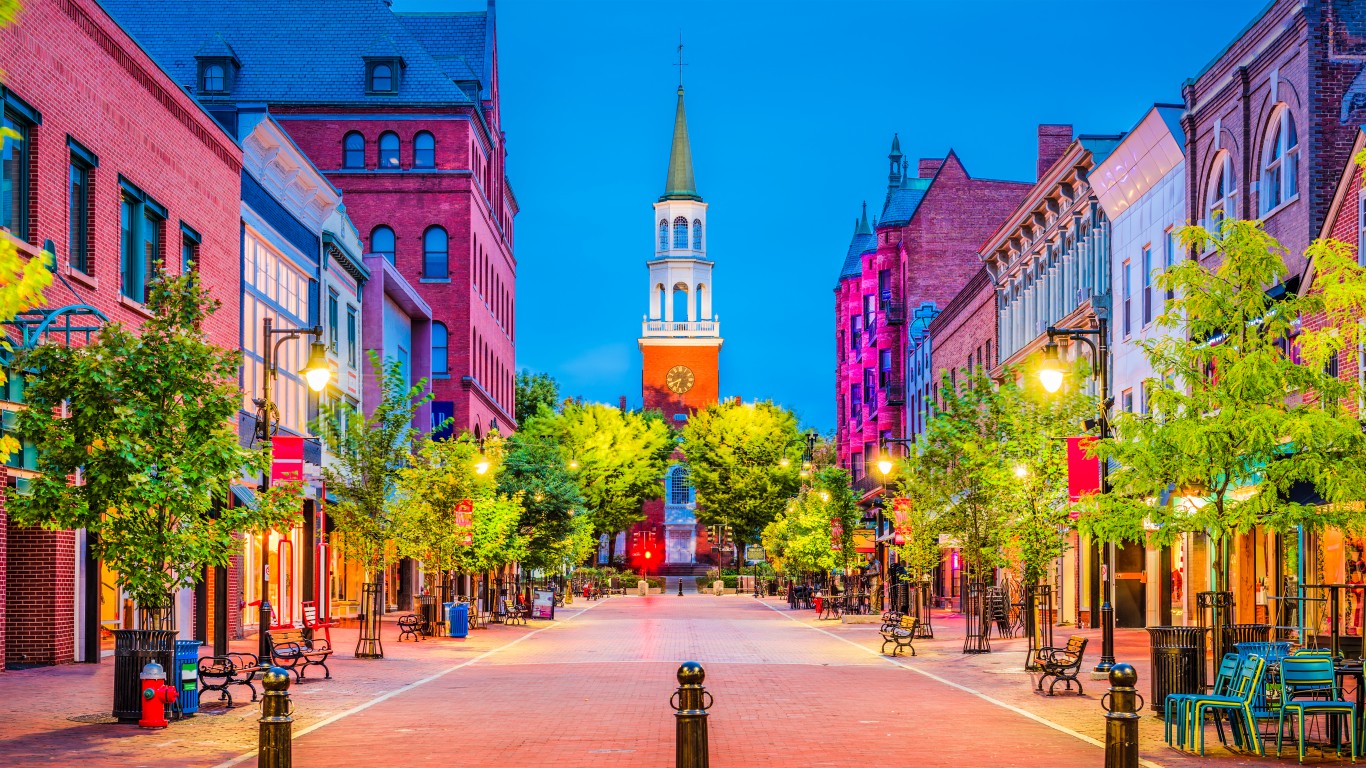
8. Burlington-South Burlington, VT
> 1-yr. chg. in median home sale price: +10.9%
> Median home sale price 2018 Q2: $292,800
> Median home sale price 2019 Q2: $324,800
> Median household income: $63,160

7. Beaumont-Port Arthur, TX
> 1-yr. chg. in median home sale price: +11.4%
> Median home sale price 2018 Q2: $153,600
> Median home sale price 2019 Q2: $171,100
> Median household income: $49,875
[in-text-ad-2]

6. Abilene, TX
> 1-yr. chg. in median home sale price: +12.0%
> Median home sale price 2018 Q2: $167,200
> Median home sale price 2019 Q2: $187,200
> Median household income: $51,130

5. Columbia, MO
> 1-yr. chg. in median home sale price: +12.0%
> Median home sale price 2018 Q2: $186,300
> Median home sale price 2019 Q2: $208,700
> Median household income: $51,340
[in-text-ad]

4. Elmira, NY
> 1-yr. chg. in median home sale price: +12.3%
> Median home sale price 2018 Q2: $106,300
> Median home sale price 2019 Q2: $119,400
> Median household income: $51,194

3. Boise City-Nampa, ID
> 1-yr. chg. in median home sale price: +12.5%
> Median home sale price 2018 Q2: $262,800
> Median home sale price 2019 Q2: $295,600
> Median household income: $55,324

2. Youngstown-Warren-Boardman, OH-PA
> 1-yr. chg. in median home sale price: +13.8%
> Median home sale price 2018 Q2: $94,400
> Median home sale price 2019 Q2: $107,400
> Median household income: $45,382
[in-text-ad-2]
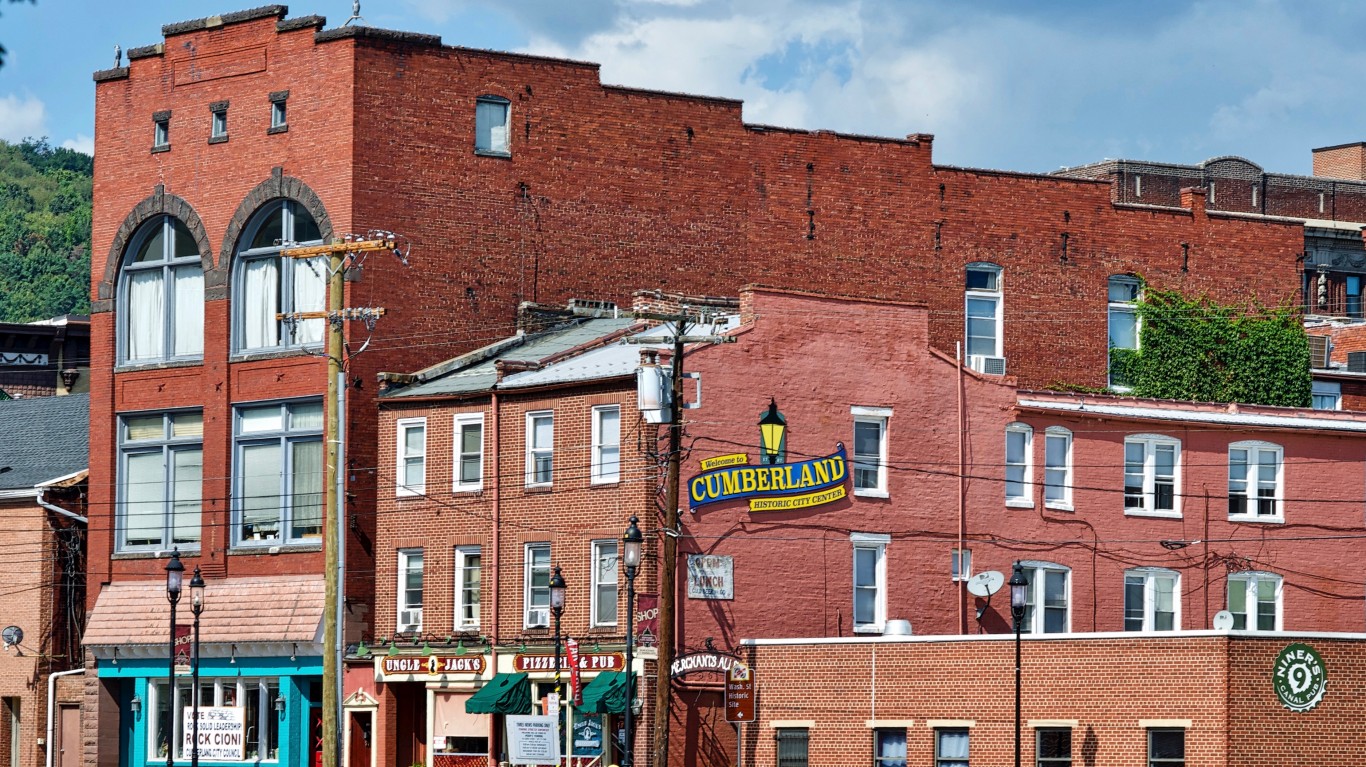
1. Cumberland, MD-WV
> 1-yr. chg. in median home sale price: +24.1%
> Median home sale price 2018 Q2: $94,900
> Median home sale price 2019 Q2: $117,800
> Median household income: $42,113
Take Charge of Your Retirement: Find the Right Financial Advisor For You in Minutes (Sponsor)
Retirement planning doesn’t have to feel overwhelming. The key is finding professional guidance—and we’ve made it easier than ever for you to connect with the right financial advisor for your unique needs.
Here’s how it works:
1️ Answer a Few Simple Questions
Tell us a bit about your goals and preferences—it only takes a few minutes!
2️ Get Your Top Advisor Matches
This tool matches you with qualified advisors who specialize in helping people like you achieve financial success.
3️ Choose Your Best Fit
Review their profiles, schedule an introductory meeting, and select the advisor who feels right for you.
Why wait? Start building the retirement you’ve always dreamed of. Click here to get started today!
Thank you for reading! Have some feedback for us?
Contact the 24/7 Wall St. editorial team.
 24/7 Wall St.
 24/7 Wall St.
 24/7 Wall St.
 24/7 Wall St.
 24/7 Wall St.
