Special Report
The 50 Counties Where People Live the Longest

Published:
Last Updated:

Life expectancy in the United States has either fallen or remained flat over the last few years, according to the Centers for Disease Control and Prevention. The average life expectancy at birth is 78.6 years, down from 78.9 years in 2014. Life expectancy is one of the main measures of a population’s overall health, so the declines are concerning.
Still, life expectancy varies significantly across the United States. Different aspects, from socioeconomic factors to climate to culture and behaviors can affect life expectancy in an area. And there are some parts of the country where the average resident can expect to live several years longer than the average American.
To determine the counties where people live the longest, 24/7 Tempo reviewed 2014 county-level life expectancy at birth figures from the Institute for Health Metrics and Evaluation, a global research center affiliated with the University of Washington. Independent cities or census areas, which are treated as county equivalents by the U.S. Census Bureau, were not included in our analysis.
Residents of counties with longer life expectancy tend to exhibit the kind of healthy behaviors that can help lead to longer lives. Relatively fewer adults in these counties smoke or are obese, and more tend to be physically active. Not surprisingly, based on behavioral measures like these, many of these counties rank among the healthiest in the country. Here is the full list of the healthiest counties by state.
The association between wealth and longevity is not fully understood but well established. According to a 2016 study published in the Lancet, the richest 1% of Americans live on average nearly 15 years longer than the poorest 1%. In 44 of the 50 counties on this list, the poverty rate is lower than the national rate of 14.6%.
In fact, many of these counties are high-income areas — some even rank among the wealthiest counties in the country. Here is a full list of the richest counties by state.
Click here to see the counties where people live the longest
Click here to read our methodology

50. Ozaukee County, Wisconsin
> Life expectancy: 82.13 years
> Largest place in county: Mequon
> Change in life expectancy, 1980-2014: +7.1%
> Poverty: 5.9%
> Adult obesity: 23.9%
[in-text-ad]

49. Storey County, Nevada
> Life expectancy: 82.13 years
> Largest place in county: N/A
> Change in life expectancy, 1980-2014: +7.6%
> Poverty: 7.7%
> Adult obesity: 27.2%

48. Bremer County, Iowa
> Life expectancy: 82.14 years
> Largest place in county: Waverly
> Change in life expectancy, 1980-2014: +6.6%
> Poverty: 7.7%
> Adult obesity: 34.2%
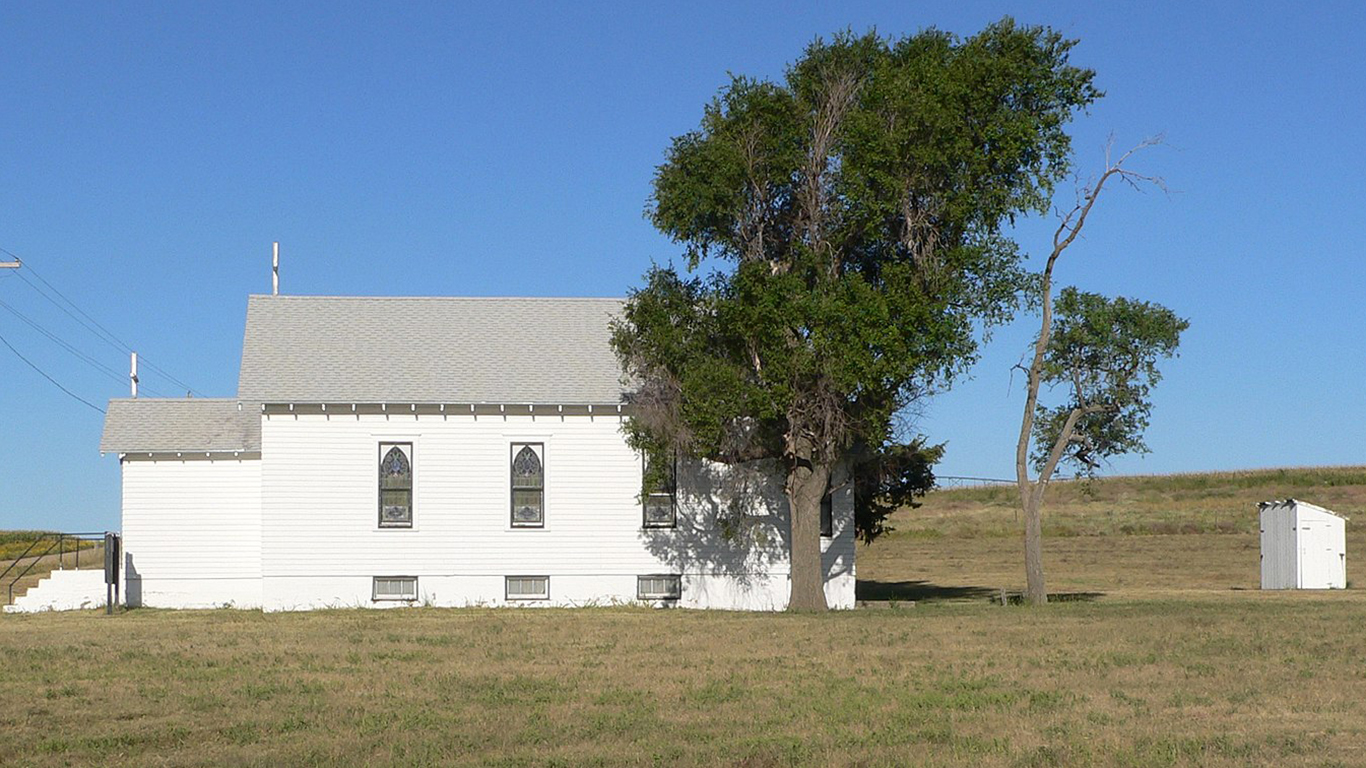
47. Hayes County, Nebraska
> Life expectancy: 82.14 years
> Largest place in county: Hayes Center
> Change in life expectancy, 1980-2014: +6.2%
> Poverty: 9%
> Adult obesity: 33.4%
[in-text-ad-2]

46. Oliver County, North Dakota
> Life expectancy: 82.19 years
> Largest place in county: Center
> Change in life expectancy, 1980-2014: +6.3%
> Poverty: 3.1%
> Adult obesity: 33.9%

45. Nassau County, New York
> Life expectancy: 82.21 years
> Largest place in county: Hempstead
> Change in life expectancy, 1980-2014: +10.6%
> Poverty: 5.9%
> Adult obesity: 23.2%
[in-text-ad]

44. Stevens County, Minnesota
> Life expectancy: 82.22 years
> Largest place in county: Morris
> Change in life expectancy, 1980-2014: +7.2%
> Poverty: 15.4%
> Adult obesity: 31.9%

43. Olmsted County, Minnesota
> Life expectancy: 82.24 years
> Largest place in county: Rochester
> Change in life expectancy, 1980-2014: +6.2%
> Poverty: 9.1%
> Adult obesity: 26.1%

42. Orange County, California
> Life expectancy: 82.27 years
> Largest place in county: Anaheim
> Change in life expectancy, 1980-2014: +8.0%
> Poverty: 12.1%
> Adult obesity: 19.5%
[in-text-ad-2]

41. Westchester County, New York
> Life expectancy: 82.29 years
> Largest place in county: Yonkers
> Change in life expectancy, 1980-2014: +9.6%
> Poverty: 9.4%
> Adult obesity: 20.7%
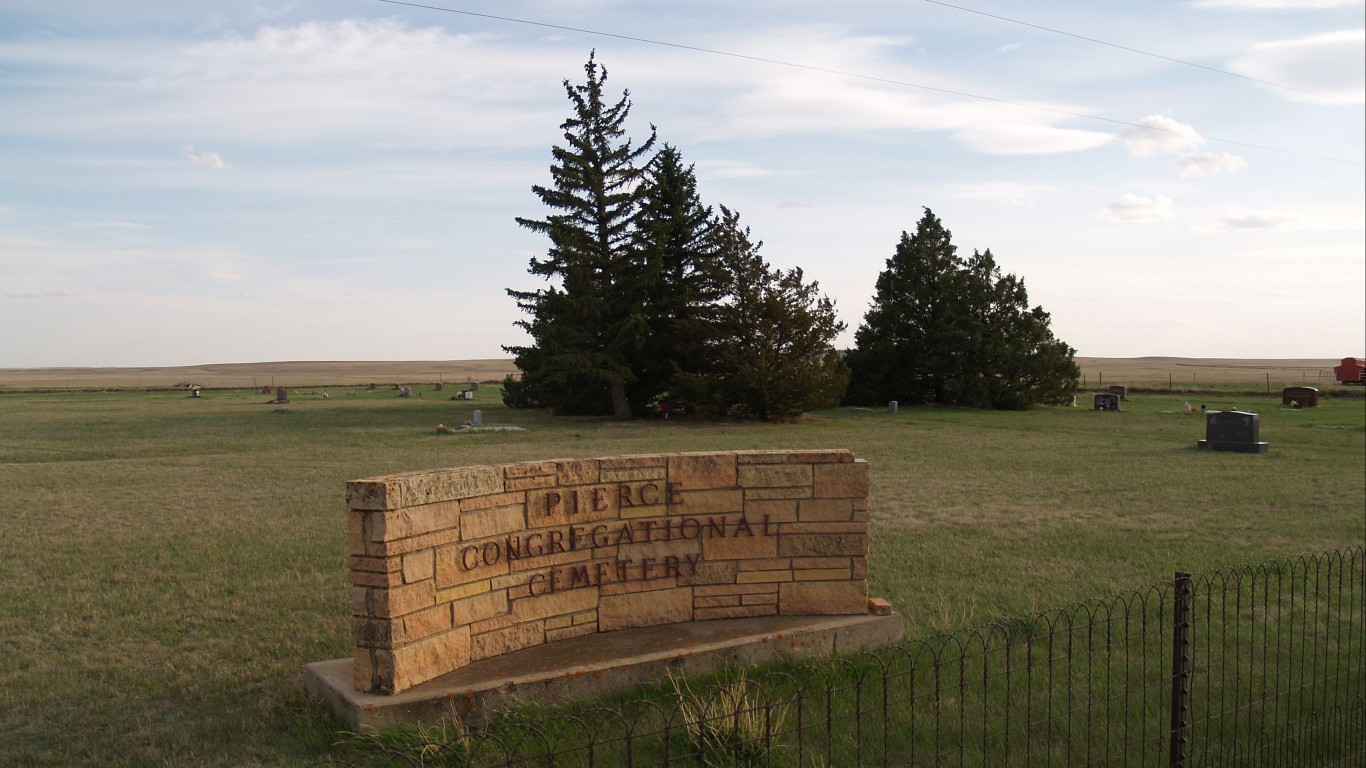
40. Slope County, North Dakota
> Life expectancy: 82.36 years
> Largest place in county: Marmarth
> Change in life expectancy, 1980-2014: +6.6%
> Poverty: 6.8%
> Adult obesity: 28.3%
[in-text-ad]

39. Park County, Colorado
> Life expectancy: 82.37 years
> Largest place in county: Fairplay
> Change in life expectancy, 1980-2014: +9.0%
> Poverty: 6.6%
> Adult obesity: 20.6%

38. Summit County, Utah
> Life expectancy: 82.39 years
> Largest place in county: Park City
> Change in life expectancy, 1980-2014: +7.6%
> Poverty: 7.5%
> Adult obesity: 15.2%
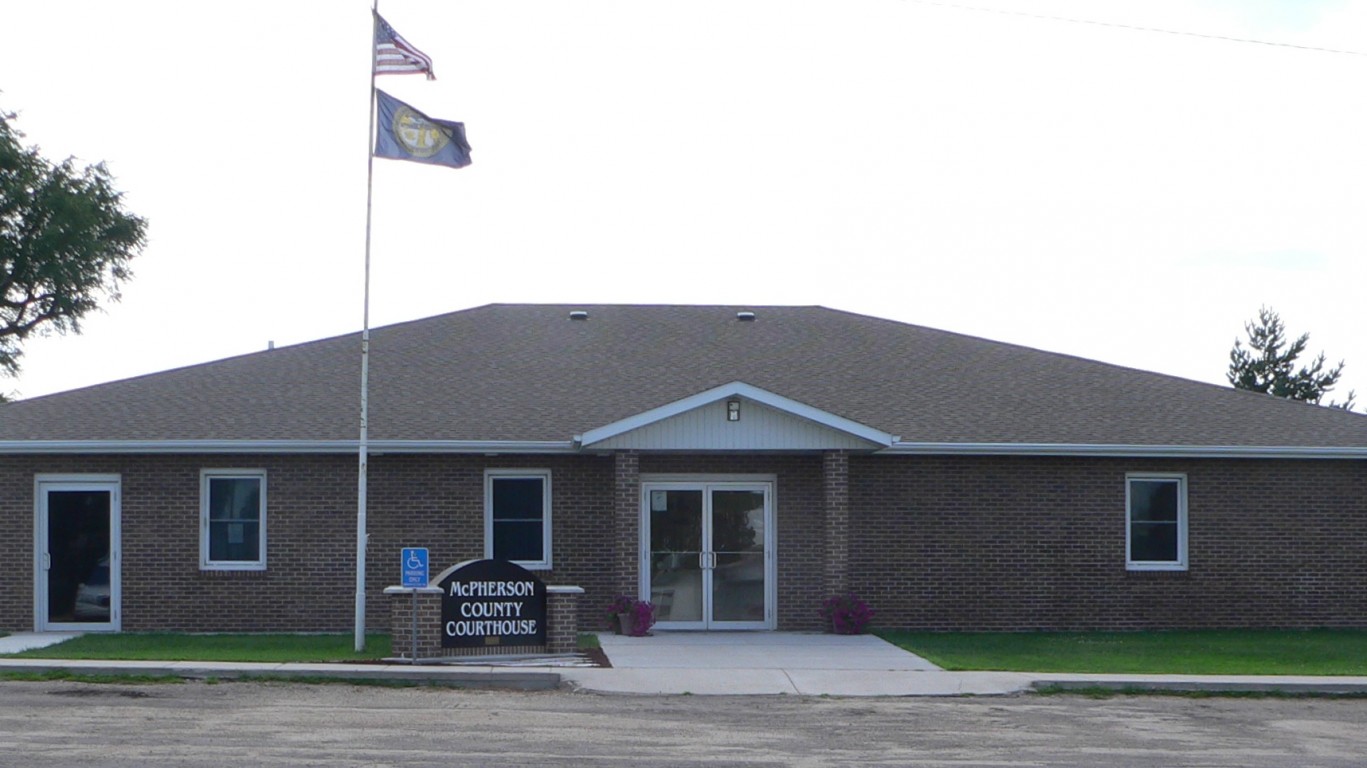
37. McPherson County, Nebraska
> Life expectancy: 82.41 years
> Largest place in county: N/A
> Change in life expectancy, 1980-2014: +7.8%
> Poverty: 16%
> Adult obesity: 30.5%
[in-text-ad-2]

36. Sheridan County, North Dakota
> Life expectancy: 82.44 years
> Largest place in county: McClusky
> Change in life expectancy, 1980-2014: +6.3%
> Poverty: 15.4%
> Adult obesity: 36%

35. Hunterdon County, New Jersey
> Life expectancy: 82.45 years
> Largest place in county: Flemington
> Change in life expectancy, 1980-2014: +8.9%
> Poverty: 4.5%
> Adult obesity: 20.8%
[in-text-ad]

34. Bergen County, New Jersey
> Life expectancy: 82.47 years
> Largest place in county: Hackensack
> Change in life expectancy, 1980-2014: +9.6%
> Poverty: 7.2%
> Adult obesity: 23%

33. Rockland County, New York
> Life expectancy: 82.54 years
> Largest place in county: New City
> Change in life expectancy, 1980-2014: +10.5%
> Poverty: 14.2%
> Adult obesity: 23.7%

32. Sioux County, Nebraska
> Life expectancy: 82.57 years
> Largest place in county: Harrison
> Change in life expectancy, 1980-2014: +8.1%
> Poverty: 12.4%
> Adult obesity: 27.3%
[in-text-ad-2]

31. Winneshiek County, Iowa
> Life expectancy: 82.62 years
> Largest place in county: Decorah
> Change in life expectancy, 1980-2014: +7.0%
> Poverty: 8%
> Adult obesity: 32.1%

30. Routt County, Colorado
> Life expectancy: 82.73 years
> Largest place in county: Steamboat Springs
> Change in life expectancy, 1980-2014: +9.0%
> Poverty: 10.7%
> Adult obesity: 14.2%
[in-text-ad]

29. Grand County, Colorado
> Life expectancy: 82.73 years
> Largest place in county: Granby
> Change in life expectancy, 1980-2014: +9.4%
> Poverty: 13.1%
> Adult obesity: 16.3%

28. Arlington County, Virginia
> Life expectancy: 82.76 years
> Largest place in county: Arlington
> Change in life expectancy, 1980-2014: +8.9%
> Poverty: 8.2%
> Adult obesity: 19.6%

27. Carver County, Minnesota
> Life expectancy: 82.80 years
> Largest place in county: Chaska
> Change in life expectancy, 1980-2014: +8.0%
> Poverty: 4%
> Adult obesity: 23.5%
[in-text-ad-2]

26. Wayne County, Nebraska
> Life expectancy: 82.82 years
> Largest place in county: Wayne
> Change in life expectancy, 1980-2014: +6.7%
> Poverty: 13.5%
> Adult obesity: 33.3%

25. Sioux County, Iowa
> Life expectancy: 82.86 years
> Largest place in county: Sioux Center
> Change in life expectancy, 1980-2014: +6.0%
> Poverty: 7.9%
> Adult obesity: 28%
[in-text-ad]

24. Mono County, California
> Life expectancy: 82.96 years
> Largest place in county: Mammoth Lakes
> Change in life expectancy, 1980-2014: +9.1%
> Poverty: 9.9%
> Adult obesity: 23.4%

23. Howard County, Maryland
> Life expectancy: 82.98 years
> Largest place in county: Columbia
> Change in life expectancy, 1980-2014: +10.4%
> Poverty: 5.2%
> Adult obesity: 24.4%

22. Blaine County, Idaho
> Life expectancy: 82.99 years
> Largest place in county: Hailey
> Change in life expectancy, 1980-2014: +8.0%
> Poverty: 14.8%
> Adult obesity: 17.6%
[in-text-ad-2]

21. Ouray County, Colorado
> Life expectancy: 83.00 years
> Largest place in county: Ridgway
> Change in life expectancy, 1980-2014: +8.5%
> Poverty: 10.4%
> Adult obesity: 19.3%
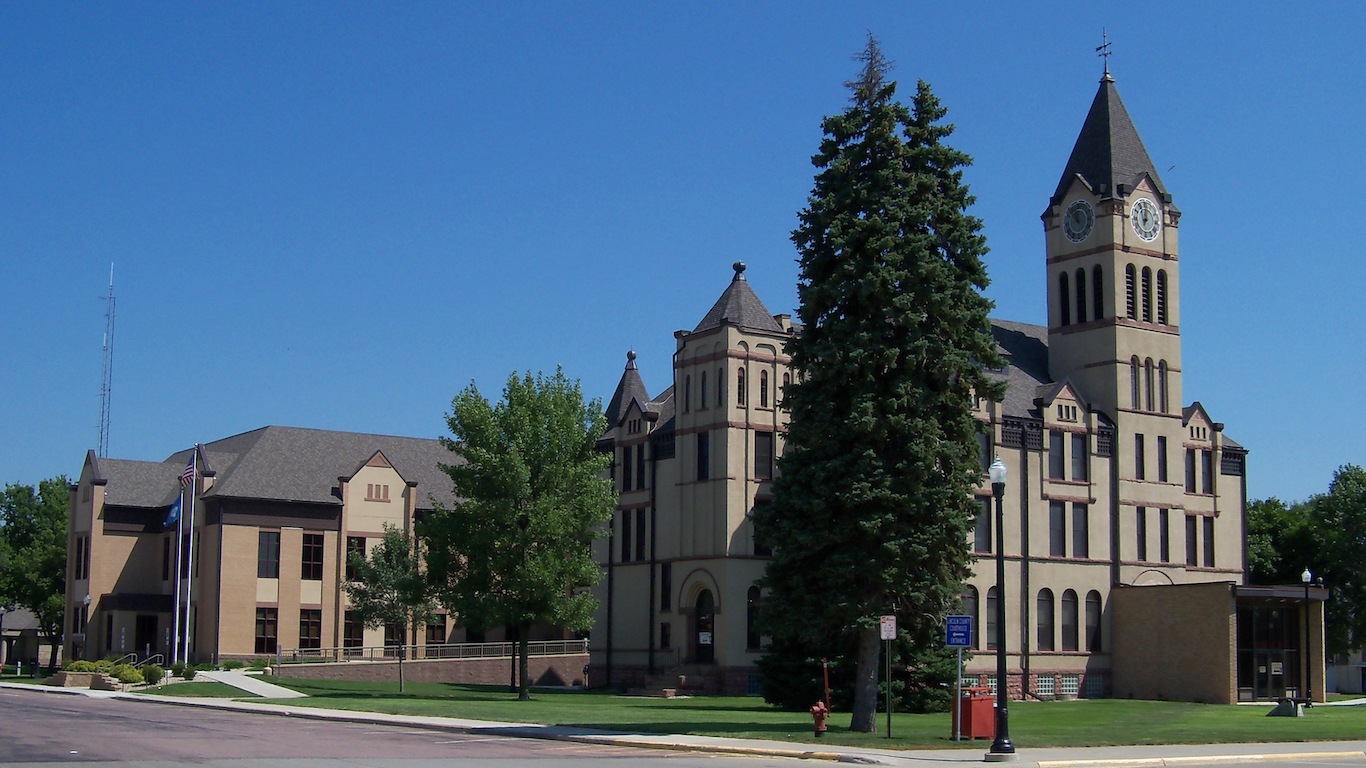
20. Lincoln County, South Dakota
> Life expectancy: 83.03 years
> Largest place in county: Sioux Falls
> Change in life expectancy, 1980-2014: +7.5%
> Poverty: 3%
> Adult obesity: 29.6%
[in-text-ad]

19. Leelanau County, Michigan
> Life expectancy: 83.10 years
> Largest place in county: Greilickville
> Change in life expectancy, 1980-2014: +9.4%
> Poverty: 7.7%
> Adult obesity: 30.8%

18. San Mateo County, California
> Life expectancy: 83.11 years
> Largest place in county: Daly City
> Change in life expectancy, 1980-2014: +9.8%
> Poverty: 7.3%
> Adult obesity: 21.3%

17. Santa Clara County, California
> Life expectancy: 83.14 years
> Largest place in county: San Jose
> Change in life expectancy, 1980-2014: +9.7%
> Poverty: 8.6%
> Adult obesity: 19.8%
[in-text-ad-2]

16. Loudoun County, Virginia
> Life expectancy: 83.19 years
> Largest place in county: Leesburg
> Change in life expectancy, 1980-2014: +12.5%
> Poverty: 3.7%
> Adult obesity: 22.7%

15. Collier County, Florida
> Life expectancy: 83.43 years
> Largest place in county: Golden Gate
> Change in life expectancy, 1980-2014: +12.0%
> Poverty: 12.8%
> Adult obesity: 21.4%
[in-text-ad]
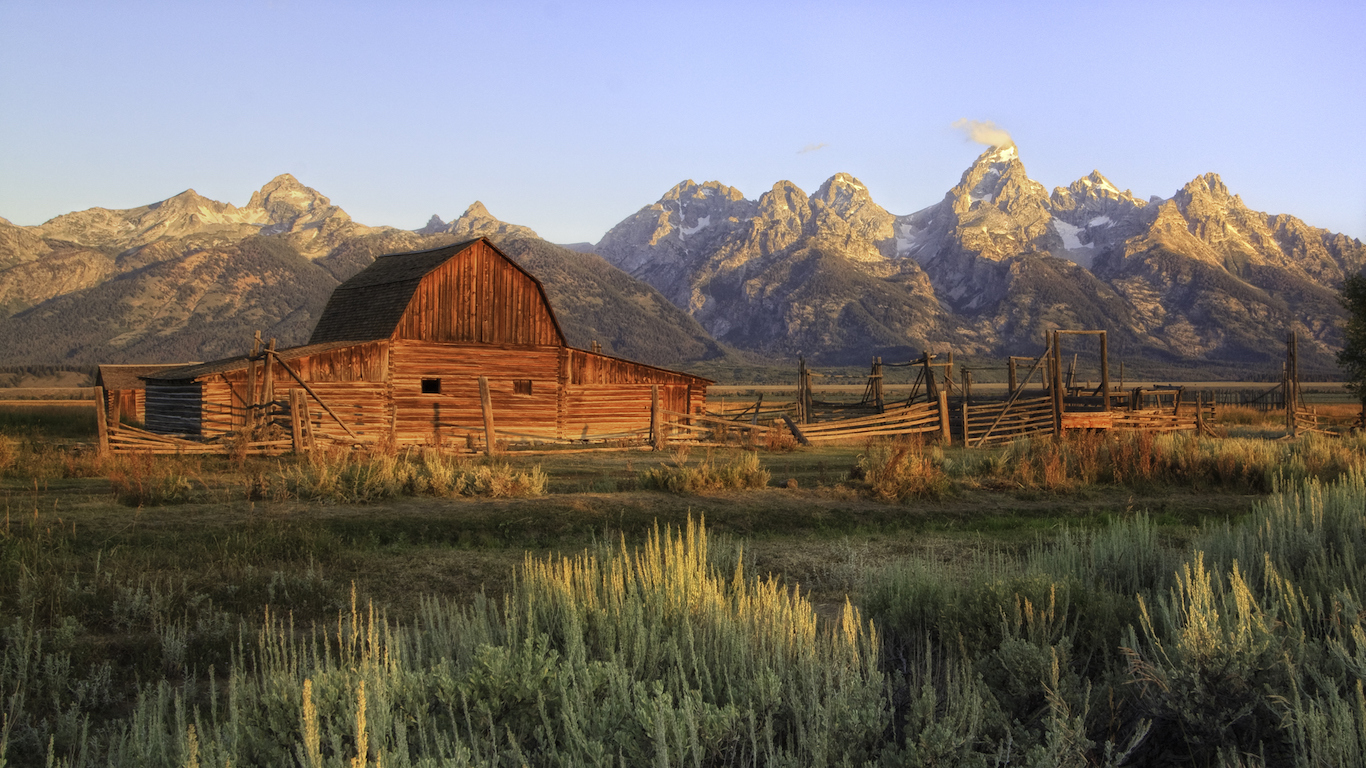
14. Teton County, Wyoming
> Life expectancy: 83.46 years
> Largest place in county: Jackson
> Change in life expectancy, 1980-2014: +9.3%
> Poverty: 6.8%
> Adult obesity: 13.6%

13. Los Alamos County, New Mexico
> Life expectancy: 83.49 years
> Largest place in county: Los Alamos
> Change in life expectancy, 1980-2014: +7.4%
> Poverty: 5.1%
> Adult obesity: 21.3%

12. Hinsdale County, Colorado
> Life expectancy: 83.66 years
> Largest place in county: Lake City
> Change in life expectancy, 1980-2014: +9.0%
> Poverty: 12%
> Adult obesity: 19.5%
[in-text-ad-2]

11. San Juan County, Washington
> Life expectancy: 83.70 years
> Largest place in county: Friday Harbor
> Change in life expectancy, 1980-2014: +8.1%
> Poverty: 10.7%
> Adult obesity: 19.5%
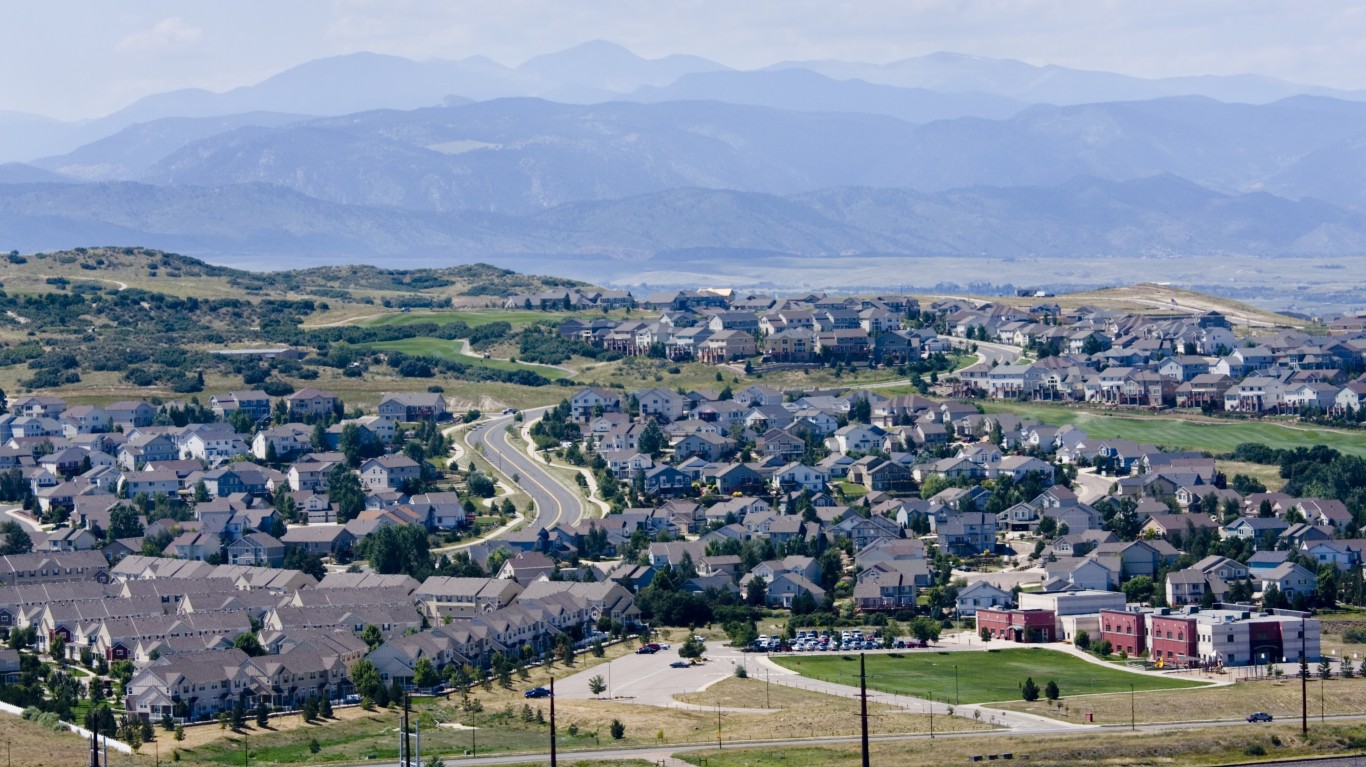
10. Douglas County, Colorado
> Life expectancy: 83.72 years
> Largest place in county: Highlands Ranch
> Change in life expectancy, 1980-2014: +8.9%
> Poverty: 3.6%
> Adult obesity: 18.6%
[in-text-ad]

9. Presidio County, Texas
> Life expectancy: 83.72 years
> Largest place in county: Presidio
> Change in life expectancy, 1980-2014: +11.2%
> Poverty: 26.3%
> Adult obesity: 27.6%

8. Fairfax County, Virginia
> Life expectancy: 83.73 years
> Largest place in county: Reston
> Change in life expectancy, 1980-2014: +9.2%
> Poverty: 6.1%
> Adult obesity: 23.2%

7. San Miguel County, Colorado
> Life expectancy: 83.73 years
> Largest place in county: Telluride
> Change in life expectancy, 1980-2014: +7.9%
> Poverty: 10.5%
> Adult obesity: 17.6%
[in-text-ad-2]
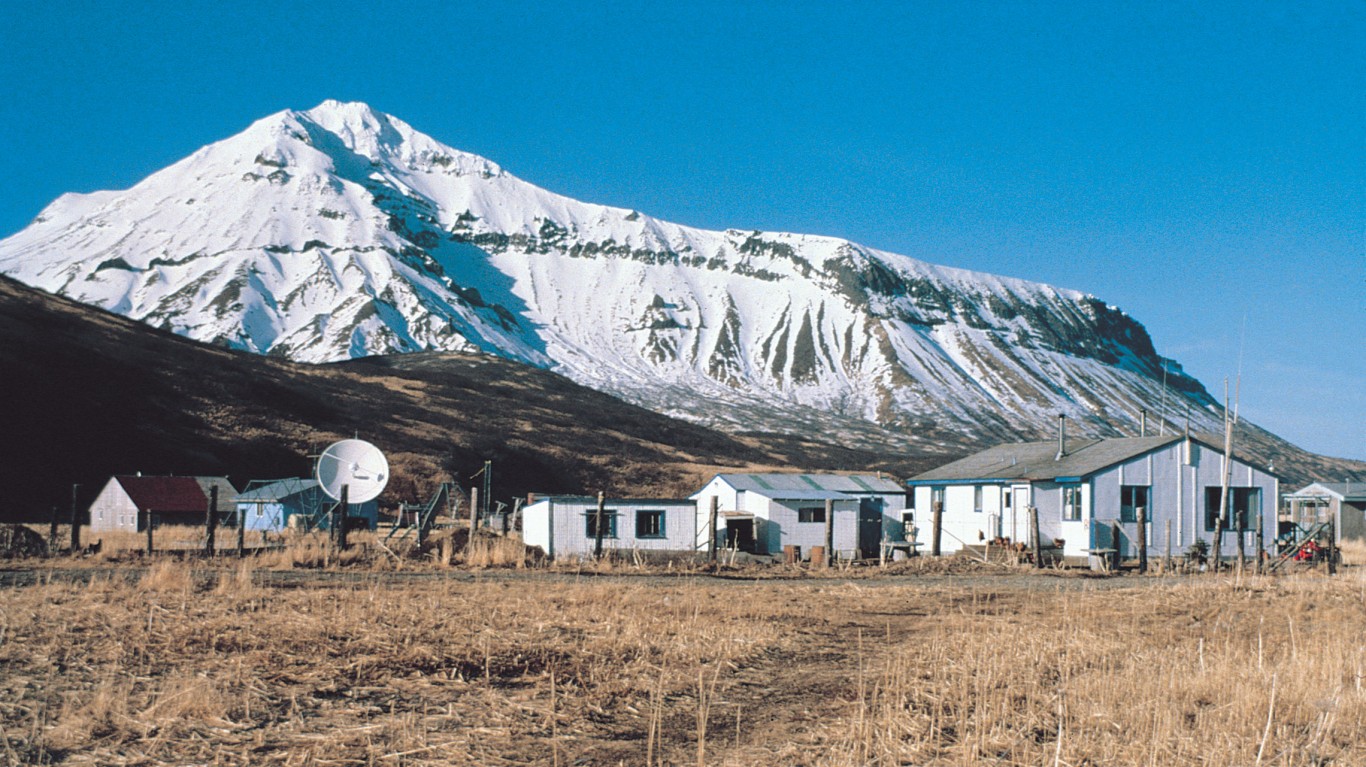
6. Aleutians East Borough, Alaska
> Life expectancy: 83.73 years
> Largest place in county: Sand Point
> Change in life expectancy, 1980-2014: +18.3%
> Poverty: 16.7%
> Adult obesity: 39.5%

5. Marin County, California
> Life expectancy: 83.80 years
> Largest place in county: San Rafael
> Change in life expectancy, 1980-2014: +10.8%
> Poverty: 8.1%
> Adult obesity: 18.2%
[in-text-ad]

4. Billings County, North Dakota
> Life expectancy: 84.04 years
> Largest place in county: Medora
> Change in life expectancy, 1980-2014: +5.8%
> Poverty: 10.3%
> Adult obesity: 30.1%

3. Eagle County, Colorado
> Life expectancy: 85.94 years
> Largest place in county: Edwards
> Change in life expectancy, 1980-2014: +11.3%
> Poverty: 7.7%
> Adult obesity: 13.8%

2. Pitkin County, Colorado
> Life expectancy: 86.52 years
> Largest place in county: Aspen
> Change in life expectancy, 1980-2014: +9.8%
> Poverty: 7.1%
> Adult obesity: 15.3%
[in-text-ad-2]

1. Summit County, Colorado
> Life expectancy: 86.83 years
> Largest place in county: Silverthorne
> Change in life expectancy, 1980-2014: +9.7%
> Poverty: 10.3%
> Adult obesity: 14.5%
Methodology
To determine the counties where people live the longest, 24/7 Tempo reviewed 2014 county-level life expectancy at birth figures provided by the Institute for Health Metrics and Evaluation (IHME), a global research center affiliated with the University of Washington. Data came from the report, “United States Life Expectancy Estimates by County 1980-2014.” Using death records data from the National Center for Health Statistics, researchers estimated age-specific mortality rates for U.S. counties from 1980 to 2014.
County-level poverty rates came from the U.S. Census Bureau’s 2017 American Community Survey. Obesity rates came from The 2019 County Health Rankings & Roadmaps program, a collaboration between the Robert Wood Johnson Foundation and the University of Wisconsin Population Health Institute.
Retirement planning doesn’t have to feel overwhelming. The key is finding expert guidance—and SmartAsset’s simple quiz makes it easier than ever for you to connect with a vetted financial advisor.
Here’s how it works:
Why wait? Start building the retirement you’ve always dreamed of. Click here to get started today!
Thank you for reading! Have some feedback for us?
Contact the 24/7 Wall St. editorial team.