Special Report
Cities Where People Live the Longest in the Same Home
Published:
Last Updated:

Roughly 14% of the American population packs up and moves each year. The result of this is that 71% of households today have moved into their current homes or apartments since the year 2000 and over 40% have moved in the past decade.
Yet in some places across the country, people tend to stay put. Nationwide, just about 15% of occupied homes and apartments have had the same families or individuals living there for at least 30 years. In a number of municipalities and unincorporated communities, however, that share is double or more.
24/7 Wall St. reviewed the 25 places in the United States where the largest share of households moved into their current house or apartment prior to 1990. We considered all cities, towns, villages, municipalities, boroughs, and Census designated places measured by the U.S. Census Bureau with populations of at least 25,000 people. All data used is part of the 2012-2017 five-year estimates from the Census Bureau’s American Community Survey.
Most of these communities are located in the Northeast or the West Coast, and several are in Hawaii. They are generally relatively affluent communities where homes are more expensive than typical nationwide. The national median value of occupied homes is $193,500. In the majority of these 25 places it is at least double the national value. The high cost of property in these places may contribute to the relatively low turnover.
As might be expected, homeownership is especially high in these communities. Nationwide, 63.8% of housing units are owner-occupied. In the vast majority of places on this list, over 80% are owner-occupied. Click here to see the cities where the most people own their homes.
Two of the places on this list are the first two Levittowns to be built — those in New York and Pennsylvania. These planned communities utilized prefabrication techniques and the promise of small, affordable homes.
In these two levittowns, most housing units were built in the late 1940s and early 1950s. In most of the places on this list, the vast majority of housing units is more than 30 years old. Nationwide, 68.4% of housing units were built prior to 1990. In most of the 25 places where people live the longest in the same home, over 90% of homes and apartments were built before 1990. Here is a list of U.S. Cities with the oldest homes.
Click here to see the cities where people live the longest in the same home
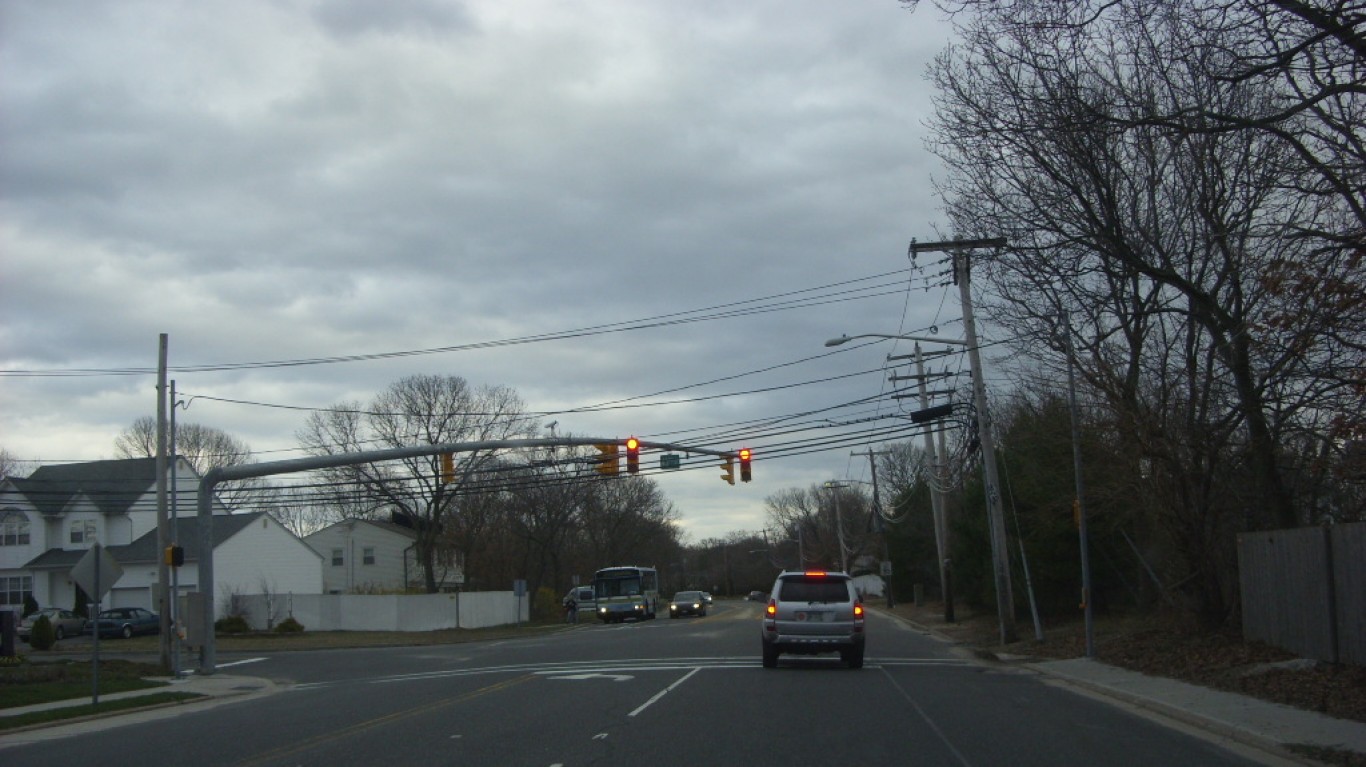
25. Centereach, New York
> Pct. of residents who moved into current home before 1990: 29.2%
> Pct. of residents who moved into current home before 1980: 18.2%
> Pct. of houses & apartments built 1990 or later: 14.9%
> Median home value: $335,400
> Pct. housing units owner-occupied: 84.9%
[in-text-ad]
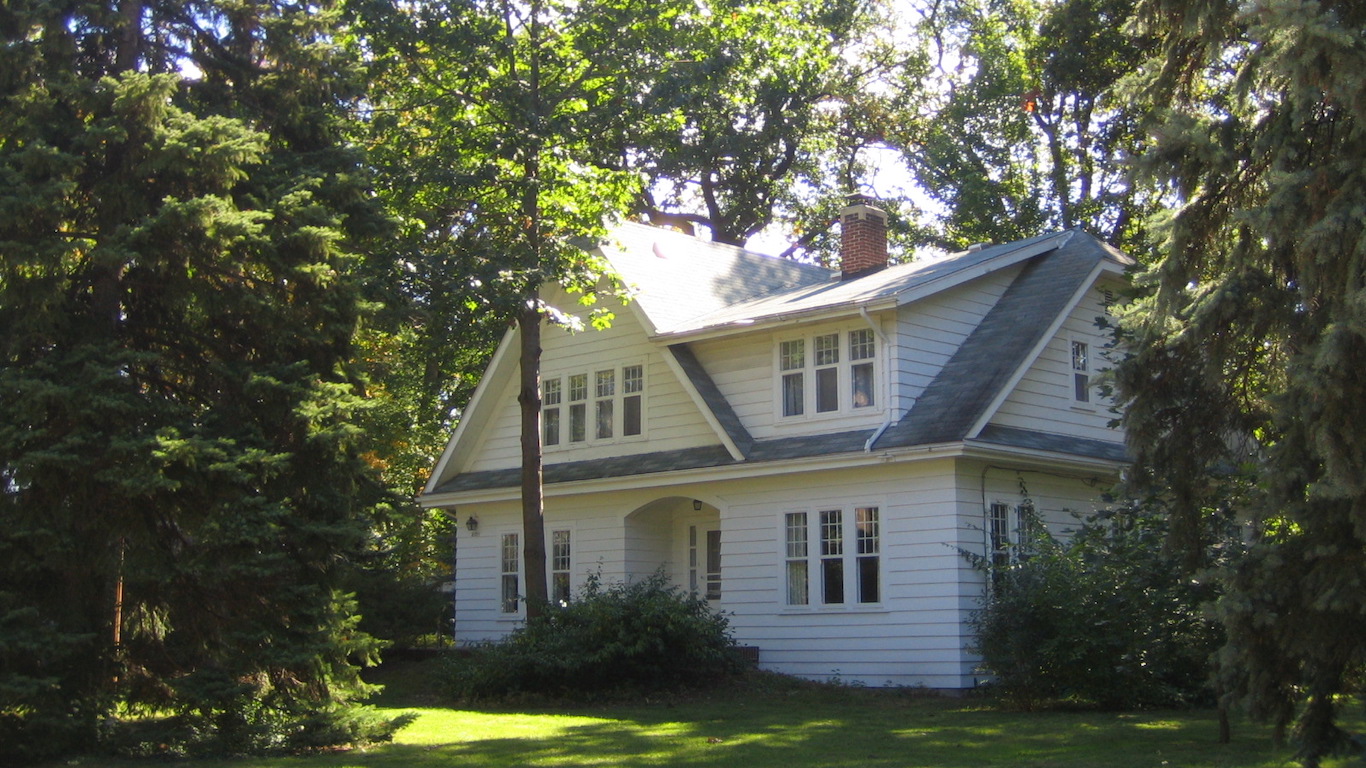
24. Garden City, Michigan
> Pct. of residents who moved into current home before 1990: 29.3%
> Pct. of residents who moved into current home before 1980: 18.7%
> Pct. of houses & apartments built 1990 or later: 6.5%
> Median home value: $88,300
> Pct. housing units owner-occupied: 81.6%
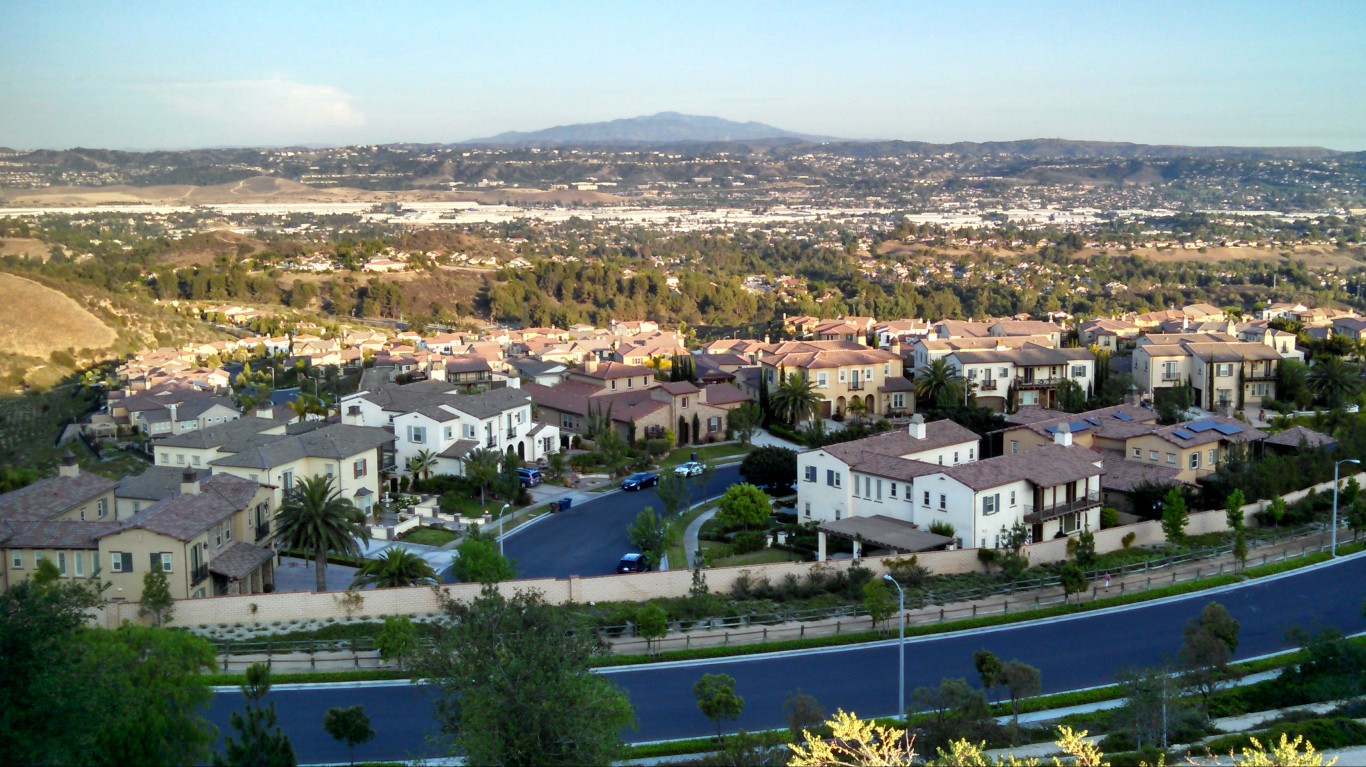
23. Walnut, California
> Pct. of residents who moved into current home before 1990: 29.4%
> Pct. of residents who moved into current home before 1980: 8.2%
> Pct. of houses & apartments built 1990 or later: 12.3%
> Median home value: $703,800
> Pct. housing units owner-occupied: 83.9%
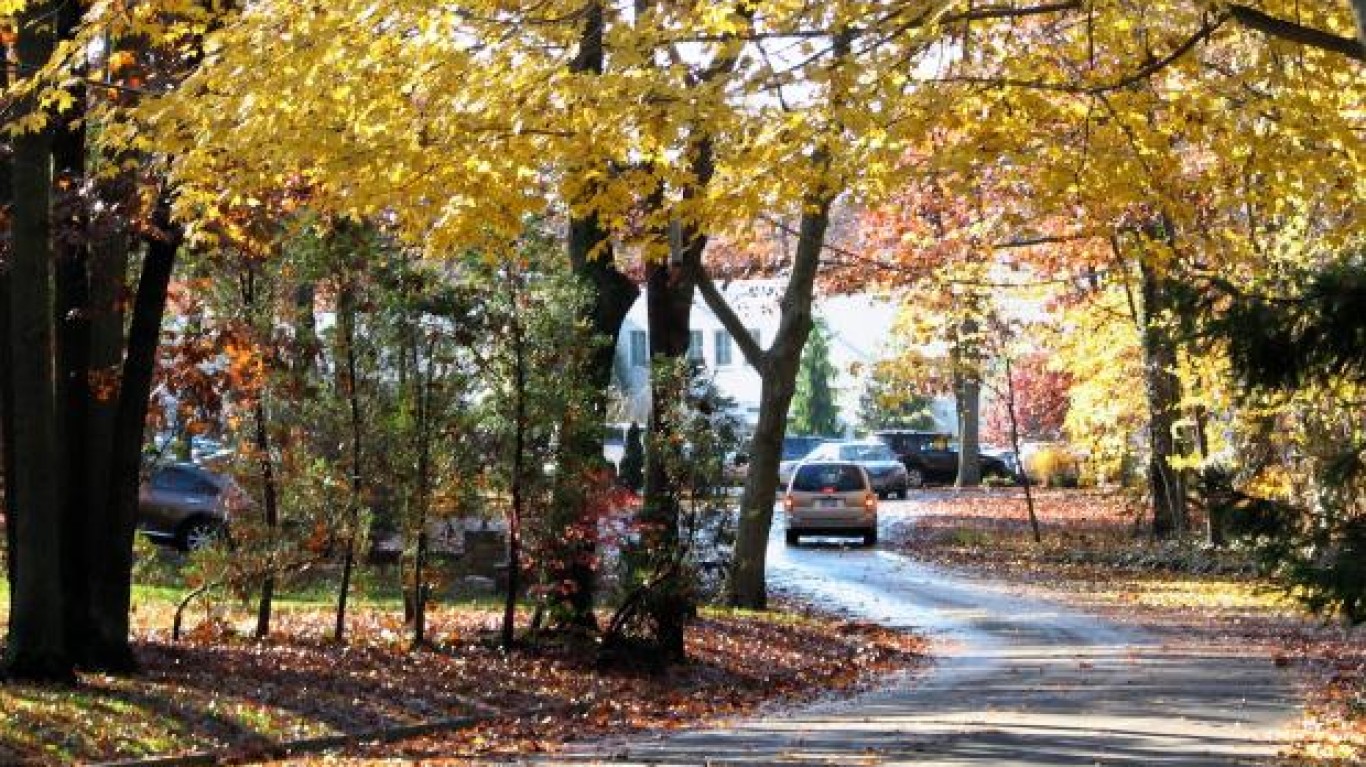
22. Dix Hills, New York
> Pct. of residents who moved into current home before 1990: 29.4%
> Pct. of residents who moved into current home before 1980: 17.3%
> Pct. of houses & apartments built 1990 or later: 9.1%
> Median home value: $694,600
> Pct. housing units owner-occupied: 94.7%
[in-text-ad-2]

21. Rancho Palos Verdes, California
> Pct. of residents who moved into current home before 1990: 29.6%
> Pct. of residents who moved into current home before 1980: 19.1%
> Pct. of houses & apartments built 1990 or later: 4.9%
> Median home value: $1,051,000
> Pct. housing units owner-occupied: 79.6%
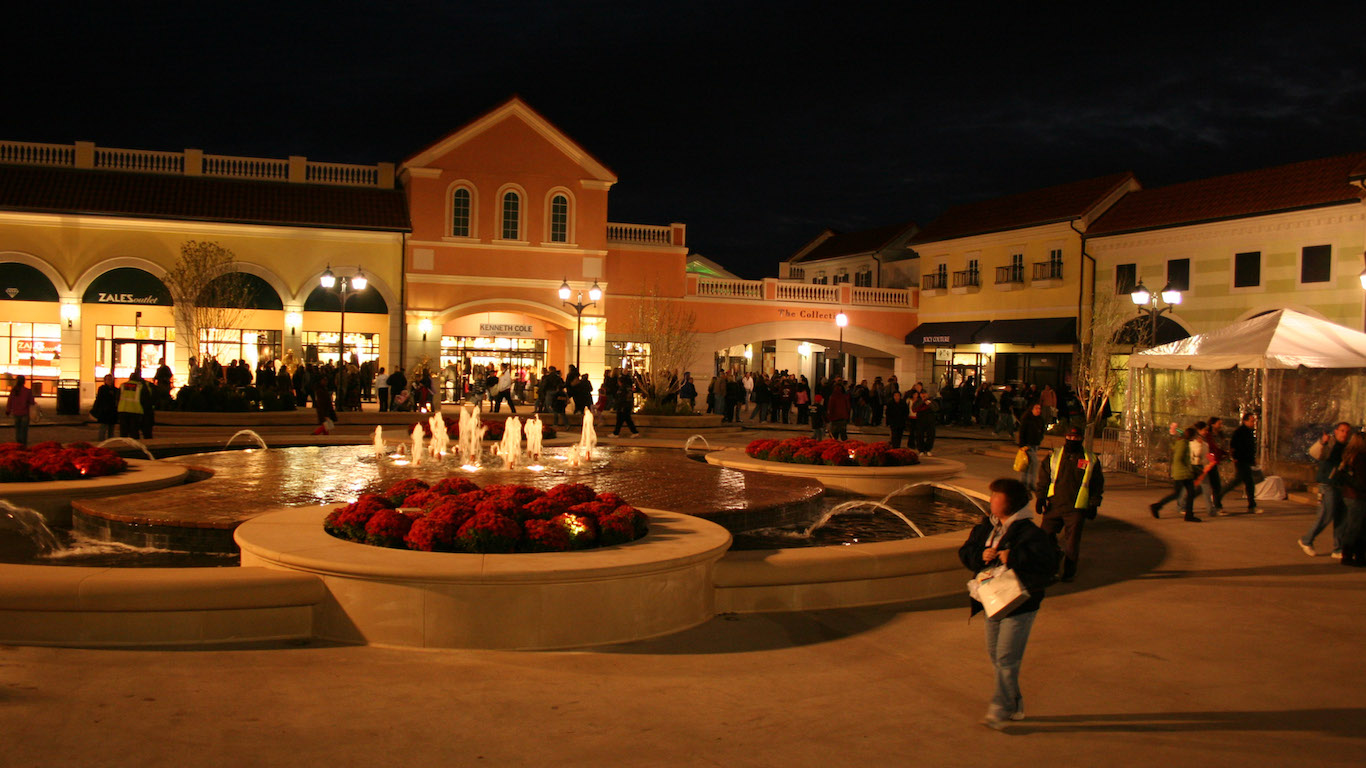
19. Deer Park, New York
> Pct. of residents who moved into current home before 1990: 29.7%
> Pct. of residents who moved into current home before 1980: 20.7%
> Pct. of houses & apartments built 1990 or later: 5.7%
> Median home value: $353,700
> Pct. housing units owner-occupied: 84.2%
[in-text-ad]
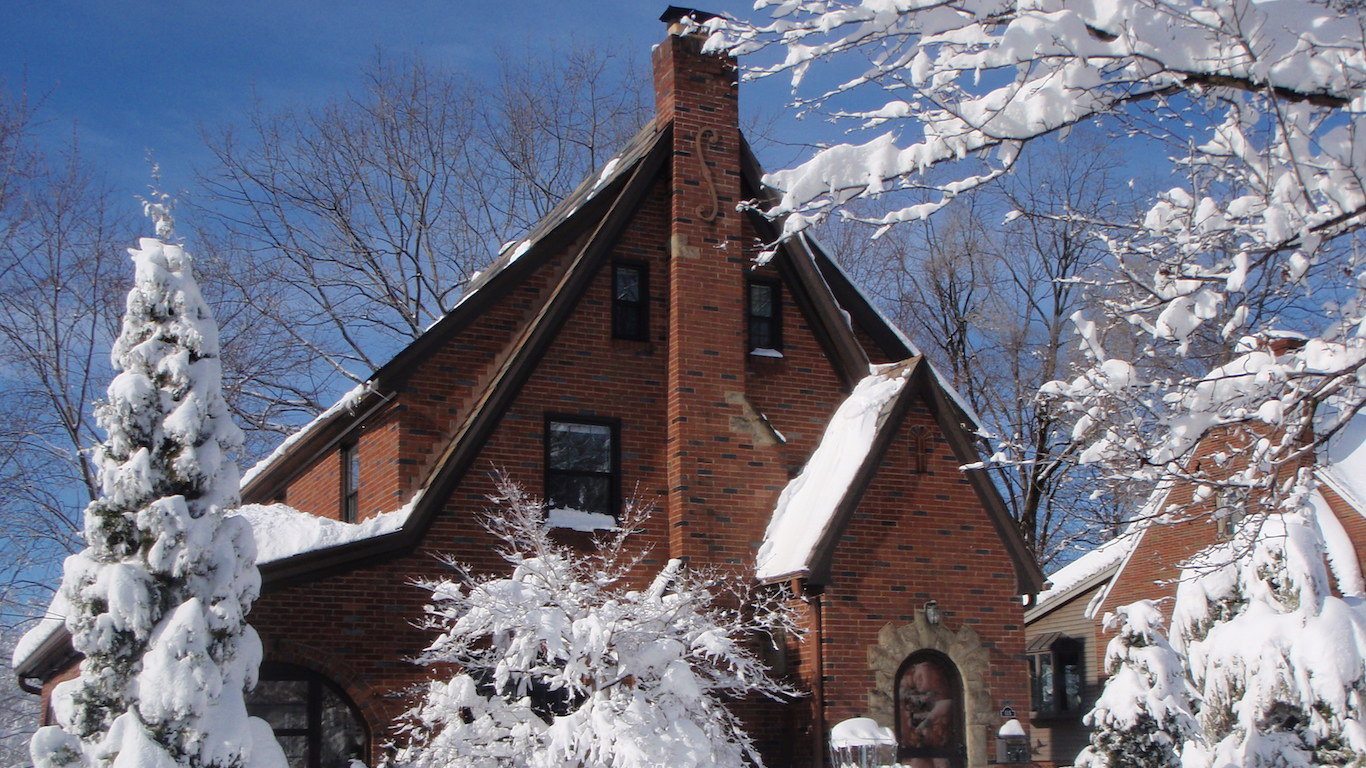
19. Bethel Park, Pennsylvania
> Pct. of residents who moved into current home before 1990: 29.7%
> Pct. of residents who moved into current home before 1980: 18.2%
> Pct. of houses & apartments built 1990 or later: 11.8%
> Median home value: $170,900
> Pct. housing units owner-occupied: 78.6%
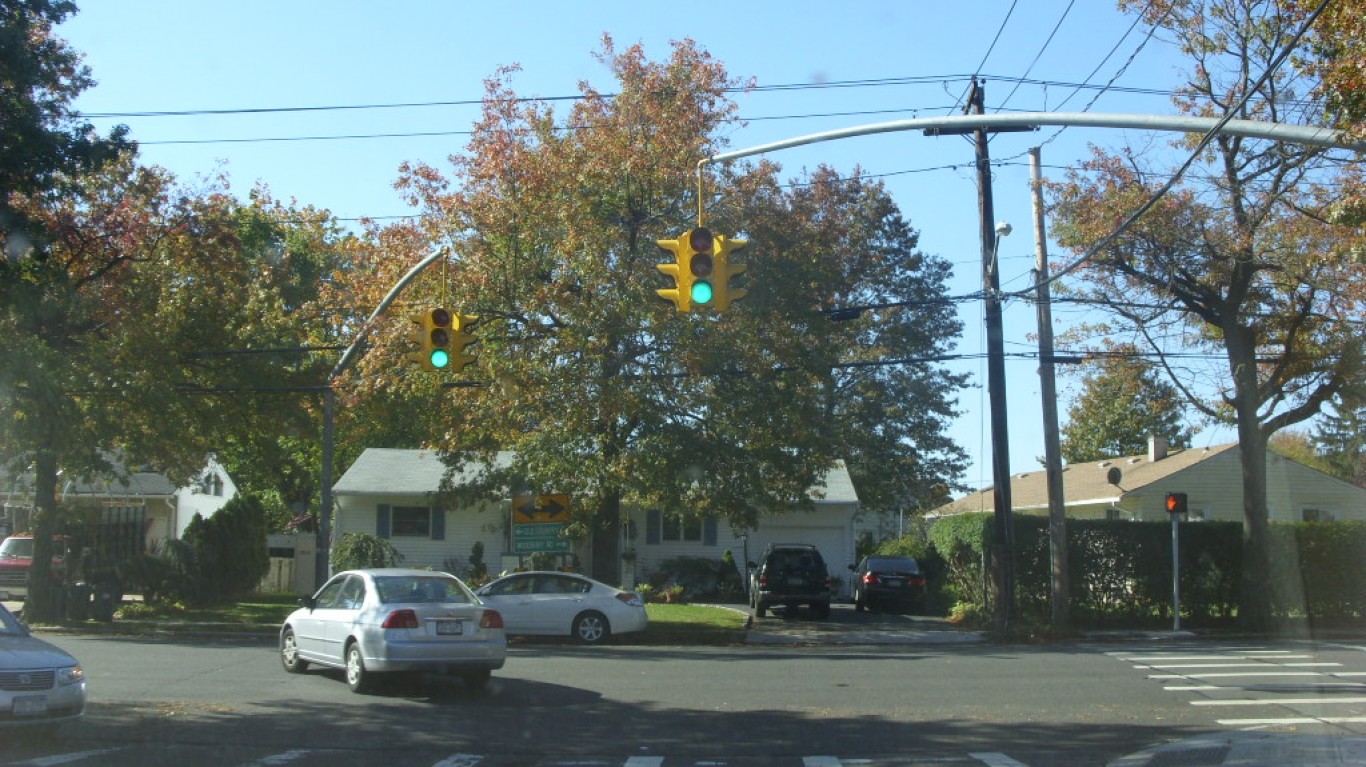
18. Plainview, New York
> Pct. of residents who moved into current home before 1990: 30.1%
> Pct. of residents who moved into current home before 1980: 19.8%
> Pct. of houses & apartments built 1990 or later: 9.6%
> Median home value: $536,600
> Pct. housing units owner-occupied: 91.3%
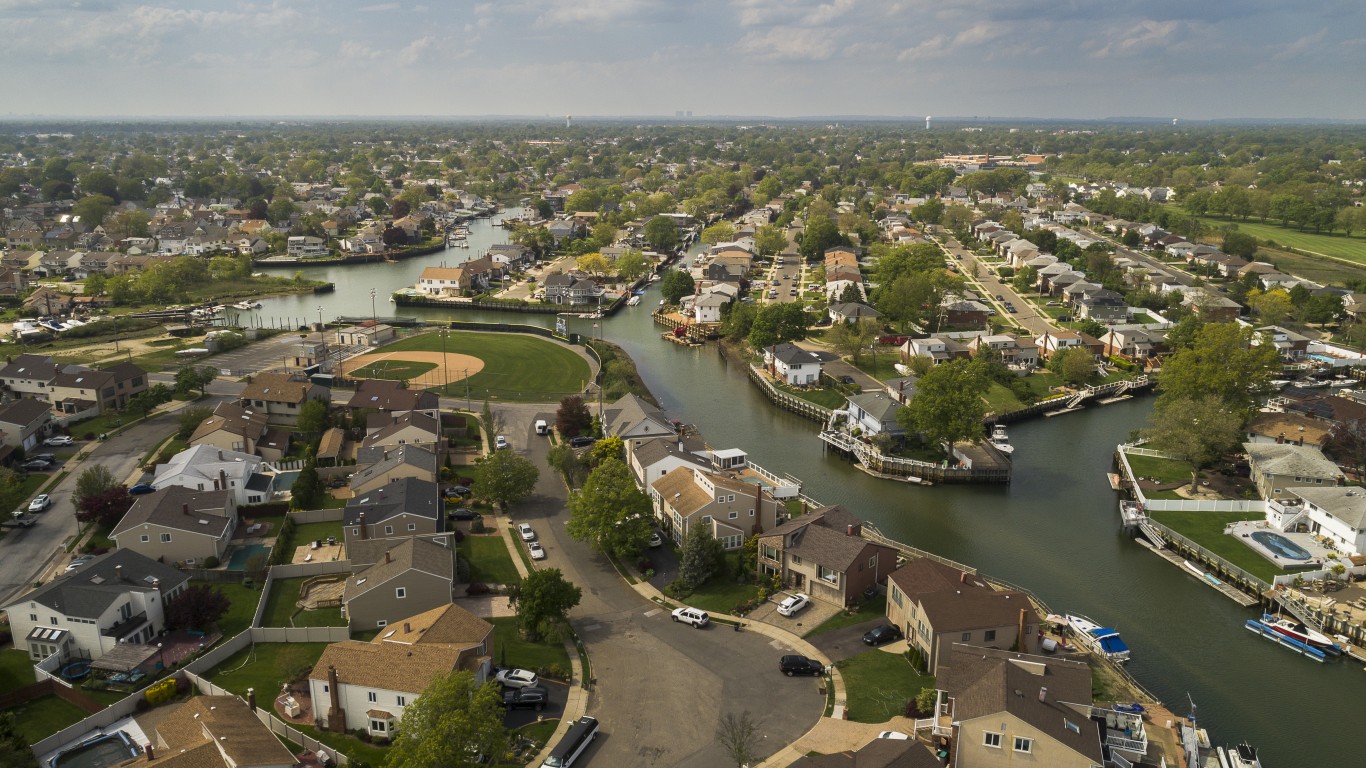
16. Oceanside, New York
> Pct. of residents who moved into current home before 1990: 30.2%
> Pct. of residents who moved into current home before 1980: 18.1%
> Pct. of houses & apartments built 1990 or later: 4.5%
> Median home value: $443,900
> Pct. housing units owner-occupied: 88.0%
[in-text-ad-2]
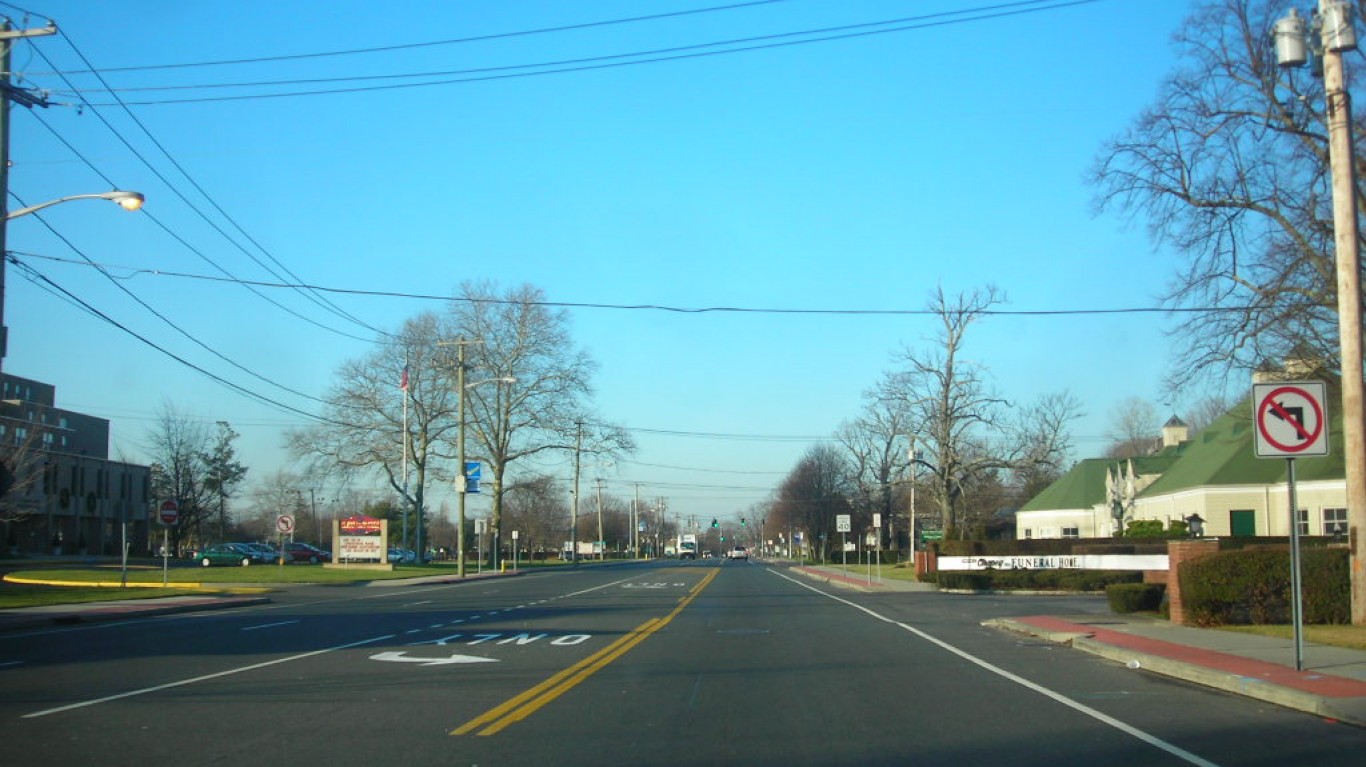
16. Lindenhurst, New York
> Pct. of residents who moved into current home before 1990: 30.2%
> Pct. of residents who moved into current home before 1980: 17.0%
> Pct. of houses & apartments built 1990 or later: 5.3%
> Median home value: $348,400
> Pct. housing units owner-occupied: 78.3%
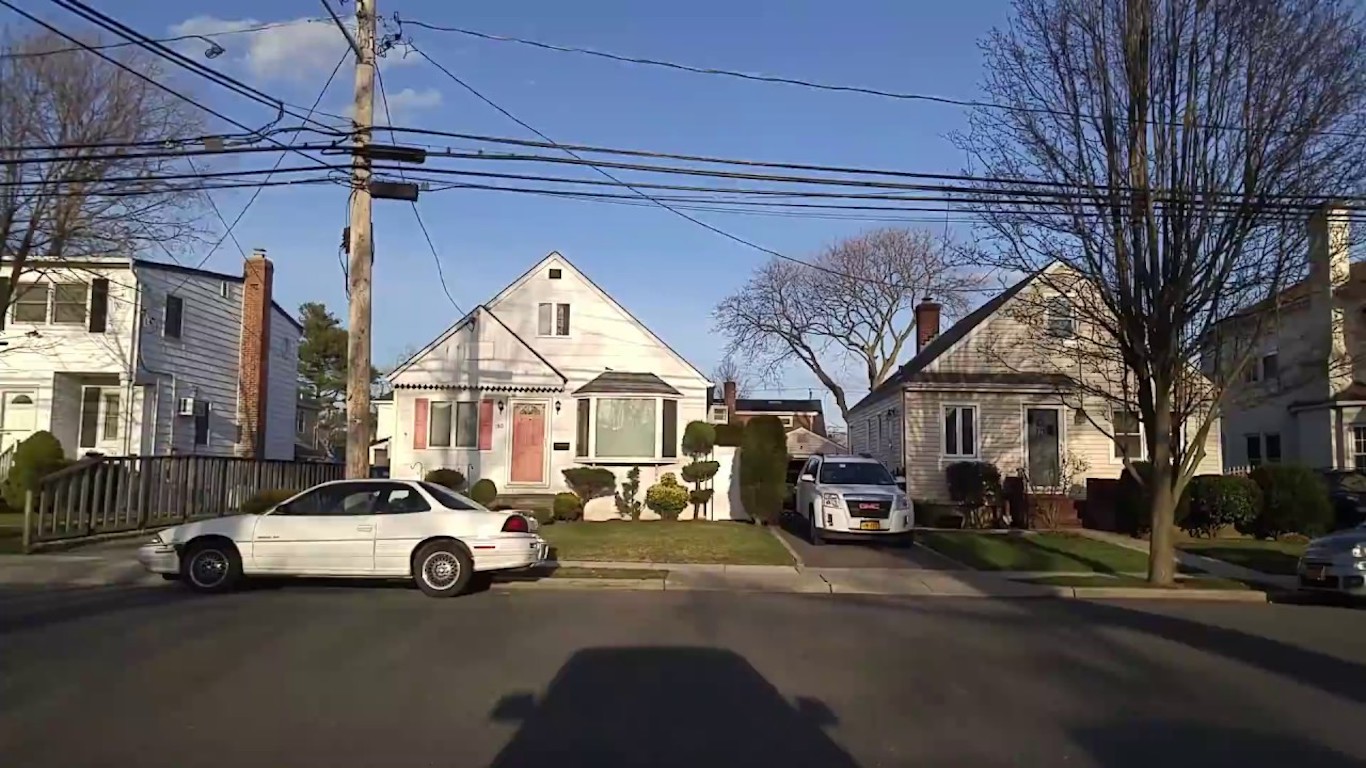
15. Franklin Square, New York
> Pct. of residents who moved into current home before 1990: 30.4%
> Pct. of residents who moved into current home before 1980: 19.7%
> Pct. of houses & apartments built 1990 or later: 3.2%
> Median home value: $447,600
> Pct. housing units owner-occupied: 83.1%
[in-text-ad]
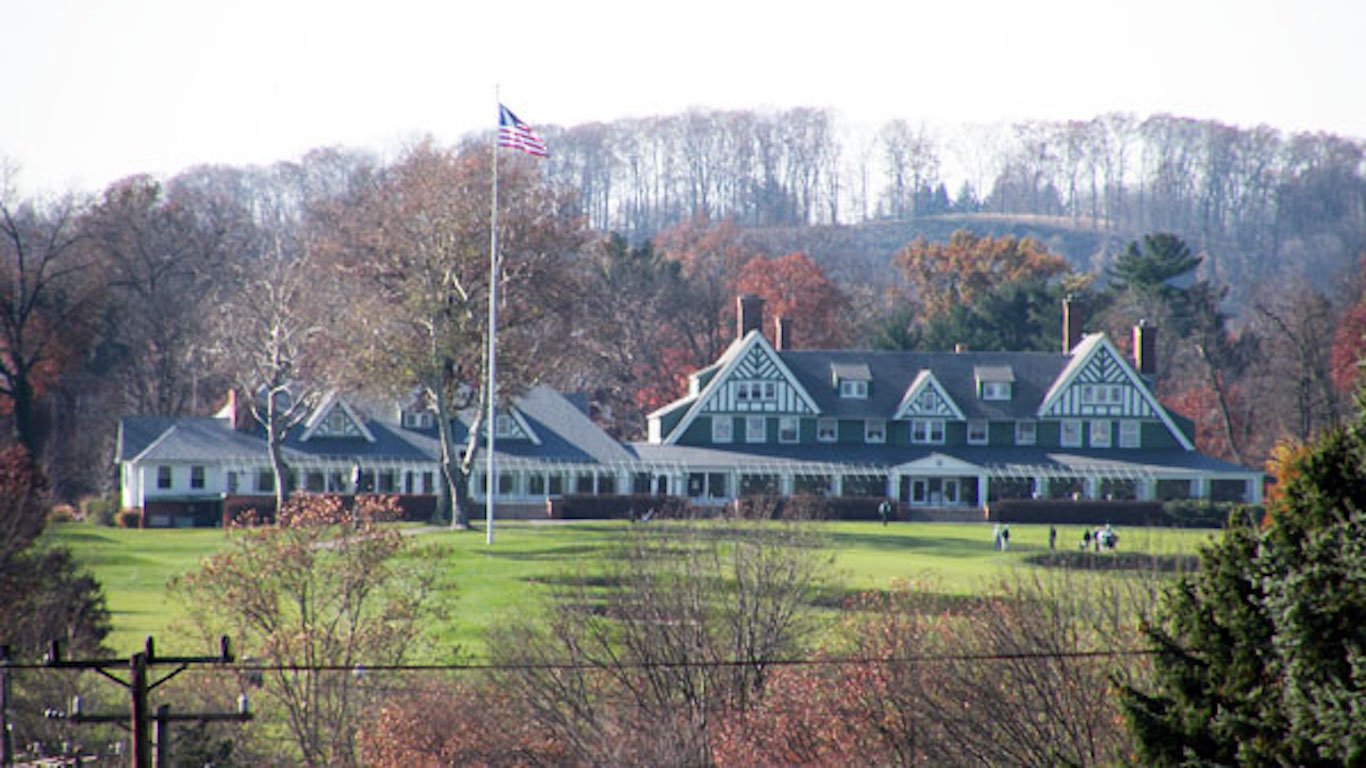
14. Plum, Pennsylvania
> Pct. of residents who moved into current home before 1990: 31.7%
> Pct. of residents who moved into current home before 1980: 19.5%
> Pct. of houses & apartments built 1990 or later: 21.6%
> Median home value: $144,900
> Pct. housing units owner-occupied: 81.3%
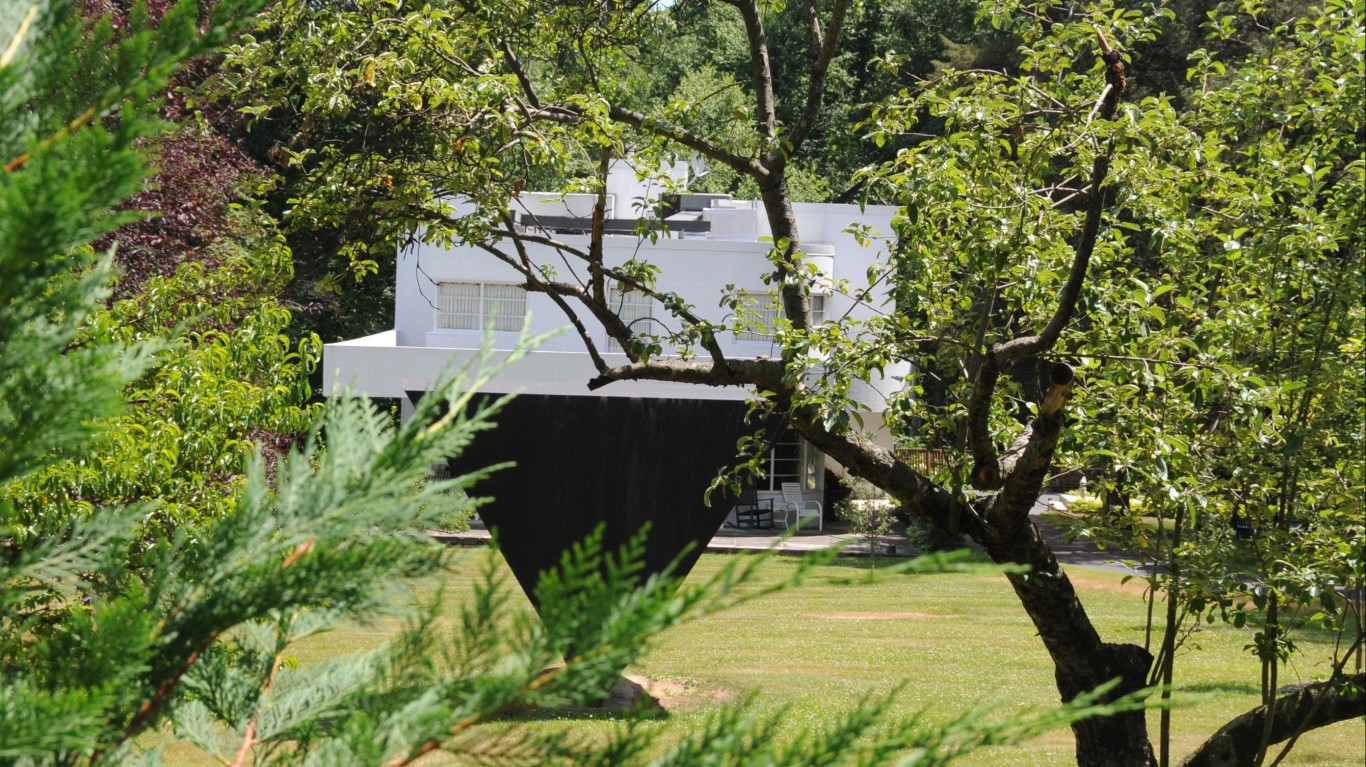
12. New City, New York
> Pct. of residents who moved into current home before 1990: 32.0%
> Pct. of residents who moved into current home before 1980: 20.5%
> Pct. of houses & apartments built 1990 or later: 10.8%
> Median home value: $472,800
> Pct. housing units owner-occupied: 89.4%

12. Paramus, New Jersey
> Pct. of residents who moved into current home before 1990: 32.0%
> Pct. of residents who moved into current home before 1980: 20.7%
> Pct. of houses & apartments built 1990 or later: 19.0%
> Median home value: $574,600
> Pct. housing units owner-occupied: 87.4%
[in-text-ad-2]
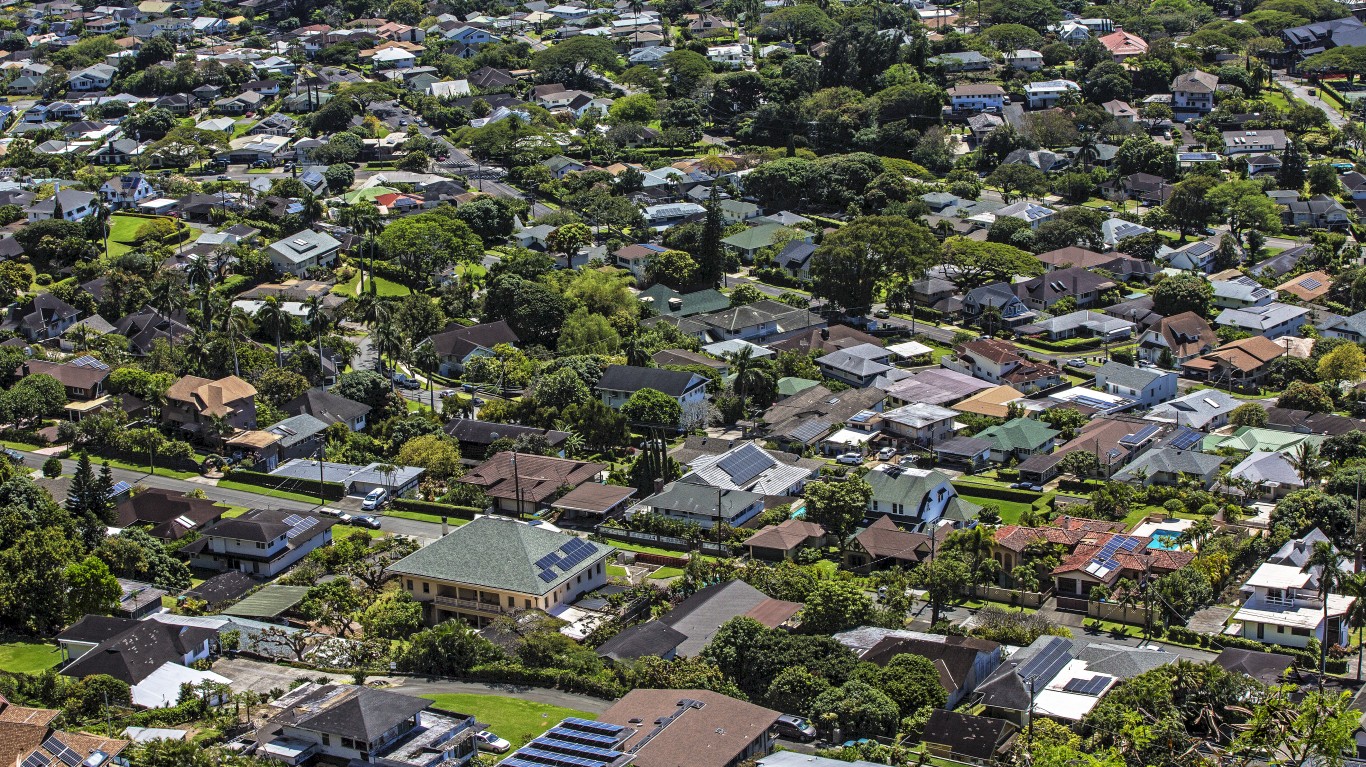
11. East Honolulu, Hawaii
> Pct. of residents who moved into current home before 1990: 32.2%
> Pct. of residents who moved into current home before 1980: 19.6%
> Pct. of houses & apartments built 1990 or later: 17.5%
> Median home value: $888,400
> Pct. housing units owner-occupied: 84.6%
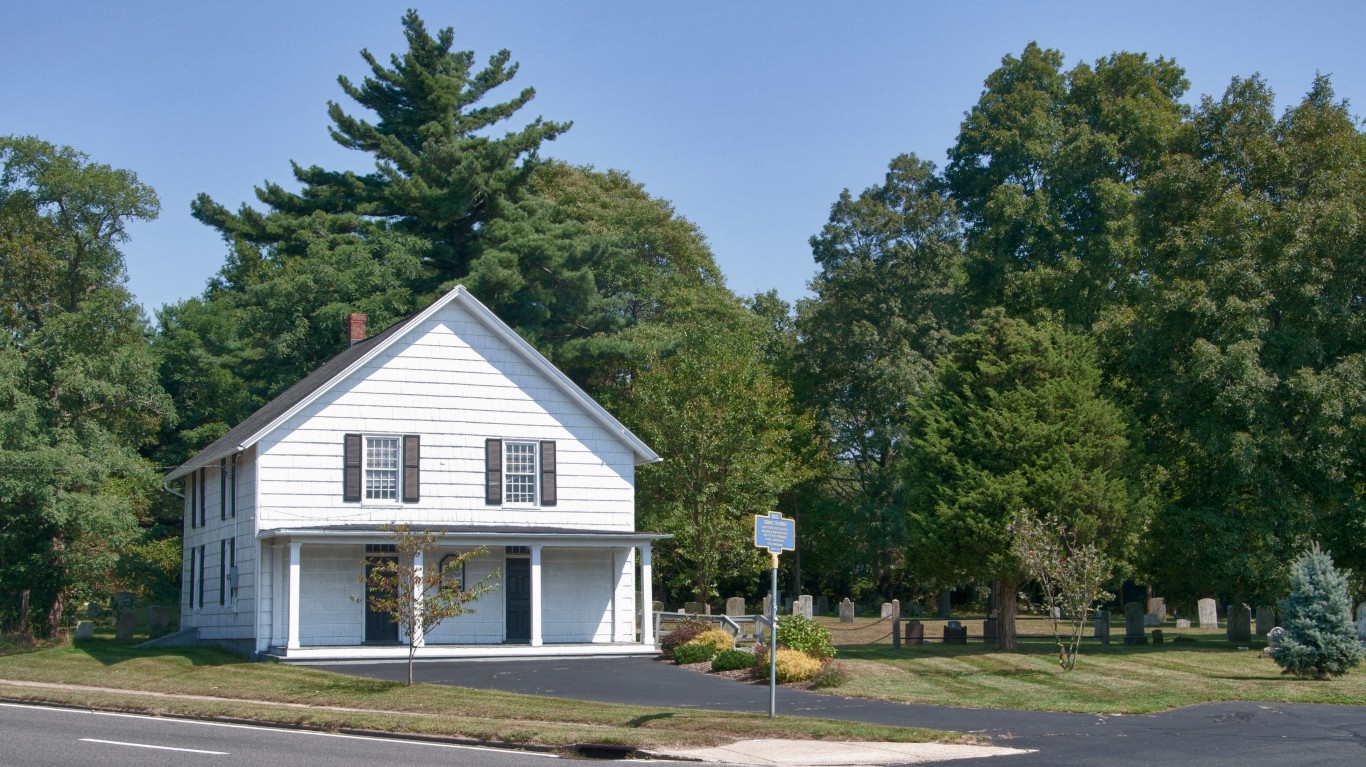
10. Commack, New York
> Pct. of residents who moved into current home before 1990: 32.4%
> Pct. of residents who moved into current home before 1980: 21.1%
> Pct. of houses & apartments built 1990 or later: 9.3%
> Median home value: $471,300
> Pct. housing units owner-occupied: 92.0%
[in-text-ad]
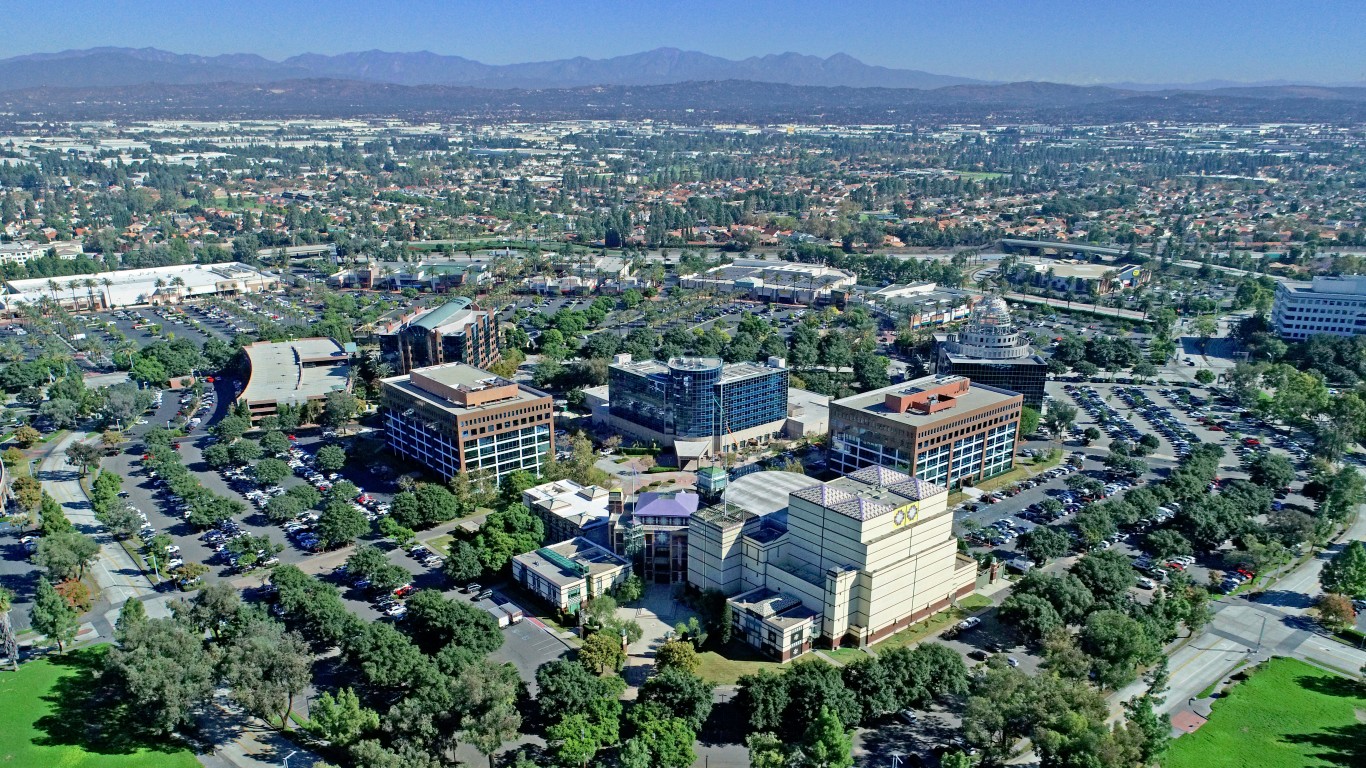
9. Cerritos, California
> Pct. of residents who moved into current home before 1990: 33.1%
> Pct. of residents who moved into current home before 1980: 20.8%
> Pct. of houses & apartments built 1990 or later: 5.2%
> Median home value: $638,600
> Pct. housing units owner-occupied: 78.9%
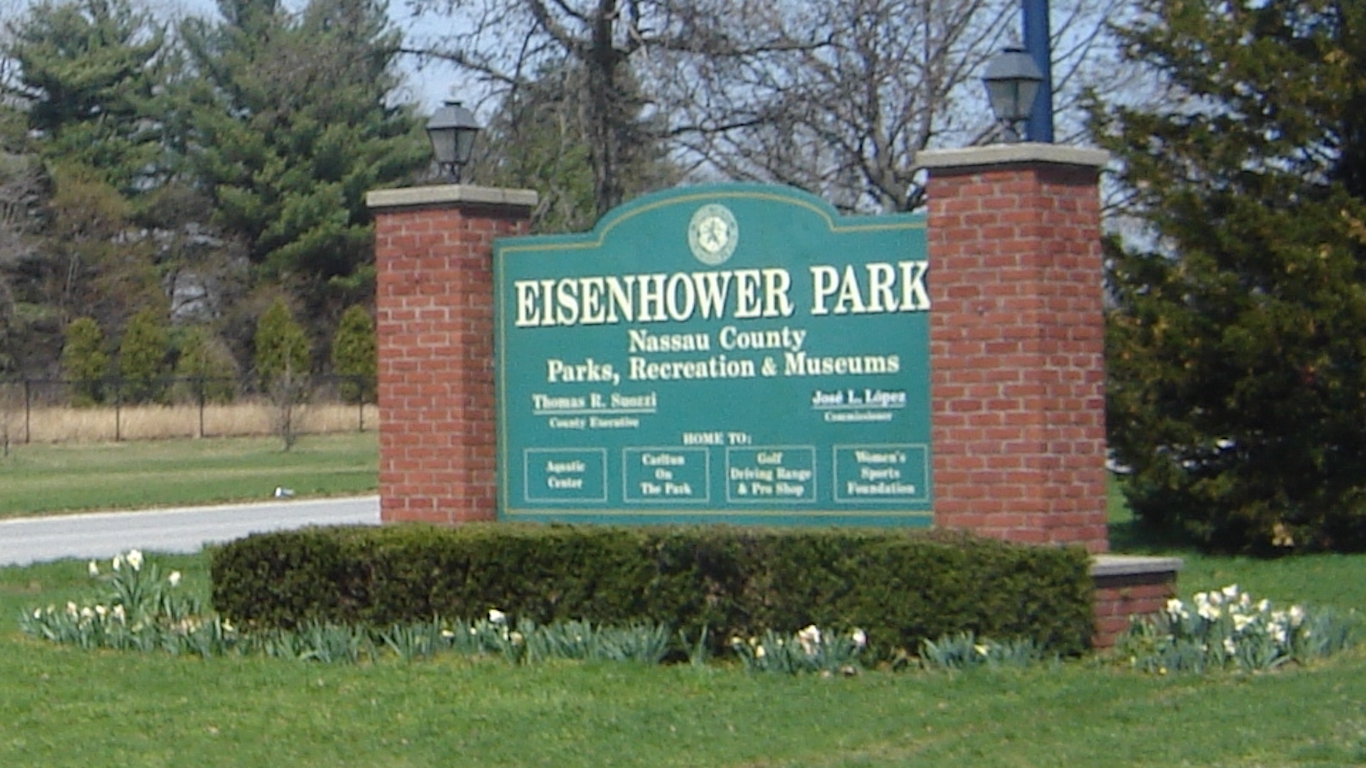
8. East Meadow, New York
> Pct. of residents who moved into current home before 1990: 33.2%
> Pct. of residents who moved into current home before 1980: 17.7%
> Pct. of houses & apartments built 1990 or later: 13.8%
> Median home value: $414,200
> Pct. housing units owner-occupied: 87.9%
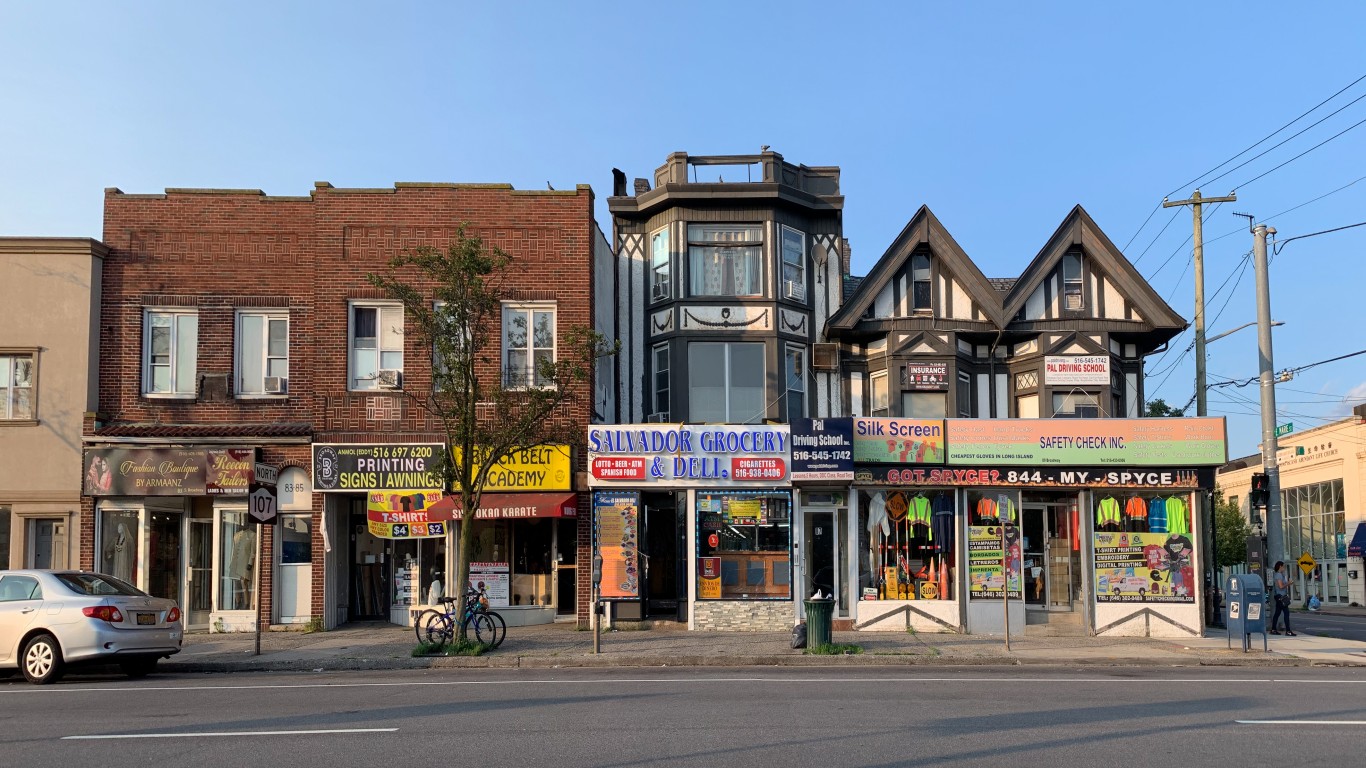
7. Hicksville, New York
> Pct. of residents who moved into current home before 1990: 34.2%
> Pct. of residents who moved into current home before 1980: 23.4%
> Pct. of houses & apartments built 1990 or later: 1.9%
> Median home value: $421,900
> Pct. housing units owner-occupied: 86.7%
[in-text-ad-2]

6. Kaneohe, Hawaii
> Pct. of residents who moved into current home before 1990: 34.9%
> Pct. of residents who moved into current home before 1980: 21.4%
> Pct. of houses & apartments built 1990 or later: 12.2%
> Median home value: $697,000
> Pct. housing units owner-occupied: 70.4%
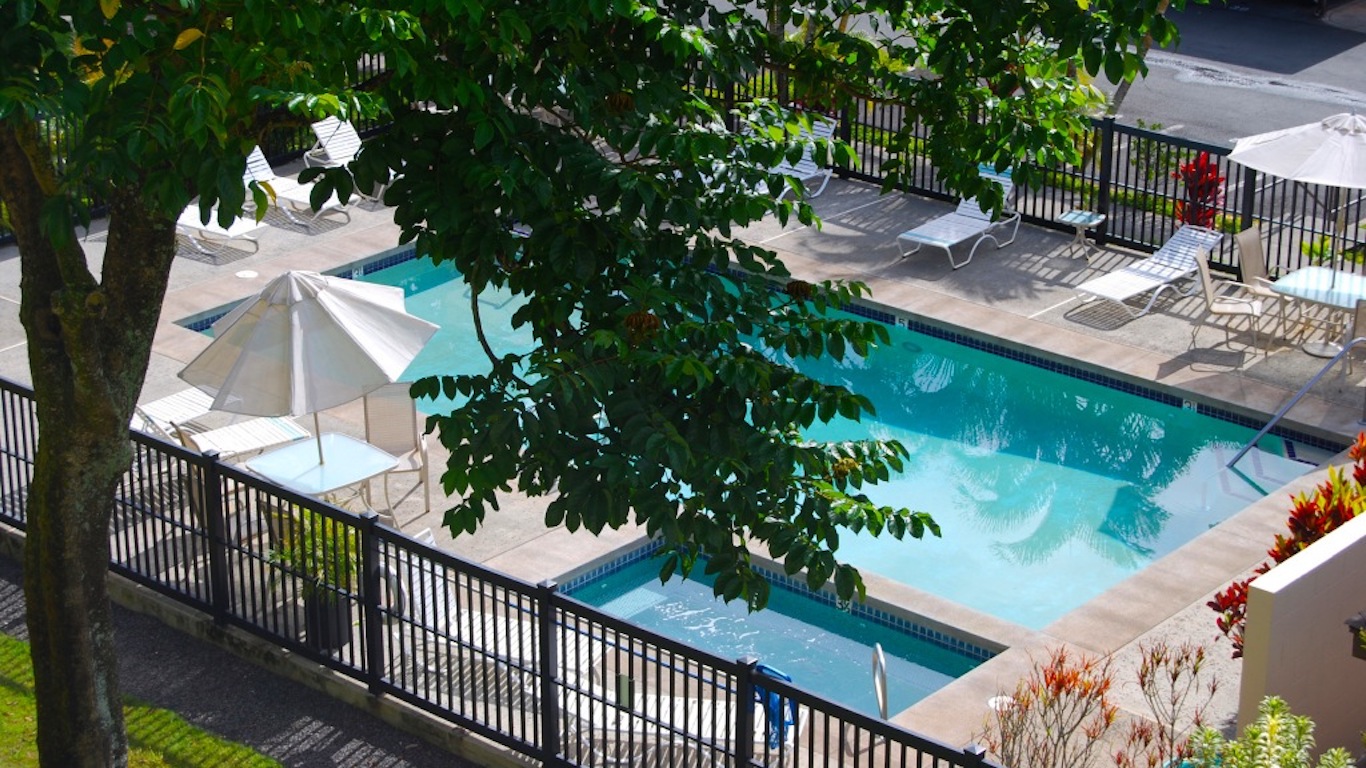
5. Mililani Town, Hawaii
> Pct. of residents who moved into current home before 1990: 35.4%
> Pct. of residents who moved into current home before 1980: 17.2%
> Pct. of houses & apartments built 1990 or later: 6.7%
> Median home value: $590,900
> Pct. housing units owner-occupied: 74.0%
[in-text-ad]
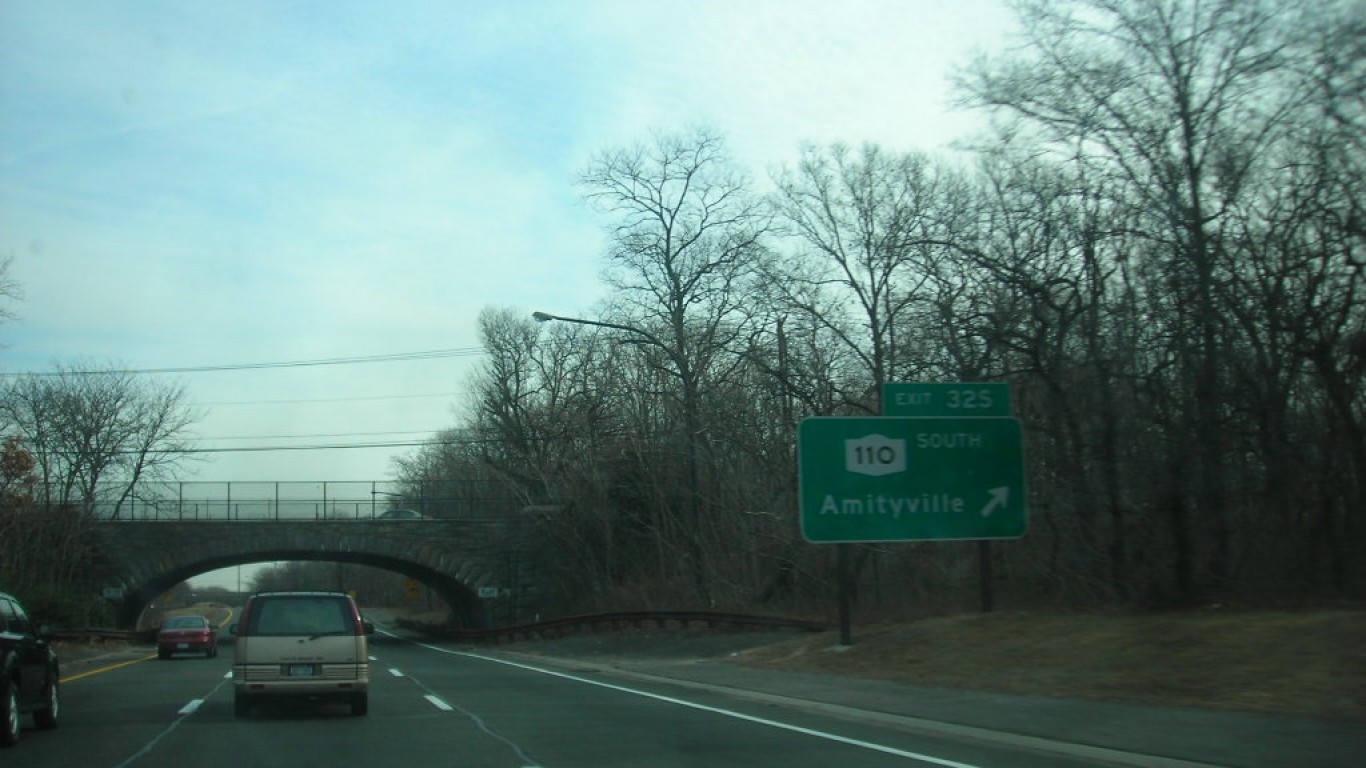
4. West Islip, New York
> Pct. of residents who moved into current home before 1990: 35.6%
> Pct. of residents who moved into current home before 1980: 20.5%
> Pct. of houses & apartments built 1990 or later: 4.7%
> Median home value: $407,300
> Pct. housing units owner-occupied: 94.6%
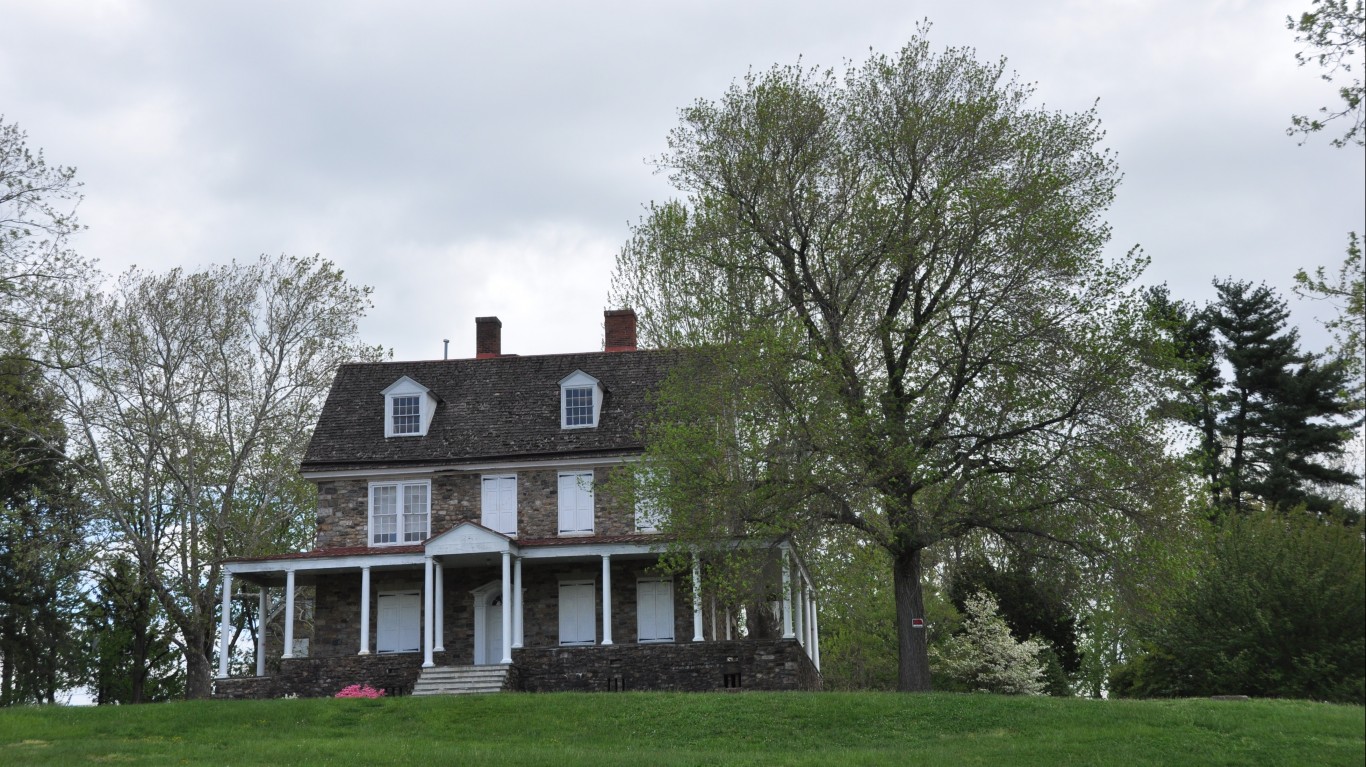
3. Levittown, Pennsylvania
> Pct. of residents who moved into current home before 1990: 35.8%
> Pct. of residents who moved into current home before 1980: 21.7%
> Pct. of houses & apartments built 1990 or later: 3.5%
> Median home value: $221,900
> Pct. housing units owner-occupied: 83.7%
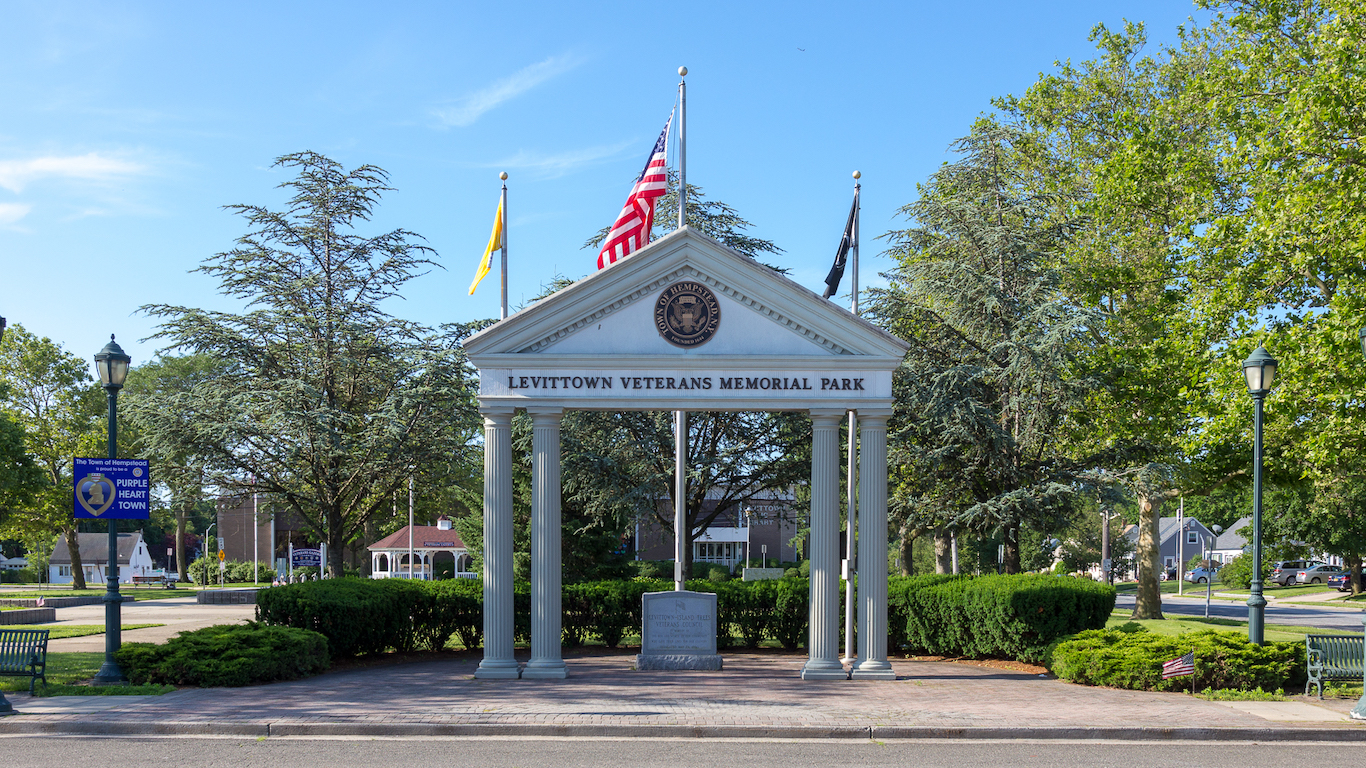
2. Levittown, New York
> Pct. of residents who moved into current home before 1990: 38.3%
> Pct. of residents who moved into current home before 1980: 24.6%
> Pct. of houses & apartments built 1990 or later: 1.3%
> Median home value: $367,700
> Pct. housing units owner-occupied: 92.3%
[in-text-ad-2]
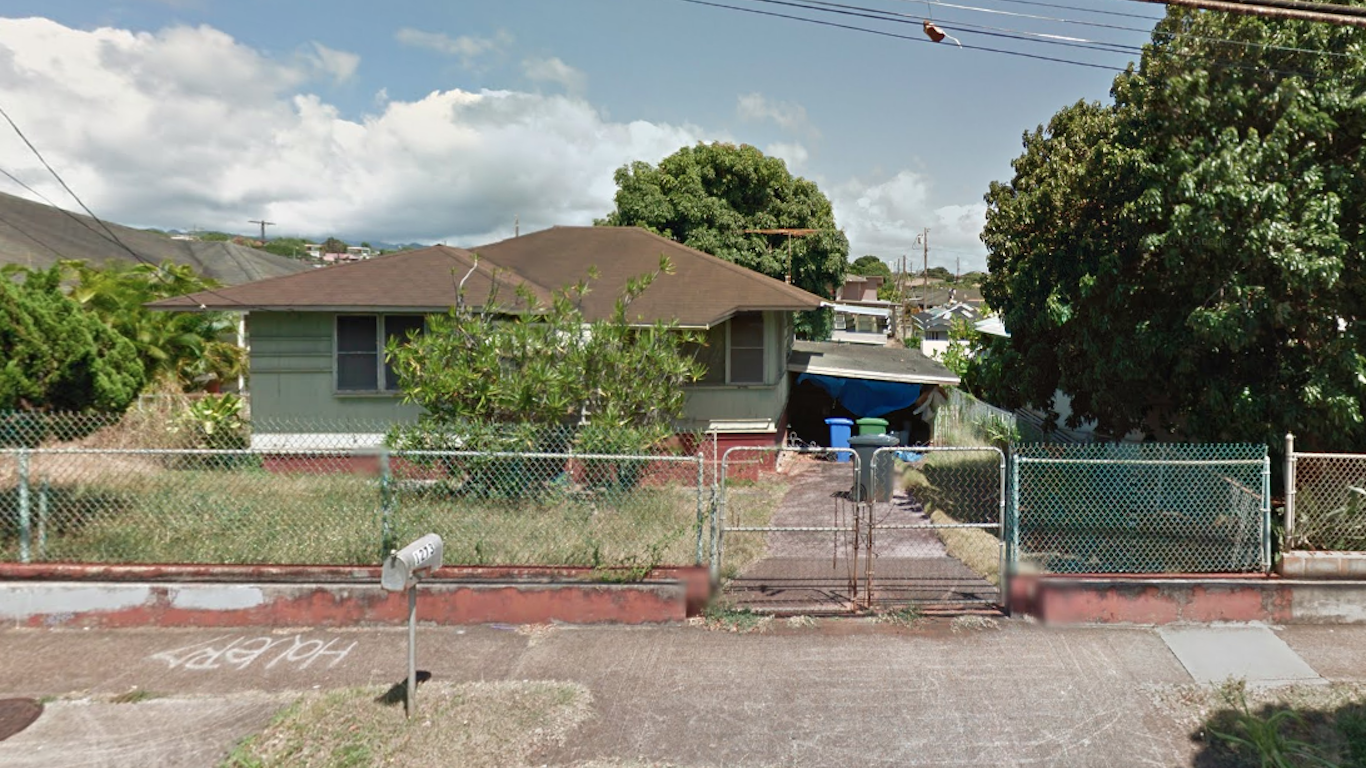
1. Pearl City, Hawaii
> Pct. of residents who moved into current home before 1990: 42.4%
> Pct. of residents who moved into current home before 1980: 29.3%
> Pct. of houses & apartments built 1990 or later: 11.3%
> Median home value: $626,300
> Pct. housing units owner-occupied: 70.3%
If you missed out on NVIDIA’s historic run, your chance to see life-changing profits from AI isn’t over.
The 24/7 Wall Street Analyst who first called NVIDIA’s AI-fueled rise in 2009 just published a brand-new research report named “The Next NVIDIA.”
Click here to download your FREE copy.
Thank you for reading! Have some feedback for us?
Contact the 24/7 Wall St. editorial team.