
The prospect of an income tax audit by the Internal Revenue Service is a daunting one. The IRS audits about 1.1 million tax returns each year. To minimize the likelihood of a mistake — and reduce the risk of an audit — an estimated 60% of U.S. taxpayers sought professional help to fill out their 1040 form in 2017.
Fortunately, the likelihood of being audited by the IRS is very low. Each year, there are only about 7.7 audits for every 1,000 returns. Audit rates are not even across the country, however. Depending on the state, audit rates range from as low as 6.9 per 1,000 in New Hampshire to as high as 8.9 per 1,000 in Mississippi. Rates vary even more at the city level, and in most states, there is at least one metro area where taxpayers are more likely than the typical taxpayer nationwide to be targeted by the IRS.
Using data on tax returns and audits compiled by tax analysis website Tax Notes, 24/7 Wall St. reviewed audit rates in 382 metropolitan areas to identify the most audited city in each state. It is important to note that four states — Delaware, New Hampshire, Rhode Island, and Vermont — have only one metro area, and as a result, the city listed is the most audited by default.
Many might assume that wealthier Americans are more likely to be audited than low-income Americans. Afterall, higher incomes mean greater revenue for the IRS and perhaps higher potential of errors on 1040 forms. The opposite, however, appears to be true. Poverty is more common in 37 of the 50 cities on this list than it is across the respective state as a whole. In many of the cities on this list, poverty is a bigger problem than it is anywhere else in the state. Here is a full list of the cities hit hardest by extreme poverty in by state.
This is no coincidence. Many low-income households claim the earned income tax credit, or EITC, a program designed to ease financial hardship for the working poor. According to a 2018 report released by ProPublica, a nonprofit investigative publication, EITC recipients are disproportionately targeted for audit to better ensure no one is unfairly taking advantage of the system. Further reinforcing evidence of the trend, only 13 cities on this list have a higher median annual household income than the median nationwide of $57,652.
Ultimately, which tax return is selected for audit is up the IRS. However, there are measures taxpayers can take to minimize errors and reduce the risk of raising potential red flags. These are the 19 most common tax mistakes and how to avoid them.
Click here to see the most audited city in every state
Click here to read our methodology

1. Alabama: Mobile
> Audits per 1,000 tax returns: 8.69 (state: 8.20)
> Median household income: $45,802 (state: $46,472)
> Poverty rate: 19.3% (state: 18.0%)
> Adults with a bachelor’s degree: 23.0% (state: 24.5%)
See all stories featuring: Alabama
[in-text-ad]

2. Alaska: Anchorage
> Audits per 1,000 tax returns: 6.99 (state: 7.02)
> Median household income: $80,724 (state: $76,114)
> Poverty rate: 8.5% (state: 10.2%)
> Adults with a bachelor’s degree: 31.0% (state: 29.0%)
See all stories featuring: Alaska
 24/7 Wall St.
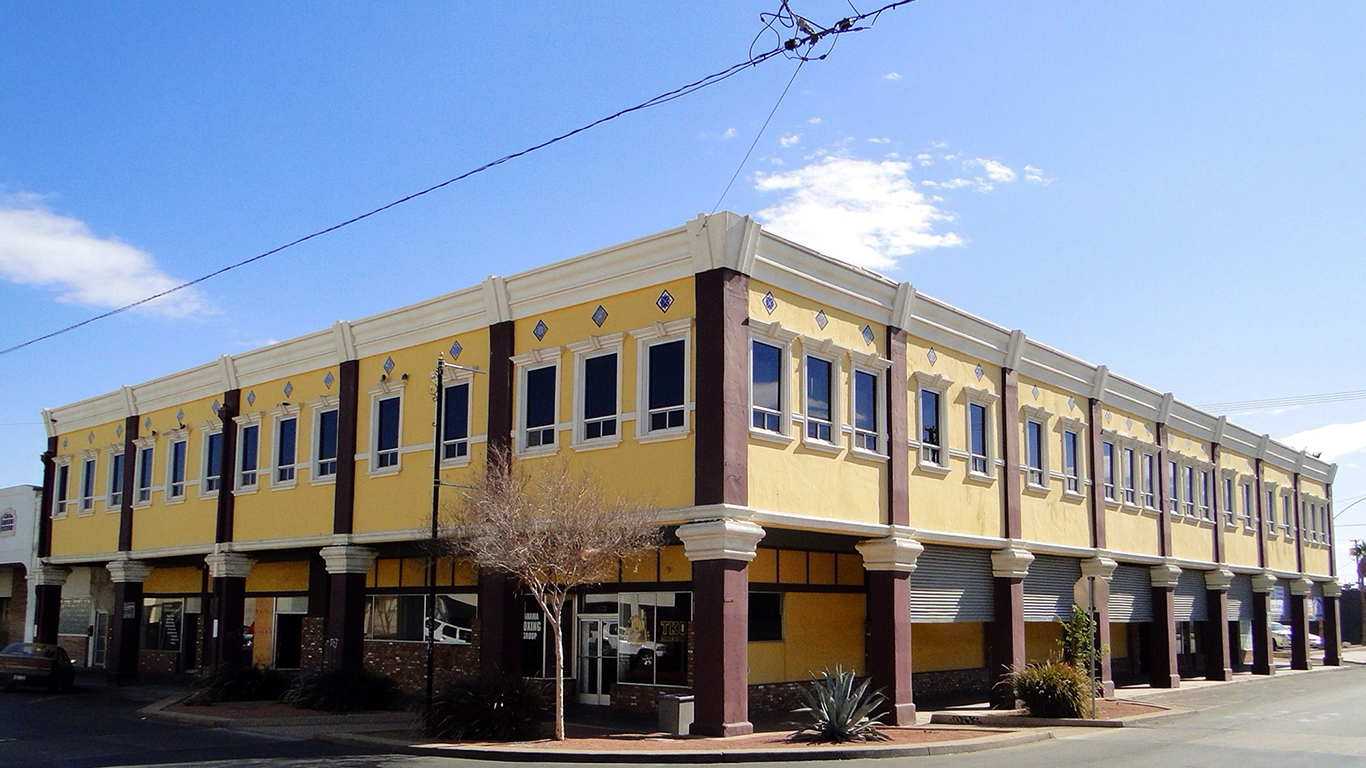
3. Arizona: Yuma
> Audits per 1,000 tax returns: 9.25 (state: 7.87)
> Median household income: $43,253 (state: $53,510)
> Poverty rate: 19.7% (state: 17.0%)
> Adults with a bachelor’s degree: 14.3% (state: 28.4%)
See all stories featuring: Arizona

4. Arkansas: Pine Bluff
> Audits per 1,000 tax returns: 8.75 (state: 8.16)
> Median household income: $38,547 (state: $43,813)
> Poverty rate: 23.4% (state: 18.1%)
> Adults with a bachelor’s degree: 15.4% (state: 22.0%)
See all stories featuring: Arkansas
[in-text-ad-2]
5. California: El Centro
> Audits per 1,000 tax returns: 9.71 (state: 7.96)
> Median household income: $44,779 (state: $67,169)
> Poverty rate: 23.8% (state: 15.1%)
> Adults with a bachelor’s degree: 14.3% (state: 32.6%)
See all stories featuring: California

6. Colorado: Pueblo
> Audits per 1,000 tax returns: 7.76 (state: 7.36)
> Median household income: $42,386 (state: $65,458)
> Poverty rate: 19.8% (state: 11.5%)
> Adults with a bachelor’s degree: 21.7% (state: 39.4%)
See all stories featuring: Colorado
[in-text-ad]

7. Connecticut: Bridgeport-Stamford-Norwalk
> Audits per 1,000 tax returns: 8.17 (state: 7.39)
> Median household income: $89,773 (state: $73,781)
> Poverty rate: 8.8% (state: 10.1%)
> Adults with a bachelor’s degree: 46.5% (state: 38.4%)
See all stories featuring: Connecticut

8. Delaware: Dover
> Audits per 1,000 tax returns: 7.37 (state: 7.31)
> Median household income: $57,647 (state: $63,036)
> Poverty rate: 13.0% (state: 12.1%)
> Adults with a bachelor’s degree: 23.5% (state: 31.0%)
See all stories featuring: Delaware

9. Florida: Miami-Fort Lauderdale-West Palm Beach
> Audits per 1,000 tax returns: 8.74 (state: 8.21)
> Median household income: $51,758 (state: $50,883)
> Poverty rate: 16.1% (state: 15.5%)
> Adults with a bachelor’s degree: 30.6% (state: 28.5%)
See all stories featuring: Florida
[in-text-ad-2]

10. Georgia: Albany
> Audits per 1,000 tax returns: 9.39 (state: 8.40)
> Median household income: $40,612 (state: $52,977)
> Poverty rate: 25.7% (state: 16.9%)
> Adults with a bachelor’s degree: 19.5% (state: 29.9%)
See all stories featuring: Georgia

11. Hawaii: Kahului-Wailuku-Lahaina
> Audits per 1,000 tax returns: 7.60 (state: 7.39)
> Median household income: $72,743 (state: $74,923)
> Poverty rate: 10.0% (state: 10.3%)
> Adults with a bachelor’s degree: 26.3% (state: 32.0%)
See all stories featuring: Hawaii
[in-text-ad]

12. Idaho: Idaho Falls
> Audits per 1,000 tax returns: 7.79 (state: 7.69)
> Median household income: $54,663 (state: $50,985)
> Poverty rate: 11.5% (state: 14.5%)
> Adults with a bachelor’s degree: 27.5% (state: 26.8%)
See all stories featuring: Idaho

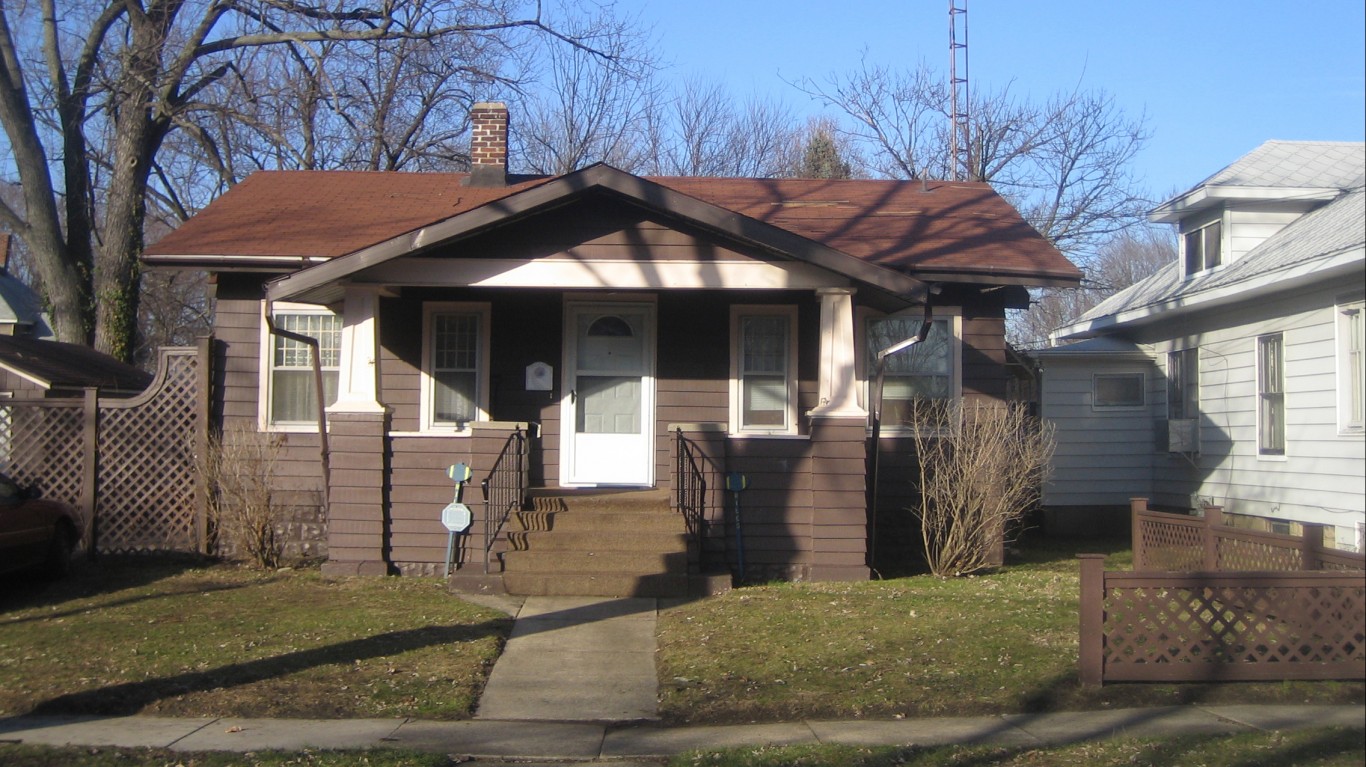
13. Illinois: Danville
> Audits per 1,000 tax returns: 7.67 (state: 7.49)
> Median household income: $44,930 (state: $61,229)
> Poverty rate: 19.8% (state: 13.5%)
> Adults with a bachelor’s degree: 14.6% (state: 33.4%)
See all stories featuring: Illinois

14. Indiana: South Bend-Mishawaka
> Audits per 1,000 tax returns: 7.52 (state: 7.31)
> Median household income: $48,681 (state: $52,182)
> Poverty rate: 16.5% (state: 14.6%)
> Adults with a bachelor’s degree: 26.7% (state: 25.3%)
See all stories featuring: Indiana
[in-text-ad-2]

15. Iowa: Sioux City
> Audits per 1,000 tax returns: 7.35 (state: 7.03)
> Median household income: $54,474 (state: $56,570)
> Poverty rate: 12.9% (state: 12.0%)
> Adults with a bachelor’s degree: 21.7% (state: 27.7%)
See all stories featuring: Iowa

16. Kansas: Wichita
> Audits per 1,000 tax returns: 7.33 (state: 7.30)
> Median household income: $53,953 (state: $55,477)
> Poverty rate: 13.9% (state: 12.8%)
> Adults with a bachelor’s degree: 30.0% (state: 32.3%)
See all stories featuring: Kansas
[in-text-ad]

17. Kentucky: Bowling Green
> Audits per 1,000 tax returns: 7.79 (state: 7.76)
> Median household income: $46,716 (state: $46,535)
> Poverty rate: 18.7% (state: 18.3%)
> Adults with a bachelor’s degree: 25.1% (state: 23.2%)
See all stories featuring: Kentucky

18. Louisiana: Monroe
> Audits per 1,000 tax returns: 8.92 (state: 8.39)
> Median household income: $39,904 (state: $46,710)
> Poverty rate: 24.2% (state: 19.6%)
> Adults with a bachelor’s degree: 22.8% (state: 23.4%)
See all stories featuring: Louisiana

19. Maine: Lewiston-Auburn
> Audits per 1,000 tax returns: 7.29 (state: 7.17)
> Median household income: $49,538 (state: $53,024)
> Poverty rate: 14.3% (state: 12.9%)
> Adults with a bachelor’s degree: 22.1% (state: 30.3%)
See all stories featuring: Maine
[in-text-ad-2]

20. Maryland: Salisbury
> Audits per 1,000 tax returns: 7.54 (state: 7.36)
> Median household income: $56,283 (state: $78,916)
> Poverty rate: 13.3% (state: 9.7%)
> Adults with a bachelor’s degree: 25.8% (state: 39.0%)
See all stories featuring: Maryland

21. Massachusetts: Boston-Cambridge-Newton
> Audits per 1,000 tax returns: 7.28 (state: 7.24)
> Median household income: $81,838 (state: $74,167)
> Poverty rate: 10.0% (state: 11.1%)
> Adults with a bachelor’s degree: 46.4% (state: 42.1%)
See all stories featuring: Massachusetts
[in-text-ad]
22. Michigan: Niles-Benton Harbor
> Audits per 1,000 tax returns: 7.73 (state: 7.40)
> Median household income: $47,132 (state: $52,668)
> Poverty rate: 17.2% (state: 15.6%)
> Adults with a bachelor’s degree: 26.7% (state: 28.1%)
See all stories featuring: Michigan

23. Minnesota: Minneapolis-St. Paul-Bloomington
> Audits per 1,000 tax returns: 7.01 (state: 6.99)
> Median household income: $73,735 (state: $65,699)
> Poverty rate: 9.4% (state: 10.5%)
> Adults with a bachelor’s degree: 40.5% (state: 34.8%)
See all stories featuring: Minnesota

24. Mississippi: Jackson
> Audits per 1,000 tax returns: 8.76 (state: 8.86)
> Median household income: $49,381 (state: $42,009)
> Poverty rate: 18.5% (state: 21.5%)
> Adults with a bachelor’s degree: 29.7% (state: 21.3%)
See all stories featuring: Mississippi
[in-text-ad-2]

25. Missouri: Joplin
> Audits per 1,000 tax returns: 7.93 (state: 7.57)
> Median household income: $45,913 (state: $51,542)
> Poverty rate: 15.9% (state: 14.6%)
> Adults with a bachelor’s degree: 21.6% (state: 28.2%)
See all stories featuring: Missouri

26. Montana: Missoula
> Audits per 1,000 tax returns: 7.32 (state: 7.43)
> Median household income: $49,412 (state: $50,801)
> Poverty rate: 15.9% (state: 14.4%)
> Adults with a bachelor’s degree: 42.6% (state: 30.7%)
See all stories featuring: Montana
[in-text-ad]

27. Nebraska: Grand Island
> Audits per 1,000 tax returns: 7.48 (state: 7.16)
> Median household income: $54,479 (state: $56,675)
> Poverty rate: 12.3% (state: 12.0%)
> Adults with a bachelor’s degree: 20.3% (state: 30.6%)
See all stories featuring: Nebraska
 24/7 Wall St.
28. Nevada: Las Vegas-Henderson-Paradise
> Audits per 1,000 tax returns: 7.73 (state: 7.64)
> Median household income: $54,882 (state: $55,434)
> Poverty rate: 14.6% (state: 14.2%)
> Adults with a bachelor’s degree: 23.3% (state: 23.7%)
See all stories featuring: Nevada

29. New Hampshire: Manchester-Nashua
> Audits per 1,000 tax returns: 6.91 (state: 6.91)
> Median household income: $75,777 (state: $71,305)
> Poverty rate: 8.6% (state: 8.1%)
> Adults with a bachelor’s degree: 36.5% (state: 36.0%)
See all stories featuring: New Hampshire
[in-text-ad-2]

30. New Jersey: Trenton
> Audits per 1,000 tax returns: 7.65 (state: 7.52)
> Median household income: $77,027 (state: $76,475)
> Poverty rate: 11.3% (state: 10.7%)
> Adults with a bachelor’s degree: 41.5% (state: 38.1%)
See all stories featuring: New Jersey

31. New Mexico: Las Cruces
> Audits per 1,000 tax returns: 8.66 (state: 8.13)
> Median household income: $39,114 (state: $46,718)
> Poverty rate: 27.9% (state: 20.6%)
> Adults with a bachelor’s degree: 27.4% (state: 26.9%)
See all stories featuring: New Mexico
[in-text-ad]

32. New York: New York-Newark-Jersey City
> Audits per 1,000 tax returns: 7.97 (state: 7.82)
> Median household income: $72,205 (state: $62,765)
> Poverty rate: 13.8% (state: 15.1%)
> Adults with a bachelor’s degree: 38.7% (state: 35.3%)
See all stories featuring: New York
 24/7 Wall St.
33. North Carolina: Rocky Mount
> Audits per 1,000 tax returns: 8.63 (state: 7.87)
> Median household income: $41,593 (state: $50,320)
> Poverty rate: 19.1% (state: 16.1%)
> Adults with a bachelor’s degree: 17.2% (state: 29.9%)
See all stories featuring: North Carolina

34. North Dakota: Grand Forks
> Audits per 1,000 tax returns: 6.81 (state: 6.98)
> Median household income: $52,377 (state: $61,285)
> Poverty rate: 15.5% (state: 11.0%)
> Adults with a bachelor’s degree: 30.8% (state: 28.9%)
See all stories featuring: North Dakota
[in-text-ad-2]

35. Ohio: Toledo
> Audits per 1,000 tax returns: 7.33 (state: 7.23)
> Median household income: $48,284 (state: $52,407)
> Poverty rate: 17.8% (state: 14.9%)
> Adults with a bachelor’s degree: 26.4% (state: 27.2%)
See all stories featuring: Ohio

36. Oklahoma: Lawton
> Audits per 1,000 tax returns: 7.95 (state: 7.82)
> Median household income: $49,608 (state: $49,767)
> Poverty rate: 16.6% (state: 16.2%)
> Adults with a bachelor’s degree: 21.5% (state: 24.8%)
See all stories featuring: Oklahoma
[in-text-ad]

37. Oregon: Grants Pass
> Audits per 1,000 tax returns: 7.95 (state: 7.35)
> Median household income: $40,705 (state: $56,119)
> Poverty rate: 18.6% (state: 14.9%)
> Adults with a bachelor’s degree: 17.6% (state: 32.3%)
See all stories featuring: Oregon

38. Pennsylvania: Philadelphia-Camden-Wilmington
> Audits per 1,000 tax returns: 7.51 (state: 7.19)
> Median household income: $66,285 (state: $56,951)
> Poverty rate: 13.1% (state: 13.1%)
> Adults with a bachelor’s degree: 36.2% (state: 30.1%)
See all stories featuring: Pennsylvania

39. Rhode Island: Providence-Warwick
> Audits per 1,000 tax returns: 7.16 (state: 7.26)
> Median household income: $61,536 (state: $61,043)
> Poverty rate: 13.0% (state: 13.4%)
> Adults with a bachelor’s degree: 31.0% (state: 33.0%)
See all stories featuring: Rhode Island
[in-text-ad-2]
40. South Carolina: Florence
> Audits per 1,000 tax returns: 8.71 (state: 8.02)
> Median household income: $40,888 (state: $48,781)
> Poverty rate: 20.6% (state: 16.6%)
> Adults with a bachelor’s degree: 21.0% (state: 27.0%)
See all stories featuring: South Carolina

41. South Dakota: Rapid City
> Audits per 1,000 tax returns: 7.27 (state: 7.34)
> Median household income: $52,683 (state: $54,126)
> Poverty rate: 13.0% (state: 13.9%)
> Adults with a bachelor’s degree: 28.3% (state: 27.8%)
See all stories featuring: South Dakota
[in-text-ad]

42. Tennessee: Memphis
> Audits per 1,000 tax returns: 8.63 (state: 7.92)
> Median household income: $50,194 (state: $48,708)
> Poverty rate: 18.9% (state: 16.7%)
> Adults with a bachelor’s degree: 27.2% (state: 26.1%)
See all stories featuring: Tennessee

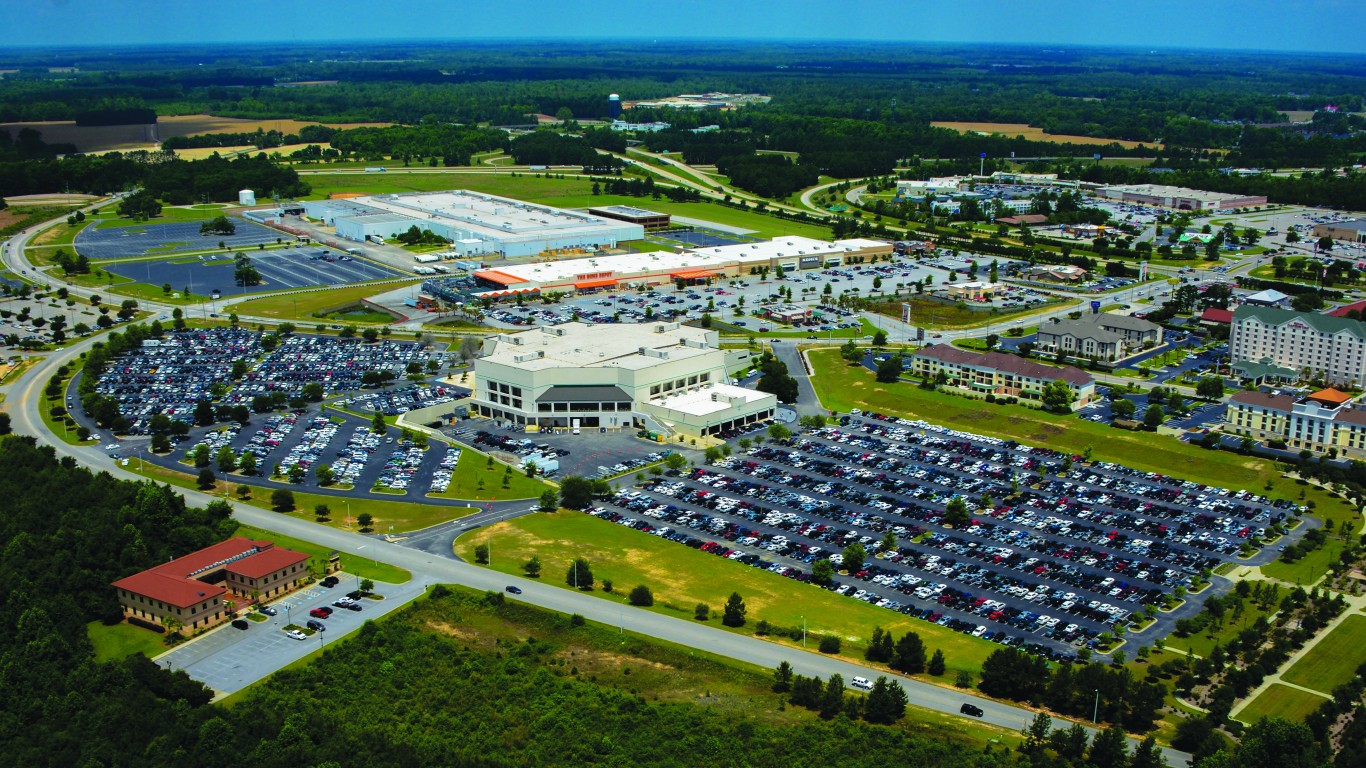
43. Texas: McAllen-Edinburg-Mission
> Audits per 1,000 tax returns: 9.86 (state: 8.13)
> Median household income: $37,097 (state: $57,051)
> Poverty rate: 31.8% (state: 16.0%)
> Adults with a bachelor’s degree: 17.8% (state: 28.7%)
See all stories featuring: Texas

44. Utah: St. George
> Audits per 1,000 tax returns: 7.69 (state: 7.24)
> Median household income: $55,175 (state: $65,325)
> Poverty rate: 14.2% (state: 11.0%)
> Adults with a bachelor’s degree: 28.1% (state: 32.5%)
See all stories featuring: Utah
[in-text-ad-2]

45. Vermont: Burlington-South Burlington
> Audits per 1,000 tax returns: 6.81 (state: 7.10)
> Median household income: $65,476 (state: $57,808)
> Poverty rate: 10.4% (state: 11.4%)
> Adults with a bachelor’s degree: 43.4% (state: 36.8%)
See all stories featuring: Vermont

46. Virginia: Virginia Beach-Norfolk-Newport News
> Audits per 1,000 tax returns: 7.53 (state: 7.55)
> Median household income: $61,889 (state: $68,766)
> Poverty rate: 12.2% (state: 11.2%)
> Adults with a bachelor’s degree: 30.8% (state: 37.6%)
See all stories featuring: Virginia
[in-text-ad]

47. Washington: Yakima
> Audits per 1,000 tax returns: 7.92 (state: 7.23)
> Median household income: $47,470 (state: $66,174)
> Poverty rate: 19.0% (state: 12.2%)
> Adults with a bachelor’s degree: 15.9% (state: 34.5%)
See all stories featuring: Washington

48. West Virginia: Beckley
> Audits per 1,000 tax returns: 7.63 (state: 7.44)
> Median household income: $41,141 (state: $44,061)
> Poverty rate: 18.5% (state: 17.8%)
> Adults with a bachelor’s degree: 17.1% (state: 19.9%)
See all stories featuring: West Virginia

49. Wisconsin: Milwaukee-Waukesha-West Allis
> Audits per 1,000 tax returns: 7.20 (state: 6.93)
> Median household income: $57,531 (state: $56,759)
> Poverty rate: 14.5% (state: 12.3%)
> Adults with a bachelor’s degree: 34.5% (state: 29.0%)
See all stories featuring: Wisconsin
[in-text-ad-2]
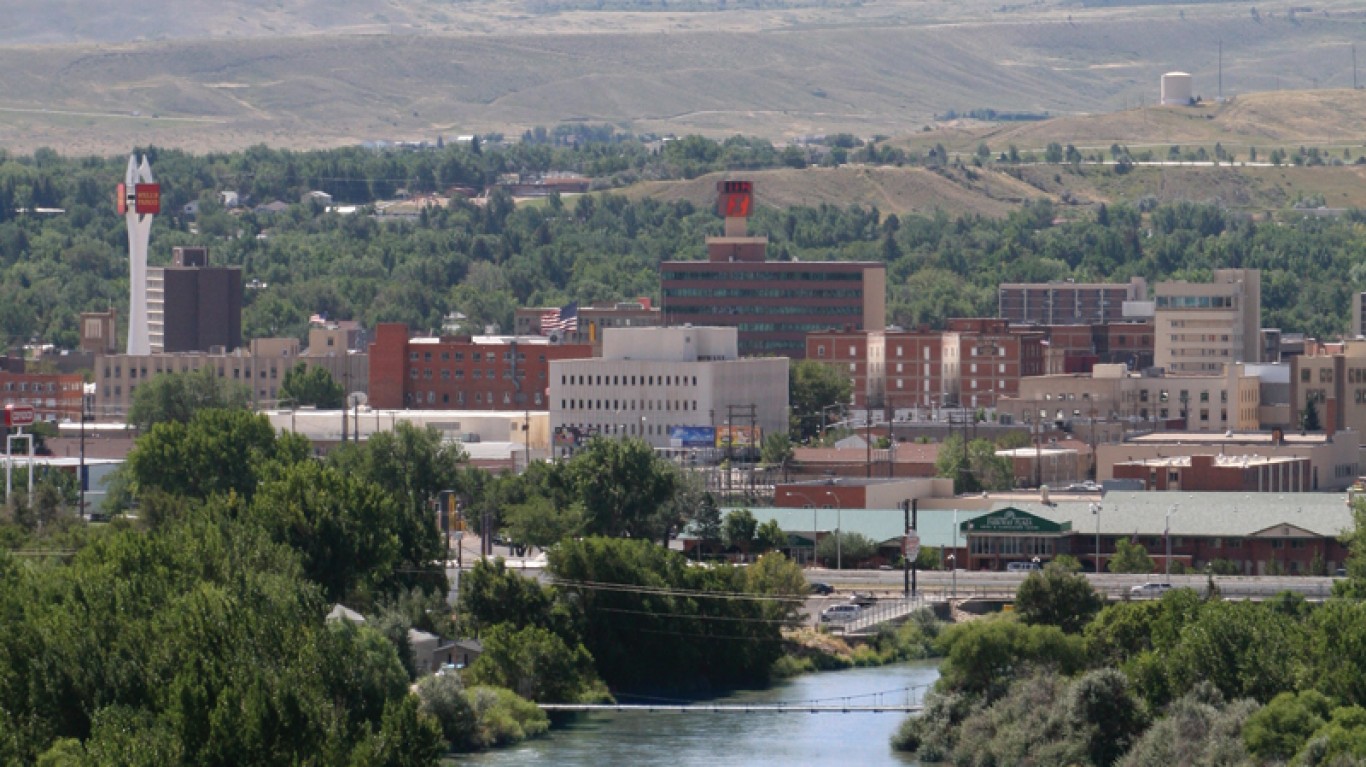
50. Wyoming: Casper
> Audits per 1,000 tax returns: 7.15 (state: 7.14)
> Median household income: $59,400 (state: $60,938)
> Poverty rate: 9.9% (state: 11.1%)
> Adults with a bachelor’s degree: 22.8% (state: 26.7%)
See all stories featuring: Wyoming
Methodology
To identify the city in each state where you are most likely to be audited, 24/7 Wall St. analyzed data on tax returns and audits, originally compiled by Tax Notes, on the metropolitan statistical area (MSA) level. Weighted averages for audit rates were calculated using American Community Survey (ACS) 2017 5-Year Estimates for population on a county level.
Median household income, poverty rates, and educational attainment by MSA and state also came from the ACS.
100 Million Americans Are Missing This Crucial Retirement Tool
The thought of burdening your family with a financial disaster is most Americans’ nightmare. However, recent studies show that over 100 million Americans still don’t have proper life insurance in the event they pass away.
Life insurance can bring peace of mind – ensuring your loved ones are safeguarded against unforeseen expenses and debts. With premiums often lower than expected and a variety of plans tailored to different life stages and health conditions, securing a policy is more accessible than ever.
A quick, no-obligation quote can provide valuable insight into what’s available and what might best suit your family’s needs. Life insurance is a simple step you can take today to help secure peace of mind for your loved ones tomorrow.
Click here to learn how to get a quote in just a few minutes.
Thank you for reading! Have some feedback for us?
Contact the 24/7 Wall St. editorial team.
Latest from 24/7


Our expert who first called NVIDIA in 2009 is predicting 2025 will see a historic AI breakthrough.
You can follow him investing $500,000 of his own money on our top AI stocks for free.